Capillary and Viscous Fracturing During Drainage in Porous Media
Abstract
Detailed understanding of the couplings between fluid flow and solid deformation in porous media is crucial for the development of novel technologies relating to a wide range of geological and biological processes. A particularly challenging phenomenon that emerges from these couplings is the transition from fluid invasion to fracturing during multiphase flow. Previous studies have shown that this transition is highly sensitive to fluid flow rate, capillarity, and the structural properties of the porous medium. However, a comprehensive characterization of the relevant fluid flow and material failure regimes does not exist. Here, we used our newly developed Multiphase Darcy-Brinkman-Biot framework to examine the transition from drainage to material failure during viscously-stable multiphase flow in soft porous media in a broad range of flow, wettability, and solid rheology conditions. We demonstrate the existence of three distinct material failure regimes controlled by non-dimensional numbers that quantify the balance of viscous, capillary, and structural forces in the porous medium.
I Introduction
Multiphase flow in deformable porous media is a ubiquitous phenomenon in natural and engineered systems that underlies key processes in water and energy resource engineering and materials science, including membrane filtration, soil wetting/drying, unconventional hydrocarbon recovery, and geologic carbon sequestration [1, 2, 3]. A key obstacle to more accurate representations of this phenomenon is our limited understanding of the transition from fluid invasion to flow-induced fracturing, i.e., material failure caused by multiphase flow. In large part, this limitation is caused by a lack of computational approaches capable of representing multiphase flow in fractured deformable porous media.
Previous work on multiphase flow within static porous media is extensive and includes detailed examinations of the influence of wettability, viscosity, and flow rate on flow in unsaturated porous media at multiple scales. In particular, existing studies have demonstrated how capillary forces give rise to differences between drainage and imbibition [4]; how the ratio of fluid viscosities controls the stability of the invading fluid front [5, 6, 7]; and how the magnitude of the capillary number delineates distinct flow regimes [8, 9]. Each of the aforementioned controls is highly dependent on the system of interest. This complicates efforts to develop general relative permeability and capillary pressure models that apply to most systems of interest [10, 11, 12, 13].
Flow of a single fluid phase through deformable porous media also has been studied in depth. Numerical modeling studies are largely based on the work of Biot and Terzaghi [14, 15] and have been used to reproduce the behavior of arteries, boreholes, swelling clays, and gels [16, 17, 18, 19]. In the last decade, fundamental studies have generated detailed information on the dynamics that arise from fluid-solid couplings beyond the ideal poroelastic regime, including fracturing, granular fingering, and frictional fingering [20, 21, 22]. In particular, these studies have shown that the main parameters controlling the deformation of a porous solid by single phase flow are the material softness and the magnitude of the fluid-solid momentum transfer [21].
The study of multiphase flow in a deformable porous medium is inherently more complex than the problems outlined above, as it requires simultaneous consideration of capillarity, wetting dynamics, fluid rheology, and solid deformation. Deformation modes associated with material failure (i.e., multiphase fracturing) are particularly challenging as they require simultaneous representation of multiphase flow in fractures and in the surrounding porous matrix. The existing detailed examinations of this phenomenon have focused exclusively on granular systems. Notably, Holtzman & Juanes [23, 24] used experiments and discrete element models to demonstrate that the transitions between capillary fingering, viscous fingering, and fracturing during multiphase flow in granular media reflect two non-dimensional numbers: a fracturing number (ratio of fluid driving force to solid cohesive force) and a modified capillary number (the ratio between viscous and capillary pressure drops). Other discrete element approaches have shown that fracturing is highly dependent on the invading fluid’s capillary entry pressure [25, 26]. However, it is not clear how these conclusions translate to continuous non-granular systems.
To the best of our knowledge, no experimental or numerical investigation has simultaneously explored the effects of flow rate, wettability, and deformability during multiphase flow in deformable porous media at the continuum scale and identified the controlling parameters that relate all three properties within a single phase diagram. Here, we use simulations carried out with our new Multiphase Darcy-Brinkman-Biot (DBB) framework [27] to fill this knowledge gap and identify non-dimensional parameters that govern viscously-stable fluid drainage and fracturing in deformable porous media. We also find that the fracturing dynamics predicted by our continuum-scale framework is consistent with those observed or predicted for granular systems. In other words, in systems with a large length scale separation between pores and fractures, volume-averaged properties are sufficient to capture the onset and propagation of fractures at the continuum scale.
II Modeling Framework
Our investigation is carried out through the use of the Multiphase DBB modeling framework, a new and flexible model used to simulate incompressible two-phase flow through and around deformable porous media [27]. It consists of five volume averaged fluid and solid conservation equations that are coupled by spatially-dependent momentum exchange and capillary force terms. The model is composed of a fluid mass conservation equation,
| (1) |
a fluid saturation conservation equation,
| (2) |
a fluid momentum conservation equation,
| (3) |
a solid mass conservation equation,
| (4) |
and a solid momentum conservation equation,
| (5) |
In the previous equations, is the fluid volume fraction, is the solid volume fraction, is the wetting fluid saturation, is the non-wetting fluid saturation, is the single-field fluid velocity, is the solid velocity, is the relative velocity of the two immiscible fluids, is the single-field fluid pressure, is the volume averaged fluid viscous stress tensor, is the volume averaged solid stress tensor, is the drag coefficient (a function of permeability and single-field fluid viscosity ), is the solid density, is gravity, is the capillary pressure, and represents additional capillary terms. Here, “single-field” refers to averaged variables that depend on the properties of both fluids. Lastly, and are the single-field fluid density and viscosity. The closed form representations for , , and can be found in the Supplemental Materials along with an in-depth description of the model.
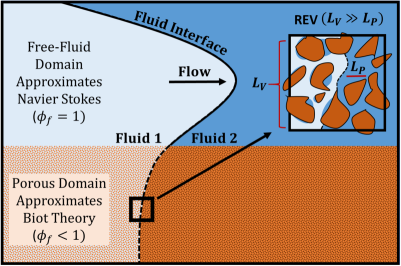
As indicated in Fig. 1, the system of equations presented above asymptotically approaches the Navier-Stokes multiphase volume-of-fluid [28] equations in solid free regions (where , is very large, and viscous drag is negligible) and multiphase Biot Theory in porous regions (where , is small, , and drag dominates). This last point can be demonstrated by adding Eqs. 3 and 5 together within a porous domain, which results in the main governing equation used in Biot Theory [29, 30, 27]:
| (6) |
A thorough discussion, derivation, and validation of this model can be found in Carrillo & Bourg 2020 [27] and related publications [18, 31]. The two major limitation of the framework highlighted in these previous studies are as follows. First, there needs to be a clear length-scale separation between the averaging volume, the sub-REV heterogeneities, and the overall system [32]. This condition is sustained in most situations involving fractured porous materials, where fracture width is generally significantly larger than the pore width within the porous matrix, with the possible exception of microfractures. Second, closure of the system of equations necessitates the use of parametric models describing the average behaviour of the capillary pressure, permeability, and solid rheology within porous domains. As such, the accuracy of the overall model is inherently impacted by the limitations and assumptions of these parametric models. The complete numerical implementation of the solver, its validations, and the cases shown within this study can be found within the open-source simulation package “hybridBiotInterFoam” [33].
III Numerical Simulations
III.1 Crossover from Imbibition to Fracturing in a Hele-Shaw Cell
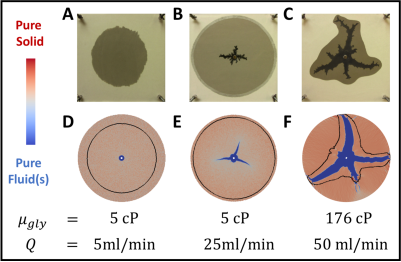
In addition to the derivation and extensive quantitative validation of Eqs. 1-5, our recent work [27] included a qualitative validation of the ability of the Multiphase DBB model to predict the transition from invasion to fracturing during multiphase flow. Briefly, this validation replicated experiments by Huang et. al. [34] involving the injection of aqueous glycerin into dry sand at incremental flow rates within a 30 by 30 by 2.5 cm Hele-Shaw cell. As shown in Fig. 2, these experiments are inherently multiphysics as fluid flow is governed by Stokes flow in the fracture (aperture cm) and by multiphase Biot Theory in the porous sand (pore width m). As discussed in our previous work, the similarities between our model and the experimental results are evident: as the viscous forces imposed on the solid increase, so does the system’s propensity to exhibit fracturing as the primary flow mechanism (as opposed to imbibition). Minor microstructural differences between our simulations and the experiments reflect the manner in which the implemented continuum-scale rheology model approximates the solid’s granular nature. It is clear, however, that both systems are controlled by the balance between viscous forces and solid rheology at the scale of interest [27]. As such, these experiments present an ideal starting point for our investigation.
III.2 Creation of Fracturing Phase Diagrams
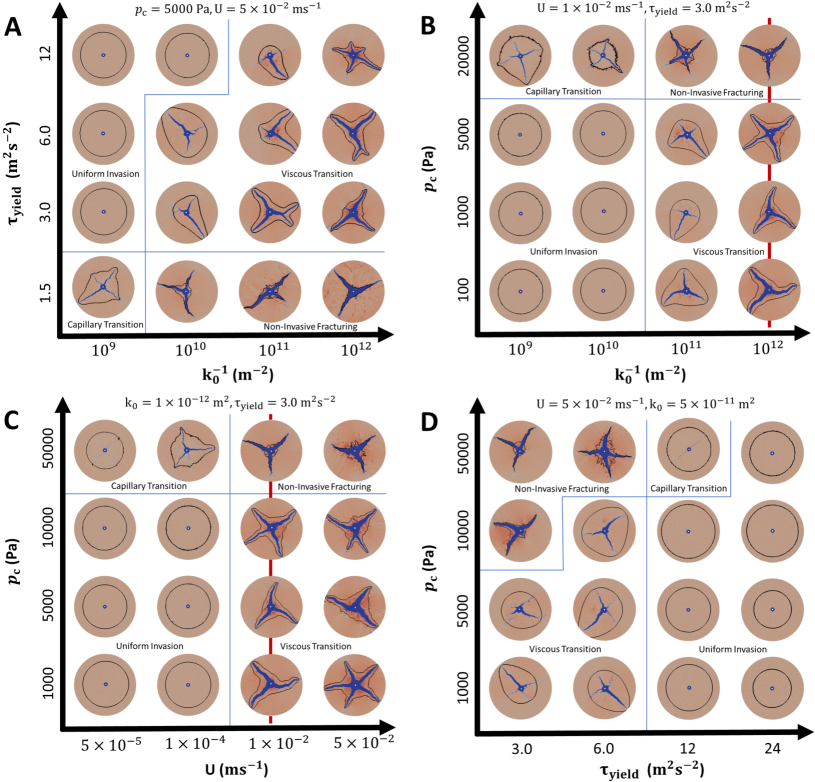
Here, we use the same simulation methodology developed in [27] and illustrated in Figure 2 to identify the general non-dimensional parameters that control the observed transitional behavior between invasion and fracturing in a plastic porous medium. To do so, we systematically vary the solid’s porosity ( = 0.4 to 0.8), density-normalized plastic yield stress ( = to ), capillary entry pressure ( = to ), and permeability ( = and ) as well as the invading fluid’s viscosity ( = to ) and injection rate ( = to ). As in our previous work, the solid’s porosity was initialized as a normally-distributed field, the deformable solid was modeled as a Hershel-Bulkley-Quemada plastic [35, 36], the porosity-dependence of permeability was modeled through the Kozeny-Carman relation, and relative permeabilities where calculated through the van-Genuchten model [13]. Further details regarding the base numerical implementation of this model can be found in [27], the accompanying code [33], and the Supplementary Materials. The only major differences relative to our previous simulations are that we now include capillary effects and represent viscously-stable drainage as opposed to imbibition (i.e., the injected glycerin is now non-wetting to the porous medium). A representative sample of the more than 400 resulting simulations is presented in the phase diagrams shown in Fig. 3.
Overall, the results make intuitive sense. Figure 3A shows that, ceteris-paribus, less permeable solids are more prone to fracturing. This is due to the fact that, given a constant flow rate, lower permeability solids experience greater drag forces. Our results also show that solids with lower plastic yield stresses fracture more readily, as their solid structure cannot withstand the effects of relatively large viscous or capillary forces. The y-axis behavior of Fig. 3B further shows that systems with higher entry pressures are more likely to fracture, i.e., the capillary stresses are more likely to overwhelm the solid’s yield stress, in agreement with grain scale simulations [25]. Finally, Fig. 3B also shows that higher injection rates lead to more fracturing, as these increase viscous drag on the solid structure.
IV Characterization of Fracturing Mechanisms
The deformation regimes observed in the previous experiments can be delineated by defining two simple non-dimensional parameters that quantify the balance between viscous pressure drop, solid softness, and capillary entry pressure.
| (7) |
| (8) |
Here, the viscous fracturing number () represents the ratio between the viscous pressure drop and the solid’s structural forces. It embodies the question: Does fluid flow generate sufficient friction to induce fracturing? As shown in Fig. 4, the answer is no if and yes if This number is the continuum scale analog to the fracturing number presented by Holtzman et. al. [24] for granular solids. It also explains the experimental finding by Zhou et. al. [37] that fracture initiation is only a function of the resulting fluid pressure drop, irrespective of the injection rate or fluid viscosity used to create it. Furthermore, it illustrates why increasing the injection rate and decreasing the permeability have similar effects in Fig. 3.
Complementarily, the capillary fracturing number () represents the ratio between the capillary entry pressure and the solid’s structural forces; it embodies the question: Does multiphase flow generate sufficient capillary stresses to fracture the solid? Figure 4 shows that when drainage is the preferential flow mechanism and when fracturing becomes the dominant phenomenon.
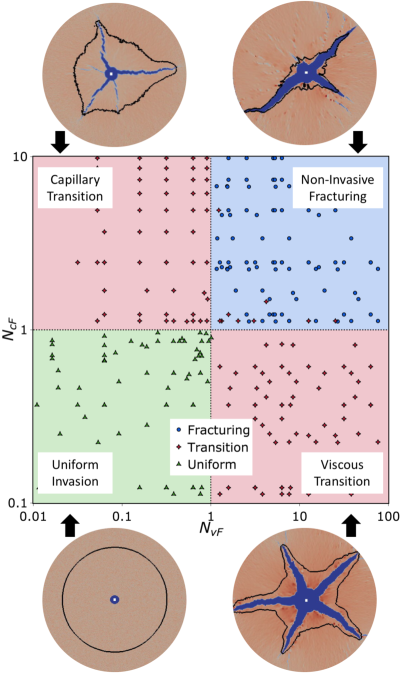
This analysis yields the rudimentary conclusion that fracturing should occur if either of the fracturing numbers is greater than unity, as confirmed by our simulations. However, our simulations further demonstrate the existence of three distinct fracturing regimes (Figs. 3-4). The first regime, referred here as non-invasive fracturing ( and ) is characterized by fracturing of the porous solid with minimal fluid invasion, where fractures precede any invasion front. In the second regime, referred to here as the viscous fracturing transition ( and ), only the viscous stresses are sufficiently large to fracture the solid. This leads to the formation of relatively wide fractures enveloped and preceded by a non-uniform invasion front. Finally, in the third regime, referred to here as the capillary fracturing transition ( and ), only the capillary stresses are sufficiently large to fracture the solid. Given a constant injection rate, this leads to the formation of fractures preceded by an invasion front, as in the viscous fracturing transition regime, but with a more uniform saturation front (due to lower viscous stresses) and less solid compaction (hence narrower fractures). We note that the crossover between each of the four regimes is continuous, meaning that systems with or can share elements of neighboring regimes.
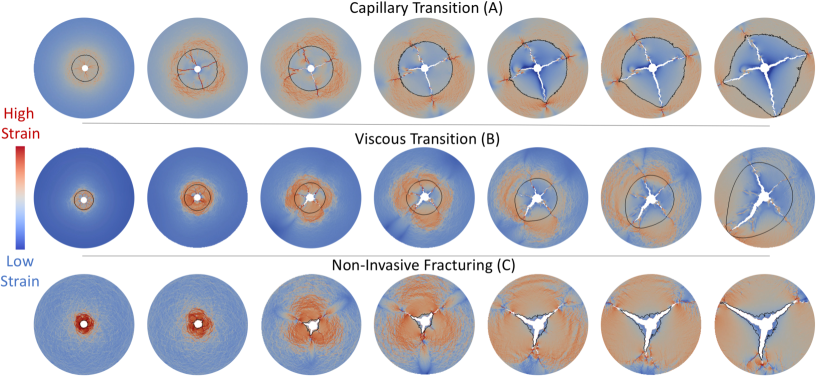
Although and are fairly intuitive numbers, their impacts on fracture propagation mechanisms are not. For this reason, we also studied the dynamics of fracture nucleation and growth and the evolution of the solid’s strain for all three fracturing regimes. As seen in Fig. 5, fracturing in the two transition zones is characterized by the initial formation of non-flow-bearing failure zones (hereafter referred to as cracks), which function as nucleation sites for propagating flow-bearing fractures. These cracks are formed by the simultaneous movement of large contiguous sections of the porous medium in different directions, a process induced by uniform fluid invasion into the porous medium. However, the similarities between both transition zones end here. In the viscous fracturing transition regime, fractures quickly become the dominant deformation mechanism, localizing the majority of the stresses and solid compaction around the advancing fracture tip. Conversely, in the capillary fracturing transition regime, fluid-invasion continues to serve as the main flow mechanism and source of deformation, where fractures and cracks are slowly expanded due to the more evenly-distributed capillarity-induced stresses localized at the advancing invasion front. Finally, non-invasive fracturing follows a different process, where there is little-to-no crack formation and fracture propagation is the main source of deformation and flow. Here, the co-advancing fracture and saturation fronts uniformly compress the solid around and in front of them until this deformation reaches the outer boundary of the simulated system (see the “jet” like-structures at fracture tips in Fig. 5C.) Pressure profiles that further showcase these behaviours can be found in the Supplementary Materials.
V Influence of Localized and Uniform Deformation
So far we have explored how independently changing , , and (among others) can affect the fracturing of plastic materials. However, our results also have implications for situations in which these variables are all varied simultaneously, such as during the compaction of soils, sediments, or viscoplastic sedimentary rocks (i.e. mudstones or clay-shales). In such situations, with increasing compaction, , , and should all increase, although at different rates. As such, we now study the effects of local and uniform deformation on the outlined fracturing regimes.
V.1 Localized Deformation
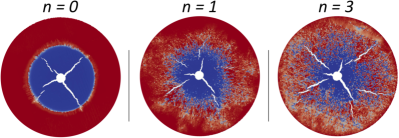
The simulations presented above were carried out using the simplifying assumption that is invariant with (whereas and are not). To evaluate the impact of this simplification on the results shown in Figs. 3-4, we carried out additional simulations for all four regimes with a deformation-dependent capillary entry pressure based on a simplified form of the Leverett J-function where , is the capillary pressure at , and is a sensitivity parameter [38, 39]. The results show that non-zero values of promote the creation of finger-like instabilities and the nucleation of cracks at the fluid invasion front, particularly in the capillary fracturing transition regime. Simulation predictions with different n values are shown in Fig. 6 in the capillary fracturing transition regime and in Supplemental Materials in other regimes.
Despite the additional complexity of the resulting fluid invasion and fracturing patterns, results with conform to the overall phase diagram presented in Fig. 4. The results at are therefore highlighted in the previous sections due to the greater simplicity of their fluid and solid distribution patterns.
V.2 Uniform Deformation
Having verified that the applicability of the fracturing numbers holds for systems were , , and all vary with , we now examine the effects of uniform compaction on said numbers. A direct analysis using the widely-used porosity-parameter relationships implemented above (the Kozeny-Carman relation for , Leverett J-Function for , and Quemada model for [38, 36, 35]) yields the following fracturing number - porosity dependence:
| (9) |
| (10) |
where is a rheological parameter based on the solid’s fractal dimension (common values range for 1.7-2.9 for different clayey sediments [35]) and is the maximum possible degree of compaction. Through these relations, we can see that uniform compaction (or expansion) has a highly non-linear effect on fracturing. Equations 9-10 indicate that whereas tends to consistently decrease with increasing compaction, is considerably more susceptible to changes in and exhibits multiple changes in the sign of its first derivative when , non-intuitively suggesting that fracturing can be either induced or suppressed through uniform compression. Plots of and as a function of solid fraction are reported in the Supplementary Materials.
VI Conclusions
In this article, we used the Multiphase DBB modeling framework to create a phase diagram that identifies two non-dimensional parameters that categorize the crossover between viscously-stable fluid drainage and fracturing as a function of wettability, solid deformability, and hydrodynamics. To the best of our knowledge, our results are the first to relate all three of these properties to characterize multiphase flow in viscoplastic porous media. As expected intuitively, we observe that fracturing occurs if the viscous and/or capillary stresses are sufficient to overcome the solid’s structural forces. Thus, when it comes to systems with multiple fluids, it is necessary to consider the effects of surface tension, wettability, and pore size on the fluids’ propensity to fracture or invade the permeable solid. Lastly, we find that the two non-dimensional fracturing numbers identified above delineate the existence of three fracturing regimes with distinct fracture propagation mechanisms.
Acknowledgements.
This work was supported by the National Science Foundation, Division of Earth Sciences, Early Career program through Award EAR-1752982. FJC acknowledges additional support from the Mary and Randall Hack ‘69 Fellowship of the High Meadows Environmental Institute at Princeton University.References
- Bächer and Gekle [2019] C. Bächer and S. Gekle, Computational modeling of active deformable membranes embedded in three-dimensional flows, Physical Review E 99, 062418 (2019).
- Räss et al. [2018] L. Räss, N. S. Simon, and Y. Y. Podladchikov, Spontaneous formation of fluid escape pipes from subsurface reservoirs, Scientific Reports 8, 11116 (2018).
- Towner [1987] G. D. Towner, The mechanics of cracking of drying clay, Journal of Agricultural Engineering Research 36, 115 (1987).
- Lenormand [1986] R. Lenormand, Pattern growth and fluid displacements through porous media, Physica A: Statistical Mechanics and its Applications 140, 114 (1986).
- Måløy et al. [1985] K. J. Måløy, J. Feder, and T. Jøssang, Viscous Fingering Fractals in Porous Media, Physical Review Letters 55, 2688 (1985).
- Saffman and Taylor [1958] P. G. Saffman and G. I. Taylor, The penetration of a fluid into a porous medium or Hele-Shaw cell containing a more viscous liquid, Proceedings of the Royal Society A 245, 312 (1958).
- Stokes et al. [1986] J. P. Stokes, D. A. Weitz, J. P. Gollub, A. Dougherty, M. O. Robbins, P. M. Chaikin, and H. M. Lindsay, Interfacial stability of immiscible displacement in a porous medium, Physical Review Letters 57, 1718 (1986).
- Ferer et al. [2004] M. Ferer, C. Ji, G. S. Bromhal, J. Cook, G. Ahmadi, and D. H. Smith, Crossover from capillary fingering to viscous fingering for immiscible unstable flow: Experiment and modeling, Physical Review E 70, 016303 (2004).
- Yortsos et al. [1997] Y. C. Yortsos, B. Xu, and D. Salin, Phase Diagram of Fully Developed Drainage in Porous Media, Physical Review Letters 79, 4581 (1997).
- Picchi and Battiato [2018] D. Picchi and I. Battiato, The Impact of Pore-Scale Flow Regimes on Upscaling of Immiscible Two-Phase Flow in Porous Media, Water Resources Research 54, 6683 (2018).
- Picchi and Battiato [2019] D. Picchi and I. Battiato, Relative Permeability Scaling From Pore-Scale Flow Regimes, Water Resources Research 55, 3215 (2019).
- Brooks and Corey [1964] R. H. Brooks and A. T. Corey, Hydraulic Properties of Porous Media, Hydrology Papers, Colorado State University 3, 37 pp (1964).
- van Genuchten [1980] M. T. van Genuchten, A Closed-form Equation for Predicting the Hydraulic Conductivity of Unsaturated Soils, Soil Science Society of America Journal 44, 892 (1980).
- Biot [1941] M. A. Biot, General Theory of Three-Dimensional Consolidation, Journal of Applied Physics 12, 155 (1941).
- Terzaghi [1943] K. Terzaghi, Theoretical Soil Mechanics (John Wiley & Sons, Inc., Hoboken, NJ, USA, 1943).
- Auton and MacMinn [2017] L. C. Auton and C. W. MacMinn, From arteries to boreholes: steady-state response of a poroelastic cylinder to fluid injection, Proceedings of the Royal Society A 473, 20160753 (2017).
- Bertrand et al. [2016] T. Bertrand, J. Peixinho, S. Mukhopadhyay, and C. W. MacMinn, Dynamics of Swelling and Drying in a Spherical Gel, Physical Review Applied 6, 064010 (2016).
- Carrillo and Bourg [2019] F. J. Carrillo and I. C. Bourg, A Darcy-Brinkman-Biot Approach to Modeling the Hydrology and Mechanics of Porous Media Containing Macropores and Deformable Microporous Regions, Water Resources Research 55, 8096 (2019).
- MacMinn et al. [2015] C. W. MacMinn, E. R. Dufresne, and J. S. Wettlaufer, Fluid-driven deformation of a soft granular material, Physical Review X 5, 011020 (2015).
- Campbell et al. [2017] J. M. Campbell, D. Ozturk, and B. Sandnes, Gas-Driven Fracturing of Saturated Granular Media, Physical Review Applied 8, 064029 (2017).
- Sandnes et al. [2011] B. Sandnes, E. G. Flekkøy, H. A. Knudsen, K. J. Måløy, and H. See, Patterns and flow in frictional fluid dynamics, Nature Communications 2, 288 (2011).
- Zhang et al. [2013] F. Zhang, B. Damjanac, and H. Huang, Coupled discrete element modeling of fluid injection into dense granular media, Journal of Geophysical Research: Solid Earth 118, 2703 (2013).
- Holtzman and Juanes [2010] R. Holtzman and R. Juanes, Crossover from fingering to fracturing in deformable disordered media, Physical Review E 82 (2010).
- Holtzman et al. [2012] R. Holtzman, M. L. Szulczewski, and R. Juanes, Capillary fracturing in granular media, Physical Review Letters 108, 264504 (2012).
- Jain and Juanes [2009] A. K. Jain and R. Juanes, Preferential mode of gas invasion in sediments: Grain-scale mechanistic model of coupled multiphase fluid flow and sediment mechanics, Journal of Geophysical Research: Solid Earth 114, B08101 (2009).
- Meng et al. [2020] Y. Meng, B. K. Primkulov, Z. Yang, C. Y. Kwok, and R. Juanes, Jamming transition and emergence of fracturing in wet granular media, Physical Review Research 2, 022012 (2020).
- Carrillo and Bourg [2020a] F. J. Carrillo and I. C. Bourg, Modeling Multiphase Flow Within and Around Deformable Porous Materials: A Darcy‐Brinkman‐Biot Approach, Water Resources Research 57, e2020WR028734 (2020a).
- Hirt and Nichols [1981] C. W. Hirt and B. D. Nichols, Volume of Fluid (VOF) Method for the Dynamics of Free Boundaries, Journal of Computational Physics 39, 201 (1981).
- Jha and Juanes [2014] B. Jha and R. Juanes, Coupled multiphase flow and poromechanics: A computational model of pore pressure effects on fault slip and earthquake triggering, Water Resources Research 50, 3776 (2014).
- Kim et al. [2013] J. Kim, H. A. Tchelepi, and R. Juanes, Rigorous coupling of geomechanics and multiphase flow with strong capillarity, SPE Journal 18, 1123 (2013).
- Carrillo et al. [2020] F. J. Carrillo, I. C. Bourg, and C. Soulaine, Multiphase Flow Modeling in Multiscale Porous Media: An Open-Source Micro-Continuum Approach, Journal of Computational Physics: X 8, 100073 (2020).
- Whitaker [1986] S. Whitaker, Flow in porous media I: A theoretical derivation of Darcy’s law, Transport in Porous Media 1, 3 (1986).
- Carrillo and Bourg [2020b] F. J. Carrillo and I. C. Bourg, hybridBiotInterFoam (2020b).
- Huang et al. [2012] H. Huang, F. Zhang, P. Callahan, and J. A. Ayoub, Fluid injection experiments in 2D porous media, SPE Journal 17, 903 (2012).
- Spearman [2017] J. Spearman, An examination of the rheology of flocculated clay suspensions, Ocean Dynamics 67, 485 (2017).
- Quemada [1977] D. Quemada, Rheology of concentrated disperse systems and minimum energy dissipation principle, Rheologica Acta 16, 82 (1977).
- Zhou et al. [2010] J. Zhou, Y. Dong, C. J. De Pater, and P. L. Zitha, Experimental study of the impact of shear dilation and fracture behavior during polymer injection for heavy oil recovery in unconsolidated reservoirs, in In Proceedings - Canadian Unconventional Resources and International Petroleum Conference,Paper Number SPE-137656-MS, Society of Petroleum Engineerings (2010).
- Leverett [1941] M. Leverett, Capillary Behavior in Porous Solids, Transactions of the AIME 142, 152 (1941).
- Li and Benson [2015] B. Li and S. M. Benson, Influence of small-scale heterogeneity on upward CO2 plume migration in storage aquifers, Advances in Water Resources 83, 389 (2015).