Rise and fall of post-starburst galaxies in Magneticum Pathfinder
Abstract
Post-starburst galaxies (PSBs) belong to a short-lived transition population between star-forming (SF) and quiescent galaxies. Deciphering their heavily discussed evolutionary pathways is paramount to understanding galaxy evolution. We aim to determine the dominant mechanisms governing PSB evolution in both the field and in galaxy clusters. Using the cosmological hydrodynamical simulation suite Magneticum Pathfinder, we identify PSBs with stellar mass . We track their galactic evolution, merger history, and black hole activity over a time-span of Gyr. Additionally, we study cluster PSBs identified at different redshifts and cluster masses. Independent of environment and redshift, we find that PSBs, like SF galaxies, have frequent mergers. At , of PSBs have experienced mergers and had at least one major merger within the last Gyr, leading to strong star formation episodes. In fact, of PSBs were rejuvenated during their starburst. Following the mergers, field PSBs are generally shutdown via a strong increase in AGN feedback (power output erg/Myr). We find agreement with observations for both stellar mass functions and line-of-sight phase space distributions of PSBs in galaxy clusters. Finally, we find that cluster PSBs are predominantly infalling, especially in high mass clusters and show no signs of enhanced AGN activity. Thus, we conclude that the majority of cluster PSBs are shutdown via an environmental quenching mechanism such as ram-pressure stripping, while field PSBs are mainly quenched by AGN feedback.
keywords:
galaxies: starburst – galaxies: kinematics and dynamics – galaxies: star formation – galaxies: evolution – galaxies: clusters: general – methods: numerical1 Introduction
Post-starburst galaxies (PSBs), also referred to as E+A or k+a galaxies based on spectral properties (Dressler et al., 1999; Balogh et al., 1999), are characterised by a recent starburst and subsequent fast quenching (Dressler & Gunn, 1983; Caldwell et al., 1999). As such, they offer a unique opportunity to clarify some of the debated details of both the morphological (late- to early-type) and colour (blue cloud to red sequence) transition, which are fundamental to understanding galaxy evolution (Pawlik et al., 2016; Almaini et al., 2017). Furthermore, PSBs are found in all environments and at all redshifts, suggesting physical processes of universal importance (Belloni et al., 1995; Tran et al., 2003; Whitaker et al., 2012; Dressler et al., 2013; Pawlik et al., 2019). Their formation mechanism remains a matter of debate: Typically, PSBs are assumed to have undergone a recent quenching event rather than gradual depletion, and thus they belong to a transition population between blue disc-like and red early-type galaxies (Davidge, 2008; Wilkinson et al., 2017; Aguerri et al., 2018).
Different pathways have been proposed to explain the observed strong increase of PSBs with redshift (Maltby et al., 2018; Belli et al., 2019) and the varying environmental abundance (Poggianti et al., 1999; Lemaux et al., 2017; Paccagnella et al., 2019) of PSBs. Wild et al. (2016) propose two PSB pathways: First, at PSBs are exclusively massive galaxies which formed the majority of their stars within a rapid assembly period, followed by a complete shutdown in star formation. Second, at PSBs are the result of rapid quenching of gas-rich star-forming galaxies, independent of stellar mass. Possible candidates for this rapid quenching at include the environment and/or gas-rich major mergers (Wild et al., 2016). More recent work by Maltby et al. (2018) suggests that the PSB population is the result of a violent event, leading to a compact object, whereas the population is able to preserve its typically disc-dominated structure, suggesting an environmental mechanism. At redshift , D’Eugenio et al. (2020) find evidence for a fast pathway associated with a centrally concentrated starburst. Galaxies at redshifts appear to show evidence for three different pathways through the post-starburst phase, mostly occurring in intermediate density environments (Pawlik et al., 2018): First, a strong disruptive event (e.g. major merger) triggering a starburst and subsequently quenching the galaxy. Second, random star formation in the mass range causing weak starbursts and, third, weak starburst in quiescent galaxies, resulting in a gradual climb towards the high mass end of the red sequence (Pawlik et al., 2018). In general, it is clear that different PSB evolutionary pathways exist, however, to date the number of and relevant characteristics of these pathways is not well determined.
Despite ongoing arguments, simulations (Wilkinson et al., 2018; Davis et al., 2019) and observations (Schweizer, 1996; Bekki et al., 2005) of PSBs in the local low density Universe generally show signs of, or are consistent with, recent galaxy-galaxy interactions and galaxy mergers. This is not surprising, as galaxy mergers can impact the star formation rate (SFR) of galaxies in opposing ways: Mergers have been found to increase (Rodríguez Montero et al., 2019; Baron et al., 2020), not impact (Pearson et al., 2019), and decrease (Wu et al., 2020) the SFR on varying timescales, depending on the details of the specific merger. Mechanisms that directly impact the SFR and have been associated with mergers include: introducing turbulence (Ellison et al., 2018), increasing disc instabilities (Lagos et al., 2019), triggering nuclear inflows via tidal interactions (Springel et al., 2005; Goto et al., 2008), and gravitational heating, i.e. the process whereby gas is heated and kept hot via the release of potential energy from infalling substructure (Johansson et al., 2009b). Mergers may also influence the SFR indirectly: Potential mechanisms include facilitating the central galactic black hole (BH) growth (Barai et al., 2014), thus potentially leading to strong AGN feedback (Hopkins et al., 2013) which may lead to galactic gas removal (Barai et al., 2014), ultimately causing long term star formation suppression (Yesuf et al., 2014).
Several works highlight the relevance of active galactic nucleus (AGN) feedback in explaining the sharp decline in the SFR found in (PSB) galaxies (Yuan et al., 2010; Baron et al., 2018; Calabrò et al., 2019; Lanz et al., 2020). Nonetheless, the details of the mechanism(s) driving the nuclear activity in the centres of galaxies remains a major unsettled question (Steinborn et al., 2018), especially in PSBs. Some studies find no dominant AGN role in shutting down star formation on short timescale: zCOSMOS survey observations conclude that several mechanisms, both related and unrelated to the environment, are more relevant to the quenching of star formation on short timescales (Gyr) (Vergani et al., 2010). Due to the time delay between the starburst phase and AGN activity, Yesuf et al. (2014) go a step further and suggest that the AGN does not play a primary role in the initial quenching of starbursts, but rather is responsible for maintaining the post-starburst phase. On the other hand, Springel et al. (2005) find a complex interplay between starbursts and AGN activity when tidal interactions trigger intense nuclear gas inflows. SPH simulations find that the BH accretion rate is especially relevant to the inner SFR, but the correlation is less pronounced when using the galactic SFR (Hopkins & Quataert, 2010). (Hopkins et al., 2013) suggest that strong AGN feedback is required to explain the observed star formation shutdown in post-merger galaxies.
Generally, galactic quenching mechanisms, i.e. processes whereby star formation is reduced, can be divided into two categories: mass quenching, i.e. stellar mass dependent mechanisms which are mostly independent of the environment (e.g. SNe and AGN feedback), and environmental quenching, i.e. mechanisms governed by the surroundings (e.g. ram-pressure stripping and galaxy-galaxy interactions) rather than the galaxy itself (Boselli & Gavazzi, 2006; Peng et al., 2010; Smethurst et al., 2017).
The specific environment has a strong influence on the abundances of different types of galaxies, as evidenced by the morphology-density relation (Dressler, 1980; Goto et al., 2003): Cluster galaxies are more likely to be characterised by reduced star formation than galaxies in less dense environments (Oemler, 1974; Butcher & Oemler, 1978; Dressler, 1980; Balogh et al., 1997). As a result, the evolution of PSBs in cluster environments differs significantly from the evolution in lower density environments: A study of PSBs in galaxy clusters at indicates that the short-timescale star formation quenching channel (e.g. ram-pressure stripping within and galaxy-galaxy interactions outside of the virial radius) contributes two times more than the long timescale one (e.g. strangulation) to the growth of the quiescent cluster population (Paccagnella et al., 2017).
PSBs and star-forming cluster galaxies share many properties and are characterised by similar distributions of environment (Hogg et al., 2006). Long-slit spectra observations of Coma cluster galaxies suggest close kinematic similarities between star-forming and PSB galaxies, i.e. both appear to be rotating systems and have exponential light profiles (Caldwell et al., 1996). In a follow-up study of five low redshift galaxy clusters, Caldwell & Rose (1997) also find that most of the recent PSBs are in fact disc galaxies. Similarly, kinematic classifications at show that PSBs are typically fast rotators (Pracy et al., 2013). Meanwhile, cluster PSBs at (Pracy et al., 2010) and (Matharu et al., 2020) appear to have more similarities with early-type morphologies. Depending on how recently and by what mechanism(s) PSBs have undergone their starburst and subsequent shutdown, the morphological classification likely varies from late- to early-type.
Observations of cluster galaxies suggest that interactions with the intra-cluster medium (ICM) rather than mergers (as is the case in the field) are highly relevant for the evolution of cluster PSBs (Poggianti et al., 2009; Paccagnella et al., 2017). Coma cluster observations conclude that the starbursts found in Coma PSBs were not the result of major mergers (Caldwell et al., 1996). Similarly, observations of a rich cluster argue against a merger origin, favouring a PSB shutdown scenario involving the ICM (Pracy et al., 2010). This is further supported by the correlation between quenching efficiency and cluster velocity dispersion, which implies that the star formation shutdown is related to the ICM, specifically that more massive clusters quench more efficiently (Poggianti et al., 2009). SAMI and GASP observations find additional evidence for ram-pressure stripping being the dominant quenching mechanism in galaxy clusters: Most cluster PSBs have been quenched outside-in, i.e. the outskirts reach undetectable levels of star formation prior the inner regions (Gullieuszik et al., 2017; Owers et al., 2019; Vulcani et al., 2020a). In summary, the outside-in quenching, the lack of signs of interaction, the fast rotation, and the dense environment, all favour a scenario in which ram-pressure stripping shuts down star formation in cluster PSBs (Vulcani et al., 2020a).
Ram-pressure stripping also appears to influence galaxy evolution beyond direct quenching: Studies of cluster galaxies undergoing ram-pressure stripping find that ram-pressure stripping may enhance star formation prior to gas removal (Vulcani et al., 2018, 2020b; Roberts & Parker, 2020). Furthermore, there is evidence that an AGN is hosted by six out of seven GASP jellyfish galaxies (Poggianti et al., 2021), i.e. a potential cluster PSB progenitor (Poggianti et al., 2016) which is associated with long tentacles of (star-forming) material extending far beyond the galactic disc (Poggianti et al., 2017). This surprisingly high incidence, compared to the general cluster and field population, suggests that ram-pressure stripping may trigger AGN activity via nuclear gas inflow (Poggianti et al., 2017, 2021). Similarly, the Romulus C simulation finds ram-pressure stripping triggered enhanced black hole accretion prior to quenching (Ricarte et al., 2020), implying that the AGN feedback may aid in the quenching of star formation during ram-pressure stripping. Meanwhile, Radovich et al. (2019) find that photo-ionisation by the AGN in GASP jellyfish galaxies is the dominant ionisation mechanism. A detailed analysis of an individual GASP jellyfish galaxy supports the scenario in which the suppression of star formation in the central region of the disc is most likely due to the feedback from the AGN (George et al., 2019).
We aim to clarify the importance of different mechanisms to the onset of the starburst phase, as well as the reasons for the subsequent rapid shutdown in star formation observed in PSBs. We discuss the Magneticum Pathfinder simulations and our PSB selection process in Section 2. In Section 3, we study the environment, relevant distributions and the overall evolution of PSBs. The role of mergers is investigated in Section 4. In Section 5 we analyse the importance of the AGN and SNe feedback. Finally, we study PSB evolution within galaxy clusters in Section 6. We discuss our results in Section 7 and present our conclusions in Section 8.
2 Data sample
2.1 Magneticum Pathfinder simulations
Magneticum Pathfinder111www.magneticum.org is a set of large scale smoothed-particle hydrodynamic (SPH) simulations that employ a mesh-free Lagrangian method aimed at following structure formation on cosmological scales, with open access to many features (Ragagnin et al., 2017). The simulations are executed with the Tree/SPH code GADGET-3, a development based on GADGET-2 (Springel et al., 2001; Springel, 2005). In this work we primarily use Box2 (), and to a lesser extent Box2b () and Box4 (). Box2 and Box4 have a higher temporal resolution compared to Box2b, i.e. a larger number of individual SUBFIND halo finder outputs (Springel et al., 2001; Dolag et al., 2009). This facilitates and enhances the temporal tracking of galaxies. On the other hand, Box2b is larger and provides a greater statistical sample and is solely used to increase the sample size in Section 6.2.
Our standard resolution (for Box2, Box2b, and one of the Box4 runs) is set to ‘high resolution’: dark matter (dm) and gas particles have masses of and , respectively. Stellar particles are formed from gas particles and have of the mass of their parent gas particle. At this resolution level the softening of the dark matter, gas and stars is , and , respectively. Box2 is comprised of particles, while Box2b is comprised of particles. The ‘ultra-high resolution’ Box4 run has a higher mass resolution (compared to our standard ’high resolution’) (Schulze et al., 2018) and is only used to test the numerical convergence of our results. Throughout this paper the following cosmology is adopted (Komatsu et al., 2011): , , and .
The astrophysical processes modelled within the Magneticum simulations include, but are not limited to: gas cooling and star formation (Springel & Hernquist, 2003), metal and chemical enrichment (Tornatore et al., 2003; Tornatore et al., 2007; Dolag et al., 2017), black holes and AGN feedback (Springel et al., 2005; Hirschmann et al., 2014; Steinborn et al., 2015), thermal conduction (Dolag et al., 2004), low viscosity scheme to track turbulence (Dolag et al., 2005; Beck et al., 2016), higher order SPH kernels (Dehnen & Aly, 2012) and magnetic fields (passive) (Dolag & Stasyszyn, 2009). For a more details on the precise physical processes refer to Teklu et al. (2015); Hirschmann et al. (2014); Dolag et al. (2017).
The Magneticum simulations have been used in the past to compare and interpret observations, in addition to independently studying various properties. Galaxy kinematics are in good agreement with observations and may be used to predict the formation pathway (Schulze et al., 2018, 2020). The specific angular momentum of disc stars and its relation to the specific angular momentum of the cold gas matches observations, and may be used to (morphologically) classify galaxies (Teklu et al., 2015). When comparing with the integral field spectroscopic data from SAMI, Magneticum matches observations well: In particular, it is the only simulation able to reproduce ellipticities typical for disc galaxies (van de Sande et al., 2019). The mass ratios and orbital parameters of galaxy mergers strongly impact the resulting radial mass distribution: Mini mergers can significantly increase the host disc size, while not changing the global shape (Karademir et al., 2019). AGN properties in Magneticum, such as the evolution of the bolometric AGN luminosity function, agree with observations (Hirschmann et al., 2014). In fact, merger events, especially minor mergers, do not necessarily drive strong nuclear activity (Steinborn et al., 2016). Moreover, merger events are not the statistically dominant driver of nuclear activity (Steinborn et al., 2018). Satellite galaxies in galaxy clusters are predominantly quenched by ram-pressure stripping (Lotz et al., 2019). In general, Magneticum galaxy cluster properties, such as the pressure (Planck Collaboration et al., 2013), temperature, and entropy profiles (McDonald et al., 2014), as well as the distribution of metals (Dolag et al., 2017), agree with observations.
2.2 Post-starburst selection
Galaxies are selected to have a minimum stellar mass of , corresponding to a minimum of stellar particles for a given galaxy. The only exceptions to this stellar mass threshold is found in Section 6, where the threshold is reduced to to increase the available sample size in cluster environments. The additional use of Box2b and the lowering of the stellar mass threshold is done to increase the abundance of PSBs within galaxy cluster environments.
In order to differentiate between star-forming and quiescent galaxies, the criterion introduced by Franx et al. (2008) is used throughout this paper at all redshifts. To this end, we use the specific star formation rate (SSFR), i.e. the star formation rate (SFR) divided by the galactic stellar mass , and the redshift evolving Hubble time , where is the Hubble parameter calculated at a given redshift. Galaxies with a value above are classified as star-forming, while galaxies with are classified as quiescent.
Importantly, this co-called ‘blueness criterion’ () is time dependent rather than merely being applicable to low redshifts. Hence, this definition encompasses the changing star formation history on a cosmological scale and is well suited to study and compare galaxies at different redshifts. With this criterion, the Milky Way, for example, would have at and, hence, be considered star-forming (Licquia & Newman, 2015).
We identify post-starburst galaxies (PSBs) in the Magneticum simulations based on the stellar particle age and the blueness: Of all stellar particles of a galaxy, at least need to be younger than . In addition, the galaxy’s blueness at identification needs to be smaller than . These two parameters describe galaxies that have a sufficiently large young stellar population, while also no longer being star-forming, i.e. galaxies that have experienced a recent starburst. In particular, we choose this criterion as it implies a minimum average SSFR within the past Gyr of , similar to the criterion used by Davis et al. (2019). To verify that our results are robust, we initially varied both the young stellar mass percentage (1, 2, 5 or 10 per cent) and the associated evaluation timescale (0.5, 1 or 2 Gyr). Although the resulting sample size varied, the conclusions and the agreement with observations remained robust.
When considering all Box2 galaxies fulfilling these criteria we obtain a sample of PSBs at . This global sample provides the basis of the majority of our analysis and is complemented by additional specific environmental and redshift selections where necessary. To understand how PSBs differ from other galaxies, we introduce two stellar mass matched control (SMMC) samples: quenched (QSMMC) and star-forming (SFSMMC) galaxies, using the above blueness criterion for differentiation. The control samples are constructed by selecting the closest quenched and star-forming stellar mass match for each PSB galaxy at identification redshift. In terms of the star formation at identification redshift the QSMMC sample is indistinguishable from PSBs.
In order to disentangle the details causing the starburst and the following shutdown in star formation, we consider the temporal evolution of PSBs. To this end, we employ two complementary methods to track and trace both PSBs and control galaxies in Box2 of the Magneticum simulations. First, we identify the main galactic black hole particle associated with a galaxy and track this particle and subsequently its host backwards in time. This method provides a temporal resolution of Gyr, as only every fourth time step has stored particle data. Second, we analyse the merger trees of the galaxies in question, yielding a complete merger history with a temporal resolution of Gyr.
3 Environment, distribution, and evolution of post-starburst galaxies
3.1 Quenched, PSB-to-quenched, and PSB fractions
Understanding the abundance of specific galaxy types at different halo masses, i.e. in different environments, is crucial for determining the relevant formation and evolutionary mechanisms of PSBs. Specifically, the environment is key to understanding potential triggers of the starburst phase and, subsequently, the causes of the star formation shutdown. Lotz et al. (2019) already demonstrated good agreement between Box2 and observations of quenched fractions at intermediate stellar masses (Wetzel et al., 2012). We now extend our investigation to higher stellar mass galaxies , as well as presenting predictions of the PSB-to-quenched fraction.
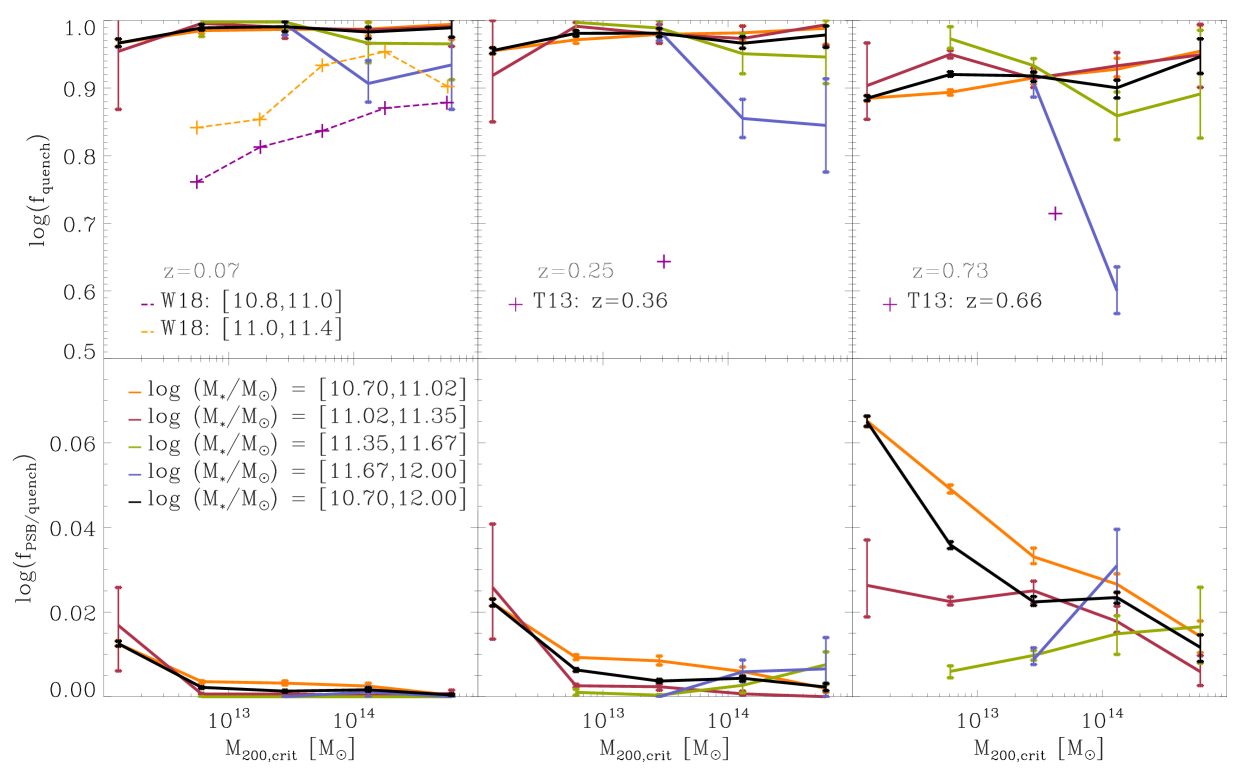
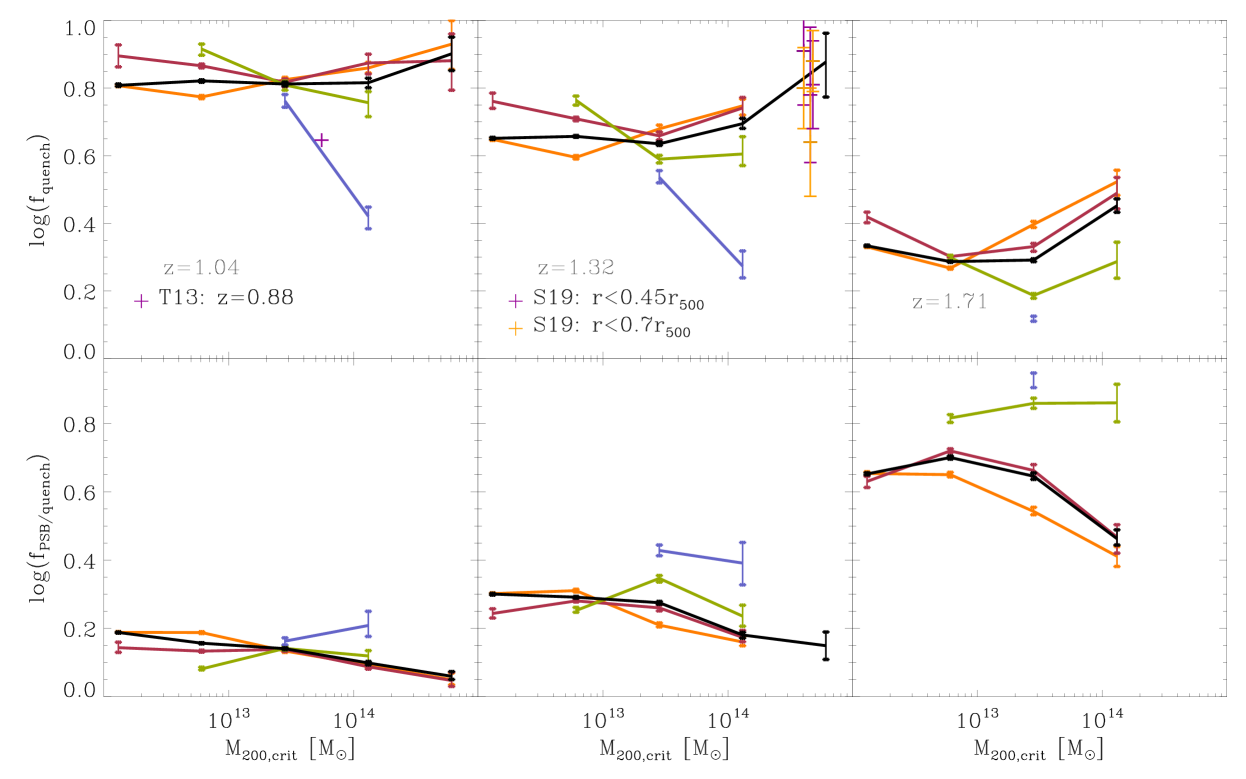
Figure 1 (top panels) shows a number of trends and behaviours relating to the quenched fraction: First, at redshifts the vast majority () of galaxies in the stellar mass range (black) are quenched, independent of host halo mass. The only exception to this is found in the highest stellar mass bin (), which shows lower quenched fractions with increasing halo mass, because above halo masses these high mass galaxies are dominated by brightest cluster galaxies (BCGs), which experience episodes of star formation as a result of gas accretion.
Second, Figure 1 shows varying agreement with observations: We find broad agreement between our quenched fractions and observations by Wang et al. (2018), which are based on NYU-VAGC (Blanton et al., 2005) and SDSS DR7 (Abazajian et al., 2009). Although our Box2 galaxies are characterised by higher quenched fractions and a less distinct split between stellar masses at compared to observations, observations are similarly characterised by high quenched fractions at low redshift, especially towards higher halo mass. When comparing our results at to observations of central galaxies in COSMOS groups at median redshift bins (George et al., 2011; Tinker et al., 2013), we find the strongest agreement towards higher redshifts, while the lower redshift comparison lacks good agreement. At high redshift, we compare our results to SPT-SZ cluster galaxies at redshifts (Strazzullo et al., 2019). The cluster galaxies have stellar masses above the common mass completeness limit , and the quenched fractions are calculated for cluster radii and (Strazzullo et al., 2019). To better compare with our results, we convert the halo mass from (Strazzullo et al., 2019) to , assuming an NFW profile with constant concentration () (Pierpaoli et al., 2003). The resulting comparison agrees well with our results. Furthermore, the trend whereby the quenched fraction at constant stellar mass increases towards lower redshift agrees with established models (Hopkins et al., 2008) and simulations (Behroozi et al., 2019).
Third, towards higher redshifts () our quenched fraction begins to drop and the differences between the stellar mass bins become larger than the bootstrapped errors associated with the individual bins. At , we find the highest quenched fraction in the lowest stellar mass bin . This is likely due to higher stellar mass galaxies at this redshift having undergone more recent mass growth, which is typically associated with star formation, thus leading to lower quenched fractions in high stellar mass compared to low stellar mass galaxies. In brief, environmental quenching is more effective than mass quenching at high redshift.
Figure 1 (bottom panels) shows the PSB-to-quenched fraction. The PSB-to-quenched fraction maps the abundance of PSBs relative to the evolving quenched fraction, rather than the total population, thereby avoiding additional systematics associated with the quenched fraction and its evolution. We find that the qualitative behaviour remains broadly similar at redshifts : The highest abundance of PSBs is consistently found at low stellar and halo masses. Specifically, the PSB-to-quenched fraction is consistently below at redshifts . Furthermore, the lower the redshift, the lower the PSB-to-quenched fraction.
At higher redshifts () PSBs are no longer most often found at low stellar masses. In particular, the low redshift preference for low stellar masses appears to be inverted at high redshift. High stellar mass galaxies at high redshift belong to the subset of galaxies characterised by the quickest mass assembly. When high stellar mass galaxies become quenched at high redshift, they likely host a significant population of young stars, thus fulfilling our PSB selection criteria. As a result the PSB-to-quenched fraction at high redshift is highest among high stellar mass galaxies.
The PSB-to-quenched fraction as a function of halo mass evolves with redshift: At low redshifts (), the PSB-to-quenched fraction exhibits the highest abundances at low halo masses. With increasing redshift (), the PSB-to-quenched fraction shows less preference for low halo mass. Similarly, DEEP2 and SDSS results find that PSBs are found in relatively under-dense environments, while at they are increasingly found in over-dense environments (Yan et al., 2009).
The positive correlation between redshift and the PSB-to-quenched fraction is also found for the PSB-to-total fraction: In the stellar mass range used in Figure 1, we find the following PSB-to-total fractions: at , at , at , at , at , and at . This behaviour agrees with observations of PSBs with stellar masses , which find that the fraction of PSBs declines from of the total population at , to by (Wild et al., 2016). At low redshift, the two differing stellar mass ranges yield similar abundances. However, at high redshift the agreement becomes smaller. This is likely driven by the times lower stellar mass threshold used by Wild et al. (2016), compared to our threshold. To demonstrate, in Box2 at , this lower stellar mass threshold results in a times higher number of total galaxies in the stellar mass range compared to . Connecting this with the fact that higher stellar mass galaxies at high redshift are statistically more likely to be classified as PSBs, as illustrated by Figure 1, our higher PSB-to-total fraction at high redshift is expected. Given these considerations, Wild et al. (2016) and our results agree well. We conclude, Figure 1 (bottom) suggests that both the redshift and environment play an important role in the specific evolution of PSBs.
3.2 Stellar mass functions of satellite galaxies
Evaluating the galaxy stellar mass distribution is critical for understanding the relative importance of different evolutionary mechanisms: Figure 2 shows the redshift evolution of the stellar mass function and its various components, as well as comparisons to observations. As such, Figure 2 provides a useful extension of Figure 1 by displaying the stellar mass distribution and an additional component-wise split into various samples. Although we only consider high mass PSBs () for our analysis, we have extended the stellar mass function below our mass threshold, which is indicated by a vertical dashed dotted black line at .
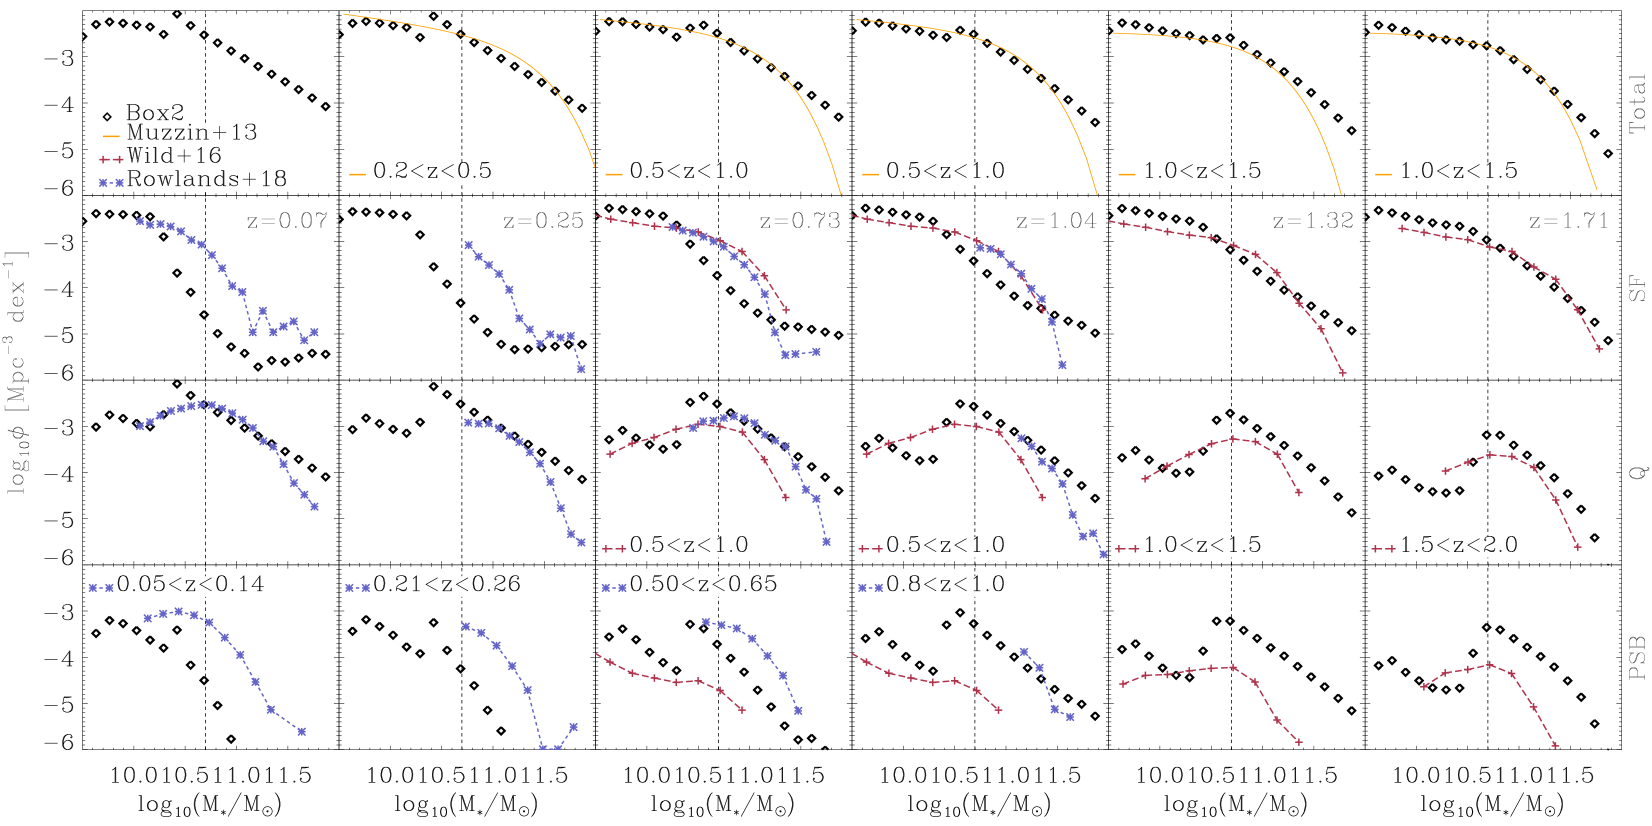
Throughout the studied redshift range () displayed in Figure 2, the total stellar mass function (1st row) shows little evolution. When comparing the total stellar mass function with observations based on COSMOS / UltraVISTA (Muzzin et al., 2013), we find agreement at all redshifts, especially towards lower redshifts. In contrast, the star-forming population (2nd row) shows a significant redshift evolution and only matches observations well at high redshift. The kink in the star-forming stellar mass function at , which becomes more evident with decreasing redshift, is the result of our active galactic nucleus (AGN) feedback. Specifically, above these stellar masses the AGN begins to continuously quench galaxies, leading to a relative under-abundance of star-forming galaxies in the stellar mass range (Steinborn et al., 2015). This difference becomes most evident when comparing our results to observational surveys based on GAMA () (Rowlands et al., 2018) and on UKIDSS UDS () (Wild et al., 2016). This relative lack of star-forming galaxies, compared to observations, becomes stronger towards lower redshifts, as more galaxies host AGNs. This effect also influences the total and quenched stellar mass functions, as evidenced by the perturbation found at in an otherwise fairly smooth distribution.
When viewing the evolution of the PSB stellar mass function with redshift in Figure 2, we find a significant evolution: At low redshifts PSBs are primarily found below our stellar mass cut (vertical dashed dotted black line), while they are typically found above our stellar mass cut at high redshifts. In other words, the abundance of PSBs above our stellar mass threshold increases significantly with increasing redshift. This strong redshift evolution agrees with VVDS observations, which find that the mass density of strong PSB galaxies is times lower at than at (Wild et al., 2009). When comparing the shape of the PSB galaxy stellar mass function to observations (Wild et al., 2016; Rowlands et al., 2018), we do not find close agreement. However, we note that observations at similar redshifts, as indicated by the legend in the bottom row of Figure 2, do not appear to show agreement either. This may be due to different selection mechanisms: While Wild et al. (2016) derive three eigenvectors, termed super-colours, via a principal component analysis (PCA) of the spectral energy distribution (SED) (Wild et al., 2014), Rowlands et al. (2018) use two spectral indices based on a PCA to distinguish different galaxy types. In contrast, we determine the percentage of young stars formed within the last Gyr and the current star formation rate (SFR) (see Section 2.2). Evaluating the SED compared to the numerical star formation may lead to discrepancies. In short, the PSB stellar mass function appears quite sensitive to the exact selection criteria, both in our simulation and in observations.
3.3 Galaxy distribution within halos
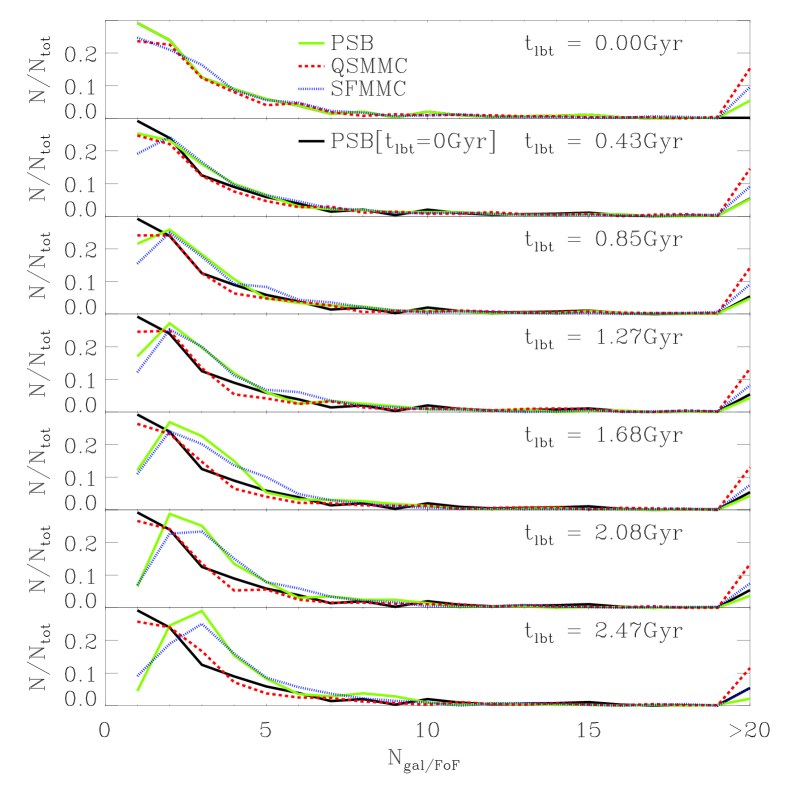
Figure 3 shows the distribution of the number of galaxies per Friends-of-Friends (FoF222A FoF linking length of times the mean DM particle separation is used (Dolag et al., 2009). Thereafter, each stellar and gas particle is associated with the nearest DM particle and ascribed to the corresponding FoF group, provided one exists, i.e. has at least DM particles (Dolag et al., 2009).) halo of all PSBs identified at in Box2. All PSBs (green solid lines) were tracked from present-day back over the last Gyr. To better understand how PSBs differ from other galaxies, quenched (red dashed lines) and star-forming (blue dotted lines) stellar mass matched control samples (QSMMC and SFSMMC, respectively) of galaxies and their evolution are shown in addition.
We find a significantly stronger evolution of in the PSB (green) and SFSMMC (blue) samples compared to the QSMMC (red) sample. At Gyr (top panel), the PSB, QSMMC, and SFSMMC samples initially share a similar distribution. The only meaningful exception being the largest bin, i.e. , which is a factor of larger for the QSMMC compared to the PSB sample, indicating a preference of quenched galaxies for richer membership FoF halos. In contrast, PSBs are rarely found in rich membership FoF halos. In high membership FoF halos, star-forming galaxies lie in intermediate ranges, centred between the other two samples. The varying galaxy abundances in different halo mass ranges are listed in the bottom row of Table 4. As the look-back-time increases, we find that PSBs, and to lesser degree the SFSMMC galaxies, develop a clear peak around , while values of experience a strong decrease. In contrast, the QSMMC distribution remains fairly similar over time. This fundamental difference in evolution of PSB and star-forming galaxies compared to quiescent galaxies suggests that the initial environment at Gyr plays an important role in influencing star formation, and subsequently PSB galaxy evolution.
At Gyr the overwhelming majority of halos in which PSBs (and SFSMMC galaxies) are found, host galaxies. This differs significantly from QSMMC galaxies, which are most often found in halos hosting one galaxy. In contrast, PSBs are rarely found with , indicating that they are usually not found in isolation333We note that the number of galaxies found in a given halo is a function of resolution and thus the differences in relative abundance between galaxy types is a more robust quantity.. The similarity between the PSB and SFSMMC distributions at Gyr, shown in the bottom panel of Figure 3, suggests that star formation is associated with the relative abundance of galaxies in the direct environment. When connecting the initial abundance of galaxies within the FoF halo with the decrease in the number of galaxies found at lower look-back-times, a mechanism linked to the interaction with other galaxies appears likely. Specifically, Figure 3 suggests that galaxy-galaxy processes, such as mergers with nearby galaxies, are important in supporting star formation, as well as possibly being linked to the starburst phase and the following star formation shutdown which characterise PSBs.
3.4 A closer look: Evolution of massive post-starburst galaxies
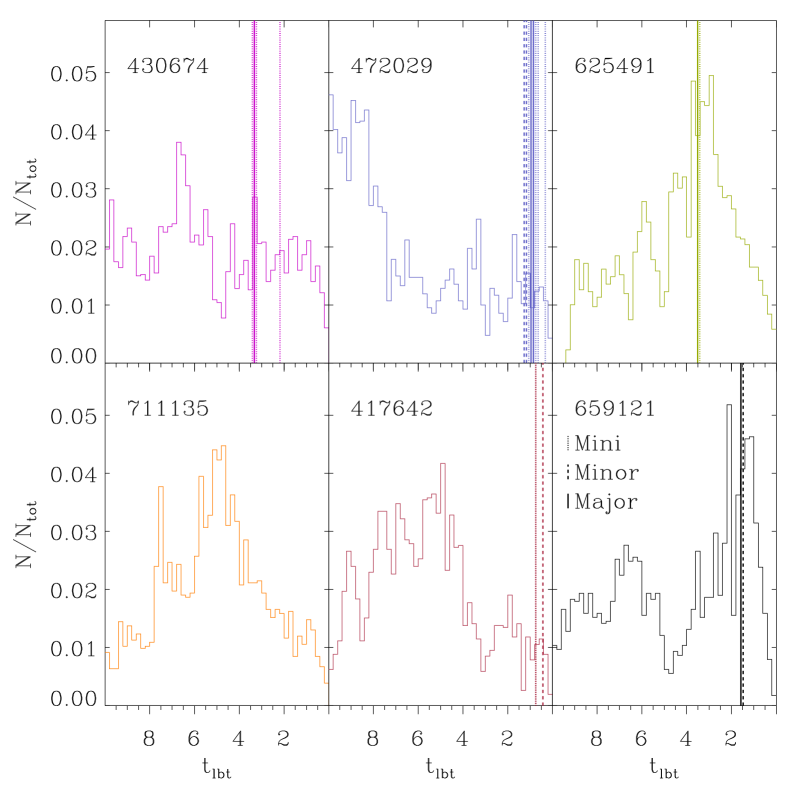
In Table 1 we introduce six massive PSBs, which we study in greater detail alongside the total population of PSBs. These six massive PSBs are chosen based on their high stellar mass, i.e. higher number of stellar particles, which allows a more detailed (spatial) examination of the involved physical processes. Table 1 lists relevant galactic and halo properties of the six PSBs at Gyr. Similar to the vast majority () of the global PSB sample (see bottom row in Table 4), five of our six massive PSBs are found in halos with halo mass .
Figure 4 shows the diverse distributions of stellar histories. Specifically, the number of stellar particles added to a given galaxy within a given look-back-time interval for the six massive PSBs is shown. We highlight that this representation includes both internally formed (in-situ) and accreted (ex-situ) stars (whereas the in-situ star formation is shown in Figure 5). The first (last) three galaxies of Table 1 are displayed in the top (bottom) row, as indicated by the IDs. The stellar histories shown in Figure 4 vary: While some massive PSBs are characterised by continuous star formation (and/or accretion) in recent look-back-times (pink, blue), others show strong recent star formation (black). Both Table 1 and Figure 4 show that massive PSBs with very different properties and stellar histories are captured by our selection criteria.
| ID | [] | [] | [] | [] | [] | [] | Galaxies in halo | |
|---|---|---|---|---|---|---|---|---|
| 430674 | 0.18 | 405 | 13 | |||||
| 472029 | 0.00 | 424 | 6 | |||||
| 625491 | 0.21 | 280 | 3 | |||||
| 711135 | 0.05 | 243 | 1 | |||||
| 417642 | 0.00 | 477 | 8 | |||||
| 659121 | 0.00 | 269 | 1 |
3.5 Main sequence tracks
Figure 5 shows the positions of post-starburst (PSB: green) and star-forming (SF: blue) galaxies and their progenitors in the stellar mass - star formation rate (SFR) plane from left to right at: (1st panel), (2nd panel), peak PSB star formation (3rd panel), and the evolution of the six massive PSBs (4th panel) introduced in Table 1. To compare the behaviour with observations, we have added main sequence fits (shaded regions) for redshifts and (Speagle et al., 2014; Pearson et al., 2018). The six massive PSBs in the right panel are identified at (crosses), i.e at Gyr. The PSB progenitors are then tracked backwards in intervals of Gyr, yielding additional data points (small diamonds). PSB progenitors are tracked to a maximum redshift of (triangle), i.e. to Gyr, depending on how recently their black holes have been seeded (see Section 5.2 for more details). Additionally, the logarithmic relative deviation of galaxies from the observationally based redshift evolving main sequence (MS) fit (Pearson et al., 2018) is plotted in the top panels, i.e. . In other words, galaxies lie on the main sequence and positive (negative) values correspond to the logarithm of the factor they lie above (below) the main sequence.
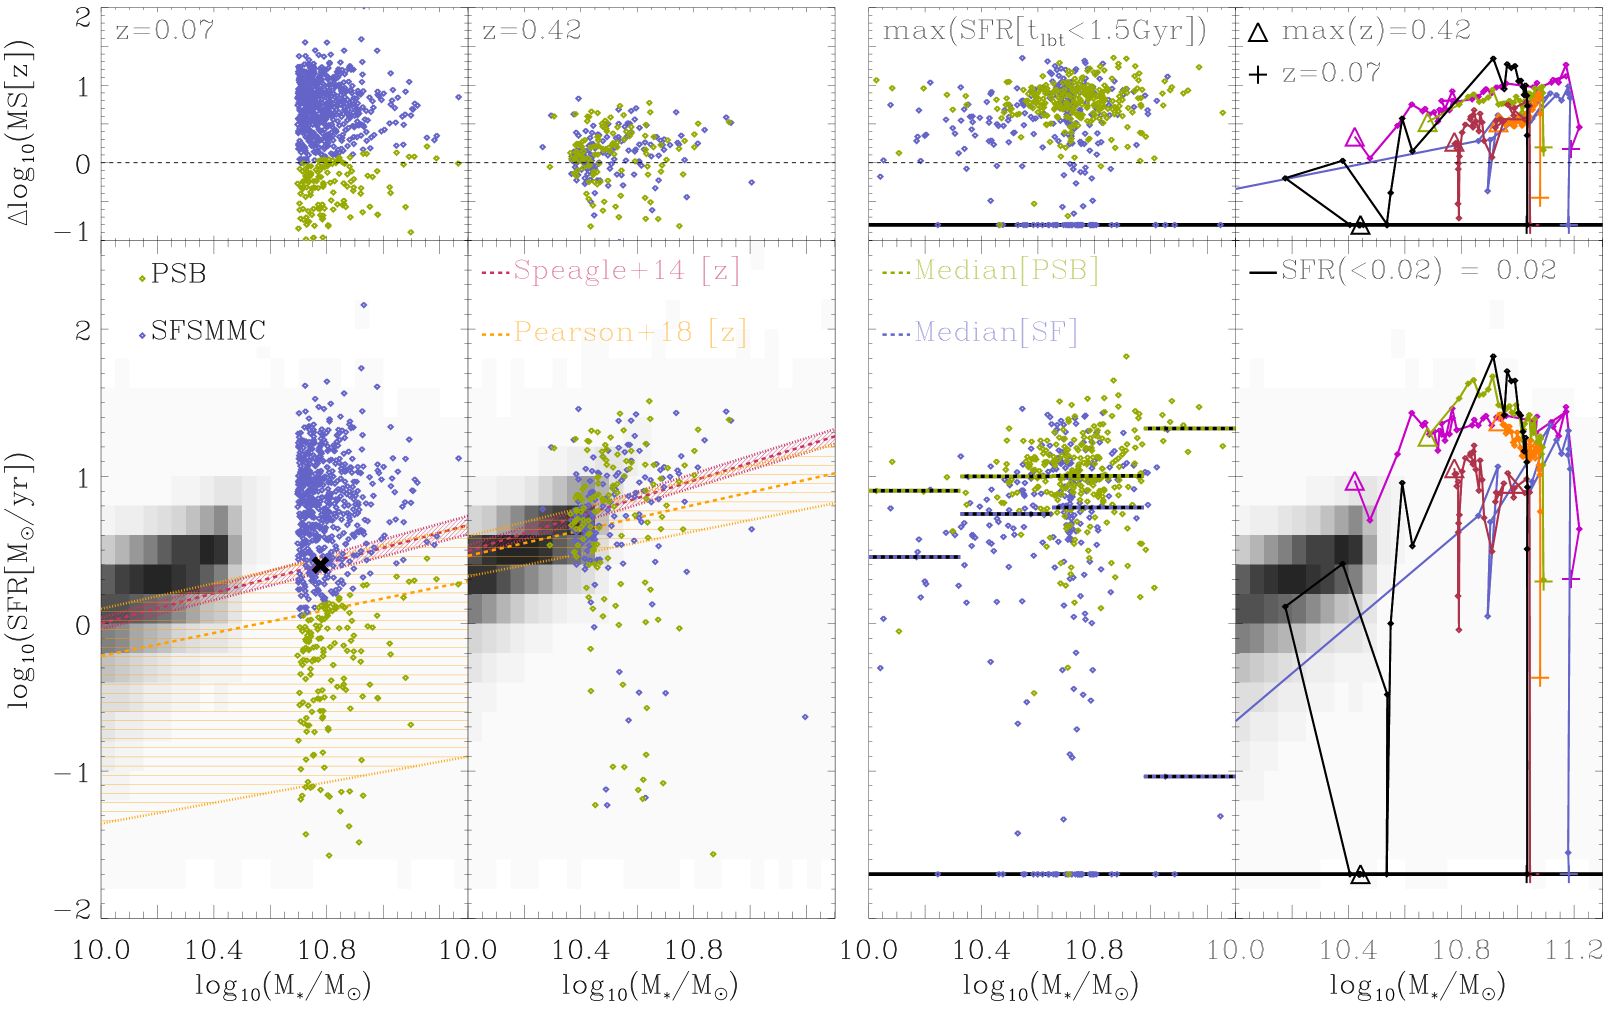
The distribution of PSB (green) and SF (blue) galaxies at is shown in the first panel of Figure 5. The dichotomy found at Gyr, i.e. at our identification time, is the result of our selection criteria (see Section 2.2): By design, PSBs are quenched, while the SFSMMC sample is characterised by star formation. When comparing to observations, we find that this dichotomy is well described by observations (Speagle et al., 2014; Pearson et al., 2018). Furthermore, we see that the SF galaxies appear as an extension of the grey density distribution describing the abundance of all Box2 Magneticum galaxies, while the PSBs scatter below the main sequence. The grey density distribution experiences a strong cut-off at because the SF population is characterised by a strong decline at this stellar mass (see Figure 2). We note that the relative deviation from the evolving main sequence shown above the first panel uses a redshift of , as the observational fit is no longer defined at (Pearson et al., 2018), the redshift showing Magneticum results.
The display of PSB and SF progenitors in the second panel of Figure 5 shows no meaningful difference between the two populations. Both populations match the behaviour of the general distribution of the main sequence of Magneticum galaxies at the same redshift, which is shown in the underlying grey density distribution. Furthermore, the general Box2 Magneticum galaxy distribution (grey), as well as the PSB and SF galaxies are well described by observational fits at (Speagle et al., 2014; Pearson et al., 2018). We note that the least amount of galaxies are found in the second panel, compared to the first and third panel, because not all galaxies can be traced back to higher redshifts. Furthermore, at galaxies with are not shown due to the logarithmic scaling.
The third panel in Figure 5 displays the distribution of PSB and SF progenitors at the height of PSB progenitor star formation within Gyr, i.e. since . If available, the corresponding SFSMMC galaxy to a given PSB galaxy is displayed, otherwise a random unique SFSMMC at the same redshift is shown for comparison. The median PSB peak star formation occurs at , i.e. at Gyr. When comparing the two populations we find that PSBs are characterised by higher SFRs than SFSMMC galaxies, as illustrated by the dashed horizontal lines indicating the median of each population at different stellar mass intervals. Interestingly, of SF progenitors (blue, 3rd panel) at peak PSB progenitor star formation are found on the black horizontal line, i.e. have . These SFSMMC galaxies were previously quiescent and have become star-forming at via recent mergers, i.e. have been rejuvenated.
In this context, we note that the recent SFR of the most massive progenitors need not always be correlated with a young stellar population at Gyr. This is evidenced by the fact that within our PSB sample we have a galaxy which has no in-situ star formation over the evaluated time-span, as illustrated by the green diamond (3rd panel) found on the black horizontal line showing galaxies with . In other words, galaxies need not have formed in-situ stars to host a young stellar population, rather, as is the case for the mentioned PSB galaxy, young ex-situ stars may also be accreted during mergers, leading to a young stellar population in the merger remnant at Gyr (see also Section 4.1).
The fourth panel of Figure 5 shows that massive PSB progenitors are found significantly above the main sequence prior to their quiescent phase at Gyr (crosses). PSB progenitors display prolonged strong star formation episodes, with SFRs consistently being significantly larger than the redshift evolving main sequence (Pearson et al., 2018). Generally, independent of the duration, starbursts of massive PSB progenitors are found in the range above the redshift evolving main sequence.
In Figure 5, we find both galaxies that continuously remain above the main sequence as well as galaxies that experience rejuvenation, i.e. galaxies which were initially below the main sequence but rise above it during their starburst phase. The starburst timescales () differ widely and are within the range Gyr. This spread in timescales is a reflection of the different star formation histories prior to the starburst. As the global PSB sample is tracked backwards, the sample size is reduced, especially if BHs are recently seeded. This results in a sample size of tracked PSB progenitors, which reach a Gyr. Of these successfully tracked PSBs, are considered to be rejuvenated galaxies, i.e. . Independent of whether galaxies are rejuvenated or show sustained star formation, they show a sharp decline in star formation at the end of the starburst phase. Typically, this decline to passive levels of star formation happens within Gyr. This conflicts with our understanding of the typical behaviour of field galaxies, which make up the vast majority of our sample (see last row of Table 4), as field galaxies generally experience a gradual decline in average SFR (Noeske et al., 2007). In other words, the (massive) PSBs in Figure 5 not only show enhanced, often sustained, starbursts, but also experience an abrupt cessation of star formation, the details of which are discussed in Section 5.
4 The role of mergers
It is well established that galaxy mergers impact the galactic star formation rate (SFR), both directly (Springel et al., 2005; Johansson et al., 2009b; Ellison et al., 2018; Lagos et al., 2019) and indirectly (Hopkins et al., 2013; Barai et al., 2014; Yesuf et al., 2014). However, the nature and relevant parameters of the mergers and how they influence the SFR is still debated. For example, while the SIMBA cosmological simulations find an increasing impact (Rodríguez Montero et al., 2019), observations based on SDSS, KiDS, and CANDELS find that mergers do not significantly impact the SFR, compared to non-merging systems (Pearson et al., 2019), and observations based on PSBs from LEGA-C suggest that mergers likely trigger the rapid shutdown of star formation found in PSBs (Wu et al., 2020). To disentangle this complex relationship between mergers and the SFR, we investigate mergers in Box2, both on an individual basis as well as statistically.
4.1 Case study: Gas evolution
The case study of one typical PSB (progenitor), selected from Table 1 (ID=417642), is shown in Figure 6. The goal is to map the (cold) gas evolution as a means of investigating the initial triggering of the starburst and the following starburst phase. To uncover the mechanisms involved, Figure 6 shows the evolution of the stellar history (1st row), the gas phase (2nd row), and a projection of the spatial gas distribution (3rd row) as a function of look-back-time for the selected PSB (progenitor). To better visualise the evolution of the gas involved in the recent starburst phase, all star-forming gas at Gyr, i.e. one time-step before the shutdown, is identified and subsequently coloured green. These identified gas particles maintain their green colouring both prior to and after this look-back-time.
When considering higher look-back-times in Figure 6, we find that the recent increase in star formation at Gyr coincides with a close galaxy-galaxy interaction, followed by a major merger event at Gyr (see solid red vertical line in Figure 4). The period between Gyr is characterised by prolonged star formation. This is not an exception, but rather most PSB progenitors experience recent merger events (see Table 2). It appears that the initial close galaxy-galaxy interactions and the subsequent mergers provide a mechanism by which gas is transported inwards, increasing the number of gas particles above the density threshold (2nd row) required for star formation. The increase in the supply of cold, dense gas within the PSB progenitor then enables the starburst.
Similarly to the vast majority of PSBs surveyed in this manner, a strong diffusion of gas is registered in Figure 6 at Gyr, following the starburst phase. In the second row, we find a strong decrease in gas density, accompanied by an overall increase in temperature within a timescale of Gyr, as evidenced by the distribution of previously star-forming gas (green) over the entire density and temperature regime. This behaviour at low look-back-times is mirrored in the spatial domain (3rd row), which also provides evidence for a strong redistribution of previously star-forming gas (green). Although the spatial distribution widens, large cold gas reservoirs remain within the PSB galaxy at Gyr, agreeing with recent observations (Yesuf & Ho, 2020). We reviewed the gas evolution of multiple different PSBs and verified that the behaviour shown in Figure 6 is not an exception, but rather typical for our (massive) PSB sample.
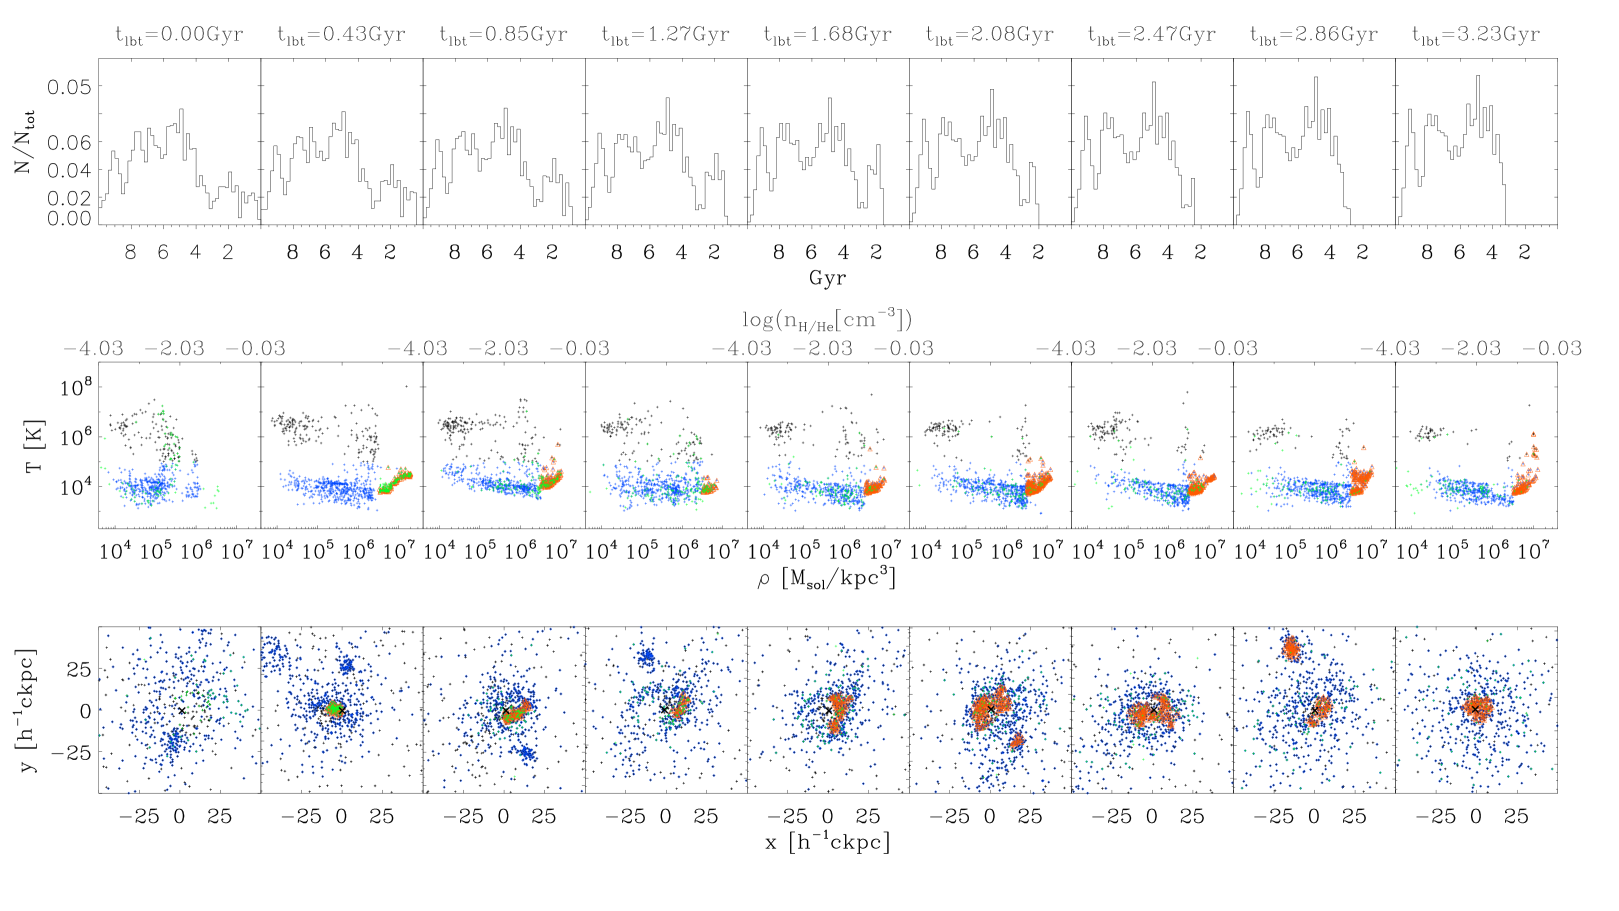
When viewing the stellar history in the first row of Figure 6, the relative weighting of different components appears to change as time progresses. For example, at Gyr the onset of the starburst appears to be significantly stronger (compared to the older stars) than at lower look-back-times. Investigating this behaviour, we found that a significant population of older stars are accreted onto the PSB progenitor, thus impacting the relative abundance of different components of the stellar history. In other words, during the presented merging process, more ex-situ old stars are accreted than young in-situ stars are formed (see also Section 3.5).
4.2 Merger statistics
To extend the case study conducted in Section 4.1 by a statistical analysis, we begin by evaluating the merger history of the global PSB sample. In addition, we also analyse the two (quiescent and star-forming, respectively) stellar mass matched control samples QSMMC and SFSMMC. The results of the merger tree evaluation for these samples are listed in Table 2.
Mergers are defined by their progenitor peak stellar mass ratio within the past four snapshots prior to merger identification, i.e. Gyr: mini mergers 1:10 - 1:100, minor mergers 1:3 - 1:10, and major mergers 1:1 - 1:3. The first data row lists the sample size of successfully constructed merger trees. This value is less than the total sample size (), as merger trees only exist over the entire evaluated time-span of Gyr if the main progenitor was formed prior to this time-span. The next three rows list the total number of identified mergers (galaxies can have multiple mergers of the same type) for each type. The next three rows in Table 2 display the percentage of the analysed merger trees which identify at least one merger event of the respective type. The last row lists the percentage of galaxies with at least one merger event, independent of the type.
Table 2 shows that the PSB sample is characterised by an abundance of merger events. This agrees with low redshift observations, which find that PSBs are associated with interactions and/or mergers (Yang et al., 2004, 2008; Pracy et al., 2009; Meusinger et al., 2017). Specifically, of PSBs experience a major merger within the last Gyr. In contrast, only of QSMMC galaxies experience a major merger within the same time-span, while this percentage rises to for SFSMMC galaxies. Compared to the QSMMC, the PSB sample experiences a factor of more major merger events. When comparing the samples, we find close similarities between the PSB and SFSMMC sample, i.e. both show an abundance of mergers. In contrast, the QSMMC sample is characterised by a low abundance of mergers and differs significantly from the other two samples. However, it is not clear that this is typical for PSBs identified at higher redshifts.
| Criterion | PSBs | QSMMC | SFSMMC |
|---|---|---|---|
| Analysed trees | 632 | 646 | 630 |
| 343 | 114 | 285 | |
| 295 | 53 | 260 | |
| 465 | 65 | 415 | |
| Criterion | PSBs | QSMMC | SFSMMC |
|---|---|---|---|
| Analysed trees | 10520 | 10596 | 10479 |
| 8559 | 4899 | 8692 | |
| 6747 | 2439 | 6832 | |
| 6014 | 1638 | 6822 | |
In Section 3, we showed the redshift evolution of both the PSB-to-quenched fraction and the PSB stellar mass function. In this context, we investigate the abundance of mergers at redshift , in the same manner as outlined for our global PSB sample. This is motivated by the desire to separate the redshift evolution of identically selected samples from differences resulting from different (later) environmental selections. We choose redshift because we also study the merger abundance in the cluster environment (see Section 6.4) and compare it to observations (see Section 6.2) at this redshift.
As established by Figures 1 and 2, the abundance of PSBs increases with increasing redshift. Table 3 reflects this too, as significantly more PSBs are identified at (10624 galaxies), compared to (647 galaxies). Beyond this, we find that: First, the percentage of galaxies which experience more than one merger (last row) increases, especially for the QSMMC sample (factor ), less so for the SFSMMC sample (increase by ), and least for the PSB sample (increase by ). Second, the similarity between the PSB and the SFSMMC sample remains, as both continue to show similar (high) merger abundances compared to the QSMMC sample. Third, the overall increase in the abundance of mergers is especially driven by more mini and minor mergers at . This behaviour at agrees with LEGA-C observations at , which find that central starbursts are often the result of gas-rich mergers, as evidenced by the high fraction of PSB galaxies with disturbed morphologies and tidal features () (D’Eugenio et al., 2020).
Albeit differences existing between Tables 2 () and 3 (), the link between recent (in relation to the identification redshift) star formation and the abundance of mergers appears strong. To summarise, although PSBs are quiescent at identification redshift, they are characterised by recent (strong) star formation. The similarity with respect to merger abundances between star-forming and PSB galaxies is likely driven by the ability of mergers to trigger starbursts on short timescales and to provide cold gas on longer timescales to otherwise exhausted galaxies (Genzel et al., 2010; Hirschmann et al., 2012). In short, we find strong evidence that mergers are linked to increased star formation, while their absence is linked to quiescent levels of star formation. Consequently, the high abundance of mergers appears to be central to the evolution of PSB galaxies, while likely also playing an important role in the subsequent shutdown.
4.3 Cold gas fractions
As the timescales of the galaxy-galaxy interactions prior to the detection of a merger event vary widely, depending on the specific geometry of the encounter, we do not individually correlate merger events with the onset of the starburst phase. Rather, to more closely evaluate the properties of the detected mergers and to investigate their differences, we determine the cold gas fractions prior to mergers for the PSB, QSMMC, and SFSMMC samples. The cold gas fraction is calculated within three half-mass radii , where the half-mass radius is defined as the radius of a three dimensional sphere containing half of the total galactic stellar mass. We choose , as its use is well established within our simulations and it is often considered equal to the observationally attained effective radius (Teklu et al., 2015; Remus et al., 2017; Teklu et al., 2018; Schulze et al., 2020). We tested the impact of choosing different half-mass radii () on and found consistent behaviour for varying half-mass radii.
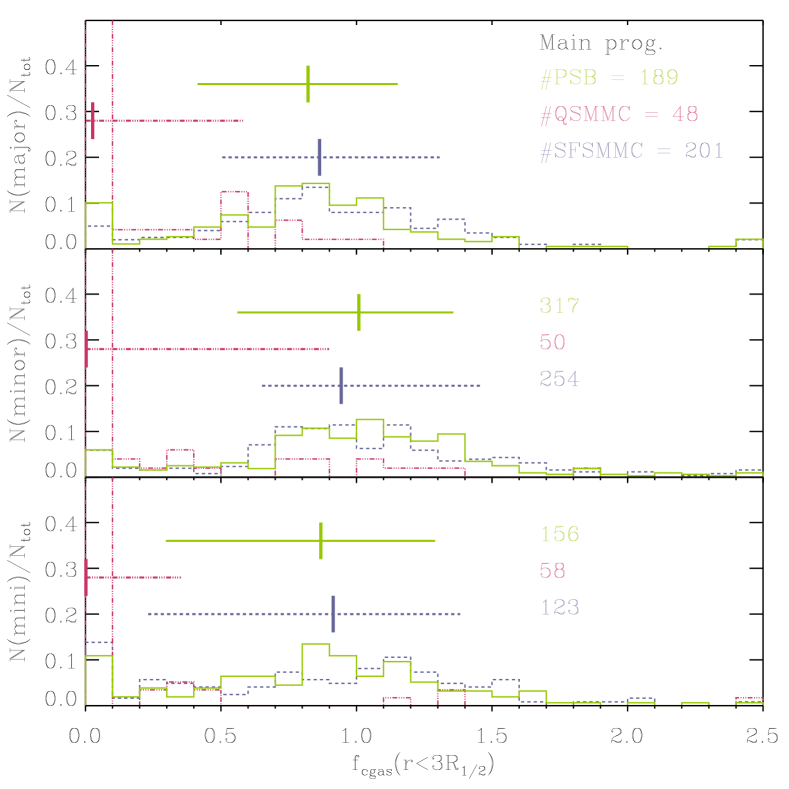
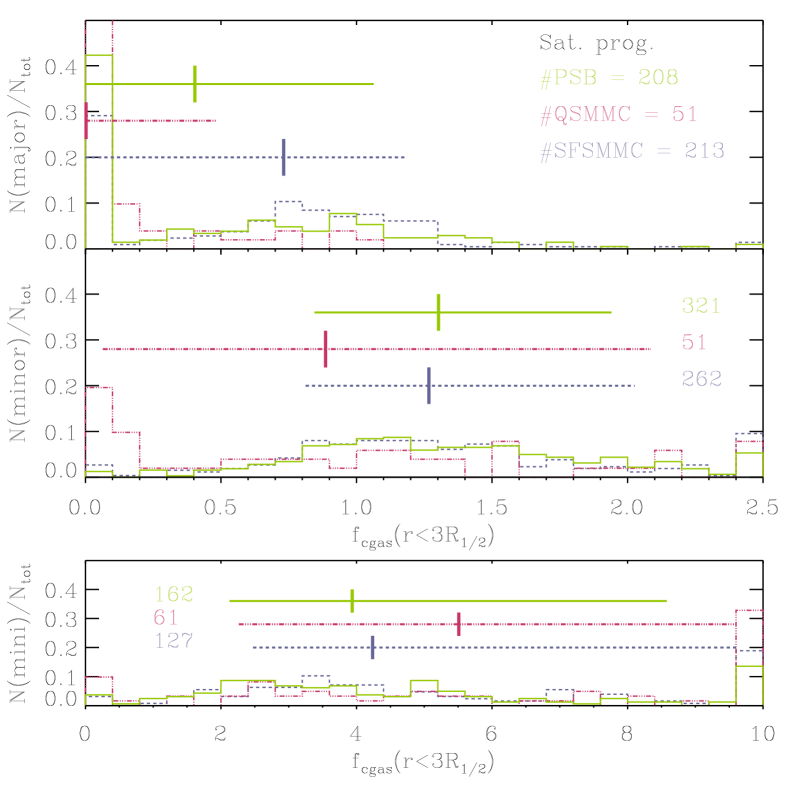
Figure 7 shows the distribution of cold gas fractions within three half-mass radii , split up into main (left) and satellite progenitors (right). We further split the sample into major (top), minor (middle), and mini (bottom) mergers. When a merger event is registered, we determine the cold gas fraction prior to the merger event, i.e. we identify the progenitors peak stellar mass in the Gyr before the event is registered and determine the cold gas fraction at this time-step. Each progenitor is then assigned to the respective merger type distribution. This is done separately for the PSB (green), QSMMC (red), and SFSMMC (blue) sample. The solid vertical lines indicate the median values of each population, while the horizontal lines are bounded by the percentiles and respectively, i.e. the equivalent region of a Gaussian distribution.
All panels showing the individual main progenitor distribution (left) in Figure 7 display similar distributions for different merger ratios. The reason for this is that independent of the given merger ratio, by definition, the merging main progenitor has the same cold gas fraction. Every time a merger occurs, the population of main progenitors is sampled, resulting in a similar cold gas fraction distribution for all main progenitors, independent of the merger ratio.
In contrast, each sample of satellite progenitors (right) shows an evolving behaviour with merger type. Figure 7 (right) displays that the distribution for each sample migrates towards higher values as the stellar mass ratio between main and satellite progenitor decreases, i.e. when moving towards smaller mergers. In a nutshell, less massive merging satellite progenitors have higher relative abundances of cold gas.
We find that the main progenitor behaviour of the (median) cold gas fraction distribution of the PSB and SFSMMC sample is similar with for the main progenitors. The PSB and SFSMMC satellite progenitors show an expected (see above) stronger variance in cold gas fractions between merger types. In contrast to the PSB and SFSMMC galaxies, Figure 7 shows that the QSMMC sample consistently has lower values: The quiescent main progenitors (left) have , i.e. compared to their stellar mass almost no cold gas is present in the galaxies. The satellite progenitors (right) also show that satellites which merge via major or minor mergers into the QSMMC sample typically have lower cold gas fractions, compared to the PSB and SFSMMC sample.
Taking all this into account, it appears that Figure 7 provides some evidence for galactic conformity, i.e. the effect whereby properties, e.g. the star formation rate, of satellite galaxies appear correlated to the properties of the central galaxy (Kawinwanichakij et al., 2016; Teklu et al., 2017; Tinker et al., 2017, 2018). In other words, star-forming and PSB main progenitors appear more likely to merge with satellite progenitors which have similarly high cold gas fractions, while quiescent main progenitors appear more likely to merge with satellite progenitors which exhibit more cold gas depletion, i.e. lower .
Interestingly, the strongest difference between the PSB and SFSMMC sample in Figure 7 is found for major mergers of satellite progenitors (top right): Statistically, the median cold gas fraction of SFSMMC major merger satellite progenitors () is almost twice as large compared to PSBs (). This is further evidenced by the different abundances at small cold gas fractions: of QSMMC, of PSB, and of SFSMMC satellite major merger progenitors are found within . As of PSB and of SFSMMC galaxies experienced at least one merger within the last Gyr (Table 2), this difference in cold gas supply marks an important distinction between the, otherwise often similar, populations. The implications associated with the difference in cold gas supply during major mergers, especially for the shutdown of star formation, are discussed in Section 7.2.
The bottom right panel of Figure 7 displays a four times larger domain. The mini mergers of satellite progenitors show a significantly flatter distribution of , while simultaneously having significantly higher values. This is likely the result of infalling cold gas over-densities being classified as mini mergers or gas-rich satellites merging with their host. Subsequently, the low number of stellar particles compared to the abundant (cold) gas particles, drives high values of . Due to the low resolution of mini merger satellite progenitors, this panel is less relevant to understanding mergers, while still showing that (cold) gas inflow is relatively similar () for all analysed samples, with the highest values found in the QSMMC sample.
5 Shutdown of star formation
5.1 Active galactic nucleus and supernova feedback
We investigate both the active galactic nuclei (AGN) as well as the supernovae (SNe) feedback energy output as a means to better understand the processes involved in shutting down star formation. Specifically, we want to shed light on processes which are linked to the short timescale (Gyr) redistribution and heating of previously star-forming gas, as discussed in Section 4.1. We choose these mechanisms in particular because they are able to deposit large amounts of energy on short timescales (Springel et al., 2005; Voit et al., 2015; Wild et al., 2020), thereby potentially strongly impacting star formation.
As a precaution, we also investigated the typical depletion timescales of cold gas in PSB progenitors during peak star formation. We find the timescales to be significantly higher (Gyr) than the short shutdown timescale (Gyr) found throughout our PSB sample. In other words, PSBs progenitors do not appear to run out of gas, rather the reservoir of cold, dense gas is abruptly heated and/or redistributed, leading to a shutdown in star formation, as demonstrated in Figure 6.
We calculate the AGN power output based on the change in BH mass between time steps (Gyr) (Hirschmann et al., 2014):
| (1) |
where is the fraction of energy which is thermally coupled to the surrounding gas, and is a free parameter usually set to (typical for simulations following metal dependent cooling functions (Booth & Schaye, 2009, 2011)).
As we are especially interested in SNe which release their energy on short timescales, our focus is on short lived, i.e. massive, stars. Therefore, supernovae Type II (SNeII), which arise at the end of the lifetime of massive stars, provide the dominant source of supernovae feedback in our analysis (Chevalier, 1976). Following the star formation model by Springel & Hernquist (2003), we expect an average SN energy release per stellar mass of . Combining this with the star formation rate at each time step, (temporal resolution Gyr), we receive the following estimation for the SNe power output :
| (2) |
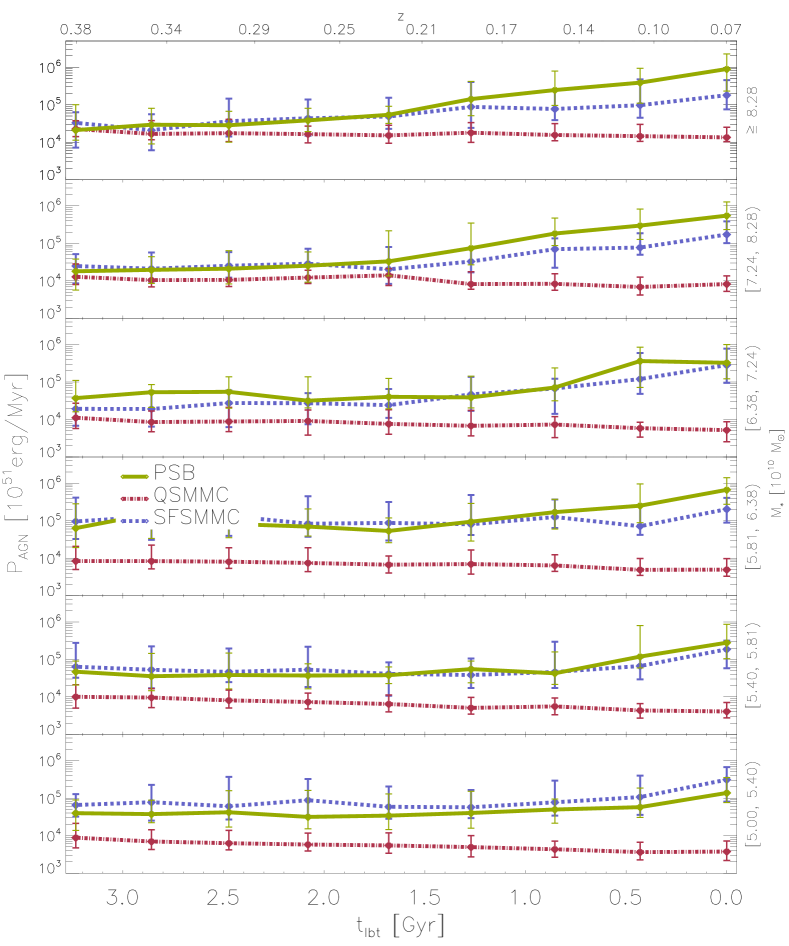
The results of these calculations are shown in Figure 8 for equal bin size stellar mass intervals: . On the left-hand side each data point displays the median AGN power output calculated from the difference in BH mass between time-steps, as indicated in Equation 1. Following Equation 2, data points in the right figure display the SNe power output estimation based on the current star formation rate (). When the median SFR is zero, which is the case for the entire QSMMC sample, the SNe power output is zero too. Both figures shown in Figure 8 show the respective median values, as well as the region as error bars (additionally shaded on the right). The different temporal resolution between the two figures is the result of using the BH particle data on the left, which due to storage constraints is only saved every Gyr, and using SUBFIND data on the right, which is available every Gyr (see Section 2.2).
In the stellar mass interval (bottom panel) characterised by the weakest AGN power output (left), the AGN still strongly outweighs the SNe power output (right): We find the maximum median SNe power output for PSB galaxies to be erg/Myr. In contrast, the maximum median AGN power output is erg/Myr for the same stellar mass selection. In other words, Figure 8 shows that the AGN outweighs the SNe power output by half an order of magnitude, especially at recent look-back-times.
Figure 8 (left) shows negligible differences between PSB and SF galaxies at lower stellar masses: Both samples show a recent increase in AGN feedback, which is significantly larger than that of the quenched sample, especially towards more recent look-back-times. However, with increasing stellar mass the difference between PSB and SF galaxies increases. Specifically, in the highest stellar mass interval, i.e. (top panel), the difference at Gyr is of order half a magnitude between PSBs (erg/Myr) and SF (erg/Myr) galaxies. In contrast to the recent elevation in AGN feedback found in PSB and to a lesser degree in SF galaxies (depending on the stellar mass interval), AGN feedback of quiescent galaxies shows no meaningful temporal evolution and only a weak stellar mass evolution (erg/Myr in the highest stellar mass interval).
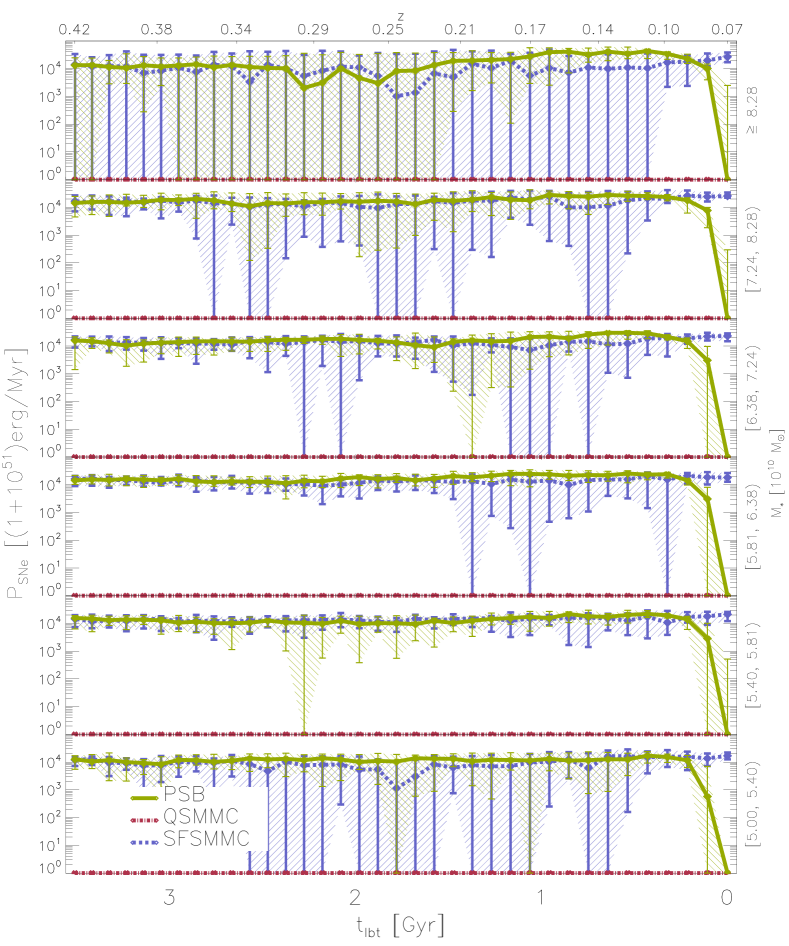
In Figure 8 (right) the PSB and SF galaxies show similar median SNe feedback. However, even at (bottom panel), where PSB and SF galaxies show the most similarities, we see a large spread in SNe feedback in the SF sample, while PSBs show a smaller spread in the distribution of SNe feedback. Independent of stellar mass, this is especially the case at recent look-back-times, Gyr: During this period PSBs are typically experiencing their starburst phase. As a result, the SFR is elevated throughout the entire sample, which due to its linear relation to the SNe feedback (see Equation 2) results in a tighter and slightly elevated distribution compared to SF galaxies, as evidenced by smaller error bars. Meanwhile, the quiescent galaxy sample is continuously characterised by a lack of SNe feedback, as no meaningful star formation occurs in the sample during the evaluated time span. As dictated by our selection criteria, PSBs show a strong decrease in SNe feedback energy at Gyr.
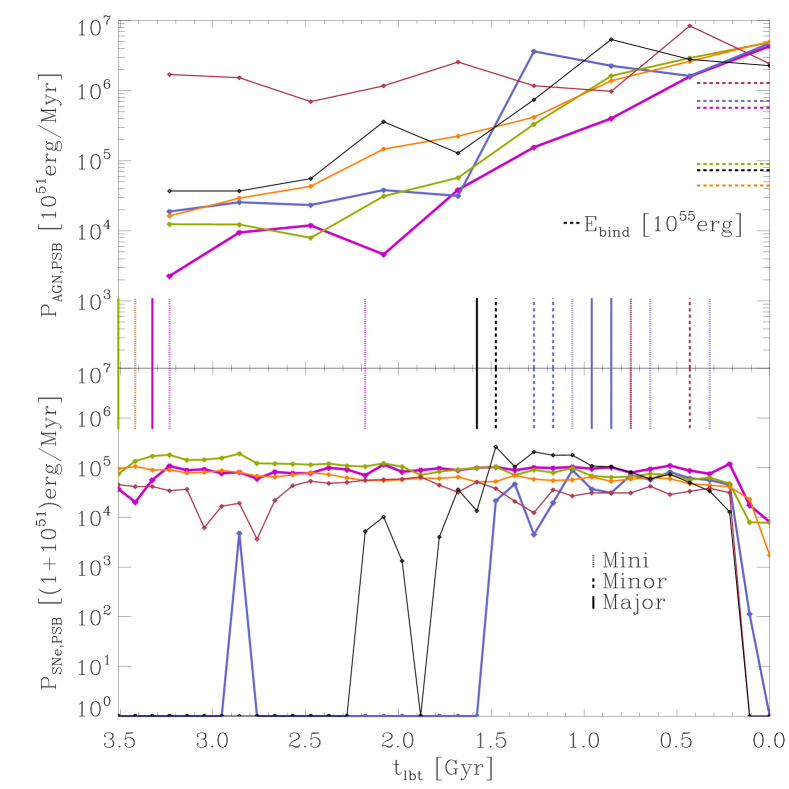
In addition to our statistical analysis (Figure 8), in Figure 9, we consider the individual AGN (top) and SNe (bottom) feedback of the six massive PSBs, described in Table 1. We have added vertical lines indicating specific merger events colour coded to match the associated galaxy: When evaluating the last Gyr, we find that the six massive PSBs experienced 16 merger events, compared to 10 in the associated SFSMMC, and 2 in the QSMMC sample. As previously established in Sections 4.1 and 4.2, this further highlights the significance of mergers for the evolution of (massive) PSBs.
Similarly to the comparison between AGN and SNe feedback shown in Figure 8, Figure 9 also shows that the AGN feedback significantly outweighs the SNe feedback, especially at recent look-back-times. Specifically, within the last Gyr all six PSBs have an AGN feedback (erg/Myr) which outweighs the SNe feedback (erg/Myr) by more than an order of magnitude. Furthermore, Figure 9 shows that most of the mergers (vertical lines) in the PSB sample occur within the last Gyr, i.e. during the same time in which the AGN power output increases by up to orders of magnitude.
As a rough comparison, we calculate an estimation of the spherical binding energy () of the massive PSBs using the halo mass and radius as displayed in Table 1 for and , respectively. The resulting estimation is shown as horizontal lines in the top panel (right) of Figure 9. To compare with the power output, the horizontal binding energy lines use a different scale [erg], as indicated by the legend. Five out of the six massive PSBs have binding energies with erg and the PSB with the most massive halo (shown in Figure 6) has a binding energy of erg. Most binding energies are found within an order of magnitude of the AGN energy released within the last time step Gyr, which further highlights the strong impact the AGN has on (massive) PSBs. Furthermore, we note that the extensive amount of power deposited by the AGN (erg/Myr) during Gyr is correlated with the gas temperature increase, gas density decrease, and general redistribution of gas seen in Figure 6 at Gyr. Thus, we find strong evidence that the AGN is connected and probably responsible for the shutdown of the star formation in (massive) PSBs.
5.2 Black hole growth statistics
To complement the analysis in Section 5.1, we additionally quantify the black hole (BH) growth for our different samples. We calculated both the relative and absolute BH growth: Indeed, only of QSMMC galaxies, compared to and of the SFSMMC and PSB galaxies, at least double their BH mass over the last Gyr. In absolute terms, of PSB and of the SFSMMC galaxies experience a significant mass growth of , while this is only the case for of the QSMMC galaxies.
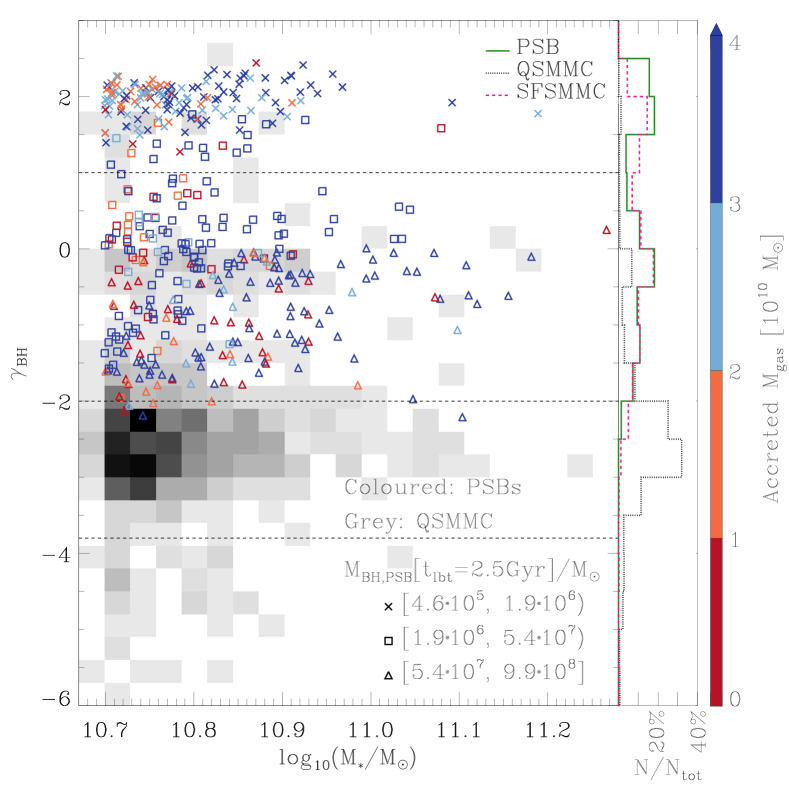
To better visualise the scales involved in the BH mass growth over a period of Gyr, we introduce :
| (3) |
Figure 10 (left) shows as a function of stellar mass for QSMMC (grey density) and PSB galaxies, using a colour bar (right-hand side) to encode the galactic accreted gas mass . As indicated by the legend, different symbols are used to indicate the initial PSB galaxy BH mass at Gyr: the least massive BHs are indicated by crosses, i.e. , intermediate BHs are indicated by squares, i.e. , and the most massive BHs are indicated by triangles, i.e. .
Figure 10 (left) clearly shows that, in contrast to QSMMC galaxies, PSBs are consistently found at higher values of . This is in line with previously established behaviour (see Section 5.1), where PSBs exhibit a significantly stronger AGN feedback, i.e. BH mass growth, than the QSMMC sample. Interestingly, it appears that the PSB population inhabits distinct regions in the stellar mass - plane. Most noticeably, there appears to be a bimodality, centred around two PSB populations found at , i.e. a BH growth by a factor of , and , i.e. a doubling of the BH mass over the last Gyr.
A strong correlation between decreasing and increasing is evident: In Figure 10 (left), we see that larger BH growth strongly correlates with smaller Gyr BH mass (crosses). Likewise, smaller BH growth correlates with more massive Gyr BHs (triangles). In short, the less massive PSB BHs were at Gyr, the more BHs grow in the following Gyr.
It follows that, the population is characterised by recently seeded BHs at Gyr. Our BHs are represented by collisionless sink particles, which are seeded with an initial mass of in galaxies with stellar mass (Steinborn et al., 2015). The BHs are seeded below the Magorrian relation, i.e. the relation between BH and bulge mass (Magorrian et al., 1998). In practice, this means that recently seeded BHs experience an initial rapid BH mass growth at fairly constant stellar mass (Steinborn et al., 2015). In contrast, the population is characterised by BHs that have already reached the Magorrian relation at Gyr. Despite the numerical effects associated with seeding BHs, from a physical point of view, the important distinction between PSB and QSMMC galaxies remains: PSBs are characterised by a significantly stronger recent BH mass growth. Conversely, the histogram in Figure 10 (left) shows a strong overlap between PSB (green) and SFSMMC (pink) galaxies. This further highlights the importance of the specific details of the BH growth, i.e. when, on which timescale, and under which circumstances the growth occurs.
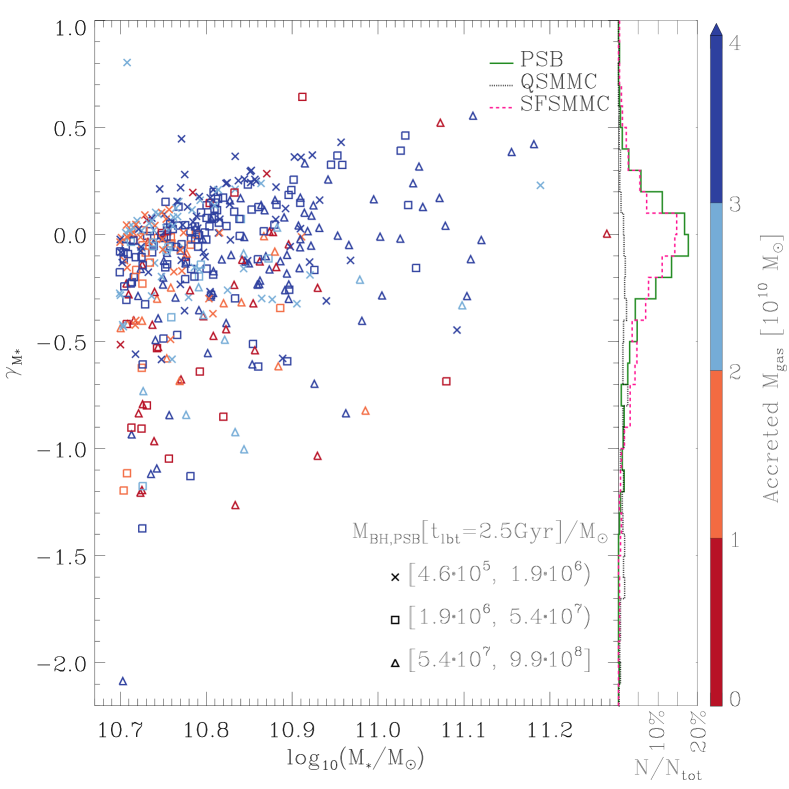
Figure 10 (right) illustrates a number of distinct points: First, the PSB bimodality found in the left panel is not reproduced when evaluating the stellar mass growth (using Equation 3, but substituting with ). Second, as previously established in Section 3, PSB galaxies in Figure 10 are overwhelmingly found at lower stellar masses, i.e. close to our mass cut. Third, Figure 10 shows a weak correlation between stellar mass and gas accretion, as low stellar mass PSBs are more likely to have low gas accretion (red and orange), while gas accretion appears to increase (blue) towards higher stellar masses. Additionally, we also investigate the correlation between stellar mass and stellar mass (rather than gas) accretion via mergers, finding a stronger correlation than in Figure 10. This is not surprising, as mergers provide a significant pathway for stellar mass growth for massive galaxies (Rodriguez-Gomez et al., 2016; Qu et al., 2017; O’Leary et al., 2021), while in-situ star formation becomes less (van Dokkum et al., 2010).
Further investigation shows that the majority () of BHs do not accrete any other BHs, while accrete one other BH within the evaluated time-span. This reveals that BH growth in our simulation typically happens via smooth accretion, i.e. the process whereby (diffuse) gas is continuously accreted (Bournaud & Elmegreen, 2009; L’Huillier et al., 2012), rather than through the accretion of other BHs. We find a weak correlation between increasing stellar mass and increasing number of accreted BHs. Again, this is not surprising as larger stellar mass galaxies typically grow their stellar mass via mergers (van Dokkum et al., 2010; Qu et al., 2017). As a result more massive galaxies are more likely to merge with satellites which already host a seeded BH, increasing the likelihood of the main BH accreting a satellite BH. This weak correlation between stellar mass and accreted BHs agrees with our expectations of a hierarchical growth model in a CDM universe in which large halos are formed late via the coalescence of smaller ones (Navarro et al., 1997; Cole et al., 2000; Bower et al., 2006).
A closer look at the histogram (right) reveals both a continued similarity between PSB (green) and SFSMMC (pink) galaxies, and a strong difference to QSMMC (black) galaxies: Compared to PSB and SFSMMC galaxies, far fewer QSMMC galaxies experience a non-negligible stellar mass growth over the considered time-span, Gyr. As a result, Figure 10 (right) is underpopulated with QSMMC galaxies. This contrast between PSB and SFSMMC on one side, and QSMMC galaxies on the other, further highlights the statistically rich merger history of PSB and SFSMMC galaxies, which are overwhelming located around , i.e. experience a doubling in stellar mass within the past Gyr.
In short, both the merger history (Table 2) and BH growth (Figure 10 left) of PSB and SFSMMC galaxies show strong similarities, albeit PSBs are classified as quiescent at Gyr. This shows that, when no further stellar mass selection is chosen (as is done in the left panel of Figure 8) and the major merger progenitor cold gas content is not taken into consideration (see Figure 7 top right), PSBs essentially behave like star-forming galaxies until their recent shutdown in star formation.
| Selection | PSBs | QSMMC | SFSMMC | PSBs | QSMMC | SFSMMC | PSBs | QSMMC | SFSMMC |
|---|---|---|---|---|---|---|---|---|---|
| 95.6 | 91.7 | 87.5 | 3.8 | 8.3 | 10.8 | 0.6 | 0 | 1.7 | |
| 85.2 | 82.8 | 86.2 | 12.1 | 12.7 | 10.8 | 2.7 | 4.5 | 3.1 | |
| 100 | 84.7 | 65.4 | 0 | 12.4 | 26.9 | 0 | 2.9 | 7.7 | |
| - | 8.9 | 0 | - | 28.9 | 100 | - | 62.2 | 0 | |
| 89.4 | 79.1 | 85.0 | 8.7 | 13.6 | 12.0 | 1.9 | 7.3 | 2.9 | |
Table 4 displays the BH growth for the PSB, QSMMC, and SFSMMC samples as a function of halo mass, i.e. local environment. The horizontal lines in Figure 10 indicate the different subdivisions of Table 4. As PSB and SFSMMC galaxies typically experience a more rapid evolution, i.e. their BHs have been more recently seeded, the sample size of galaxies evaluated over Gyr is smaller for PSBs () and SFSMMC (), compared to the QSMMC sample ().
The last row of Table 4 shows that of all PSB, of QSMMC, and of SFSMMC galaxies are found within a field environment () at Gyr. In contrast to of QSMMC galaxies, only of PSB and of SFSMMC galaxies are found in clusters (). This trend reflects the results obtained in Section 3.3, i.e. that PSBs at Gyr are overwhelmingly found in halos with few satellites.
QSMMC galaxies belong to the only sample with a non-negligible population in the regime (see Figure 10 left). Moreover, galaxies found at these low values, i.e. BHs with stagnated growth, are more likely to be found in clusters () and groups (). As galaxy clusters are characterised by an abundance of hot gas and cluster galaxies have high relative velocities, inhibiting galaxy mergers, satellite galaxies have very limited opportunities to replenish their (cold) gas reservoir. Consequently, cluster galaxies have a lower likelihood of gas inflow reaching the galactic centre, resulting in low BH growth, and less numbers of PSBs.
6 Post-starburst galaxies in galaxy clusters
As observations suggest that the evolution of PSBs differs considerably with environment, we now focus on galaxy clusters (Poggianti et al., 1999; Goto, 2005; Wild et al., 2009; Lemaux et al., 2017; Paccagnella et al., 2019). Particularly, we want to understand how the environment, specifically galaxy clusters, influence PSB galaxy evolution. To increase our sample size, we lower the mass threshold in this section to include galaxies with at least 100 stellar particles, i.e. . This does not include Table 5 and Figure 15, where the stellar mass threshold () is kept the same to allow direct comparisons with Table 3 and Figure 8.
6.1 Galaxy cluster stellar mass function comparison
We extend our study of the global stellar mass functions shown in Figure 2 by considering the high density environment and comparing to a catalogue of galaxy cluster candidates detected in the Ultra-Deep-Survey (UDS) (Socolovsky et al., 2018). Socolovsky et al. (2018) study the environment dependent galaxy evolution in the redshift range using the UDS. They identify clusters, of which contain more than members. This results in a sample of galaxies, which provide the basis for the stellar mass function calculation (Socolovsky et al., 2018).
To compare with the observations, we follow a similar, yet not identical, prescription: Due to redshift uncertainties, Socolovsky et al. (2018) sample the volume of cylinders centred on clusters with height . Thereafter, they remove the contaminants by statistically subtracting the field galaxies in each cylinder (Socolovsky et al., 2018). To not unnecessarily introduce statistical contamination, we consider smaller cylinders with height . In both cases, the cylinder has radius and the stellar mass and the number of satellites is calculated inside the cylinder. Following Socolovsky et al. (2018), we select only those clusters with a member range of and stellar mass within of . Subsequently, each cluster is considered along three random yet linearly independent spatial axes, increasing our sampling.
A total of Magneticum clusters fulfil the above criteria, with a total of member galaxies with stellar mass , of which are star-forming, are quiescent, and are identified as PSBs. The cluster and galaxy counts are the total values across all three spatial axes, i.e. are up to a factor of larger than the uniquely identified objects within Box2.
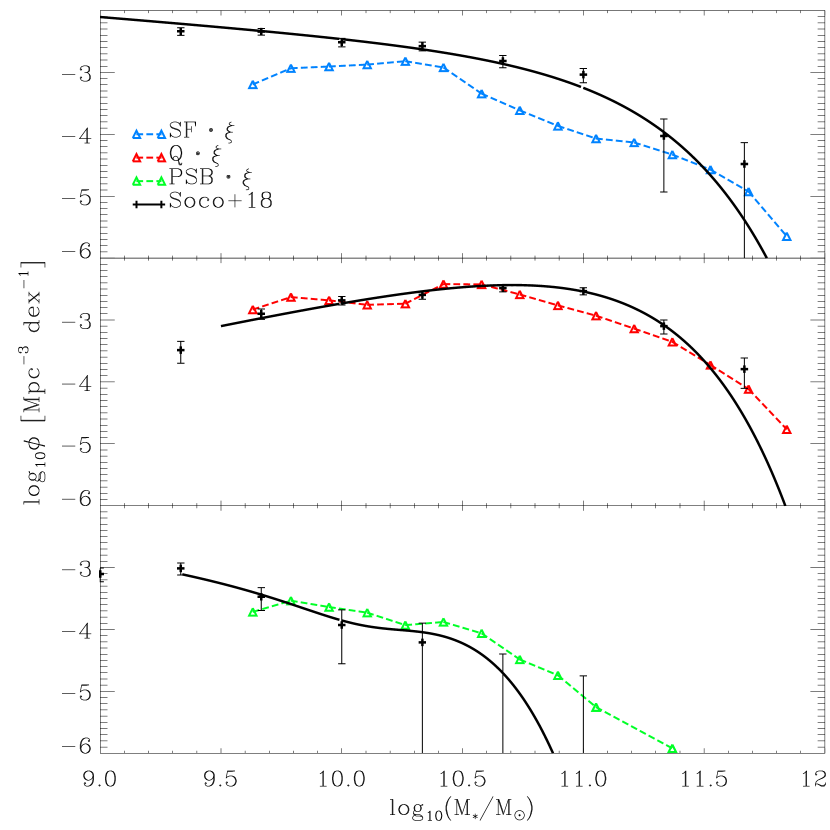
Figure 11 shows the galaxy cluster stellar mass function of star-forming (blue), quenched (red) and PSB (green) galaxies. Similarly to the total sample shown in Figure 2 at , the cluster PSB stellar mass function has two bumps at and and is dominated by the low stellar mass end. However, the amplitude of the PSB bumps differs between the total and cluster sample. Furthermore, we find fewer star-forming and thus more quiescent galaxies in the cluster environment at low stellar mass compared to the total sample (Figure 2).
The observations in Figure 11 are fitted by Schechter functions (star-forming and quiescent satellite galaxies) and double Schechter functions (PSBs), respectively (Baldry et al., 2008; Pozzetti et al., 2010). As the stellar mass functions discussed in Socolovsky et al. (2018) are arbitrarily normalised, the Magneticum results were also normalised to fit the observational data. Specifically, the Magneticum results (triangles) were multiplied by a factor of to vertically adjust them to the observations. As shown in Figure 11, the shape of the cluster galaxy stellar mass functions from Magneticum are in very good agreement with observations (see also Steinborn et al. (2015)).
There are only two discrepancies: First, the star-forming distribution which, similar to Figure 2, lacks good agreement for masses between . As discussed in Section 3.2, this is due to the onset of the AGN feedback. Second, we find evidence for rare massive cluster PSBs which are not found in the significantly smaller observational sample. Further evidence for good agreement is provided by the replication of the PSB plateau in the mass range , indicating a preferential intermediate mass range.
6.2 Line-of-sight velocity: Observation and resolution comparison
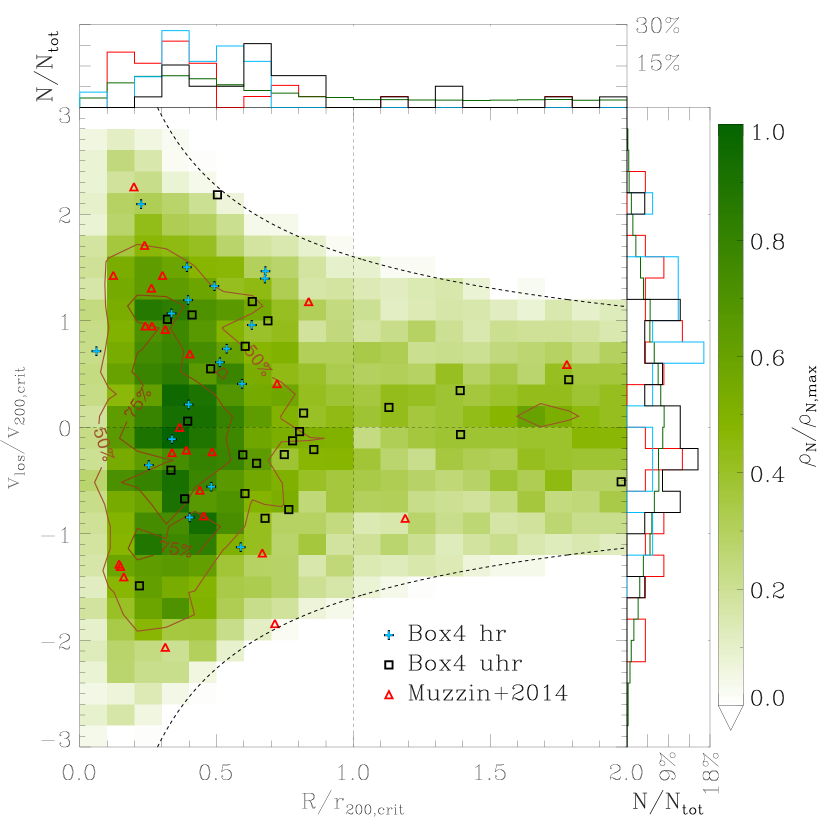
In Figure 12, we show the normalised line-of-sight phase space velocity of PSBs at as a function of the cluster-centric 2D projected radius, , for both Box2 and Box2b (green density). Box2 and Box2b results are compared to our high (blue crosses) and ultra-high resolution Box4 (black squares), as well as to observations by Muzzin et al. (2014) (red triangles). Galaxies with the lower stellar mass threshold of are shown, previously used in Lotz et al. (2019). We compared this lower stellar mass threshold with our standard stellar mass threshold () and established the convergence of our results. We choose the lower stellar mass cut, so as to increase our phase space sampling (relevant especially to Figure 14).
Magneticum PSBs are shown as density maps and are scaled to the maximum density of the PSB galaxy population. The dashed black lines enveloping the density map in Figure 12 are based on the virial theorem and are introduced to provide a relationship between the velocity and the radius via . A proportionality factor of is introduced to scale the enveloping dashed black lines. The factor is motivated by the strongest outlier of the observational data (Muzzin et al., 2014) and is used to filter out interlopers, i.e. galaxies that are only attributed to a cluster due to the line-of-sight projection.
Muzzin et al. (2014) consider data based on the Gemini Cluster Astrophysics Spectroscopic Survey (GCLASS). They investigate the line-of-sight phase space of these cluster galaxies at , of which are identified as PSBs according to an absence of emission while also hosting a young stellar population () (Zahid & Geller, 2017).
To sample a similar volume as the observations, a cylinder of height was used. The cylinder height was calculated by evaluating the scatter around the mean observed redshift, , resulting in (van der Burg et al., 2013). The projections were considered along three linearly independent spatial axes. We identified PSBs in clusters.
Figure 12 shows that both the PSBs identified by Muzzin et al. (2014) and by Magneticum exhibit a strong preference for the inner region of the clusters. The inner over-density of PSBs found between matches observations well. Of the identified PSBs, , i.e. , are found inside . A subset of satellite galaxies, i.e. , are even found inside . The normalised distributions projected onto each axis further demonstrate the close agreement between observations and our simulation. The PSB galaxy preference for a distinct region of phase space, namely , suggests a common cause: Most likely an environmental quenching mechanism leads to the shutdown of previously (strongly) star-forming galaxies on a timescale that brings them about halfway through the cluster until star formation is shutdown. This agrees with previous phase space results concerning the fast quenching of star-forming satellite galaxies in clusters (Lotz et al., 2019).
To test numerical convergence we compare our results with Box4 at high and ultra-high resolution, the latter having a times higher mass resolution than the former. As Box4 is significantly smaller than Box2 or Box2b (see Section 2.1), both resolution levels only yield cluster within the mass range . The clusters host unique ultra-high and unique high resolution PSBs, respectively. When considering three linearly independent projections, this yields a sample of ultra-high and high resolution PSBs.
Figure 12 shows agreement between high and ultra-high resolution PSBs, as well as between different boxes. Similarly to Box2 and Box2b, Box4 PSBs (both resolution levels) are also predominantly found within the inner cluster region. Although the 2D projected radial scatter is stronger for the larger ultra-high resolution PSB sample (black squares) compared to the smaller high resolution PSB sample (blue crosses), the difference does not exceed the expected statistical variation. Meanwhile, the normalised line-of-sight phase space velocity distributions of the two resolution levels, different boxes, and observations shows consistent agreement. In general, the numerical convergence of our results and the associated implications are discussed in Section 7.5.
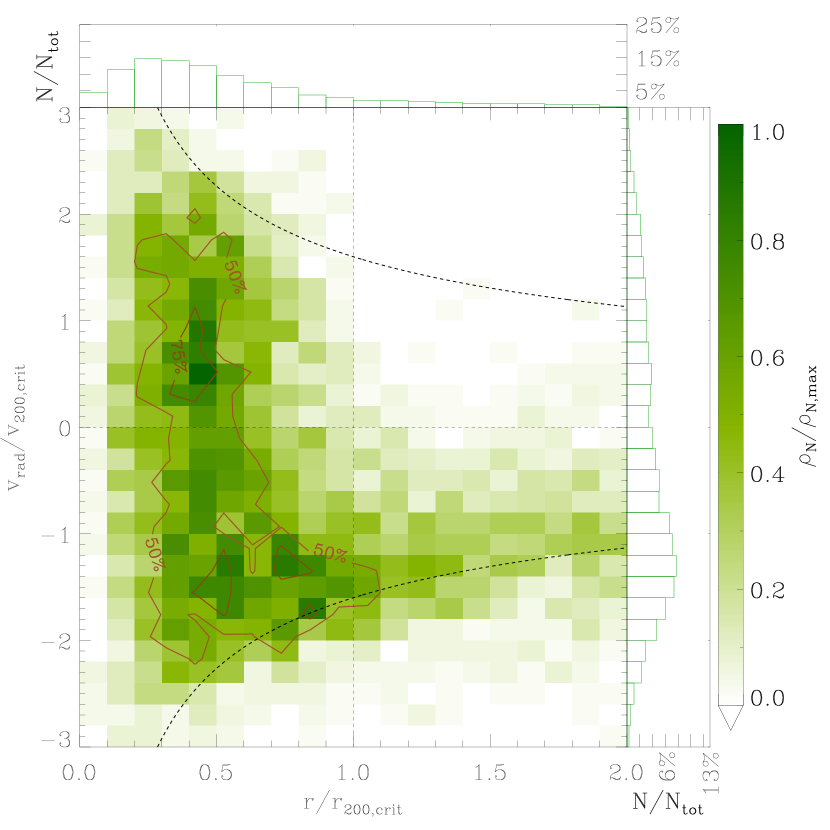
6.3 Radial velocity as a function of cluster mass and redshift
To better disentangle the underlying mechanisms potentially involved in triggering the starburst and subsequent shutdown in star formation of PSBs in galaxy cluster environments, we extend our investigation beyond the line-of-sight phase space observational comparison. Using much of the same nomenclature as Figure 12, Figure 13 shows the PSBs within a 3D sphere instead of projections. Thus, Figure 13 no longer shows the PSBs inside a cylindrical volume which is the basis of the projected line-of-sight population but a 3D sphere of radius , and therefore the sample of PSBs is smaller, i.e. only PSBs are plotted. Of this population, PSBs (or ) are infalling, i.e. . This is similar to the infalling PSBs found in the line-of-sight population. In addition to PSBs typically being characterised by infall, Figure 13 shows an abundance of PSBs in the inner cluster region. Furthermore, it appears that the PSB population, when compared to e.g. the older quiescent cluster population in Lotz et al. (2019), is not well mixed within the cluster, clearly indicating a recent infall.
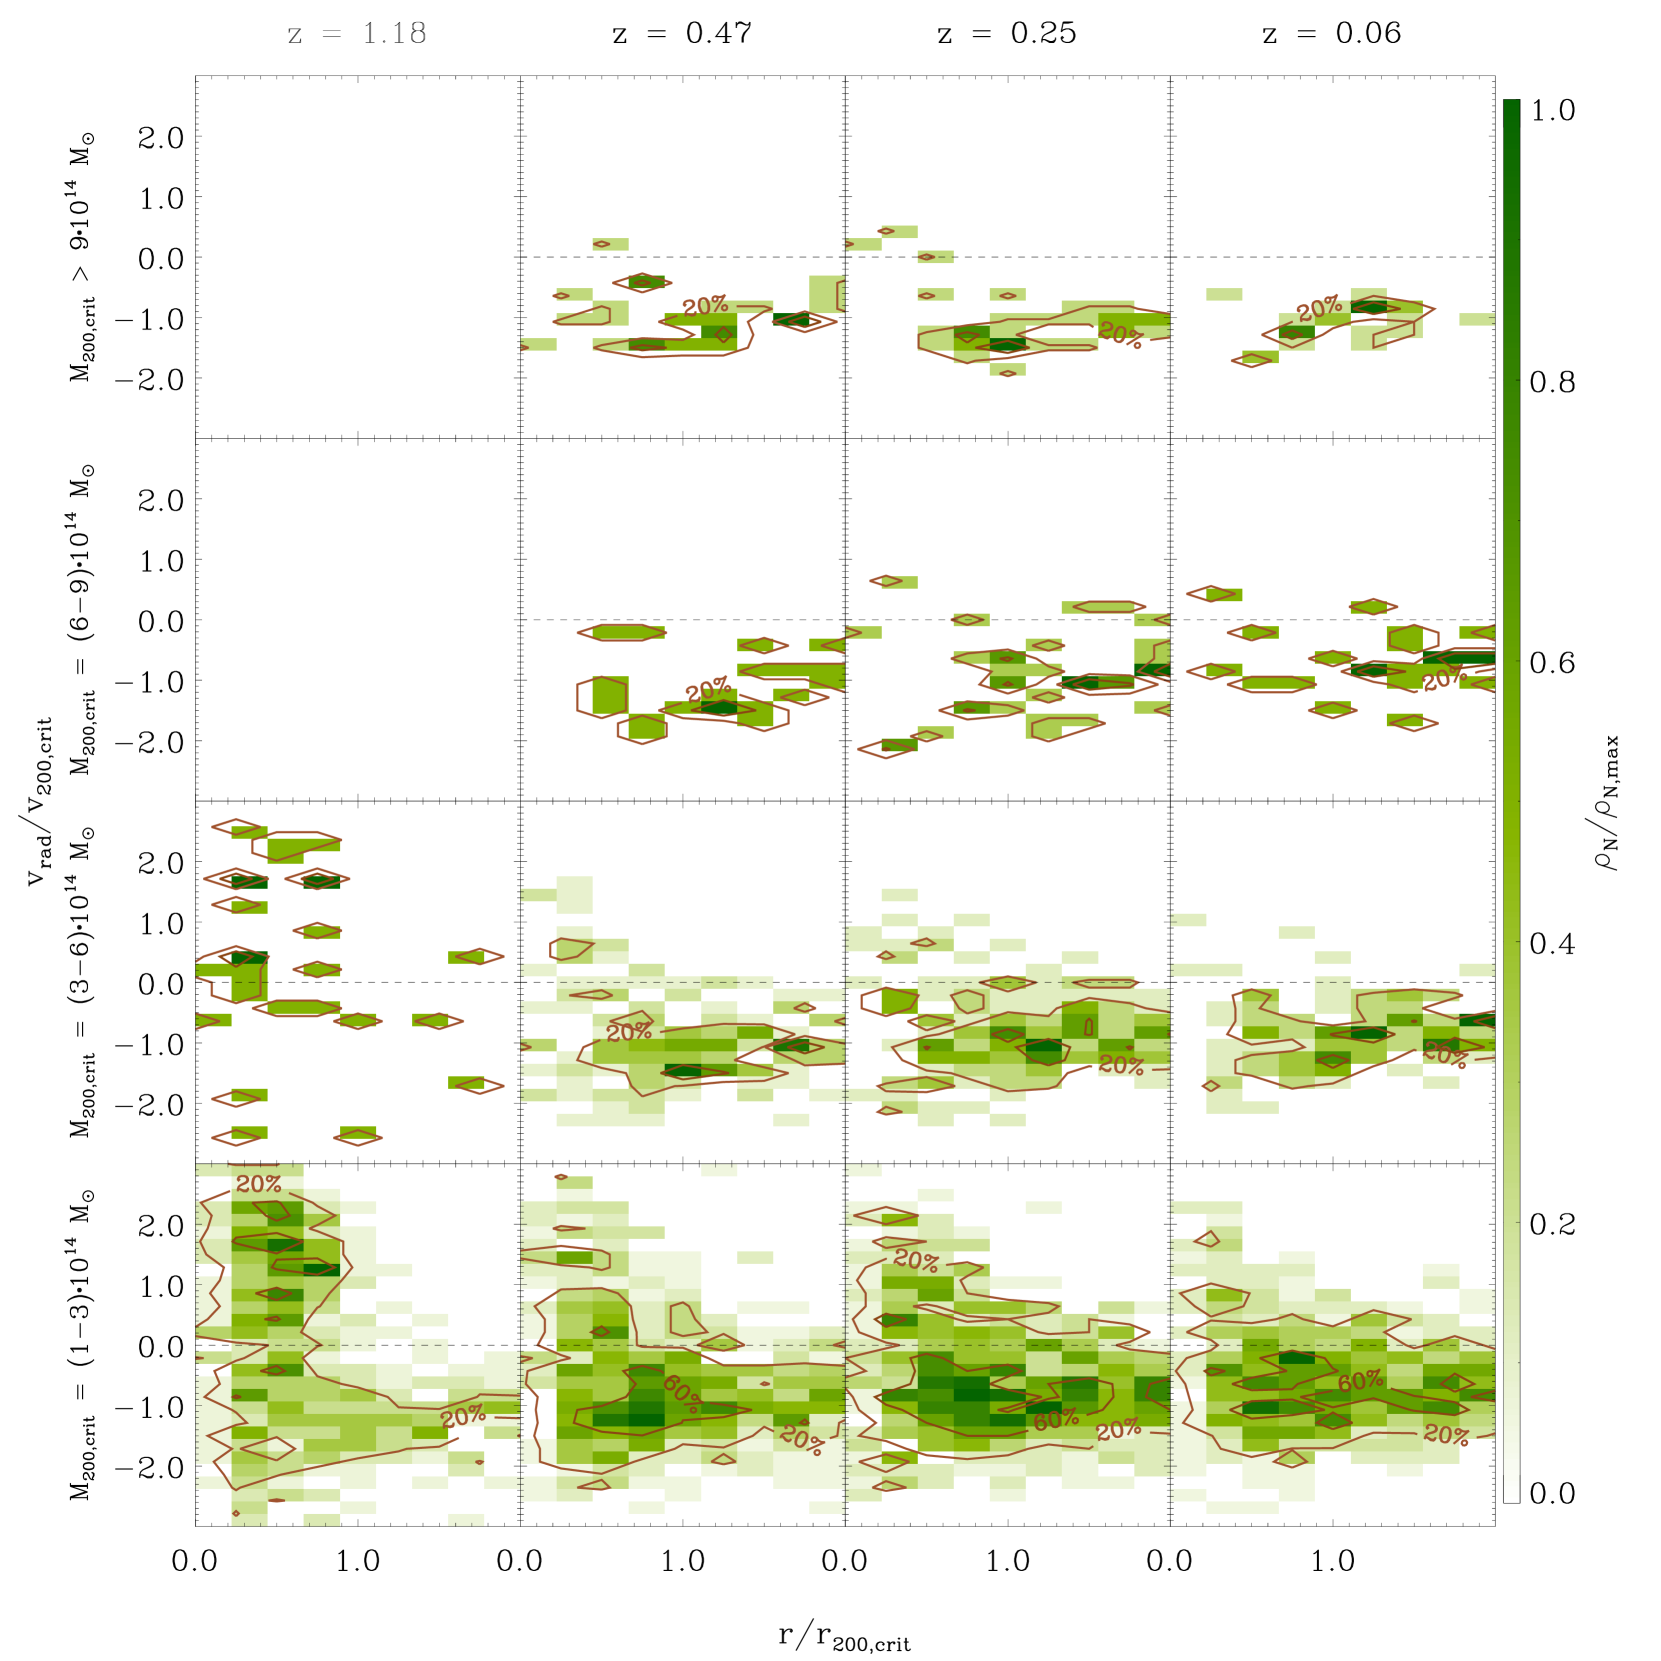
We analyse the normalised radial velocity of cluster PSBs as a function of the 3D cluster-centric radius at different cluster masses and redshifts. Figure 14 shows an overview of four different cluster mass ranges at redshifts . We find that cluster PSBs in all halo mass ranges at redshifts have unusually negative radial velocities, i.e. they are in the process of infall. This means that they are either on their first infall into the cluster or are returning to the cluster after they have left it, typically referred to as backsplash galaxies (Pimbblet, 2011). However, when evaluating cluster PSBs, we find negligible evidence for backsplash orbits, rather the vast majority of cluster PSBs are experiencing their first infall.
In addition to showing that cluster PSBs are overwhelmingly characterised by infall, Figure 14 also reveals two important trends: First, cluster PSBs become increasingly infall dominated towards higher cluster masses, suggesting a density dependent environmental quenching mechanisms, such as ram-pressure stripping. This agrees with observations, which find that processes linked to the termination of star formation in galaxy clusters are more effective in denser environments (Poggianti et al., 2009; Raichoor & Andreon, 2012). For example, ram-pressure stripping is linearly dependent on the intra-cluster-medium (ICM) density, thus higher mass clusters are more efficient in quenching, i.e. the quenching timescale is shorter (Gunn & Gott, 1972; Lotz et al., 2019). In this case, higher mass clusters show an increased likelihood of cluster PSBs being fully quenched before they pass their pericenter.
Second, we find that cluster PSBs become slightly more infall dominated towards lower redshifts, especially visible in the transition from to in the lowest cluster mass regime in Figure 14. This is likely driven by the fact that clusters at , compared to clusters in the same mass range at , have an increased likelihood of currently undergoing cluster mergers. In other words, clusters at are typically not relaxed, while clusters of similar mass at have had enough time to at least centrally relax. Therefore, the same mass clusters at are on average more disturbed, which in turn implies a less relaxed and hot ICM. Under these circumstances, the quenching efficiency is inhibited and thus cluster PSBs, on average, are able to penetrate deeper into the galaxy cluster before ram-pressure stripping quenching is efficient.
Considering these findings a picture of cluster PSB galaxy evolution in our simulation emerges, which strongly favours environmental quenching, e.g. ram-pressure stripping, as the responsible shutdown mechanism of cluster PSBs, in contrast to our results found for the field PSBs. Specifically, independent of whether an additional starburst is triggered during cluster infall or the PSB progenitors were previously experiencing significant star formation, the cluster environment appears to shut down the star formation during infall. This rapid shutdown increases the likelihood of previously star-forming/star-bursting galaxies to be classified as PSBs. Consequently, it appears that PSBs in galaxy clusters share a similar shutdown mechanism, rather than necessarily sharing the same SFR increasing mechanism.
6.4 Cluster merger statistics
Following the same approach as in Section 4.2, we analyse merger abundances in Table 5 to understand their statistical relevance to the evolution of cluster PSBs. Of the 411 projection independent PSBs with stellar mass identified within galaxy clusters in Box2 at , we successfully trace 410 PSBs to , i.e. over a time-span of Gyr.
| Criterion | PSBs | QSMMC | SFSMMC |
|---|---|---|---|
| Analysed trees | 410 | 409 | 405 |
| 370 | 197 | 400 | |
| 290 | 98 | 293 | |
| 216 | 94 | 238 | |
When comparing cluster PSBs (Table 5) with non environmentally selected PSBs (Table 3) in the redshift range , we find very similar merger abundances for all samples. For example, of cluster PSBs and of non environmentally selected PSBs both at have experienced at least one merger event within the last Gyr. Additionally the similarity between the PSB and SFSMMC sample appears independent of the environment surveyed, further providing evidence for the importance of mergers for (recently) star-forming galaxies in our simulation. The only difference we find between Tables 5 and 3 is a slightly higher abundance of mini () and minor () mergers and a slightly lower abundance of major mergers () in cluster PSBs, compared to mini (), minor (), and major () mergers of non environmentally selected PSBs. Beyond these small differences the abundances found in Table 5 agree with the analysis presented in Section 4.2.
6.5 Active galactic nuclei and supernovae
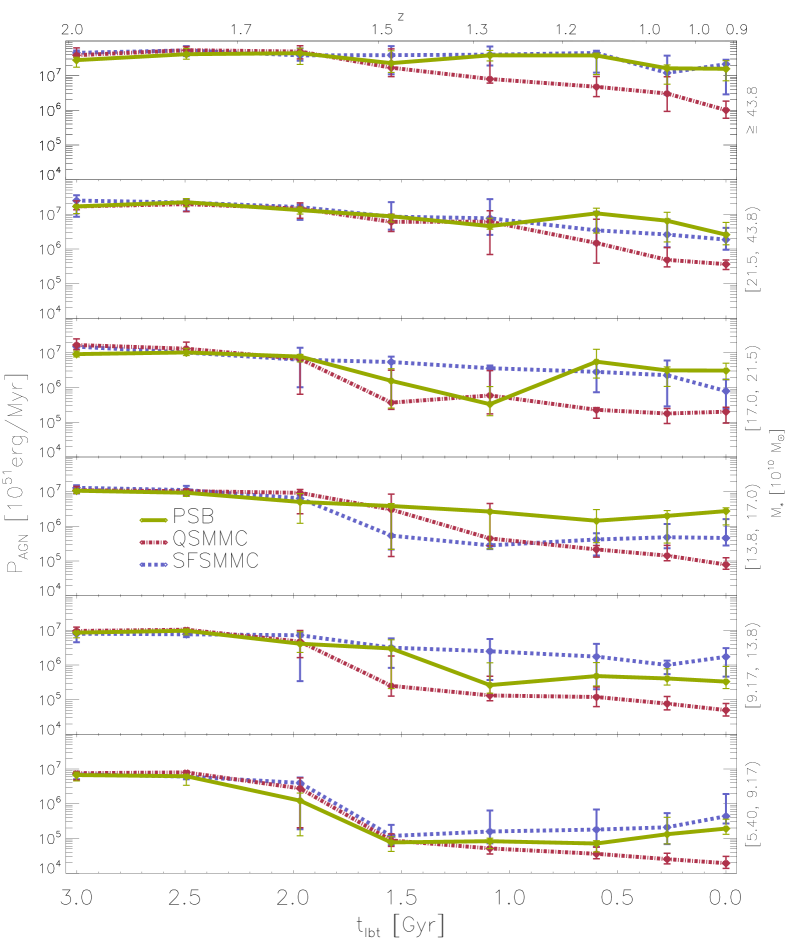
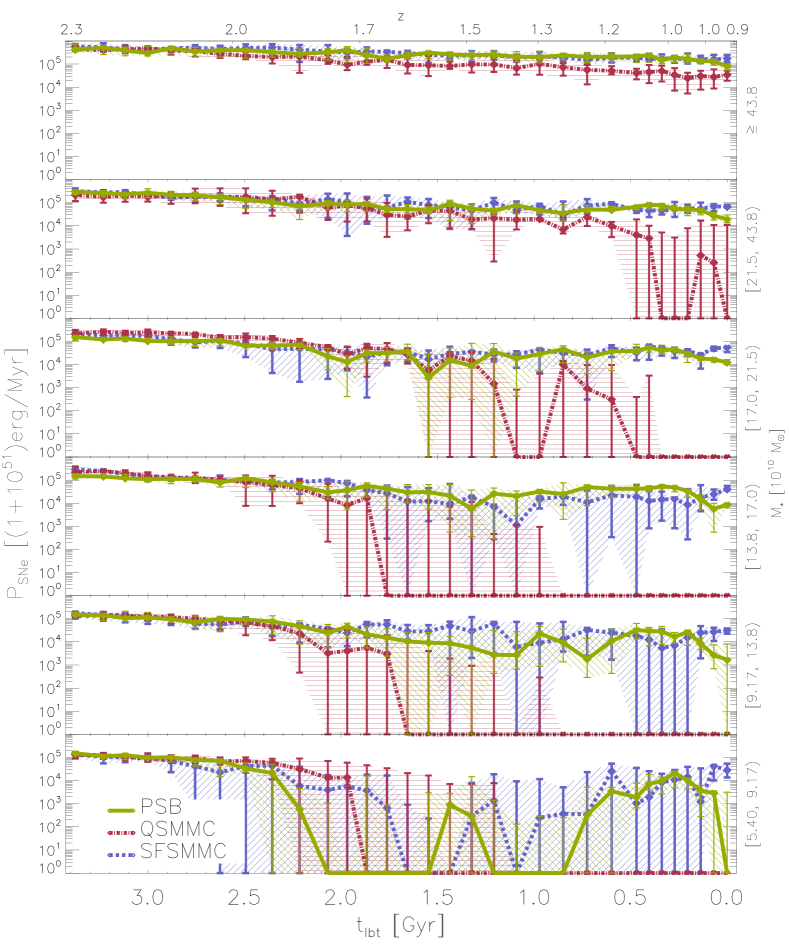
As observations suggest that ram-pressure stripping may trigger AGN activity (Poggianti et al., 2017; George et al., 2019; Poggianti et al., 2021), we investigate the AGN and SNe feedback of cluster PSBs at . We follow the method presented in Section 5.1 closely, with the exception that, instead of using the global PSB sample, we use the cluster PSB sample presented in Table 5. Following the same nomenclature as Figure 8, Figure 15 shows the AGN (left) and SNe (right) power output for the PSB (green), SFSMMC (blue), and QSMMC (red) samples. We note that Gyr corresponds to the identification redshift . Furthermore, we note that at the time-steps in our simulation become larger, which leads the change in abundance of data points in Figure 15 at Gyr. As the feedback energy is normalised per unit time, this does not impact our results.
Figure 15 (left) shows no clear signs of an increase in recent AGN activity. As established in Section 6.3, cluster PSBs belong to a population of recently in-fallen galaxies. Consequently, if ram-pressure stripping would trigger AGN feedback, we would expect a signal within the last Gyr (Lotz et al., 2019). However, we find no evidence for enhanced AGN activity. In fact, it appears that the AGN activity for all samples has been (gradually) declining since Gyr. Furthermore, there appears to be no strong stellar mass evolution for the PSB and SFSMMC samples. Only the QSMMC sample shows signs of a stellar mass evolution: As the stellar mass increases, the onset of the decline in AGN activity at Gyr begins earlier, while the QSMMC AGN power output at Gyr increases by a factor between the lowest and highest stellar mass selection.
In contrast, the SNe power output, i.e. the SFR, shows signs of small increase in activity starting at Gyr for both the PSB and SFSMMC sample. However, as Figure 15 (right) shows, at Gyr the PSB and SFSMMC samples diverge: The PSBs experience a short timescale decrease in star formation, reaching quiescent levels of star formation according to our blueness criterion, while the SFSMMC galaxies continue to experience an elevated star formation with signs of a small increase. The fact that SFSMMC galaxies are able to sustain star formation despite being located in a high density environment is likely due to their tangential infall orbits, ideally at large cluster-centric radii (Lotz et al., 2019). Figure 15 (right) also appears to show no indication of a stellar mass evolution: The only exception being the QSMMC sample, which appears to be characterised by more recent quenching with increasing stellar mass.
Generally, integrated over the evaluated time-span, both the AGN and SNe feedback shown in Figure 15 is significantly stronger than at in Figure 8. As discussed in Section 5.2, recent BH seeding leads to an over-estimation of BH growth. Given the same stellar mass threshold, this becomes more relevant towards higher redshift, as galaxies need to assemble their mass in a shorter time period, i.e. more rapidly. As such, it appears likely that recent BH seeding impacts our cluster sample. This likely explains the strong median AGN feedback at high look-back-times. Nonetheless, the fact that the AGN feedback does not increase towards recent look-back-times holds and suggests that AGN feedback is not relevant to shutting down star formation in cluster PSBs. This is further supported by the similarity in AGN feedback between the PSB and SFSMMC sample: While the former population is quenched at Gyr, the latter is not. Compared to low redshift, we also find a higher median SNe feedback at . This, however, appears purely physical as the star formation, and thus the SNe feedback, was significantly stronger at higher redshift compared to low redshift (Heavens et al., 2004). To conclude, we find that cluster PSBs are shutdown via environmental quenching with no evidence that additional galactic feedback is triggered.
7 Discussion
7.1 Environment and redshift evolution
We find that PSBs at low redshift are more frequently found in low halo mass environments and that the PSB-to-quenched fraction increases with redshift (Figure 1). The preference for low halo masses is further strengthened by the fact that of PSBs are found in halos with (Table 4). This agrees with DEEP2 and SDSS results which find low redshift PSBs in relatively under-dense environments (Goto, 2005) compared to high redshift PSBs (Yan et al., 2009). Similarly to the decline of the PSB-to-quenched fraction with decreasing redshift found in our simulation (Figure 1), observations also show that the fraction of PSBs declines from of the total population at , to by (Wild et al., 2016). We note that MOSFIRE observations at find a higher number of PSBs, relative to star-forming galaxies, in clusters than in groups or the field (Lemaux et al., 2017). Considering that we determine the abundance of PSBs with respect to quiescent galaxies, a comparison is difficult, however, as fewer star-forming than quiescent galaxies are found in high density environments (Dressler, 1980; Goto et al., 2003), and our PSB-to-quenched fraction does not show a strong preference for low halo mass at (Figure 1), agreement seems plausible. Given these points, it appears that PSB galaxy evolution is strongly redshift dependent, favouring decreasing environmental densities towards lower redshifts, supporting the idea that the formation mechanism of PSBs is affected by redshift and environment.
Similarly, we also find a strong stellar mass function evolution (Figure 2): The abundance of PSBs above our stellar mass threshold increases significantly with increasing redshift, matching VVDS observations which find that the stellar mass density () of strong PSB galaxies is times higher at than at (Wild et al., 2009). In contrast, when comparing the PSB galaxy stellar mass function shape to observations at redshifts (Wild et al., 2016; Rowlands et al., 2018) and the observations with each other, we do not find close agreement. These discrepancies are likely due to the stellar mass function sensitivity to the exact selection criteria of PSBs. Interestingly, when comparing the PSB stellar mass function at to observations in the group and cluster environment (Figure 11), we find close agreement, including the double Schechter behaviour.
7.2 The impact of mergers
Evaluating PSBs in relation to the star-forming main sequence (Figure 5) shows that during their starburst phase, which is often correlated with recent mergers (Figure 9 and Table 2), massive PSBs are found significantly above the normalised redshift evolving main sequence (Speagle et al., 2014). Considering our global low redshift PSB sample, of which have experienced a merger in the last Gyr, we find that during peak star formation PSBs have SFRs which are a few times higher than on the main sequence, with a wide spread in their distribution. This behaviour matches observations by Pearson et al. (2019), which, on the one hand, find that mergers have little effect on the SFR for the majority of merging galaxies, but, on the other hand, also find that an increasing merger fraction correlates with the distance above the main sequence, i.e. at sometimes mergers may induce starbursts. Furthermore, simulations by Di Matteo et al. (2008) suggest that strong starbursts, where the SFR is increased by a factor , are rare and only found in of major galaxy interactions and mergers. Hani et al. (2020) highlights the impact of mergers on the SFR: Star-forming post-merger galaxies, which make up of their post-merger galaxies identified in the IllustrisTNG simulation experience on average a SFR increase by a factor of . This behaviour is in qualitative agreement with the correlation between mergers and the SFR increase found in our star-forming and, to a stronger extent, PSB galaxies (Figure 5). Additionally, when studying adjacent galaxies in IllustrisTNG, Patton et al. (2020) find that the presence of closest companions boost the average specific SFR of massive galaxies by . This agrees with our study of an individual PSB in Figure 6, where we find an increase in star formation prior to identifying a merger event while another galaxy is in close proximity.
Figure 5 also shows that of the tracked PSBs were previously quiescent, i.e. have undergone rejuvenation. When comparing quiescently star-forming, quenching, and rejuvenating galaxies in the EAGLE simulation, Trayford et al. (2016) find that and of all galaxies can be characterised as fast and slow rejuvenating galaxies, respectively. In other words, although (fast) rejuvenation is generally rare, rejuvenation may well be a relevant pathway for the evolution of PSBs. Consistent with the high merger abundances throughout our PSB sample, observations find quiescent galaxies may undergo rejuvenation events, e.g. via (gas rich) minor mergers, triggering the required starburst phase found in PSBs (Fang et al., 2012; Young et al., 2014; Belli et al., 2017; Yesuf & Ho, 2020).
Even when solely considering isolated merger simulations, much of the ambiguity concerning the quenching impact of mergers remains (Karademir et al., 2019): Different types of mergers have been associated with varying quenching impacts, both directly, e.g. by introducing turbulence (Ellison et al., 2018), and indirectly, e.g. by facilitating BH growth (Hopkins et al., 2013; Barai et al., 2014). For example, binary galaxy merger simulations find that the termination of star formation by BH feedback in disc galaxies is significantly less important for higher progenitor mass ratios (Johansson et al., 2008, 2009a). Similar studies find that galaxies, which are dominated by minor merging and smooth accretion in their late formation history (, experience an energy release via gravitational heating which is sufficient to form red and dead elliptical galaxies by , even in the absence of SNe and AGN feedback (Johansson et al., 2009b). Meanwhile, SPH simulations of major mergers demonstrate that consistency with observations does not require BH feedback to terminate star formation in massive galaxies or unbind large quantities of cold gas (Debuhr et al., 2011). When linking the BH accretion rate with the galaxy-wide SFR, the disc galaxy mergers in the hydrodynamical simulations by Volonteri et al. (2015), typically find no temporal correlation and different variability timescales. However, when averaging over time during Gyr long merger events, they find a typical increase of a factor of a few in the ratio of BH accretion rate to SFR (Volonteri et al., 2015). This qualitatively agrees with our results shown in Figures 8 and 9, that the recent AGN feedback increase in PSB and star-forming galaxies correlates with high merger abundances. Note, however, that not all simulations agree in that mergers and AGN feedback are correlated (e.g. Hayward et al. (2014)).
The ambiguous nature of merger impacts is also reflected in our results: Using a statistical approach, i.e. comparing merger abundances at (Table 2), we find that of PSBs, of quenched (QSMMC), and of star-forming stellar mass matched control (SFSMMC) galaxies experience at least one merger within the last Gyr. The high merger abundance found in both our PSB and our SFSMMC sample highlights the varying merger impact: While our PSB sample is considered quiescent at , the reverse is true for SFSMMC galaxies with similarly rich merger histories, especially compared to the QSMMC sample. A similar behaviour is found when considering merger abundances at (Table 3). Our high merger abundance broadly agrees with observations of local PSBs in SDSS, which, in their youngest age bin (Gyr), classify at least of PSBs, far more than their control sample, as distorted or merging galaxies Meusinger et al. (2017). Generally, observations of PSBs in the local low density Universe are associated with galaxy-galaxy interactions and galaxy mergers (Zabludoff et al., 1996; Bekki et al., 2001; Yang et al., 2008; Pracy et al., 2009; Pawlik et al., 2018), in excellent agreement with our results.
When evaluating the cold gas fractions of PSB, QSMMC, and SFSMMC progenitors within three half-mass radii (Figure 7), we find general agreement between PSB and SFSMMC progenitors: Both show a preference for higher cold gas fractions compared to QSMMC progenitors. This is in line with observations, which find evidence for gas-rich mergers triggering central starbursts (Pawlik et al., 2018; D’Eugenio et al., 2020), fast quenching (Belli et al., 2019), and that recently merged galaxies typically are a factor of more atomic hydrogen rich than control galaxies at the same stellar mass (Ellison et al., 2018).
With regard to cold gas fractions, the only difference between PSB and SFSMMC galaxies is found for the satellite progenitor populations in major mergers (Figure 7): The major merger satellite progenitors of PSBs are characterised by a lower cold gas fraction (almost half) compared to the SFSMMC sample. The subsequent lower cold gas content of post-merger PSBs, compared to SFSMMC galaxies, may be linked to a higher likelihood of a subsequent shutdown in star formation for two reasons: First, less cold gas is available to maintain star formation. Second, given a similar onset of merger triggered AGN feedback, the same amount of energy is distributed across a smaller supply of cold gas, quickening its heating and/or redistribution.
7.3 Shutting down star formation
As shown for our global PSB sample (Figure 8) and the subset of six massive PSBs (Figure 9), we find a significant increase in AGN feedback at recent look-back-times and towards higher stellar masses. The importance of AGN feedback in shutting down PSBs is also evidenced by the decreasing agreement between the otherwise often similarly behaving PSB and SFSMMC sample with increasing stellar mass. As the fraction of galaxies hosting an AGN is a strong function of stellar mass (Best et al., 2005), the apparent lack of strong AGN activity in the SFSMMC sample, compared to the PSB sample at high stellar masses, is a strong indicator of the AGN quenching effectiveness. In addition, the short shutdown timescale (Figure 5), the redistribution and heating of gas (Figure 6), the correlated BH growth (Figures 10), and the comparatively weak SNe energy (Figure 8) all suggest that merger triggered AGN feedback generally is the dominant shutdown mechanism of PSBs at low redshift. However, we can neither fully exclude other causes, nor do all PSBs necessarily experience the same shutdown sequence. Nonetheless, it appears likely that merger facilitated BH growth, which triggers AGN feedback, plays an important, albeit not necessarily exclusive, role in mediating between the starburst and post-starburst phase within our simulation at low redshifts. This agrees with previous Magneticum results, which found that merger events are not statistically dominant in fuelling mechanisms for nuclear activity, while still finding elevated merger fractions in AGN hosting galaxies compared to inactive galaxies, pointing towards an intrinsic connection between AGN and mergers (Steinborn et al., 2018). Generally, the importance of AGN feedback in explaining the sharp decline in the SFR found in (PSB) galaxies is also supported by several other works (Springel et al., 2005; Hopkins et al., 2013; Calabrò et al., 2019; Lanz et al., 2020).
We find evidence for the simultaneous mechanical expulsion and heating of previously star-forming cold gas (Figure 6). The rapid shutdown in this and similar examples (Figure 5) happens on timescales of Gyr, which, due to the short timescale, generally favours AGN feedback as the expected quenching mechanism (Wild et al., 2020). Although much of the dense cold gas is heated, some cold gas remains in the recently quenched galaxy (Figure 6). The fact that significant amounts of cold gas are redistributed on short timescales rather than only being directly heated may provide an explanation to observations which find significant non star-forming (molecular) gas reservoirs in PSBs (Zwaan et al., 2013; French et al., 2015). This also agrees with other simulations, suggesting that the SFR is quenched with feedback via gas removal, with little effect on the SFR via gas heating (Barai et al., 2014). Furthermore, the large amounts of molecular gas found in PSBs rules out processes such as gas depletion, expulsion, and/or starvation as the dominant shutdown mechanisms (French et al., 2015), which is supported by the results presented in this work.
7.4 Post-starburst galaxies in galaxy clusters
Cluster PSBs are typically infalling, especially towards lower redshift and higher cluster masses (Figure 14). This matches previous results concerning the quenching of satellite galaxies in clusters (Lotz et al., 2019), showing that star-forming galaxies are more likely to be on their first infall, especially for higher mass clusters, indicating that ram-pressure stripping typically quickly shuts down star formation already during the first infall of satellite galaxies. This higher quenching effectiveness matches other simulations which find a similar significant enhancement of ram-pressure stripping in massive halos compared to less massive halos (Arthur et al., 2019). In fact, several observations suggest that environmental quenching mechanisms, such as interactions with the ICM (Poggianti et al., 2009; Pracy et al., 2010) or specifically ram-pressure stripping (Gavazzi et al., 2013; Gullieuszik et al., 2017; Paccagnella et al., 2019), are responsible for the abundance of PSBs in galaxy clusters.
Generally, different populations of satellite galaxies, e.g. infalling, backsplash and virialised, occupy distinct regions of phase space (Oman et al., 2013). Hence, the clear preference of cluster PSBs for infall (Figure 14) provides a strong indication for environmental quenching such as ram-pressure stripping. This is also reflected in the PSB galaxy preference for distinct cluster-centric radii () found in projections (Figure 12), showing excellent agreement with observations (Muzzin et al., 2014). It also agrees with SAMI observations of recently quenched cluster galaxies, which are exclusively found within and show a significantly higher velocity dispersion relative to the cluster population (Owers et al., 2019). Similarly, GASP observations find that PSB galaxies avoid cluster cores and are characterised by a large range in relative velocities (Vulcani et al., 2020a). Furthermore, both the SAMI and GASP phase space behaviour is consistent with recent infall, suggesting that PSBs could be descendants of galaxies which were quenched during first infall via ram-pressure stripping (Owers et al., 2019; Vulcani et al., 2020a). Providing multiple lines of evidence, Vulcani et al. (2020a) conclude that the outside-in quenching (Owers et al., 2019; Matharu et al., 2020), the morphology, and kinematics of the stellar component, along with the position of GASP PSBs within massive clusters point to a scenario in which ram-pressure stripping has shutdown star formation via gas removal. This is in excellent agreement with our findings.
When comparing merger abundances at between non environmentally selected PSBs (Table 3) and cluster PSBs in (Table 5), we find broad agreement: Both samples are characterised by high merger abundances, i.e. in both samples of PSBs experience at least one merger event in the past Gyr. In contrast to the non environmentally selected sample, cluster galaxies have slightly fewer major mergers ( vs. for PSBs). It appears that mergers are important in enabling the conditions necessary for (strong) star formation in cluster PSB progenitors, while it remains unclear what impact they have on shutting down star formation in cluster PSBs. In contrast to the majority of cluster PSB galaxy observations, observations of the Cl J1604 supercluster at indicate that galaxy mergers are the principal mechanism for producing PSBs in clusters, while both interactions between galaxies and with the ICM also appear effective (Wu et al., 2014). As found by observations (Owers et al., 2019; Vulcani et al., 2020a) and our results (Figure 14), cluster PSBs belong to a population of recently in-fallen galaxies. Hence, it appears likely that PSB progenitors have had ample opportunity to experience mergers in the outskirts of clusters prior to infall, likely positively impacting recent star formation, thereby building a young stellar population necessary for their later identification as PSBs. As discussed in Section 7.2, the impact of mergers is varied and need not lead to a subsequent shutdown in star formation, e.g. via triggering AGN feedback. It seems plausible that ram-pressure stripping is more efficient in shutting down star formation than merger triggered mechanisms, and hence is the dominant shutdown mechanism in cluster PSBs.
In a previous paper, we found evidence for a starburst after satellite galaxies first fall into their respective clusters, i.e. after crossing the cluster virial radius for the first time (Lotz et al., 2019). Specifically, we found that the average normalised blueness, i.e. , of satellite galaxies with stellar masses shows a significant starburst lasting Gyr. As discussed by Lotz et al. (2019), this is likely driven by the onset of ram-pressure stripping which triggers a short starburst, followed by a complete shutdown in star formation within Gyr, often on shorter timescales. Observations of local cluster galaxies undergoing ram-pressure stripping come to similar conclusions: Ram-pressure likely drives an enhancement in star formation prior to quenching (Vulcani et al., 2018; Roberts & Parker, 2020). Similarly, cluster galaxies undergoing ram-pressure stripping in the GASP sample show a systematic enhancement of the star formation rate: As the excess is found at all galacto-centric distances within the discs and is independent of both the degree of stripping and star formation in the tails, Vulcani et al. (2020b) suggest that the star formation is most likely induced by compression waves triggered by ram-pressure stripping. Furthermore, HST observations have found strong evidence of ram-pressure stripping first shock compressing and subsequently expelling large quantities of gas from infalling cluster galaxies, which experience violent starbursts during this intense period (Ebeling et al., 2014). When evaluating the median SNe feedback, i.e. the SFR, at for cluster PSBs (Figure 15), we find on average no evidence for a strong starburst at recent look-back-times. However, this signal likely correlates more strongly with cluster-centric radius (e.g. Lotz et al. (2019)). Hence it does not seem surprising that we find no signal. To better understand cluster PSB galaxy evolution, we also investigated whether cluster PSBs are found in the vicinity or crossing of cluster shock fronts: We found no evidence for an increased abundance of cluster PSBs near shocks.
Observations of GASP jellyfish galaxies undergoing strong ram-pressure stripping find that the majority host an AGN (Poggianti et al., 2017; George et al., 2019; Poggianti et al., 2021) and that the suppression of star formation in the central region is driven by AGN feedback (Radovich et al., 2019). Similarly, the Romulus C simulation finds evidence for ram-pressure stripping triggering AGN feedback, which may aid in the quenching process (Ricarte et al., 2020). When comparing these results to our study of median AGN feedback in cluster PSBs at (Figure 15), we find no evidence for a recent increase in AGN feedback. However, we note that such an increase would likely correlate more strongly when evaluating the AGN feedback as a function of cluster-centric radius, which goes beyond the scope of this paper. While observations based on the UKIDSS UDS conclude that a combination of environmental and secular processes are most likely to explain the appearance of PSBs in galaxy clusters (Socolovsky et al., 2019), all our evidence (Figures 14 and 15) suggests that environmental quenching in the form of ram-pressure stripping leads to the shutdown in star formation found in our cluster PSBs.
7.5 Numerical considerations
In addition to the ambiguous involvement of various physical mechanisms, the implementation and approximation of known physical mechanisms in simulations comes with its own set of challenges. For example, many simulations underestimate the effectiveness of feedback due to excessive radiative losses (Dalla Vecchia & Schaye, 2012), which, in turn, are the result of a lack of resolution and insufficiently realistic modelling of the interstellar medium (Schaye et al., 2015). Zheng et al. (2020) highlights the difficulty of reproducing very young PSBs in simulations, potentially indicating that new sub-resolution star formation recipes are required to properly model the process of star formation quenching.
To test the numerical convergence of our results, we searched for PSBs at ultra-high resolution in Box4. However, due to the low number of PSBs per volume element (Figure 2) and the small volume of Box4 (see Section 2.1), no PSBs were found with stellar mass . Similarly, when evaluating Box4 at ultra-high resolution using the same redshift and cluster mass domain as shown in Figure 14 only one PSB galaxy was identified above our stellar mass threshold (at and in a cluster with ). If we lower the stellar mass threshold to then PSBs at are identified, of which have experienced at least one merger in the last Gyr. We note that fewer recent mergers are expected as stellar mass decreases (Robotham et al., 2014).
This lower stellar mass threshold was also used in Figure 12: Despite the small sample sizes ( PSBs identified when considering three linearly independent projections sampled from unique PSBs), the comparison of individual PSBs at different resolution levels and in different boxes shows agreement. Additionally, we note that the high resolution run of Box4 employs an updated AGN model (Steinborn et al., 2015). In short, the comparison between the different boxes and resolutions has shown that our results do not appear to be driven by the resolution level nor details in the applied AGN model.
Generally, we note that the identification and comparison of Magneticum PSBs to observations may be influenced by a number of effects: As discussed in Lotz et al. (2019), we measure the star formation rate rather than the colour of galaxies. In other words, we determine the star formation directly and instantaneously, rather than via the indirect, at times delayed, observation of local and/or global galactic properties. However, the galaxies selected in Box2 do not reproduce the detailed morphologies, especially concerning the cold thin discs, found in observations. Hence, we cannot capture the details of mechanisms which act on scales similar to our gas softening (). This, for example, becomes relevant during ram-pressure stripping, where cold thin discs, dependent on infall geometry, provide additional shielding compared to more diffuse galactic configurations, thereby impacting quenching efficiencies and timescales. These limitations need to be addressed with the next generation of cosmological simulations.
8 Conclusions
In order to understand the physical mechanisms leading to the formation of post-starburst galaxies (PSBs), i.e. the reasons for both the onset of the initial starburst and the abrupt shutdown in star formation, we studied the environment and temporal evolution of PSBs with stellar mass . To this end, we used Box2 of the hydrodynamical cosmological Magneticum Pathfinder simulations to resolve the behaviour of PSBs at varying redshifts both throughout our whole box volume as well as in specific environments such as galaxy clusters. The principal sample studied consists of PSBs, identified at , i.e. a global sample spanning the whole box volume. Throughout our analysis the behaviour and evolution of PSBs is compared to star-forming (SF) and quiescent (Q) stellar mass matched control (SMMC) galaxy samples at different look-back-times (lbt). Furthermore, Magneticum PSBs are compared with observed quenched fractions (George et al., 2011; Tinker et al., 2013; Wang et al., 2018; Strazzullo et al., 2019), stellar mass functions (Muzzin et al., 2013; Wild et al., 2016; Rowlands et al., 2018), and the star formation main sequence (Speagle et al., 2014; Pearson et al., 2018) at different redshifts. Especially, we compare Magneticum galaxy cluster PSBs to observed high environmental density stellar mass functions (Socolovsky et al., 2018) and the cluster phase space behaviour at high redshift (Muzzin et al., 2014). Our results are summarised as follows:
-
•
At PSBs and SF galaxies both are characterised by an abundance of mergers: of PSB and of SF galaxies experience at least one merger event within the last Gyr, compared to of quiescent galaxies. Over the same time-span, of PSB, of SF, and of quiescent galaxies experience at least one major merger ( ratio: > 1:3) event. This established similarity in merger abundances between PSB and SF galaxies is also found at redshift , both when evaluating the entire box volume as well as when specifically selecting galaxy cluster environments.
-
•
Inspecting PSB, quiescent, and SF galaxies with , we find that the AGN feedback, which is associated with recent mergers, consistently outweighs the supernova (SNe) feedback. Within the last Gyr, the difference between AGN and SNe feedback increases significantly: While the maximum median SNe power output for PSBs is erg/Myr, the maximum median AGN power output is erg/Myr. In contrast to the SF galaxies, PSBs are characterised by increasing AGN feedback with increasing stellar mass: At stellar masses , the AGN feedback at of PSBs (erg/Myr) is half an order of magnitude larger than that of SF galaxies (erg/Myr), which, in turn, is significantly larger than that of quenched galaxies (erg/Myr). This strongly indicates that the star formation in PSBs generally is shut down by AGN feedback.
-
•
In our global PSB sample we find that during the star formation shutdown, typically at Gyr, galactic gas, especially previously star-forming gas, is often abruptly heated, while simultaneously being redistributed. This results in a sharp decrease in the (cold) gas density. This is often correlated with a recent strong increase in black hole mass, triggering significant AGN feedback.
-
•
In contrast to SF galaxies, PSBs in our global sample, especially at Gyr, show less spread, i.e. are more continuous in the distribution of SNe feedback energy. As the star formation rate (SFR) linearly impacts the SNe feedback, the smaller spread in the distribution of PSB SNe feedback in combination with slightly elevated median SFRs during recent times, compared to SF galaxies, is a reflection of the recent starburst phase. As the stellar mass increases, the median PSB SNe feedback increases slightly and the difference to SF galaxies, which continue to be associated with a wider distribution in feedback, becomes stronger.
-
•
When evaluating the cold gas content prior to mergers in our global sample, PSB and SF progenitors show similar cold gas fractions within three half-mass radii () for the main progenitors. However, when considering cold gas abundances of satellite progenitors, i.e. not the most massive progenitors prior to major merger events, PSBs are characterised by lower median cold gas fractions () compared to SF satellite progenitors (). This is also reflected in the different abundance of satellite major merger progenitors which have low cold gas fractions: of PSBs compared to of SF galaxies have . This indicates that, statistically, PSBs have less cold gas available following major mergers than SF galaxies, leading to a higher likelihood of a subsequent shutdown in star formation.
-
•
Prior to the star formation shutdown, PSB progenitors exhibit both sustained long term star formation (Gyr), as well as short starbursts (Gyr). During the starbursts, independent of the duration, massive PSB progenitors are found at least a factor of above the redshift evolving main sequence. Of the tracked PSBs in our global sample, are rejuvenated galaxies, i.e. were considered quiescent before their starburst. At , Magneticum Box2 main sequence galaxies agree well with observations, while at our galaxies lie slightly above observations (Speagle et al., 2014; Pearson et al., 2018).
-
•
At Gyr, PSB and SF progenitors from our global sample are rarely found in isolated halos, whereas quenched progenitors are most often found in isolated halos. This initial difference between the PSB and SF versus quenched distribution of galaxies within a given halo, becomes indistinguishable at Gyr. This indicates that common initial conditions, i.e. an abundance, albeit not saturation, of galaxies in the immediate vicinity, are shared among SF and PSB galaxies, enabling the rich merger history found in these populations.
-
•
We compared the Box2 total, SF, quenched, and PSB stellar mass functions (SMF) at multiple redshifts to observations, finding broad agreement (Muzzin et al., 2013; Wild et al., 2016; Rowlands et al., 2018): While the total and quenched SMF agree well with observations over the evaluated redshift range, the agreement for SF galaxies improves with increasing redshift. Meanwhile, PSB SMFs show that both the agreement between simulation and observations, as well as between observations, is subject to variation. When comparing stellar mass functions in group and cluster environments at , we are able to closely reproduce the observations (Socolovsky et al., 2018). In particular, similarly to observations, we also find evidence for a PSB plateau in the stellar mass range in group and cluster environments.
-
•
At redshifts , PSBs are consistently found close to our stellar mass threshold () and at low halo masses. Towards higher redshift the abundance of PSBs increases significantly, especially at higher stellar masses. Overall, the PSB-to-quenched fraction increases with redshift, most significantly between and .
-
•
To compare with line-of-sight (LOS) phase space observations of cluster PSBs at (Muzzin et al., 2014), we environmentally selected PSBs in the same halo mass range () and found close agreement with observations. In particular, cluster PSBs are preferentially located in a narrow region of phase space with projected cluster-centric radii . The fact that both simulated and observed cluster PSBs are found in the same preferential region of phase space suggests a shared environmentally driven mechanism relevant to the formation of PSBs, which is specific to galaxy clusters, such as ram-pressure stripping. When evaluating cluster PSBs at different redshifts and cluster masses, we find that cluster PSBs at are overwhelmingly infall dominated, especially towards higher cluster masses. This further supports the idea that, different to the PSBs in the field, ram-pressure stripping shuts down star formation of previously active galaxies, thus leading to the identification of cluster PSBs within a distinct region of phase space.
-
•
Cluster PSBs further show no signs of significantly increased AGN or SNe feedback at recent look-back-times. In other words, we find no evidence suggesting that AGN feedback is triggered via ram-pressure stripping during cluster infall for PSBs. We also find no evidence that the AGN is responsible for quenching cluster PSBs. This is further supported by the similarity in AGN feedback between the PSB and SF sample: While the former population is quenched at Gyr, the latter is not. Hence, we conclude that cluster PSBs are primarily shut down via environmental quenching, likely ram-pressure stripping.
To summarise, PSBs with stellar mass at typically evolve as follows: First, PSB progenitors, which at Gyr are predominantly found in halos with more than one galaxy, experience a merger event. Specifically, of PSBs experience at least one merger within the last Gyr, with undergoing at least one major merger. Second, the merger provides additional gas and/or facilitates the inflow of gas onto the PSB progenitor, often triggering a starburst phase. After the merger, the BH accretion, and thereby the AGN power output (erg/Myr), typically increases significantly, especially at higher stellar masses. A quick shutdown in star formation follows, which is often accompanied by a dispersal and heating of (previously star-forming) gas. Lastly, a PSB galaxy remains, i.e. a galaxy with a young stellar population and quiescent levels of star formation.
Strikingly, this evolution is different for PSBs found in galaxy clusters: While cluster PSBs also experience an abundance of mergers, leading to star formation enhancement, they are found in a distinct region of phase space, implying a shared environmentally driven quenching mechanisms. Moreover, cluster PSBs are usually experiencing their first infall, especially in higher mass clusters, favouring a density dependent quenching mechanism such as ram-pressure stripping. In other words, although the merger abundance, associated with an increased SFR in cluster PSB progenitors prior to their infall, is similar to our global sample, the reason for the shutdown in star formation is not.
To conclude, we find that PSBs experience starbursts due to merger events, independent of their environment, but the quenching mechanisms strongly depend on environment: While AGN feedback is the dominant quenching mechanism for field PSBs, PSBs in galaxy clusters are quenched by ram-pressure stripping due to the hot cluster environment. Thus, for field galaxies their cold gas fraction prior to quenching from the AGN is important to whether they stay star-forming or become PSBs, while for cluster PSBs their infall orbit is the most important factor for quenching, as discussed already by (Lotz et al., 2019). This likely leads to very different fundamental properties of PSBs in the field and clusters, but to study this in detail remains to be done in a future study.
Acknowledgements
We thank Felix Schulze, Ulrich Steinwandel, Ludwig Böss, and Tadziu Hoffmann for helpful discussions. The Magneticum Pathfinder simulations were partially performed at the Leibniz-Rechenzentrum with CPU time assigned to the Project "pr86re". This work was supported by the Deutsche Forschungsgemeinschaft (DFG, German Research Foundation) under Germany’s Excellence Strategy – EXC-2094 – 390783311. Information on the Magneticum Pathfinder project is available at http://www.magneticum.org.
Data Availability
The data underlying this article will be shared on reasonable request to the corresponding author.
References
- Abazajian et al. (2009) Abazajian K. N., et al., 2009, ApJS, 182, 543
- Aguerri et al. (2018) Aguerri J. A. L., Agulli I., Méndez-Abreu J., 2018, MNRAS, 477, 1921
- Almaini et al. (2017) Almaini O., et al., 2017, MNRAS, 472, 1401
- Arthur et al. (2019) Arthur J., et al., 2019, MNRAS, 484, 3968
- Baldry et al. (2008) Baldry I. K., Glazebrook K., Driver S. P., 2008, MNRAS, 388, 945
- Balogh et al. (1997) Balogh M. L., Morris S. L., Yee H. K. C., Carlberg R. G., Ellingson E., 1997, ApJ, 488, L75
- Balogh et al. (1999) Balogh M. L., Morris S. L., Yee H. K. C., Carlberg R. G., Ellingson E., 1999, ApJ, 527, 54
- Barai et al. (2014) Barai P., Viel M., Murante G., Gaspari M., Borgani S., 2014, MNRAS, 437, 1456
- Baron et al. (2018) Baron D., et al., 2018, MNRAS, 480, 3993
- Baron et al. (2020) Baron D., Netzer H., Davies R. I., Xavier Prochaska J., 2020, MNRAS, 494, 5396
- Beck et al. (2016) Beck A. M., et al., 2016, MNRAS, 455, 2110
- Behroozi et al. (2019) Behroozi P., Wechsler R. H., Hearin A. P., Conroy C., 2019, MNRAS, 488, 3143
- Bekki et al. (2001) Bekki K., Shioya Y., Couch W. J., 2001, ApJ, 547, L17
- Bekki et al. (2005) Bekki K., Couch W. J., Shioya Y., Vazdekis A., 2005, MNRAS, 359, 949
- Belli et al. (2017) Belli S., et al., 2017, ApJ, 841, L6
- Belli et al. (2019) Belli S., Newman A. B., Ellis R. S., 2019, ApJ, 874, 17
- Belloni et al. (1995) Belloni P., Bruzual A. G., Thimm G. J., Roser H. J., 1995, A&A, 297, 61
- Best et al. (2005) Best P. N., Kauffmann G., Heckman T. M., Brinchmann J., Charlot S., Ivezić Ž., White S. D. M., 2005, MNRAS, 362, 25
- Blanton et al. (2005) Blanton M. R., et al., 2005, AJ, 129, 2562
- Booth & Schaye (2009) Booth C. M., Schaye J., 2009, MNRAS, 398, 53
- Booth & Schaye (2011) Booth C. M., Schaye J., 2011, MNRAS, 413, 1158
- Boselli & Gavazzi (2006) Boselli A., Gavazzi G., 2006, PASP, 118, 517
- Bournaud & Elmegreen (2009) Bournaud F., Elmegreen B. G., 2009, ApJ, 694, L158
- Bower et al. (2006) Bower R. G., Benson A. J., Malbon R., Helly J. C., Frenk C. S., Baugh C. M., Cole S., Lacey C. G., 2006, MNRAS, 370, 645
- Butcher & Oemler (1978) Butcher H., Oemler Jr. A., 1978, ApJ, 219, 18
- Calabrò et al. (2019) Calabrò A., et al., 2019, A&A, 623, A64
- Caldwell & Rose (1997) Caldwell N., Rose J. A., 1997, AJ, 113, 492
- Caldwell et al. (1996) Caldwell N., Rose J. A., Franx M., Leonardi A. J., 1996, AJ, 111, 78
- Caldwell et al. (1999) Caldwell N., Rose J. A., Dendy K., 1999, AJ, 117, 140
- Chevalier (1976) Chevalier R. A., 1976, ApJ, 207, 872
- Cole et al. (2000) Cole S., Lacey C. G., Baugh C. M., Frenk C. S., 2000, MNRAS, 319, 168
- D’Eugenio et al. (2020) D’Eugenio F., et al., 2020, MNRAS, 497, 389
- Dalla Vecchia & Schaye (2012) Dalla Vecchia C., Schaye J., 2012, MNRAS, 426, 140
- Davidge (2008) Davidge T. J., 2008, AJ, 135, 1636
- Davis et al. (2019) Davis T. A., van de Voort F., Rowlands K., McAlpine S., Wild V., Crain R. A., 2019, MNRAS, 484, 2447
- Debuhr et al. (2011) Debuhr J., Quataert E., Ma C.-P., 2011, MNRAS, 412, 1341
- Dehnen & Aly (2012) Dehnen W., Aly H., 2012, MNRAS, 425, 1068
- Di Matteo et al. (2008) Di Matteo P., Bournaud F., Martig M., Combes F., Melchior A. L., Semelin B., 2008, A&A, 492, 31
- Dolag & Stasyszyn (2009) Dolag K., Stasyszyn F., 2009, MNRAS, 398, 1678
- Dolag et al. (2004) Dolag K., Jubelgas M., Springel V., Borgani S., Rasia E., 2004, ApJ, 606, L97
- Dolag et al. (2005) Dolag K., Vazza F., Brunetti G., Tormen G., 2005, MNRAS, 364, 753
- Dolag et al. (2009) Dolag K., Borgani S., Murante G., Springel V., 2009, MNRAS, 399, 497
- Dolag et al. (2017) Dolag K., Mevius E., Remus R.-S., 2017, Galaxies, 5, 35
- Dressler (1980) Dressler A., 1980, ApJ, 236, 351
- Dressler & Gunn (1983) Dressler A., Gunn J. E., 1983, ApJ, 270, 7
- Dressler et al. (1999) Dressler A., Smail I., Poggianti B. M., Butcher H., Couch W. J., Ellis R. S., Oemler Augustus J., 1999, ApJS, 122, 51
- Dressler et al. (2013) Dressler A., Oemler Augustus J., Poggianti B. M., Gladders M. D., Abramson L., Vulcani B., 2013, ApJ, 770, 62
- Ebeling et al. (2014) Ebeling H., Stephenson L. N., Edge A. C., 2014, ApJ, 781, L40
- Ellison et al. (2018) Ellison S. L., Catinella B., Cortese L., 2018, MNRAS, 478, 3447
- Fang et al. (2012) Fang J. J., Faber S. M., Salim S., Graves G. J., Rich R. M., 2012, ApJ, 761, 23
- Franx et al. (2008) Franx M., van Dokkum P. G., Förster Schreiber N. M., Wuyts S., Labbé I., Toft S., 2008, ApJ, 688, 770
- French et al. (2015) French K. D., Yang Y., Zabludoff A., Narayanan D., Shirley Y., Walter F., Smith J.-D., Tremonti C. A., 2015, ApJ, 801, 1
- Gavazzi et al. (2013) Gavazzi G., et al., 2013, A&A, 553, A90
- Genzel et al. (2010) Genzel R., et al., 2010, MNRAS, 407, 2091
- George et al. (2011) George M. R., et al., 2011, ApJ, 742, 125
- George et al. (2019) George K., et al., 2019, MNRAS, 487, 3102
- Goto (2005) Goto T., 2005, MNRAS, 357, 937
- Goto et al. (2003) Goto T., Yamauchi C., Fujita Y., Okamura S., Sekiguchi M., Smail I., Bernardi M., Gomez P. L., 2003, MNRAS, 346, 601
- Goto et al. (2008) Goto T., Kawai A., Shimono A., Sugai H., Yagi M., Hattori T., 2008, MNRAS, 386, 1355
- Gullieuszik et al. (2017) Gullieuszik M., et al., 2017, ApJ, 846, 27
- Gunn & Gott (1972) Gunn J. E., Gott III J. R., 1972, ApJ, 176, 1
- Hani et al. (2020) Hani M. H., Gosain H., Ellison S. L., Patton D. R., Torrey P., 2020, MNRAS, 493, 3716
- Hayward et al. (2014) Hayward C. C., Torrey P., Springel V., Hernquist L., Vogelsberger M., 2014, MNRAS, 442, 1992
- Heavens et al. (2004) Heavens A., Panter B., Jimenez R., Dunlop J., 2004, Nature, 428, 625
- Hirschmann et al. (2012) Hirschmann M., Naab T., Somerville R. S., Burkert A., Oser L., 2012, MNRAS, 419, 3200
- Hirschmann et al. (2014) Hirschmann M., Dolag K., Saro A., Bachmann L., Borgani S., Burkert A., 2014, MNRAS, 442, 2304
- Hogg et al. (2006) Hogg D. W., Masjedi M., Berlind A. A., Blanton M. R., Quintero A. D., Brinkmann J., 2006, ApJ, 650, 763
- Hopkins & Quataert (2010) Hopkins P. F., Quataert E., 2010, MNRAS, 407, 1529
- Hopkins et al. (2008) Hopkins P. F., Cox T. J., Kereš D., Hernquist L., 2008, ApJS, 175, 390
- Hopkins et al. (2013) Hopkins P. F., Cox T. J., Hernquist L., Narayanan D., Hayward C. C., Murray N., 2013, MNRAS, 430, 1901
- Johansson et al. (2008) Johansson P. H., Naab T., Burkert A., 2008, Astronomische Nachrichten, 329, 956
- Johansson et al. (2009a) Johansson P. H., Naab T., Burkert A., 2009a, ApJ, 690, 802
- Johansson et al. (2009b) Johansson P. H., Naab T., Ostriker J. P., 2009b, ApJ, 697, L38
- Karademir et al. (2019) Karademir G. S., Remus R.-S., Burkert A., Dolag K., Hoffmann T. L., Moster B. P., Steinwandel U. P., Zhang J., 2019, MNRAS, 487, 318
- Kawinwanichakij et al. (2016) Kawinwanichakij L., et al., 2016, ApJ, 817, 9
- Komatsu et al. (2011) Komatsu E., et al., 2011, ApJS, 192, 18
- L’Huillier et al. (2012) L’Huillier B., Combes F., Semelin B., 2012, A&A, 544, A68
- Lagos et al. (2019) Lagos C. d. P., et al., 2019, MNRAS, 489, 4196
- Lanz et al. (2020) Lanz L., et al., 2020, in American Astronomical Society Meeting Abstracts. American Astronomical Society Meeting Abstracts. p. 207.19
- Lemaux et al. (2017) Lemaux B. C., Tomczak A. R., Lubin L. M., Wu P. F., Gal R. R., Rumbaugh N., Kocevski D. D., Squires G. K., 2017, MNRAS, 472, 419
- Licquia & Newman (2015) Licquia T. C., Newman J. A., 2015, ApJ, 806, 96
- Lotz et al. (2019) Lotz M., Remus R.-S., Dolag K., Biviano A., Burkert A., 2019, MNRAS, 488, 5370
- Magorrian et al. (1998) Magorrian J., et al., 1998, AJ, 115, 2285
- Maltby et al. (2018) Maltby D. T., Almaini O., Wild V., Hatch N. A., Hartley W. G., Simpson C., Rowlands K., Socolovsky M., 2018, MNRAS, 480, 381
- Matharu et al. (2020) Matharu J., et al., 2020, MNRAS, 493, 6011
- McDonald et al. (2014) McDonald M., et al., 2014, ApJ, 794, 67
- Meusinger et al. (2017) Meusinger H., Brünecke J., Schalldach P., in der Au A., 2017, A&A, 597, A134
- Muzzin et al. (2013) Muzzin A., et al., 2013, ApJ, 777, 18
- Muzzin et al. (2014) Muzzin A., et al., 2014, ApJ, 796, 65
- Navarro et al. (1997) Navarro J. F., Frenk C. S., White S. D. M., 1997, ApJ, 490, 493
- Noeske et al. (2007) Noeske K. G., et al., 2007, ApJ, 660, L43
- O’Leary et al. (2021) O’Leary J. A., Moster B. P., Naab T., Somerville R. S., 2021, MNRAS, 501, 3215
- Oemler (1974) Oemler Jr. A., 1974, ApJ, 194, 1
- Oman et al. (2013) Oman K. A., Hudson M. J., Behroozi P. S., 2013, MNRAS, 431, 2307
- Owers et al. (2019) Owers M. S., et al., 2019, ApJ, 873, 52
- Paccagnella et al. (2017) Paccagnella A., et al., 2017, ApJ, 838, 148
- Paccagnella et al. (2019) Paccagnella A., Vulcani B., Poggianti B. M., Moretti A., Fritz J., Gullieuszik M., Fasano G., 2019, MNRAS, 482, 881
- Patton et al. (2020) Patton D. R., et al., 2020, MNRAS, 494, 4969
- Pawlik et al. (2016) Pawlik M. M., Wild V., Walcher C. J., Johansson P. H., Villforth C., Rowlands K., Mendez-Abreu J., Hewlett T., 2016, MNRAS, 456, 3032
- Pawlik et al. (2018) Pawlik M. M., et al., 2018, MNRAS, 477, 1708
- Pawlik et al. (2019) Pawlik M. M., McAlpine S., Trayford J. W., Wild V., Bower R., Crain R. A., Schaller M., Schaye J., 2019, Nature Astronomy, 3, 440
- Pearson et al. (2018) Pearson W. J., et al., 2018, A&A, 615, A146
- Pearson et al. (2019) Pearson W. J., et al., 2019, A&A, 631, A51
- Peng et al. (2010) Peng Y.-j., et al., 2010, ApJ, 721, 193
- Pierpaoli et al. (2003) Pierpaoli E., Borgani S., Scott D., White M., 2003, MNRAS, 342, 163
- Pimbblet (2011) Pimbblet K. A., 2011, MNRAS, 411, 2637
- Planck Collaboration et al. (2013) Planck Collaboration et al., 2013, A&A, 550, A131
- Poggianti et al. (1999) Poggianti B. M., Smail I., Dressler A., Couch W. J., Barger A. J., Butcher H., Ellis R. S., Oemler Augustus J., 1999, ApJ, 518, 576
- Poggianti et al. (2009) Poggianti B. M., et al., 2009, ApJ, 693, 112
- Poggianti et al. (2016) Poggianti B. M., et al., 2016, AJ, 151, 78
- Poggianti et al. (2017) Poggianti B. M., et al., 2017, Nature, 548, 304
- Poggianti et al. (2021) Poggianti B. M., et al., 2021, IAU Symposium, 359, 108
- Pozzetti et al. (2010) Pozzetti L., et al., 2010, A&A, 523, A13
- Pracy et al. (2009) Pracy M. B., Kuntschner H., Couch W. J., Blake C., Bekki K., Briggs F., 2009, MNRAS, 396, 1349
- Pracy et al. (2010) Pracy M. B., Couch W. J., Kuntschner H., 2010, Publ. Astron. Soc. Australia, 27, 360
- Pracy et al. (2013) Pracy M. B., et al., 2013, MNRAS, 432, 3131
- Qu et al. (2017) Qu Y., et al., 2017, MNRAS, 464, 1659
- Radovich et al. (2019) Radovich M., Poggianti B., Jaffé Y. L., Moretti A., Bettoni D., Gullieuszik M., Vulcani B., Fritz J., 2019, MNRAS, 486, 486
- Ragagnin et al. (2017) Ragagnin A., Dolag K., Biffi V., Cadolle Bel M., Hammer N. J., Krukau A., Petkova M., Steinborn D., 2017, Astronomy and Computing, 20, 52
- Raichoor & Andreon (2012) Raichoor A., Andreon S., 2012, A&A, 543, A19
- Remus et al. (2017) Remus R.-S., Dolag K., Naab T., Burkert A., Hirschmann M., Hoffmann T. L., Johansson P. H., 2017, MNRAS, 464, 3742
- Ricarte et al. (2020) Ricarte A., Tremmel M., Natarajan P., Quinn T., 2020, ApJ, 895, L8
- Roberts & Parker (2020) Roberts I. D., Parker L. C., 2020, MNRAS, 495, 554
- Robotham et al. (2014) Robotham A. S. G., et al., 2014, MNRAS, 444, 3986
- Rodriguez-Gomez et al. (2016) Rodriguez-Gomez V., et al., 2016, MNRAS, 458, 2371
- Rodríguez Montero et al. (2019) Rodríguez Montero F., Davé R., Wild V., Anglés-Alcázar D., Narayanan D., 2019, MNRAS, 490, 2139
- Rowlands et al. (2018) Rowlands K., et al., 2018, MNRAS, 473, 1168
- Schaye et al. (2015) Schaye J., et al., 2015, MNRAS, 446, 521
- Schulze et al. (2018) Schulze F., Remus R.-S., Dolag K., Burkert A., Emsellem E., van de Ven G., 2018, MNRAS, 480, 4636
- Schulze et al. (2020) Schulze F., Remus R.-S., Dolag K., Bellstedt S., Burkert A., Forbes D. A., 2020, MNRAS, 493, 3778
- Schweizer (1996) Schweizer F., 1996, AJ, 111, 109
- Smethurst et al. (2017) Smethurst R. J., Lintott C. J., Bamford S. P., Hart R. E., Kruk S. J., Masters K. L., Nichol R. C., Simmons B. D., 2017, MNRAS, 469, 3670
- Socolovsky et al. (2018) Socolovsky M., Almaini O., Hatch N. A., Wild V., Maltby D. T., Hartley W. G., Simpson C., 2018, MNRAS, 476, 1242
- Socolovsky et al. (2019) Socolovsky M., Maltby D. T., Hatch N. A., Almaini O., Wild V., Hartley W. G., Simpson C., Rowlands K., 2019, MNRAS, 482, 1640
- Speagle et al. (2014) Speagle J. S., Steinhardt C. L., Capak P. L., Silverman J. D., 2014, ApJS, 214, 15
- Springel (2005) Springel V., 2005, MNRAS, 364, 1105
- Springel & Hernquist (2003) Springel V., Hernquist L., 2003, MNRAS, 339, 289
- Springel et al. (2001) Springel V., Yoshida N., White S. D. M., 2001, New Astron., 6, 79
- Springel et al. (2005) Springel V., Di Matteo T., Hernquist L., 2005, MNRAS, 361, 776
- Steinborn et al. (2015) Steinborn L. K., Dolag K., Hirschmann M., Prieto M. A., Remus R.-S., 2015, MNRAS, 448, 1504
- Steinborn et al. (2016) Steinborn L. K., Dolag K., Comerford J. M., Hirschmann M., Remus R.-S., Teklu A. F., 2016, MNRAS, 458, 1013
- Steinborn et al. (2018) Steinborn L. K., Hirschmann M., Dolag K., Shankar F., Juneau S., Krumpe M., Remus R.-S., Teklu A. F., 2018, MNRAS, 481, 341
- Strazzullo et al. (2019) Strazzullo V., et al., 2019, A&A, 622, A117
- Teklu et al. (2015) Teklu A. F., Remus R.-S., Dolag K., Beck A. M., Burkert A., Schmidt A. S., Schulze F., Steinborn L. K., 2015, ApJ, 812, 29
- Teklu et al. (2017) Teklu A. F., Remus R.-S., Dolag K., Burkert A., 2017, MNRAS, 472, 4769
- Teklu et al. (2018) Teklu A. F., Remus R.-S., Dolag K., Arth A., Burkert A., Obreja A., Schulze F., 2018, ApJ, 854, L28
- Tinker et al. (2013) Tinker J. L., Leauthaud A., Bundy K., George M. R., Behroozi P., Massey R., Rhodes J., Wechsler R. H., 2013, ApJ, 778, 93
- Tinker et al. (2017) Tinker J. L., Wetzel A. R., Conroy C., Mao Y.-Y., 2017, MNRAS, 472, 2504
- Tinker et al. (2018) Tinker J. L., Hahn C., Mao Y.-Y., Wetzel A. R., Conroy C., 2018, MNRAS, 477, 935
- Tornatore et al. (2003) Tornatore L., Borgani S., Springel V., Matteucci F., Menci N., Murante G., 2003, MNRAS, 342, 1025
- Tornatore et al. (2007) Tornatore L., Borgani S., Dolag K., Matteucci F., 2007, MNRAS, 382, 1050
- Tran et al. (2003) Tran K.-V. H., Franx M., Illingworth G., Kelson D. D., van Dokkum P., 2003, ApJ, 599, 865
- Trayford et al. (2016) Trayford J. W., Theuns T., Bower R. G., Crain R. A., Lagos C. d. P., Schaller M., Schaye J., 2016, MNRAS, 460, 3925
- Vergani et al. (2010) Vergani D., et al., 2010, A&A, 509, A42
- Voit et al. (2015) Voit G. M., Donahue M., O’Shea B. W., Bryan G. L., Sun M., Werner N., 2015, ApJ, 803, L21
- Volonteri et al. (2015) Volonteri M., Capelo P. R., Netzer H., Bellovary J., Dotti M., Governato F., 2015, MNRAS, 449, 1470
- Vulcani et al. (2018) Vulcani B., et al., 2018, ApJ, 866, L25
- Vulcani et al. (2020a) Vulcani B., et al., 2020a, ApJ, 892, 146
- Vulcani et al. (2020b) Vulcani B., et al., 2020b, ApJ, 899, 98
- Wang et al. (2018) Wang H., et al., 2018, ApJ, 852, 31
- Wetzel et al. (2012) Wetzel A. R., Tinker J. L., Conroy C., 2012, MNRAS, 424, 232
- Whitaker et al. (2012) Whitaker K. E., Kriek M., van Dokkum P. G., Bezanson R., Brammer G., Franx M., Labbé I., 2012, ApJ, 745, 179
- Wild et al. (2009) Wild V., Walcher C. J., Johansson P. H., Tresse L., Charlot S., Pollo A., Le Fèvre O., de Ravel L., 2009, MNRAS, 395, 144
- Wild et al. (2014) Wild V., et al., 2014, MNRAS, 440, 1880
- Wild et al. (2016) Wild V., Almaini O., Dunlop J., Simpson C., Rowlands K., Bowler R., Maltby D., McLure R., 2016, MNRAS, 463, 832
- Wild et al. (2020) Wild V., et al., 2020, MNRAS, 494, 529
- Wilkinson et al. (2017) Wilkinson C. L., Pimbblet K. A., Stott J. P., 2017, MNRAS, 472, 1447
- Wilkinson et al. (2018) Wilkinson C. L., Pimbblet K. A., Stott J. P., Few C. G., Gibson B. K., 2018, MNRAS, 479, 758
- Wu et al. (2014) Wu P.-F., Gal R. R., Lemaux B. C., Kocevski D. D., Lubin L. M., Rumbaugh N., Squires G. K., 2014, ApJ, 792, 16
- Wu et al. (2020) Wu P.-F., et al., 2020, ApJ, 888, 77
- Yan et al. (2009) Yan R., et al., 2009, MNRAS, 398, 735
- Yang et al. (2004) Yang Y., Zabludoff A. I., Zaritsky D., Lauer T. R., Mihos J. C., 2004, ApJ, 607, 258
- Yang et al. (2008) Yang Y., Zabludoff A. I., Zaritsky D., Mihos J. C., 2008, ApJ, 688, 945
- Yesuf & Ho (2020) Yesuf H. M., Ho L. C., 2020, ApJ, 900, 107
- Yesuf et al. (2014) Yesuf H. M., Faber S. M., Trump J. R., Koo D. C., Fang J. J., Liu F. S., Wild V., Hayward C. C., 2014, ApJ, 792, 84
- Young et al. (2014) Young L. M., et al., 2014, MNRAS, 444, 3408
- Yuan et al. (2010) Yuan T. T., Kewley L. J., Sanders D. B., 2010, ApJ, 709, 884
- Zabludoff et al. (1996) Zabludoff A. I., Zaritsky D., Lin H., Tucker D., Hashimoto Y., Shectman S. A., Oemler A., Kirshner R. P., 1996, ApJ, 466, 104
- Zahid & Geller (2017) Zahid H. J., Geller M. J., 2017, ApJ, 841, 32
- Zheng et al. (2020) Zheng Y., Wild V., Lahén N., Johansson P. H., Law D., Weaver J. R., Jimenez N., 2020, MNRAS, 498, 1259
- Zwaan et al. (2013) Zwaan M. A., Kuntschner H., Pracy M. B., Couch W. J., 2013, MNRAS, 432, 492
- van Dokkum et al. (2010) van Dokkum P. G., et al., 2010, ApJ, 709, 1018
- van de Sande et al. (2019) van de Sande J., et al., 2019, MNRAS, 484, 869
- van der Burg et al. (2013) van der Burg R. F. J., et al., 2013, A&A, 557, A15