Relation-weighted link prediction for
disease gene identification
Abstract
Identification of disease genes, which are a set of genes associated with a disease, plays an important role in understanding and curing diseases. In this paper, we present a biomedical knowledge graph designed specifically for this problem, propose a novel machine learning method that identifies disease genes on such graphs by leveraging recent advances in network biology and graph representation learning, study the effects of various relation types on prediction performance, and empirically demonstrate that our algorithms outperform its closest state-of-the-art competitor in disease gene identification by . We also show that we achieve higher precision than Open Targets, the leading initiative for target identification, with respect to predicting drug targets in clinical trials for Parkinson’s disease.
There are many diseases, such as Parkinson’s disease, that have no known causes or curative therapies, yet afflict millions of people around the world [1]. The preeminent approach to developing curative therapies for such diseases involves developing drugs that can alter the disease state by modulating the activity of a molecular target [2]. This approach requires successful identification of such a molecular target, and within the drug discovery pipeline, this problem is called disease gene identification.
A relatively recent approach for disease gene identification is network-based drug discovery [3, 4]. Network-based drug discovery, or more generally network biology, assumes that networks can be used to represent the molecular interactions in human cells and that disease phenotypes arise due to perturbations of these interactions [5]. In other words, the phenotypic impact of a mutated gene is not determined solely by the known function of that gene, but also by how the altered activity of its gene product spreads throughout the network and affects the activity of other molecular components that may have no genetic defects. Within this framework, one can formulate disease gene identification as a link prediction problem [6, 7].
In this paper, we present a biomedical knowledge graph that represents various relationships between molecular and phenotypic objects, some of which are causal relationships between genes and diseases, and leverage the graph to infer more of such relationships. We propose a general method to modify link prediction algorithms, which we call relation-weighted link prediction, and demonstrate that our algorithms outperform existing state-of-the-art (SOTA) in disease gene identification. We also study the effects of various relation types on prediction performance. Finally, we show that we achieve higher precision than Open Targets, the leading initiative for target identification, with respect to predicting drug targets in clinical trials for Parkinson’s disease.
1 Relation-weighted link prediction
Our goal is to identify disease genes, which are a set of genes associated with a disease. We formulate this task as a link prediction problem [6, 7], where we construct our biomedical knowledge graph and leverage the information in the graph to predict previously unknown links between genes and diseases.
A modern approach to solve link prediction is via graph representation learning (GRL) [8, 9]. Historically, given a machine learning problem on a graph, the main challenge has been to decide on the most predictive way to encode information about the graph into a machine learning model. For example, in case of link prediction, researchers typically encoded the graph using pairwise attributes between the candidate node pairs, such as the number of their common friends. However, such hand-engineered features are time-consuming to design and are not necessarily optimal for the prediction task. In contrast, GRL studies algorithms that automatically learns how to encode the graph structure into low-dimensional vectors which are specifically tuned for the prediction task.
We introduce a simple but important modification to link prediction algorithms for knowledge graphs called relation-weighted link prediction. Existing link prediction algorithms for knowledge graphs, such as RotatE [10], CompGCN [11], and R-GCN [12], are able to model graphs with more than one relation type. However, they assign equal importance to all links regardless of their relation type and do not account for the imbalances in the number of links across different relation types. As a result, the model may be biased to predict well on relation types with more links and poorly on relation types with less links, even if the relation type of interest has only a small proportion of the total links. Relation-weighted link prediction is a modification of existing learning algorithms such that each relation type is assigned a weight parameter that is optimized to maximize the predictive accuracy on the relation type of interest, which in our case is gene-disease. In general, relation-weighted link prediction can be used to modify any heterogeneous link prediction algorithm.
We demonstrate relation-weighted link prediction on RotatE [10], a GRL method that has been shown to achieve state-of-the-art performance on benchmark tasks like link prediction, node classification, and graph classification. Given an edge of the form , it learns low-dimensional vectors for nodes and relation types such that an edge is assumed to be a rotation from the head node to the tail node in the complex vector space.
Equation 1 shows the loss function of RotatE for a single edge . It optimizes a distance-based model with a negative sampling loss
| (1) |
where, is the relation-specific distance function, is the margin, is the sigmoid function, are the low-dimensional vector representations of , and is a negative edge which is corrupted from the original edge.
In equation 2, we modify the original loss by introducing a relation-specific weight that scales the contribution of the relation type to the loss
| (2) |
2 Experiments
In this section, we present our experimental results. To prepare for training and evaluation, we split disease-gene links into train (), validation (), and test () sets. During splitting, we ensure that all nodes in the disease-gene layer occur at least once in the train set. We then incrementally augment each of the remaining layers to the train set (e.g. protein-protein, protein-reaction, pathway-disease, etc.) in order to estimate the contribution of each layer to predictive accuracy. More details about the biomedical knowledge graph that we constructed and its data sources, node types, and relation types can be found in the Table S1 and S2.
Since our goal is to identify disease genes, when evaluating disease-gene links in the test set, we treat all possible genes as candidates for the disease. We use two well-known link prediction metrics, filtered hit@k and filtered mean rank (MR) [13], to measure predictive accuracy. We also introduce a new metric called filtered mean percentile (MP), which is mean rank normalized by the number of candidates, to enable a fair comparison between test sets where the number of gene candidates differ.
For hyperparameter optimization, we use a library called Optuna [14]. Optuna allows us to sample the hyperparameter space efficiently and prune unpromising runs early. We optimize on the validation set and report results of the best performing model on the test set.
2.1 Relation layers
Here, we demonstrate how augmenting the graph with new relation layers and modifying the objective function affects prediction performance. For these experiments, we let valid and test splits consist only of disease-gene edges, which we keep constant across experiments. The only thing we change between experiments is the new relation layers we augment to the train split. As the link prediction algorithm, we use the relation-weighted modification of RotatE.
Results are shown in Table 1. Due to lack of space, we abbreviate curated DoidGeNET as DG, uncurated DoidGeNET as DG_UC, Disease Ontology as DO, and Reactome as RT. We observe that each relation layer we add to the train split improves the prediction performance compared to the preceding one, and the fully augmented graph achieves the best performance. This shows the benefits of adding relevant biological information to the graph. Furthermore, in Table 2, we compare the prediction performance of the original and the relation-weighted RotatE on the fully augmented graph. We observe that the relation-weighted variant performs better than the original, thus showing the utility of weighting relation types in heterogeneous graphs. More details about the optimal relation weights learned by the model can be found in the Table S3.
In conclusion, when we augment our graph with all of the relation layers and apply our relation-weighted objective, relative to the graph that only consists of the disease-gene layer, we achieve a relative reduction of in MR, a relative increase of % in hit@30, and a relative increase of in MP.
| Variant | hit@30 | Mean Rank | Mean Percentile |
|---|---|---|---|
| DG | 0.189 | 4995.65 | 72.77 |
| DG + STRING | 0.287 | 2029.74 | 88.94 |
| DG + STRING + DG_UC | 0.353 | 1467.84 | 91.64 |
| DG + STRING + DG_UC + DO | 0.363 | 1256.69 | 92.84 |
| DG + STRING + DG_UC + DO + RT | 0.375 | 1186.81 | 93.32 |
| Variant | hit@30 | Mean Rank | Mean Percentile |
|---|---|---|---|
| Original | 0.368 | 1298.44 | 92.70 |
| Relation-weighted | 0.375 | 1186.81 | 93.32 |
2.2 Comparison with state-of-the-art (SOTA)
We compare our best performing model against existing SOTA methods for disease gene prediction [15]. Specifically, we compare against direct neighborhood scoring [16], DIAMOnD [17], and random walks [18, 19].
Direct neighborhood scoring [16] assigns each gene a score that is proportional to the percentage of its neighbors associated with the disease. To construct disease gene clusters, it initializes the clusters with a seed set of disease genes and recursively expands the cluster with the highest scoring genes. DIAMOnD [17] also initializes clusters with seed genes, but uses a statistic called connectivity significance to expand them. Random walks [18, 19] use seed genes to initialize a random walker that randomly visits neighbor genes. Upon convergence, the frequency with which the nodes in the network are visited is used to rank the disease genes.
For a fair comparison, we initialize all these methods with the same seed genes that were used to train our own models. When appropriate, we optimize their hyperparameters using the validation set. Because of the way these methods are designed, we train them on a subgraph consisting of two layers: disease-gene (DoidGeNET) and protein-protein interaction (STRING).
In Table 3, we share the results we obtained on the test set111Some cells are NA because they were too expensive to compute.. In conclusion, relation-weighted RotatE outperforms all SOTA methods for disease gene prediction, including its closest competitor DIAMOnD. Specifically, compared to DIAMOnD, our model achieves a relative increase in hit@30 of and a relative increase in hit@100 of .
| Method | hit@30 | hit@100 | Mean Rank | Mean Percentile |
|---|---|---|---|---|
| Relation-weighted RotatE | 0.375 | 0.535 | 1186.81 | 93.32 |
| DIAMOnD | 0.336 | 0.431 | NA | NA |
| Direct neighborhood scoring | 0.250 | 0.357 | 3339.61 | 80.24 |
| Random walk | 0.007 | 0.026 | 4597.91 | 72.78 |
2.3 Comparison with Open Targets
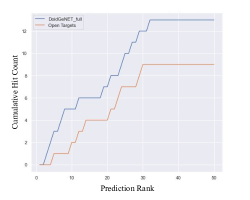
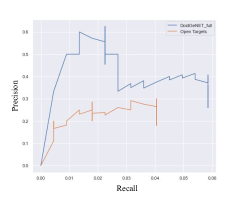
To further assess the practical utility of our approach in identifying disease genes, we compared our predictions against those of Open Targets [20], the leading initiative for target identification, with respect to predicting drug targets in clinical trials for Parkinson’s disease. To obtain the list of targets in clinical trials, we used Trialtrove [21], the most comprehensive database for clinical trials. To ensure a worst-case comparison, we removed all genes that appeared in the evaluation data from the training data of our models, but we were not able to do the same for the Open Targets model, which obtained an unfair advantage because of that.
In Figure 1, we show a comparison between the top 50 prediction from our best performing model (i.e. relation-weighted RotatE trained on the fully augmented graph) and Open Targets. We observe that, in the top 50 predictions, our model finds more candidates than those listed by Open Targets, while also consistently achieving higher precision than Open Targets.
3 Conclusion
In this paper, we presented a biomedical knowledge graph designed specifically for disease gene identification, proposed a novel machine learning method that identifies such genes by leveraging recent advances in network biology and graph representation learning, studied the effects of various relation types on prediction performance, and empirically demonstrated that our algorithms outperform its closest state-of-the-art competitor in disease gene identification by 24.1% . We also showed that we achieve higher precision than Open Targets, the leading initiative for target identification, with respect to predicting drug targets in clinical trials for Parkinson’s disease.
References
- [1] Lonneke ML de Lau and Monique MB Breteler. Epidemiology of Parkinson’s disease. Lancet Neurology, 2006.
- [2] Jessica Vamathevan, Dominic Clark, Paul Czodrowski, Ian Dunham, Edgardo Ferran, George Lee, Bin Li, Anant Madabhushi, Parantu Shah, Michaela Spitzer, and Shanrong Zhao. Applications of machine learning in drug discovery and development. Nature Reviews Drug Discovery, 2019.
- [3] Theodora Katsila, Georgios A. Spyroulias, George P. Patrinos, and Minos Timotheos Matsoukas. Computational approaches in target identification and drug discovery. Computational and Structural Biotechnology Journal, 2016.
- [4] B. Chen and A. J. Butte. Network medicine in disease analysis and therapeutics. Clinical Pharmacology and Therapeutics, 2013.
- [5] Albert László Barabási, Natali Gulbahce, and Joseph Loscalzo. Network medicine: A network-based approach to human disease. Nature Reviews Genetics, 2011.
- [6] David Liben-Nowell and Jon Kleinberg. The link-prediction problem for social networks. Journal of the American Society for Information Science and Technology, 2007.
- [7] Víctor Martínez, Fernando Berzal, and Juan Carlos Cubero. A survey of link prediction in complex networks. ACM Computing Surveys, 2016.
- [8] Hongyun Cai, Vincent W. Zheng, and Kevin Chen Chuan Chang. A Comprehensive Survey of Graph Embedding: Problems, Techniques, and Applications. IEEE Transactions on Knowledge and Data Engineering, 2018.
- [9] William L. Hamilton, Rex Ying, and Jure Leskovec. Representation learning on graphs: Methods and applications. IEEE Data Engineering Bulletin, 2017.
- [10] Zhiqing Sun, Zhi Hong Deng, Jian Yun Nie, and Jian Tang. RotatE: Knowledge graph embedding by relational rotation in complex space. In International Conference on Learning Representations, (ICLR), 2019.
- [11] Shikhar Vashishth, Soumya Sanyal, Vikram Nitin, and Partha Talukdar. Composition-based multi-relational graph convolutional networks. In International Conference on Learning Representations (ICLR), 2020.
- [12] Michael Schlichtkrull, Thomas N. Kipf, Peter Bloem, Rianne van den Berg, Ivan Titov, and Max Welling. Modeling relational data with graph convolutional networks. In European Semantic Web Conference (ESWC), 2018.
- [13] Baoxu Shi and Tim Weninger. ProjE: Embedding projection for knowledge graph completion. In International Conference on Artificial Intelligence (AAAI), 2017.
- [14] Takuya Akiba, Shotaro Sano, Toshihiko Yanase, Takeru Ohta, and Masanori Koyama. Optuna: A Next-generation Hyperparameter Optimization Framework. In International Conference on Knowledge Discovery and Data Mining (KDD), 2019.
- [15] Monica Agrawal, Marinka Zitnik, and Jure Leskovec. Large-scale analysis of disease pathways in the human interactome. In Pacific Symposium on Biocomputing, 2018.
- [16] Saket Navlakha and Carl Kingsford. The power of protein interaction networks for associating genes with diseases. Bioinformatics, 2010.
- [17] Susan Dina Ghiassian, Jörg Menche, and Albert László Barabási. A DIseAse MOdule Detection (DIAMOnD) Algorithm Derived from a Systematic Analysis of Connectivity Patterns of Disease Proteins in the Human Interactome. PLoS Computational Biology, 2015.
- [18] Hongyi Zhou and Jeffrey Skolnick. A knowledge-based approach for predicting gene-disease associations. Bioinformatics, 2016.
- [19] Mark D.M. Leiserson, Fabio Vandin, Hsin Ta Wu, Jason R. Dobson, Jonathan V. Eldridge, Jacob L. Thomas, Alexandra Papoutsaki, Younhun Kim, Beifang Niu, Michael McLellan, Michael S. Lawrence, Abel Gonzalez-Perez, David Tamborero, Yuwei Cheng, Gregory A. Ryslik, Nuria Lopez-Bigas, Gad Getz, Li Ding, and Benjamin J. Raphael. Pan-cancer network analysis identifies combinations of rare somatic mutations across pathways and protein complexes. Nature Genetics, 2015.
- [20] Denise Carvalho-Silva, Andrea Pierleoni, Miguel Pignatelli, Chuang Kee Ong, Luca Fumis, Nikiforos Karamanis, Miguel Carmona, Adam Faulconbridge, Andrew Hercules, Elaine McAuley, Alfredo Miranda, Gareth Peat, Michaela Spitzer, Jeffrey Barrett, David G. Hulcoop, Eliseo Papa, Gautier Koscielny, and Ian Dunham. Open Targets Platform: New developments and updates two years on. Nucleic Acids Research, 2019.
- [21] Deborah A. Zarin, Tony Tse, Rebecca J. Williams, Robert M. Califf, and Nicholas C. Ide. The ClinicalTrials.gov results database - Update and key issues. New England Journal of Medicine, 2011.