Prediction and Observation of Intermodulation Sidebands from Anharmonic Phonons in NaBr
Abstract
A quantum Langevin model, similar to models from optomechanics, was developed for phonons. It predicts intermodulation phonon sidebands (IPS) in anharmonic crystals. Ab initio calculations of anharmonic phonons in rocksalt NaBr showed these spectral features as “many-body effects.” Modern inelastic neutron scattering measurements on a crystal of NaBr at 300 K revealed diffuse intensity at high phonon energy from a predicted upper IPS. The transverse optical (TO) part of the new features originates from phonon intermodulation between the transverse acoustic (TA) and TO phonons. The longitudinal optical (LO) spectral features originate from three-phonon coupling between the TA modes and the TO lattice modes. The partner lower IPS proves to be an “intrinsic localized mode.” Interactions with the thermal bath broaden and redistribute the spectral weight of the IPS pair. These sidebands are a probe of the anharmonicity and quantum noise of phonons in NaBr, and suggest novel interactions between photons and phonons.
I Introduction
Phonons, quantized excitations of vibrational modes in crystals, bear resemblance to photons, quantized excitations of electromagnetic fields. Both obey the Planck statistics of bosons, and their quintessential models have similar Hamiltonians, , where is the energy of an individual phonon or photon, and gives the number of them. Phonons and photons exist in different media, so their properties are explained differently. For phonons, harmonic equations of motion are formulated as eigenvalue problems that give dispersions of frequency versus wavevector, [1, 2]. The degrees of freedom in three dimensions allow dispersions, where is the number of atoms in the translationally-periodic unit cell. The harmonic model is readily extended to a “quasiharmonic model” to account for how frequencies shift with volume. Anharmonic models based on many-body perturbation theory [3, 4, 5] can account for how phonon frequencies shift with temperature alone, and how finite phonon lifetimes originate with interactions between phonons. Perturbation theory couples the phonon modes, but the dispersions are retained. To date, these dispersions have been consistent with experimental observations. Exceptions are predictions [6, 7] and experimental reports of intrinsic localized modes (ILM) [8, 9, 10, 11, 12]. There are different viewpoints about the experimental evidence for ILMs, however [13, 14, 15].
In the newer field of laser-cavity physics, a quantized mechanical motion is coupled to photons in a cavity. When tuning the laser across the resonant frequency of the cavity, cooling or heating of the mechanical system generates sidebands about the main resonance [16, 17, 18, 19, 20, 21, 22, 23]. Photon-phonon couplings in laser-cavity experiments have similarities to anharmonic phonon-phonon couplings in crystals. The formal similarities motivate the question, “Do thermally-driven asymmetric sidebands exist in the phonon spectra of anharmonic crystals?” To date, there has been no experimental evidence for this.
Advances in the sensitivity of methods for inelastic neutron scattering (INS) on single-crystals motivated an examination of this question. After these experimental methods are described, this paper presents a quantum Langevin model for equilibrium phonon populations. INS data are presented on an anharmonic material, rocksalt NaBr, revealing a new diffuse spectral band at 300 K. The diffuse band is predicted qualitatively by ab initio calculations and perturbation theory with cubic perturbations to second order. This ab initio method with perturbation theory is used for identifying the specific phonon energies and branches involved in creating the new diffuse band. The quantum Langevin model is not limited to small anharmonicity, however. It successfully explains the intensity and asymmetry of the intermodulation phonon sidebands (IPS) through the anharmonic coupling of two phonons and their interactions with a thermal bath of other phonons in the crystal.
II Experimental Measurements and Ab Initio Calculations
II.1 INS experiments
The measurements used a high-purity single crystal of NaBr. Crystal quality was checked by X-ray and neutron diffraction. The single crystal of [001] orientation was suspended in an aluminum holder, which was mounted in a closed-cycle helium refrigerator for the 10 K measurement, and in a low-background electrical resistance vacuum furnace for measurements at 300 K.
The inelastic neutron scattering (INS) data were acquired with the time-of-flight Wide Angular-Range Chopper Spectrometer, ARCS [24], at the Spallation Neutron Source at Oak Ridge National Laboratory, using neutrons with an incident energy, , of 50 meV. The techniques and material were similar to those reported previously [25], but the previous study had a problematic background at the precise energy transfers of interest here 111The internal structure of the ARCS spectrometer has radial, plate-like baffles of neutron absorbing material that block stray scattering off detector tubes from reaching other detectors. This works well, except for detectors located approximately 180∘ across the detector array. Those neutrons, elastically scattering across the diameter of the instrument, arrive at a later time than the main elastic peak, appearing to be at an inelastic energy transfer of 80% of . In the prior dataset of meV, this artifact appears at 24 meV, overlapping the ghost modes. For the present dataset with meV, its 40 meV artifact is safely out of range, although the energy resolution of the instrument is approximately times larger than the prior dataset.. We therefore acquired an entirely new dataset with meV.
For each measurement, time-of-flight neutron data were collected from 201 rotations of the crystal in increments of 0.5∘ about the vertical axis. Data reduction gave the 4D scattering function , where is the 3D wave-vector of momentum transfer, and is the phonon energy (from the neutron energy loss). Measurements were performed to evaluate the background from an empty can. To correct for nonlinearities of the ARCS instrument, offsets of the -grid were corrected to first order by fitting a set of 76 in situ Bragg diffractions, which were transformed to their theoretical positions in the reciprocal space of the NaBr structure. The linear transformation matrix had only a small deviation (less than 0.02) from the identity matrix, showing that the original data had good quality and that linear corrections for -offsets were adequate. After subtracting the empty-can background and removing multiphonon scattering with the incoherent approximation, the higher Brillouin zones were folded back [27, 25] into an irreducible wedge in the first Brillouin zone to obtain the spectral intensities. Further information about the ARCS background is given in the Supplemental Information.
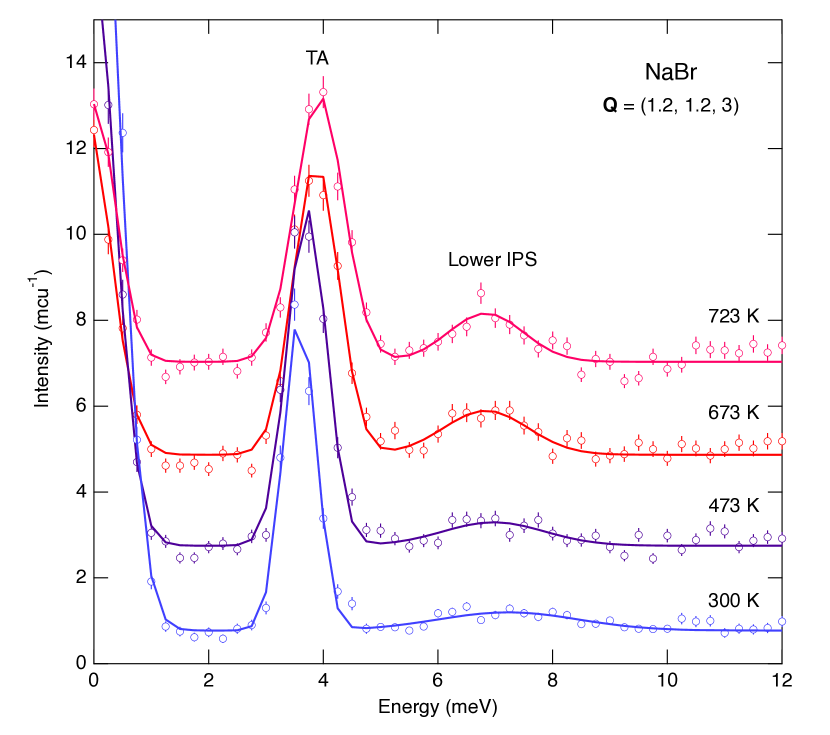
The temperature dependence of the low-energy dynamics of NaBr was measured with higher resolution with the HB3 triple axis spectrometer at the High Flux Isotope Reactor (HFIR) of Oak Ridge National Laboratory. Pyrolytic graphite PG(002) was used for both the monochromator and the analyzer. The spectrometer was operated with a filtered, fixed final neutron energy of 14.7 meV with horizontal collimation 48’:40’:40’:120’. The NaBr crystal was mounted in a vacuum furnace with the (HHL) reflections in the scattering plane. Measurements were made in transverse geometry near (113) along = at temperatures from 300 to 723 K.
II.2 Ab initio calculations
All DFT calculations were performed with the VASP package using a plane-wave basis set [28, 29, 30, 31] with projector augmented wave (PAW) pseudopotentials [32] and the Perdew-Burke-Ernzerhof (PBE) exchange correlation functional [33]. The Born effective charges and dielectric constants were obtained by DFT calculations in VASP [34]. A correction for the non-analytical term of the long-ranged electrostatics was performed in both quasiharmonic and anharmonic calculations [35]. All calculations used a kinetic-energy cutoff of 550 eV, a 555 supercell of 250 atoms, and a 333 -point grid. The phonon self-energy was calculated with a 353535 -grid. Calculations of phonons in the quasiharmonic approximation (QHA) used PHONOPY [36]. The QHA method allows the frequencies and entropy of phonons to vary with volume and Planck occupancy. It does not include thermal displacements of individual atoms off periodic sites, as arise in molecular dyanmics, for example, and the QHA was not accurate for predicting the thermal expansion of NaBr [25].
The stochastically-initialized temperature dependent effective potential method (sTDEP) [37, 38, 39] method was used to accelerate the traditional ab initio molecular dynamics (AIMD) and calculate anharmonic phonon dispersions at finite temperatures. The method for NaBr was described previously [25]. In short, the phonon frequencies were obtained from the dynamical matrix for the quadratic force constants, and then corrected by the real () and imaginary () parts of the phonon self-energy from many-body theory [4, 5]. The imaginary part, which gives phonon lifetime broadening, was calculated with the third-order force constants,
| (1) |
where ) is the probing energy. The real part was obtained by a Kramers-Kronig transformation
| (2) |
Equation II.2 is a sum over all possible three-phonon interactions, where is the three-phonon matrix element obtained from the cubic force constants by Fourier transformation, is the Bose-Einstein thermal occupation factor giving the number of phonons in each mode, and the delta functions conserve energy and momentum. Details were given in the supplemental materials in our previous work [25].
III Quantum Langevin Model
We start with the Hamiltonian of three coupled phonons denoted as , , and ,
| (3) |
where is the Hamiltonian for three uncoupled, independent oscillators, and parameterizes the coupling strength. However, there is also a special case where only two types of phonons are involved in this interaction process. Taking as an example, the system Hamiltonian is then
| (4) |
where now denotes the composite phonon mode with , denotes the mode, and the is added for later convenience. Confining our interest to terms under the rotating wave approximation (RWA) in quantum optics, we eliminate the terms and (and and that do not conserve energy)
| (5) |
The general method of input-output theory [40, 16] gives the Heisenberg-Langevin equations of motion for the two modes,
| (6) | ||||
| (7) |
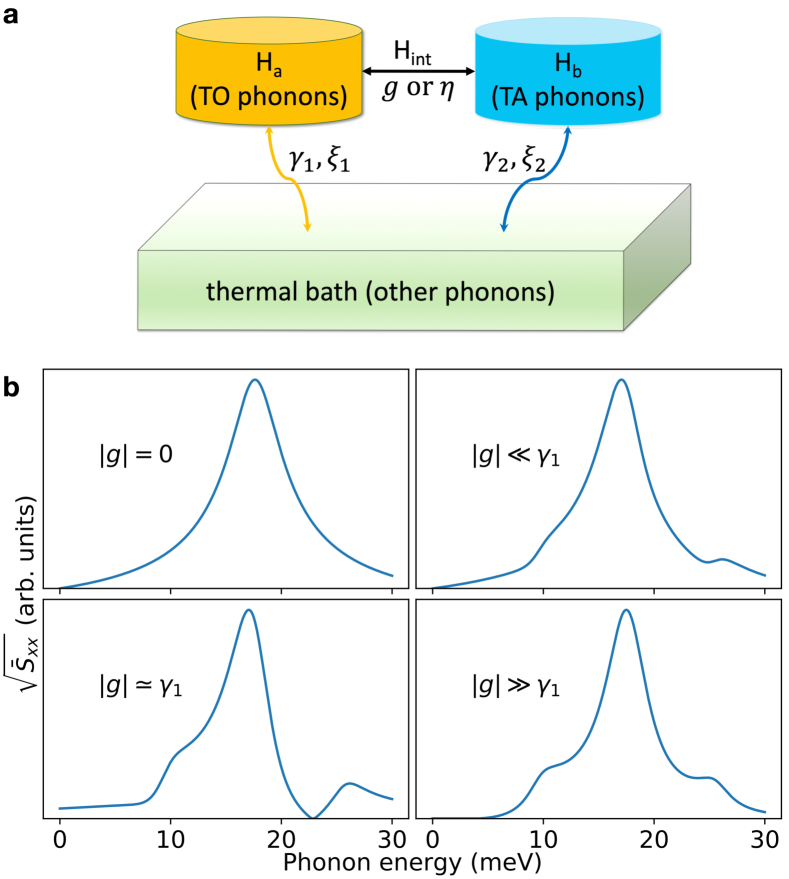
Here and are decay rates of the two modes, giving phonon linewidths in energy. The other phonons are modeled as a thermal bath, described by stochastic operators and . These satisfy the correlation conditions: and , where is the equilibrium Planck occupancy . These correlation conditions apply to both modes 1 and 2; a situation that differs from optomechanical systems where correlations of the stochastic variable for input noise of the optical photon do not scale with equilibrium thermal occupancies. Figure 1a depicts relationships between the TA and TO phonons and the thermal bath of other phonons, showing correspondences to th physical quantities of input-output theory.
Using the concept of intermodulation, a classical analysis by representing the phonon amplitudes of as Fourier decomposition of sidebands [19] shows that comprises the frequency components (first-order), (second-order distortion), (third-order distortion), etc. Second-order effects are identified by transforming to a frame moving at the central frequency by replacing and , where we take to be real without loss of generality. This gives linearized equations of motion
| (8) | ||||
| (9) |
where is the coupling strength. A straightforward calculation (see Supplemental) obtained the symmetrized power spectral density of displacement as
| (10) |
where the response functions are defined as
| (11) | ||||
| (12) | ||||
| (13) |
The first term in parens in Eq. 10,
| (14) |
contributes spectral weight primarily to the positive frequency region. The other term contributes to the negative.
In the absence of phonon coupling, i.e., , Eq. 14 reduces to the thermal noise spectrum of a damped harmonic oscillator
| (15) |
Figure 1b shows this is a Lorentzian function centered at . Three other cases are shown: weak coupling (), medium coupling (), strong coupling (). To identify an IPS in a real material, the phonon-phonon interactions must be at least in the medium coupling regime. Recently, we identified NaBr with the rocksalt structure as a highly anharmonic solid system [25], so it seemed an appropriate candidate for finding phonon intermodulation phenomena.
IV Results
A new spectral feature, labeled “G” (ghost) in Fig. 2b, appears at 300 K. It is flat over the Brillouin zone with an energy of 25-26 meV. This new feature does not belong to any of the six phonon branches expected for the rocksalt structure (as in the white dotted lines in Figs. 2c,d from the quasiharmonic approximation.
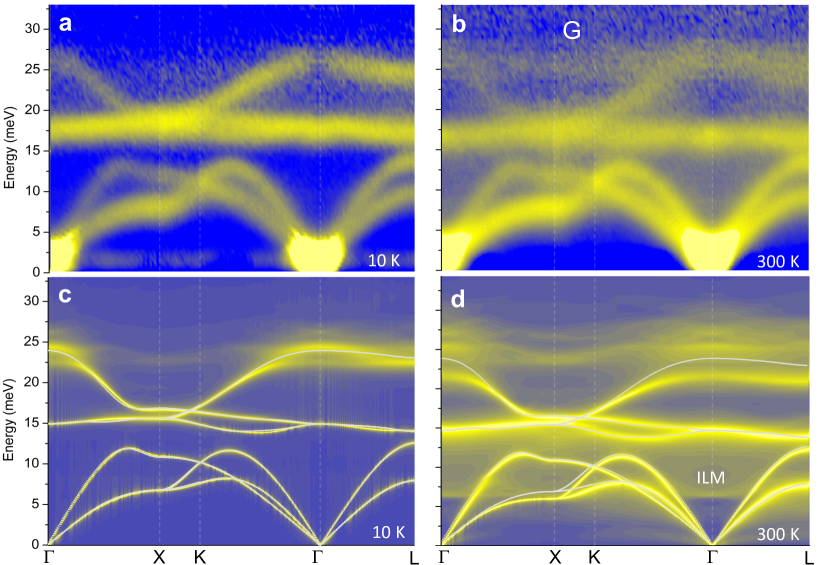
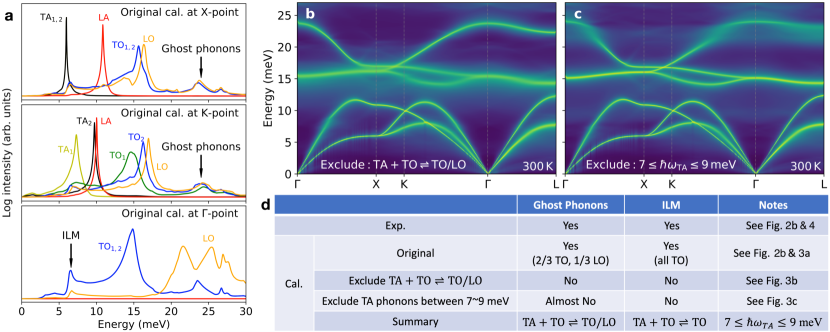
Figures 2a,c show that at 10 K, the quasiharmonic and anharmonic calculations agree well with each other, and with the experimental phonon dispersions. At 300 K, the quasiharmonic model predicts neither the phonon broadening, nor most of the thermal energy shift. The anharmonic calculations, however, reproduce these features and further predict the ghost intensity around 25 meV, in good agreement with experiment. Figure 3 shows that the ghost disappears when the calculation neglects the three-phonon anharmonic interactions of . Moreover, the participating TA phonons were shown to have energies between 7 and 9 meV. The diffuse features nearly vanish at 10 K. (They should not vanish entirely, however, owing to effects of the zero-point occupancies of the TA and TO modes [41, 27].) Finally, the computations showed that the new features comprise optical modes, with polarizations distributed evenly over all transverse (two) and longitudinal (one) possibilities.
Similarly, the calculated ILM near the -point is produced by in the calculation. Although the ILM is not definitive in Fig. 2b at 300 K, it is well-resolved at higher temperatures in the HB3 data of Fig. 4. This figure shows the temperature dependence of the lower IPS (i.e, the ILM) as observed in the (113) Brillouin zone at (1.2, 1.2, 3.0), along with the TA phonon. The spectral weight of this sideband gradually sharpens and intensifies with increasing temperature, and it shifts slightly to lower energy. The TA mode has an apparent stiffening with temperature, but this is an artifact from thermal expansion 222 The HB3 spectrometer was operated to maintain a constant for 300 K, without correcting for thermal expansion, which shrinks the Brillouin zones of the crystal. The measured therefore increases as the crystal expands, and the shift of the TA mode in Fig. 4 is consistent with the slope of the TA dispersion.. The TA mode also broadens with increasing temperature, as expected from the stronger coupling strength with increasing temperature, discussed below. Finally, the LA mode is suppressed in the spectra of Fig. 4 because is nearly perpendicular to the polarization vector of the LA mode, i.e., direction of atom displacements in the mode. (If the LA mode were visible, its temperature dependence would follow approximately the TA mode.)
The three phonon modes in Eq. II.2 are eigenstates of a dynamical matrix. Small anharmonic shifts and broadenings of these eigenstates do not produce new phonon branches or spectral features. Our anharmonic calculations obtained the diffuse features after applying a Kramers-Kronig transformation of Eq. 2 to the imaginary part of the phonon self energy of Eq. II.2. The semiquantitative success is interesting, because the calculations also predict a weak ILM [12, 43]. The dispersions in Fig. 2c,d are on a logarithmic scale, however, and the ILM and ghost modes are much weaker in the calculation with perturbation theory than in the experimental intensities, discussed with Fig. 5.
Compared to Eq. II.2, the Heisenberg–Langevin Eqs. 6 and 7 have no implicit assumption that is small. The intensities of the measured ghost modes are seen in Fig. 5, which are energy cuts at different along high-symmetry directions through the experimental data of Fig. 2b. The points near or (see Fig. 5c-g), show an extra peak above 20 meV, which is distinct from the highest normal LO phonon branch.
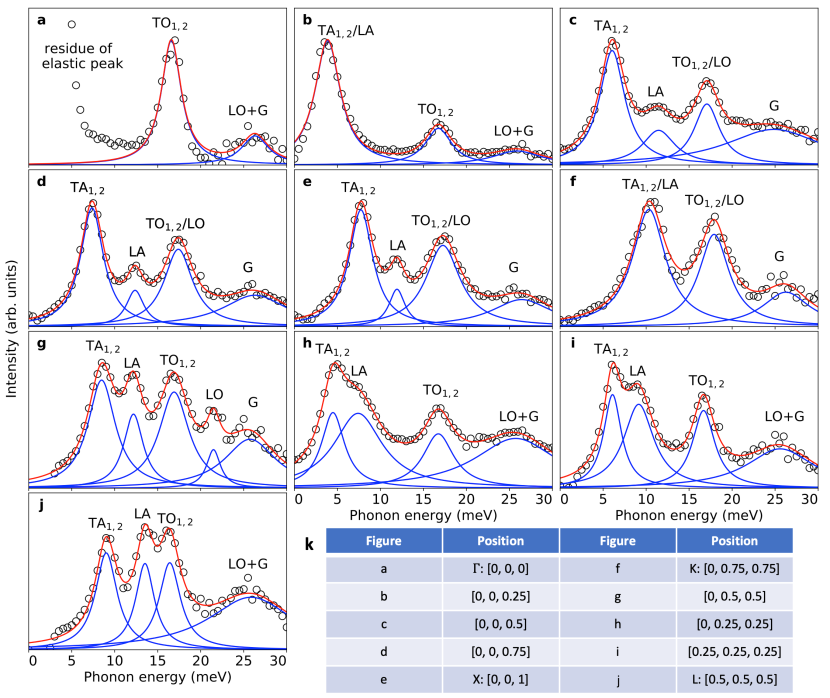
Phonon centroids were obtained by fitting with the Levenberg–Marquardt nonlinear least square method for multiple Lorentzian functions, giving the fitting parameters listed in Table S1 in the Supplementary Information. The fitting results were used to obtain average energies and linewidths of TO phonons and TA phonons in the energy range of 7-9 meV (i.e. , , , ) for calculating sidebands with the Heisenberg–Langevin model. By performing averages over TA and TO peaks that were not impaired by overlaps with other peaks, , , , meV, where subscripts 1 and 2 denote TO and TA, respectively The average frequency of the ghost mode () was obtained from Fig. 5 panels c,d,e,f,g as meV, satisfying .
The coupling strength was calculated by comparing the power intensity between the Heisenberg–Langevin model and the measured peak intensities at 300 K. Their ratio avoids scaling factors
| (16) |
The terms in the left-hand side are derived in the Supplemental Information. Here is the Planck distribution function (the thermal weight was corrected for the measured intensity shown in Fig. 2a,b), and the factor is included because two-thirds of the IPS feature are G-TO phonons.
V Discussion
At room temperature, our analysis showed that the lower intermodulation phonon sideband (IPS) should not be visible as a distinct peak. Also, the ARCS spectrometer has lower energy resolution at the energy of the lower sideband than at the energy of the upper sideband. The lower sideband is better seen with the HB3 instrument at higher temperatures (Fig. 4).
The -dependence of phonons in solids is not considered in Eqs. 6 and 7, and the conservation of crystal momentum is an added complexity that is not needed for other coupled quantum systems [16, 17, 18, 19, 20, 21, 22, 23]. Figure 2 shows that in NaBr, however, the TO phonon branch and the upper IPS are largely flat and dispersionless. The TA phonons involved in the three-phonon processes are in a small energy range of 7-9 meV as shown above with Fig. 3. The phonon dispersions (Fig. 2) show that most of the TA phonons are in this energy range, forming plateaus reaching to the Brillouin zone boundary. Most TA phonons can be described with an average energy independent of , and hence a coupling strength parameter independent of .
The conservation of crystal momentum, () allows the of the diffuse modes to sweep over all the first Brillouin zone when (TO modes) covers the first Brillouin zone, even for a single value of . Finally, the anharmonicity in Na-Br has no strong dependence on crystallographic direction, and is dominated by first-neighbor interactions [25].
Consider first the case where TA + TO G-LO and the interacting TA, TO, and LO diffuse phonon modes can be treated as individual quantum oscillators with a coupling coefficient . The total Hamiltonian is the same as Eq. 3. After dropping terms that do not conserve energy,
| (17) |
This is the same form as for parametric down-conversion in nonlinear optics. The mode coupling is enhanced resonantly when .
The second case TA + TO G-TO has the same transverse polarization for two optical modes. These two TO modes can be modeled as a single oscillator. Its spectral weight is re-distributed in energy owing to strong coupling to the TA mode. This is exactly the phonon intermodulation mechanism described with the quantum Langevin model.
The Supplemental Information gives more details of how experimentally measured parameters of , , and were used in a numerical analysis that generated the spectral shapes of Fig. 1b, with different coupling parameters, . In the weak-coupling case, our measured INS spectra would show no features other than the main peak at . In the medium-coupling case, the lower sideband peak at is only a shoulder on the main peak, but the upper sideband with should be distinct. The strong-coupling case shows two symmetric sidebands as shoulders on the main peak. The clear, isolated diffuse intensity “G” in Fig. 2b and weaker ILM are consistent with the TA and TO modes being in the medium-coupling case. To verify this, we solved numerically for the ratio between the heights of the two resonant peaks at and (Eq. 16), to obtain the coupling strength parameter , showing that the system is indeed in the medium-coupling domain. This also explains the difference in visibility between the ILM and the ghost phonon mode.
The prior treatment of ILMs [6] considered the dynamics of a classical system with linear and cubic terms in the restoring forces between neighboring atoms, and showed the conditions for mode localization. Our approach with the quantum Langevin equation is better able to predict the spectral shape, providing deeper insights into the phonon intermodulation mechanism. Unlike a classical intermodulation, phonon intermodulation can have an asymmetric quantum effect of enhancing one sideband at the expense of the other.
Other materials with anharmonic phonons should have IPSs at modest temperatures. Different alkali halides are obvious candidates, as are materials with phonon instabilities, where nonlinear phonon interactions may generate sidebands as the instabilities grow. The sidebands in NaBr were from acoustic plus optic modes, but in principle, two anharmonic optic modes could also generate sidebands. Anharmonicity may offer a new functionality for optical materials in the infrared, or a means to modulate visible light in ways that originate with phonon interactions, rather than an asymmetry in electronic polarizability. The ghost modes in NaBr decay rapidly into TA and TO modes through three-phonon processes. The two new phonons are in phase, and would be entangled in the Einstein-Podolsky-Rosen sense. Their coherence time will be short, however.
VI Conclusion
A new band of spectral intensity from high energy phonons is predicted and observed in NaBr. It is an intermodulation phonon sideband (IPS) from anharmonic interactions between normal modes. Its partner, the lower sideband, is an intrinsic localized mode (ILM). The transfer of spectral weight to upper and lower IPSs likely occurs in other anharmonic materials, but the flat dispersions in NaBr make them easier to observe. The TO part of this feature is consistent with an IPS from the anharmonic coupling of TO modes and TA modes. The LO part is consistent with strong three-phonon process, again with anharmonic coupling to the TA modes. The spectral shapes and weights of the IPSs are altered by the quantum back action from the thermal bath. There are similarities to the formation of sidebands in laser-cavity experiments, which also depend on anharmonicity and quantum force fluctuations from the thermal bath. Compared to laser-cavity experiments with photons, the anharmonic sidebands in NaBr are a natural process that occurs in thermodynamic equilibrium, and both the interacting modes have the noise spectrum from the thermal bath. The IPS should be present at 0 K owing to couplings to the zero-point levels, and some traces may be visible in the dispersions at 10 K. The spectral shapes of the two sidebands offer a probe of quantum noise, giving parameters for mode coupling, and damping from the thermal bath. Perhaps the upper IPS could offer new methods for the thermal control of light-matter interactions.
References
- Chaikin and Lubensky [1995] P. M. Chaikin and T. C. Lubensky, Principles of condensed matter physics (Cambridge Univ. Press, Cambridge, UK, 1995).
- Ziman [2001] J. M. Ziman, Electrons and phonons: the theory of transport phenomena in solids (Oxford Univ. Press, Oxford, UK, 2001).
- Maradudin and Fein [1962] A. A. Maradudin and A. E. Fein, Scattering of neutrons by an anharmonic crystal, Phys. Rev. 128, 2589 (1962).
- Wallace [1998] D. C. Wallace, Thermodynamics of crystals (Wiley, New York, USA, 1998).
- Grimvall [1986] G. Grimvall, Thermophysical properties of materials (Elsevier, North-Holland, Amsterdam, 1986).
- Sievers and Takeno [1988] A. J. Sievers and S. Takeno, Intrinsic localized modes in anharmonic crystals, Phys. Rev. Lett. 61, 970 (1988).
- Sievers et al. [2013] A. J. Sievers, M. Sato, J. B. Page, and T. Rössler, Thermally populated intrinsic localized modes in pure alkali halide crystals, Phys. Rev. B 88, 104305 (2013).
- Sato and Sievers [2004] M. Sato and A. Sievers, Direct observation of the discrete character of intrinsic localized modes in an antiferromagnet, Nature 432, 486 (2004).
- Manley et al. [2009] M. E. Manley, A. J. Sievers, J. W. Lynn, S. A. Kiselev, N. I. Agladze, Y. Chen, A. Llobet, and A. Alatas, Intrinsic localized modes observed in the high-temperature vibrational spectrum of NaI, Phys. Rev. B 79, 134304 (2009).
- Manley et al. [2011] M. E. Manley, D. L. Abernathy, N. Agladze, and A. J. Sievers, Symmetry-breaking dynamical pattern and localization observed in the equilibrium vibrational spectrum of NaI, Sci. Rep. 1, 4 (2011).
- Manley et al. [2014] M. E. Manley, J. W. Lynn, D. Abernathy, E. Specht, O. Delaire, A. Bishop, R. Sahul, and J. Budai, Phonon localization drives polar nanoregions in a relaxor ferroelectric, Nat. Commun. 5, 3683 (2014).
- Manley et al. [2019] M. E. Manley, O. Hellman, N. Shulumba, A. F. May, P. J. Stonaha, J. Lynn, V. O. Garlea, A. Alatas, R. P. Hermann, J. D. Budai, et al., Intrinsic anharmonic localization in thermoelectric PbSe, Nat. Commun. 10, 1928 (2019).
- Kempa et al. [2014] M. Kempa, P. Ondrejkovic, P. Bourges, P. Marton, and J. Hlinka, Lattice dynamics of NaI studied by inelastic neutron scattering: absence of thermally induced discrete breathers, Phys. Rev. B 89, 054308 (2014).
- Pailhès et al. [2014] S. Pailhès, H. Euchner, V. M. Giordano, R. Debord, A. Assy, S. Gomès, A. Bosak, D. Machon, S. Paschen, and M. de Boissieu, Localization of propagative phonons in a perfectly crystalline solid, Phys. Rev. Lett. 113, 025506 (2014).
- Rivière et al. [2019] A. Rivière, S. Lepri, D. Colognesi, and F. Piazza, Wavelet imaging of transient energy localization in nonlinear systems at thermal equilibrium: the case study of NaI crystals at high temperature, Phys. Rev. B 99, 024307 (2019).
- Clerk et al. [2010] A. A. Clerk, M. H. Devoret, S. M. Girvin, F. Marquardt, and R. J. Schoelkopf, Introduction to quantum noise, measurement, and amplification, Rev. Mod. Phys. 82, 1155 (2010).
- Kippenberg and Vahala [2008] T. J. Kippenberg and K. J. Vahala, Cavity optomechanics: back-action at the mesoscale, Science 321, 1172 (2008).
- Vahala et al. [2009] K. Vahala, M. Herrmann, S. Knünz, V. Batteiger, G. Saathoff, T. Hänsch, and T. Udem, A phonon laser, Nat. Phys. 5, 682 (2009).
- Chan et al. [2011] J. Chan, T. M. Alegre, A. H. Safavi-Naeini, J. T. Hill, A. Krause, S. Gröblacher, M. Aspelmeyer, and O. Painter, Laser cooling of a nanomechanical oscillator into its quantum ground state, Nature 478, 89 (2011).
- Benz et al. [2016] F. Benz, M. K. Schmidt, A. Dreismann, R. Chikkaraddy, Y. Zhang, A. Demetriadou, C. Carnegie, H. Ohadi, B. de Nijs, R. Esteban, J. Aizpurua, and J. J. Baumberg, Single-molecule optomechanics in “picocavities”, Science 354, 726 (2016).
- Riedinger et al. [2016] R. Riedinger, S. Hong, R. A. Norte, J. A. Slater, J. Shang, A. G. Krause, V. Anant, M. Aspelmeyer, and S. Gröblacher, Non-classical correlations between single photons and phonons from a mechanical oscillator, Nature 530, 313 (2016).
- Renninger et al. [2018] W. Renninger, P. Kharel, R. Behunin, and P. Rakich, Bulk crystalline optomechanics, Nat. Phys. 14, 601 (2018).
- Tavernarakis et al. [2018] A. Tavernarakis, A. Stavrinadis, A. Nowak, I. Tsioutsios, A. Bachtold, and P. Verlot, Optomechanics with a hybrid carbon nanotube resonator, Nat. Commun. 9, 662 (2018).
- Abernathy et al. [2012] D. L. Abernathy, M. B. Stone, M. Loguillo, M. Lucas, O. Delaire, X. Tang, J. Lin, and B. Fultz, Design and operation of the wide angular-range chopper spectrometer arcs at the spallation neutron source, Rev. Sci. Instrum. 83, 015114 (2012).
- Shen et al. [2020] Y. Shen, C. N. Saunders, C. M. Bernal, D. L. Abernathy, M. E. Manley, and B. Fultz, Anharmonic origin of the giant thermal expansion of nabr, Phys. Rev. Lett. 125, 085504 (2020).
- Note [1] The internal structure of the ARCS spectrometer has radial, plate-like baffles of neutron absorbing material that block stray scattering off detector tubes from reaching other detectors. This works well, except for detectors located approximately 180∘ across the detector array. Those neutrons, elastically scattering across the diameter of the instrument, arrive at a later time than the main elastic peak, appearing to be at an inelastic energy transfer of 80% of . In the prior dataset of \tmspace+.1667emmeV, this artifact appears at 24\tmspace+.1667emmeV, overlapping the ghost modes. For the present dataset with \tmspace+.1667emmeV, its 40\tmspace+.1667emmeV artifact is safely out of range, although the energy resolution of the instrument is approximately times larger than the prior dataset.
- Kim et al. [2018] D. S. Kim, O. Hellman, J. Herriman, H. L. Smith, J. Y. Y. Lin, N. Shulumba, J. L. Niedziela, C. W. Li, D. L. Abernathy, and B. Fultz, Nuclear quantum effect with pure anharmonicity and the anomalous thermal expansion of silicon, Proc. Natl. Acad. Sci. USA 115, 1992 (2018).
- Kresse and Hafner [1993] G. Kresse and J. Hafner, Ab initio molecular dynamics for liquid metals, Phys. Rev. B 47, 558 (1993).
- Kresse and Hafner [1994] G. Kresse and J. Hafner, Ab initio molecular-dynamics simulation of the liquid-metal–amorphous-semiconductor transition in germanium, Phys. Rev. B 49, 14251 (1994).
- Kresse and Furthmüller [1996a] G. Kresse and J. Furthmüller, Efficiency of ab-initio total energy calculations for metals and semiconductors using a plane-wave basis set, Comput. Mater. Sci. 6, 15 (1996a).
- Kresse and Furthmüller [1996b] G. Kresse and J. Furthmüller, Efficient iterative schemes for ab initio total-energy calculations using a plane-wave basis set, Phys. Rev. B 54, 11169 (1996b).
- Kresse and Joubert [1999] G. Kresse and D. Joubert, From ultrasoft pseudopotentials to the projector augmented-wave method, Phys. Rev. B 59, 1758 (1999).
- Perdew et al. [1996] J. P. Perdew, K. Burke, and M. Ernzerhof, Generalized gradient approximation made simple, Phys. Rev. Lett. 77, 3865 (1996).
- Gajdoš et al. [2006] M. Gajdoš, K. Hummer, G. Kresse, J. Furthmüller, and F. Bechstedt, Linear optical properties in the projector-augmented wave methodology, Phys. Rev. B 73, 045112 (2006).
- Gonze and Lee [1997] X. Gonze and C. Lee, Dynamical matrices, born effective charges, dielectric permittivity tensors, and interatomic force constants from density-functional perturbation theory, Phys. Rev. B 55, 10355 (1997).
- Togo and Tanaka [2015] A. Togo and I. Tanaka, First principles phonon calculations in materials science, Scr. Mater. 108, 1 (2015).
- Hellman et al. [2011] O. Hellman, I. A. Abrikosov, and S. I. Simak, Lattice dynamics of anharmonic solids from first principles, Phys. Rev. B 84, 180301 (2011).
- Hellman et al. [2013] O. Hellman, P. Steneteg, I. A. Abrikosov, and S. I. Simak, Temperature dependent effective potential method for accurate free energy calculations of solids, Phys. Rev. B 87, 104111 (2013).
- Hellman and Abrikosov [2013] O. Hellman and I. A. Abrikosov, Temperature-dependent effective third-order interatomic force constants from first principles, Phys. Rev. B 88, 144301 (2013).
- Gardiner and Collett [1985] C. W. Gardiner and M. J. Collett, Input and output in damped quantum systems: quantum stochastic differential equations and the master equation, Phys. Rev. A 31, 3761 (1985).
- Markland and Ceriotti [2018] T. E. Markland and M. Ceriotti, Nuclear quantum effects enter the mainstream, Nature Reviews Chemistry 2, 0109 (2018).
- Note [2] The HB3 spectrometer was operated to maintain a constant for 300\tmspace+.1667emK, without correcting for thermal expansion, which shrinks the Brillouin zones of the crystal. The measured therefore increases as the crystal expands, and the shift of the TA mode in Fig. 4 is consistent with the slope of the TA dispersion.
- Shulumba et al. [2017] N. Shulumba, O. Hellman, and A. J. Minnich, Intrinsic localized mode and low thermal conductivity of pbse, Phys. Rev. B 95, 014302 (2017).
VII Acknowledgements
We thank O. Hellman, K. Vahala and F. Yang for helpful discussions. Research at the Spallation Neutron Source (SNS) and the High Flux Isotope Reactor (HFIR) at the Oak Ridge National Laboratory was sponsored by the Scientific User Facilities Division, Basic Energy Sciences (BES), Department of Energy (DOE). M.E.M was supported by the US Department of Energy, Office of Science, Office of Basic Energy Sciences, Materials Sciences and Engineering Division under Contract Number DE-AC05-00OR22725. This work used resources from National Energy Research Scientific Computing Center (NERSC), a DOE Office of Science User Facility supported by the Office of Science of the US Department of Energy under Contract DE-AC02-05CH11231. This work was supported by the DOE Office of Science, BES, under Contract DE-FG02-03ER46055.