CenterFusion: Center-based Radar and Camera Fusion for 3D Object Detection
Abstract
The perception system in autonomous vehicles is responsible for detecting and tracking the surrounding objects. This is usually done by taking advantage of several sensing modalities to increase robustness and accuracy, which makes sensor fusion a crucial part of the perception system. In this paper, we focus on the problem of radar and camera sensor fusion and propose a middle-fusion approach to exploit both radar and camera data for 3D object detection. Our approach, called CenterFusion, first uses a center point detection network to detect objects by identifying their center points on the image. It then solves the key data association problem using a novel frustum-based method to associate the radar detections to their corresponding object’s center point. The associated radar detections are used to generate radar-based feature maps to complement the image features, and regress to object properties such as depth, rotation and velocity. We evaluate CenterFusion on the challenging nuScenes dataset, where it improves the overall nuScenes Detection Score (NDS) of the state-of-the-art camera-based algorithm by more than 12%. We further show that CenterFusion significantly improves the velocity estimation accuracy without using any additional temporal information. The code is available at https://github.com/mrnabati/CenterFusion.
1 Introduction
Autonomous vehicles are usually equipped with different types of sensors to take advantage of their complimentary characteristics. Using multiple sensor modalities increases robustness and accuracy, but also introduces new challenges in designing the perception system. Sensor fusion is one of these challenges, which has motivated many studies in 2D and 3D object detection [4, 10, 14, 19], semantic segmentation [33, 16] and object tracking [1, 7] in recent years.
Most of the recent sensor fusion methods focus on exploiting LiDAR and camera for 3D object detection. LiDARs use the time of flight of laser light pulses to calculate distance to surrounding objects. LiDARs provide accurate 3D measurement at close range, but the resulting point cloud becomes sparse at long range, reducing the system’s ability to accurately detect far away objects. Cameras provide rich appearance features, but are not a good source of information for depth estimation. These complementary features have made LiDAR-camera sensor fusion a topic of interest in recent years. This combination has been proven to achieve high accuracy in 3D object detection for many applications including autonomous driving, but it has its limitations. Cameras and LiDARs are both sensitive to adverse weather conditions (e.g. snow, fog, rain), which can significantly reduce their field of view and sensing capabilities. Additionally, LiDARs and cameras are not capable of detecting objects’ velocity without using temporal information. Estimating objects’ velocity is a crucial requirement for collision avoidance in many scenarios, and relying on the temporal information might not be a feasible solution in time-critical situations.
For many years, radars have been used in vehicles for Advanced Driving Assistance System (ADAS) applications such as collision avoidance and Adaptive Cruise Control (ACC). Compared to LiDARs and cameras, radars are very robust to adverse weather conditions and are capable of detecting objects at very long range (up to 200 meters for automotive radars). Radars use the Doppler effect to accurately estimate the velocities of all detected objects, without requiring any temporal information. Additionally, compared to LiDARs, Radar point clouds require less processing before they can be used as object detection results. These features and their lower cost compared to LiDARs, have made radars a popular sensor in autonomous driving applications.
Despite radar’s popularity in the automotive industry, few studies have focused on fusing radar data with other sensors. One reason for this is the fact that there are not many datasets containing radar data for autonomous driving applications, which makes conducting research in this area difficult. Additionally, due to inherent differences between LiDAR and radar point clouds, applying or adapting existing LiDAR-based algorithms to radar point cloud proves to be extremely difficult. Radar point clouds are significantly more sparse than their LiDAR counter parts, making it unfeasible to use for extracting objects’ geometry information. Aggregating multiple radar sweeps increases the density of the points, but also introduces delay into the system. Moreover, although radar point clouds are usually represented as points in the 3D coordinate system, the reported vertical measurement of the points are usually not accurate or even non-existent, as most automotive radars only report the distance and azimuth angle to objects.
In order to effectively combine multiple sensing modalities, a variety of sensor fusion schemes have been developed [8] taking advantage of the hierarchical feature representation in neural networks. In an early fusion approach, the raw or pre-processed sensory data from different sensor modalities are fused together. With this approach, the network learns a joint representation from the sensing modalities. Early fusion methods are usually sensitive to spatial or temporal misalignment of the data [8]. On the other hand, a late fusion approach combines the data from different modalities at the decision level, and provides more flexibility for introducing new sensing modalities to the network. However, a late fusion approach does not exploit the full potential of the available sensing modalities, as it does not acquire the intermediate features obtained by learning a joint representation. A compromise between the early and late fusion approaches is referred to as middle fusion. It extracts features from different modalities individually and combines them at an intermediate stage, enabling the network to learn joint representations and creating a balance between sensitivity and flexibility.
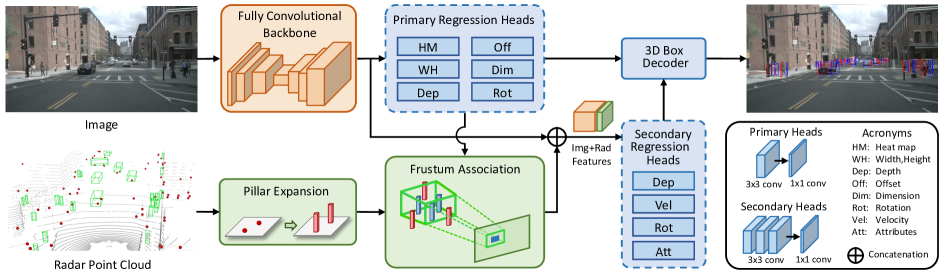
We propose CenterFusion, a middle-fusion approach to exploit radar and camera data for 3D object detection. CenterFusion focuses on associating radar detections to preliminary detection results obtained from the image, then generates radar feature maps and uses it in addition to image features to accurately estimate 3D bounding boxes for objects. Particularly, we generate preliminary 3D detections using a key point detection network, and propose a novel frustum-based radar association method to accurately associate radar detections to their corresponding objects in the 3D space. These radar detections are then mapped to the image plane and used to create feature maps to complement the image-based features. Finally, the fused features are used to accurately estimate objects’ 3D properties such as depth, rotation and velocity. The network architecture for CenterFusion is shown in Fig. 1.
We evaluate CenterFusion on the challenging nuScenes [2] dataset, where it outperforms all previous camera-based object detection methods in the 3D object detection benchmark. We also show that exploiting radar information significantly improves velocity estimation for objects without using any temporal information.
2 Related Work
2.1 Single-modality Methods
Monocular 3D object detection methods use a single camera to estimate 3D bounding boxes for objects. Many studies have been reported, taking different approaches to extract the depth information from monocular images. 3D RCNN [11] uses Fast R-CNN [9] with an additional head and 3D projection. It also uses a collection of CAD models to learn class-specific shape priors for objects. Deep3DBox [17] regresses a set of 3D object properties using a convolutional neural network first, then uses the geometric constraints of 2D bounding boxes to produce a 3D bounding box for the object. CenterNet [34] takes a different approach and uses a keypoint detection network to find objects’ center point on the image. Other object properties such as 3D dimension and location are obtained by regression using only the image features at the object’s center point.
LiDARs have been widely used for 3D object detection and tracking in autonomous driving applications in recent years. The majority of LiDAR-based methods either use 3D voxels [12, 35] or 2D projections [13, 5, 29, 31] for point cloud representation. Voxel-based methods are usually slow as a result of the voxel grid’s high dimensionality, and projection-based methods might suffer from large variances in object shapes and sizes depending on the projection plane. PointRCNN [25] directly operates on raw point clouds and generates 3D object proposals in a bottom-up manner using point cloud segmentation. These proposals are refined in the second stage to generate the final detection boxes.
2.2 Fusion-based Methods
Most existing sensor fusion methods focus on the LiDAR and camera fusion problem. MV3D [4] extracts features from the front view and Bird’s Eye View (BEV) representations of the LiDAR data, in addition to the RGB image. The features obtained from the LiDAR’s BEV are then used to generate 3D object proposals, and a deep fusion network is used to combine features from each view and predict the object class and box orientations. PointFusion [28] processes the image and LiDAR data using a CNN and a PointNet model respectively, and then generate 3D object proposals using the extracted features. Frustum PointNet [23] directly operates on the raw point clouds obtained from an RGB-D camera and uses the RGB image and a 2D object detector to localize objects in the point cloud.
Few studies have focused on fusing radars with other sensors for autonomous driving applications. RadarNet [30] fuses radar and LiDAR data for 3D object detection. It uses an early fusion mechanism to learn joint representations from the two sensors, and a late-fusion mechanism to exploit radar’s radial velocity evidence and improve the estimated object velocity. In [3], Chadwick et al. project radar detections to the image plane and use them to boost the object detection accuracy for distant objects. In [20] authors use radar detections to generate 3D object proposals first, then project them to the image plane to perform joint 2D object detection and depth estimation. CRF-Net [22] also projects radar detections to the image plane, but represents them as vertical lines where the pixel values correspond to the depth of each detection point. The image data is then augmented with the radar information and used in a convolutional network to perform 2D object detection.
3 Preliminary
3.1 Radar Point Cloud
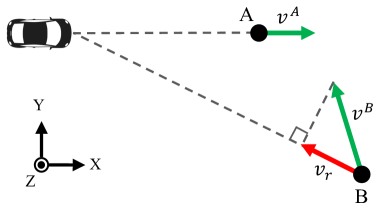
Radars are active sensors that transmit radio waves to sense the environment and measure the reflected waves to determine the location and velocity of objects. Automotive radars usually report the detected objects as 2D points in BEV, providing the azimuth angle and radial distance to the object. For every detection, the radar also reports the instantaneous velocity of the object in the radial direction. This radial velocity does not necessarily match the object’s actual velocity vector in it’s direction of movement. Fig. 2 illustrates the difference between the radial as reported by the radar, and actual velocity of the object in the vehicle’s coordinate system.
We represent each radar detection as a 3D point in the egocentric coordinate system, and parameterize it as ) where is the position and is the reported radial velocity of the object in the and directions. The radial velocity is compensated by the ego vehicle’s motion. For every scene, we aggregate 3 sweeps of the radar point cloud (detections within the past 0.25 seconds). The nuScenes dataset provides the calibration parameters needed for mapping the radar point clouds from the radar coordinates system to the egocentric and camera coordinate systems.
3.2 CenterNet
CenterNet [34] represents the state-of-the-art in 3D object detection using single camera. It takes an image as input and generates a keypoint heatmap as output where and are the image width and height, is the downsampling ratio and is the number of object categories. A prediction of as the output indicates a detected object of class centered at position on the image. The ground-truth heatmap is generated from the ground-truth 2D bounding boxes using a Gaussian kernel. For each bounding box center point of class in the image, a Gaussian heatmap is generated on . The final value of for class at position is defined as [34]:\useshortskip
| (1) |
where is a size-adaptive standard deviation, controlling the size of the heatmap for every object based on its size. A fully convolutional encode-decoder network is used to predict .
To generate 3D bounding boxes, separate network heads are used to regress object’s depth, dimensions and orientation directly from the detected center points. Depth is calculated as an additional output channel after applying the inverse sigmoidal transformation used in Eigen et al. [6] to the original depth domain. The object dimensions are directly regressed to their absolute values in meter as three output channels . Orientation is encoded as two bins with 4 scalars in each bin, following the orientation representation in Mousavian et al. [18]. For each center point, a local offset is also predicted to compensate for the discretization error caused by the output strides in the backbone network [34].
Given the annotated objects in an image, the training objective is defined as below based on the focal loss [15]:
where is the number of objects, is the annotated objects’ ground-truth heatmap and and are focal loss hyperparameters.
4 CenterFusion
In this section we present our approach to radar and camera sensor fusion for 3D object detection. The overall CenterFusion architecture is shown in Fig. 1. We adopt [34] as our center-based object detection network to detect objects’ center points on the image plane, and regress to other object properties such as 3D location, orientation and dimensions. We propose a middle-fusion mechanism that associates radar detections to their corresponding object’s center point and exploits both radar and image features to improve the preliminary detections by re-estimating their depth, velocity, rotation and attributes.
The key in our fusion mechanism is accurate association of radar detections to objects. The center point object detection network generates a heat map for every object category in the image. The peaks in the heat map represent possible center points for objects, and the image features at those locations are used to estimate other object properties. To exploit the radar information in this setting, radar-based features need to be mapped to the center of their corresponding object on the image, which requires an accurate association between the radar detections and objects in the scene.
4.1 Center Point Detection
We adopt the CenterNet [34] detection network for generating preliminary detections on the image. The image features are first extracted using a fully convolutional encoder-decoder backbone network. We follow CenterNet [34] and use a modified version of the Deep Layer Aggregation (DLA) network [32] as the backbone. The extracted image features are then used to predict object center points on the image, as well as the object 2D size (width and height), center offset, 3D dimensions, depth and rotation. These values are predicted by the primary regression heads as shown in Fig. 1. Each primary regression head consists of a convolution layer with 256 channels and a convolutional layer to generate the desired output. This provides an accurate 2D bounding box as well as a preliminary 3D bounding box for every detected object in the scene.
4.2 Radar Association
The center point detection network only uses the image features at the center of each object to regress to all other object properties. To fully exploit radar data in this process, we first need to associate the radar detections to their corresponding object on the image plane. To accomplish this, a naïve approach would be mapping each radar detection point to the image plane and associating it to an object if the point is mapped inside the 2D bounding box of that object. This is not a very robust solution, as there is not a one-to-one mapping between radar detections and objects in the image; Many objects in the scene generate multiple radar detections, and there are also radar detections that do not correspond to any object. Additionally, because the dimension of the radar detection is not accurate (or does not exist at all), the mapped radar detection might end up outside the 2D bounding box of its corresponding object. Finally, radar detections obtained from occluded objects would map to the same general area in the image, which makes differentiating them in the 2D image plane difficult, if possible at all.
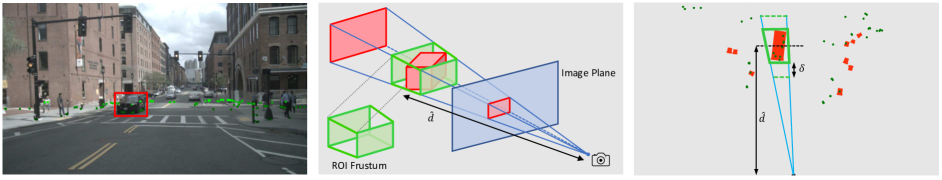
Frustum Association Mechanism: We develop a frustum association method that uses the object’s 2D bounding box as well as its estimated depth and size to create a 3D Region of Interest (RoI) frustum for the object. Having an accurate 2D bounding box for an object, we create a frustum for that object as shown in Fig. 3. This significantly narrows down the radar detections that need to be checked for association, as any point outside this frustum can be ignored. We then use the estimated object depth, dimension and rotation to create a RoI around the object, to further filter out radar detections that are not associated with this object. If there are multiple radar detections inside this RoI, we take the closest point as the radar detection corresponding to this object.
In the training phase, we use the object’s 3D ground truth bounding box to create a tight RoI frustum and associate radar detections to the object. In the test phase, the RoI frustum is calculated using the object’s estimated 3D bounding box as explained before. In this case, we use a parameter to control the size of the RoI frustum as shown in Fig. 3. This is to account for inaccuracy in the estimated depth values, as the depth of the object at this stage is solely determined using the image-based features. Enlarging the frustum using this parameter increases the chance of including the corresponding radar detections inside the frustum even if the estimated depth is slightly off. The value of should be carefully selected, as a large RoI frustum can include radar detections of nearby objects.
The RoI frustum approach makes associating overlapping objects effortless, as objects are separated in the 3D space and would have separate RoI frustums. It also eliminates the multi-detection association problem, as only the closest radar detection inside the RoI frustum is associated to the object. It does not, however, help with the inaccurate dimension problem, as radar detections might be outside the ROI frustum of their corresponding object due to their inaccurate height information.
Pillar Expansion: To address the inaccurate height information problem, we introduce a radar point cloud preprocessing step called pillar expansion, where each radar point is expanded to a fixed-size pillar, as illustrated in Fig. 4. Pillars create a better representation for the physical objects detected by the radar, as these detections are now associated with a dimension in the 3D space. Having this new representation, we simply consider a radar detection to be inside a frustum if all or part of its corresponding pillar is inside the frustum, as shown in Fig. 1.
4.3 Radar Feature Extraction
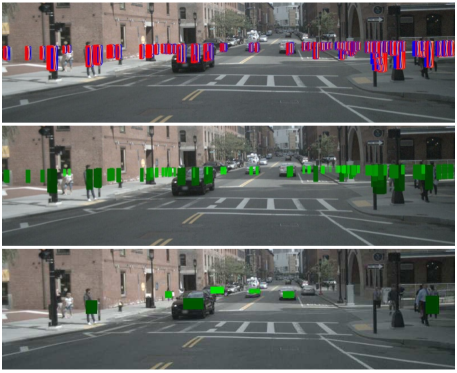
After associating radar detections to their corresponding objects, we use the depth and velocity of the radar detections to create complementary features for the image. Particularly, for every radar detection associated to an object, we generate three heat map channels centered at and inside the object’s 2D bounding box, as shown in Fig. 4. The width and height of the heatmaps are proportional to the object’s 2D bounding box, and are controlled by a parameter . The heatmap values are the normalized object depth () and also the and components of the radial velocity ( and ) in the egocentric coordinate system:
where is the feature map channel, is a normalizing factor, is the feature value (, or ), and are the and coordinates of the th object’s center point on the image and and are the width and height of the th object’s 2D bounding box. If two objects have overlapping heatmap areas, the one with a smaller depth value dominates, as only the closest object is fully visible in the image.
The generated heat maps are then concatenated to the image features as extra channels. These features are used as inputs to the secondary regression heads to recalculate the object’s depth and rotation, as well as velocity and attributes. The velocity regression head estimates the and components of the object’s actual velocity in the vehicle coordinate system. The attribute regression head estimates different attributes for different object classes, such as moving or parked for the Car class and standing or sitting for the Pedestrian class. The secondary regression heads consist of three convolutional layers with kernels followed by a convolutional layer to generate the desired output. The extra convolutional layers compared to the primary regression heads help with learning higher level features from the radar feature maps. The last step is decoding the regression head results into 3D bounding boxes. The box decoder block uses the estimated depth, velocity, rotation, and attributes from the secondary regression heads, and takes the other object properties from the primary heads.
5 Implementation Details
We use the pre-trained CenterNet [34] network with the DLA [32] backbone as our object detection network. DLA uses iterative deep aggregation layers to increase the resolution of feature maps. CenterNet compares its performance using different backbone architectures, with the Hourglass network [21] performing better than others. We choose to use the DLA network as it takes significantly less time to train while providing a reasonable performance.
We directly use the released CenterNet model that is trained for 140 epochs on the nuScenes dataset. This model by default does not provide velocity and attribute predictions. We train the velocity and attribute heads for 30 epochs, and use the resulting model as our baseline. The secondary regression heads in our network are added on top of the CenterNet backbone network, and are trained using the image and radar features for an additional 60 epochs with a batch size of 26 on two Nvidia P5000 GPUs.
During both training and testing, we reduce the image resolution from the original 1600900 pixels to 800450 pixels. Data augmentation is used during training, with random right-left flipping (with a probability of 0.5) and random shifting (from 0 to 20 percent of image size). The same augmentations are also applied to the radar point cloud in reference to the camera coordinate system. We do not apply any scaling augmentation as it changes the 3D measurements. At testing time, we only use flip test augmentation where an image and its flipped version are fed into the network and the average of the network outputs is used for decoding the 3D bounding boxes. We do not use the multi-scale test augmentation as used by CenterNet. The pillar size is set to meters in the directions and is set to increase the length of the RoI frustum by 20% in the radial direction at test time.
We use the L1 loss for most of the regression heads, with the exception of the center point heat map head which uses the focal loss and the attributes regression head that uses the Binary Cross Entropy (BCE) loss.
| Modality | Error | ||||||||||
| Method | Dataset | C | R | L | NDS | mAP | mATE | mASE | mAOE | mAVE | mAAE |
| InfoFocus [27] | test | ✓ | 0.395 | 0.395 | 0.363 | 0.265 | 1.132 | 1.000 | 0.395 | ||
| OFT [24] | test | ✓ | 0.212 | 0.126 | 0.820 | 0.360 | 0.850 | 1.730 | 0.480 | ||
| MonoDIS [26] | test | ✓ | 0.384 | 0.304 | 0.738 | 0.263 | 0.546 | 1.533 | 0.134 | ||
| CenterNet (HGLS) [34] | test | ✓ | 0.400 | 0.338 | 0.658 | 0.255 | 0.629 | 1.629 | 0.142 | ||
| Ours (DLA) | test | ✓ | ✓ | 0.449 | 0.326 | 0.631 | 0.261 | 0.516 | 0.614 | 0.115 | |
| CenterNet (DLA) [34] | val | ✓ | 0.328 | 0.306 | 0.716 | 0.264 | 0.609 | 1.426 | 0.658 | ||
| Ours (DLA) | val | ✓ | ✓ | 0.453 | 0.332 | 0.649 | 0.263 | 0.535 | 0.540 | 0.142 | |
| Modality | mAP | |||||||||||||
| Method | Dataset | C | R | L | Car | Truck | Bus | Trailer | Const. | Pedest. | Motor. | Bicycle | Traff. | Barrier |
| InfoFocus [27] | test | ✓ | 0.779 | 0.314 | 0.448 | 0.373 | 0.107 | 0.634 | 0.290 | 0.061 | 0.465 | 0.478 | ||
| MonoDIS [26] | test | ✓ | 0.478 | 0.220 | 0.188 | 0.176 | 0.074 | 0.370 | 0.290 | 0.245 | 0.487 | 0.511 | ||
| CenterNet (HGLS) [34] | test | ✓ | 0.536 | 0.270 | 0.248 | 0.251 | 0.086 | 0.375 | 0.291 | 0.207 | 0.583 | 0.533 | ||
| Ours (DLA) | test | ✓ | ✓ | 0.509 | 0.258 | 0.234 | 0.235 | 0.077 | 0.370 | 0.314 | 0.201 | 0.575 | 0.484 | |
| CenterNet (DLA) [34] | val | ✓ | 0.484 | 0.231 | 0.340 | 0.131 | 0.035 | 0.377 | 0.249 | 0.234 | 0.550 | 0.456 | ||
| Ours (DLA) | val | ✓ | ✓ | 0.524 | 0.265 | 0.362 | 0.154 | 0.055 | 0.389 | 0.305 | 0.229 | 0.563 | 0.470 | |
6 Results
We compare our radar and camera fusion network with the state-of-the-art camera-based models on the nuScenes benchmark, and also a LIDAR based method. Table 1 shows the results on both test and validation splits of the nuScenes dataset. We compare with OFT [24], MonoDIS [26] and CenterNet [34] which are camera-based 3D object detection networks, as well as InfoFocus [27] which is a LIDAR-based method. As seen in Table 1, CenterFusion outperforms all other methods in the nuScenes NDS score, which is a weighted sum of the mAP and the error metrics. On the test dataset, CenterFusion shows a 12.25% and 16.9% relative increase in the NDS score compared to CenterNet and MonoDIS respectively. The LIDAR-based method InfoFocus shows a better performance in the mAP score compared to other methods, but is significantly outperformed by CenterFusion in the orientation, velocity and attribute error metrics. While CenterNet with the Hourglass [21] backbone network results in a better mAP score compared to CenterFusion (1.2% difference) on the test split, the results on the validation split show that CenterFusion outperforms CenterNet by 2.6% when both networks use the same DLA [32] backbone. The validation set results also show CenterFusion improving CenterNet in all the other metrics. CenterFusion shows an absolute gain of 38.1% and 62.1% relative increase in the NDS and velocity error metrics compared to CenterNet, which demonstrates the effectiveness of using radar features.
Table 2 compares the per-class mAP results for both test and validation splits. While CenterNet with an Hourglass backbone has a higher mAP than CenterFusion for most classes in the test set, it is outperformed by CenterFusion on the validation set where the DLA backbone is used for both methods. The most improved classes on the validation set are the motorcycle and car with 5.6% and 4.0% absolute mAP increase respectively.
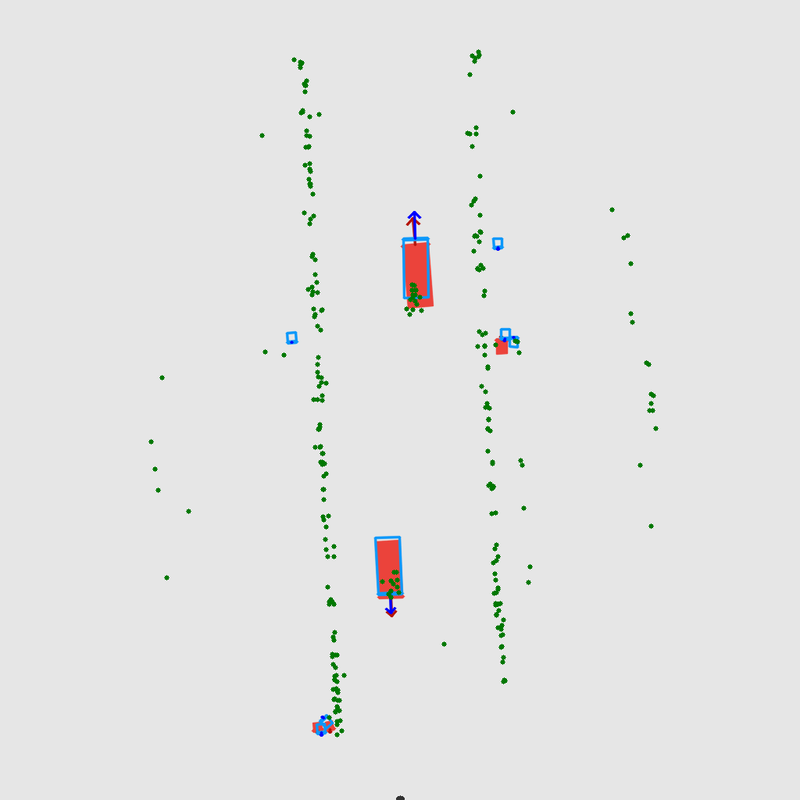
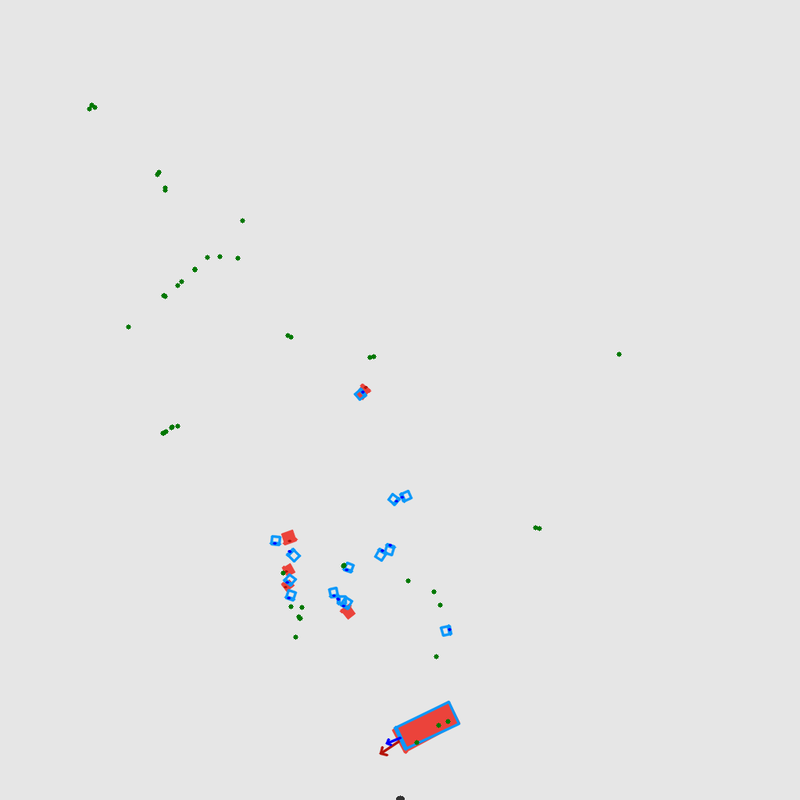
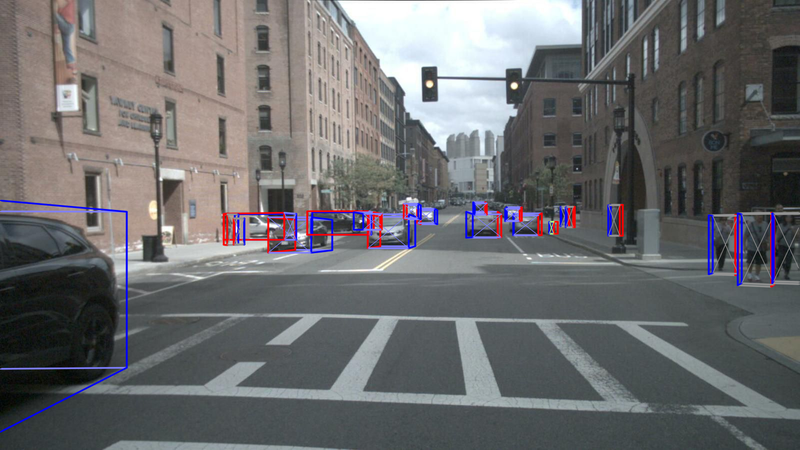
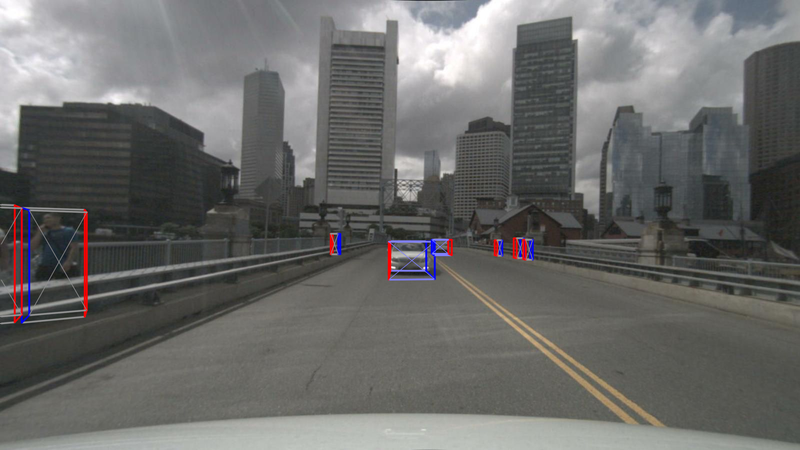
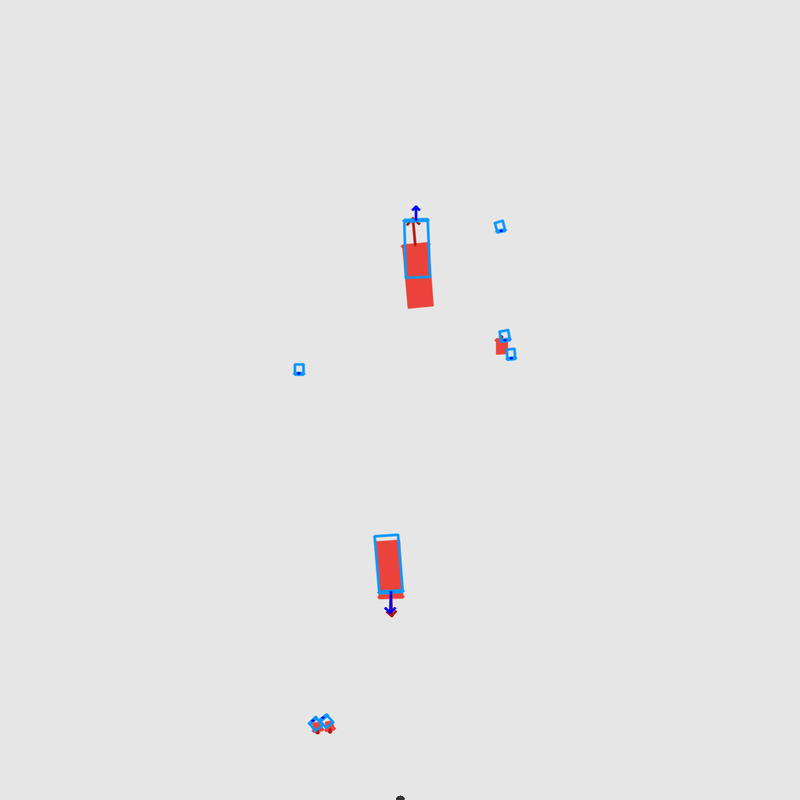
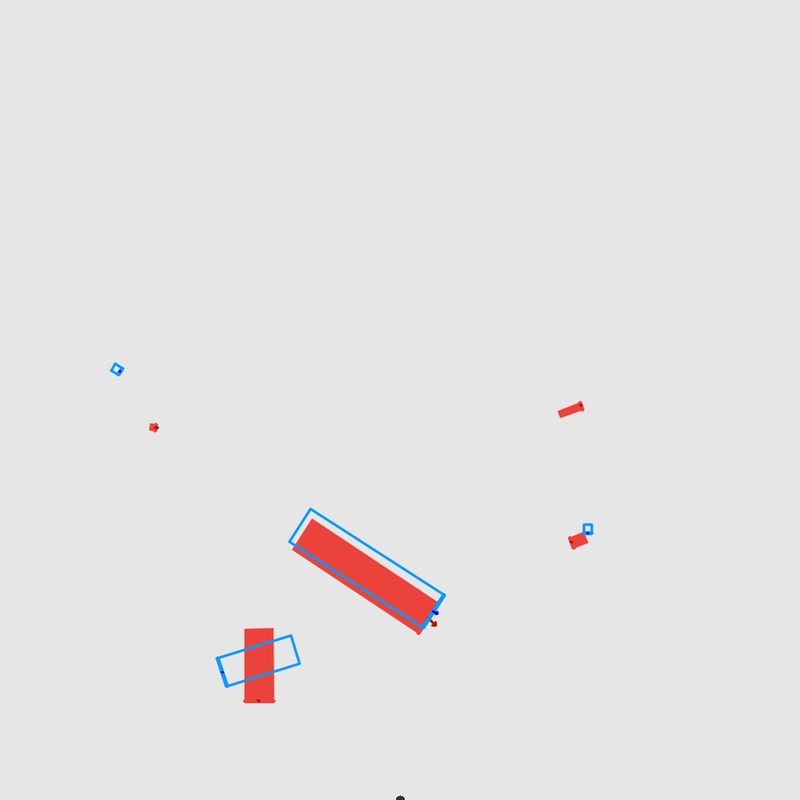
Fig. 5 demonstrates the 3D object detection results in both camera and BEV. It shows the detection results from CenterFusion (row 1 & 2) and CenterNet (row 3 & 4) for 4 different scenes. The radar point clouds are also shown in the CenterFusion BEV results. Compared to CenterNet, the results from CenterFusion show a better fit for 3D boxes in most cases, especially objects at a larger distance, such as the far vehicle in the second scene. Additionally, the velocity vectors estimated by CenterFusion show a significant improvement compared to the CenterNet results, as seen in the second and third scenes.
| Method | Cam | Rad | PE | FA | FT | NDS | mAP | mATE | mASE | mAOE | mAVE | mAAE |
|---|---|---|---|---|---|---|---|---|---|---|---|---|
| Baseline | ✓ | - | - | - | - | 0.328 | 0.306 | 0.716 | 0.264 | 0.609 | 1.426 | 0.658 |
| Ours | ✓ | ✓ | ✓ | - | - | +15.4% | +1.0% | -2.0% | +1.1% | -4.4% | -13.1% | -68.6% |
| Ours | ✓ | ✓ | - | ✓ | - | +25.9% | +2.0% | -2.8% | +1.0% | -7.4% | -48.1% | -75.9% |
| Ours | ✓ | ✓ | ✓ | ✓ | - | +34.5% | +4.3% | -5.3% | +1.1% | -10.0% | -61.9% | -78.0% |
| Ours | ✓ | ✓ | ✓ | ✓ | ✓ | +37.8% | +8.4% | -9.4% | -0.5% | -11.6% | -62.0% | -78.3% |
| Method | Cam | Rad | PE | FA | FT | Car | Truck | Bus | Trailer | Const. | Pedest. | Motor. | Bicycle | Traff. | Barrier |
|---|---|---|---|---|---|---|---|---|---|---|---|---|---|---|---|
| Baseline | ✓ | - | - | - | - | 48.4 | 23.1 | 34.0 | 13.1 | 3.5 | 37.7 | 24.9 | 23.4 | 55.0 | 45.6 |
| Ours | ✓ | ✓ | ✓ | - | - | +0.6 | +0.7 | -2.1 | +0.9 | +0.6 | +0.9 | +1.9 | -2.5 | +0.1 | +0.8 |
| Ours | ✓ | ✓ | - | ✓ | - | +1.0 | +1.0 | -2.1 | +0.9 | +0.9 | 0.0 | +2.1 | -1.9 | +0.2 | +0.8 |
| Ours | ✓ | ✓ | ✓ | ✓ | - | +2.8 | +2.1 | -1.2 | +1.4 | +1.1 | +0.1 | +3.8 | -1.1 | +0.4 | +0.8 |
| Ours | ✓ | ✓ | ✓ | ✓ | ✓ | +4.1 | +3.4 | +2.7 | +1.8 | +1.8 | +1.2 | +5.5 | -0.7 | +1.3 | +1.5 |


7 Ablation Study
We validate the effectiveness of our fusion approach by conducting an ablation study on the nuScenes validation set. We use the CenterNet model as our baseline, and study the effectiveness of the pillar expansion, frustum association and flip testing on the detection results. Table 3 shows the overall detection results of the ablation study.
In the first experiment, we only apply pillar expansion to the radar point clouds, and map the 3D pillars to the image plane and obtain their equivalent 2D bounding boxes. These boxes are then filled with the depth and velocity values of their corresponding radar detections and used as the radar feature maps, as shown in Fig. 4. According to Table 3, this simple association method results in a 15.4% relative improvement on the NDS score and 1.0% absolute improvement on the mAP compared to the baseline.
In the next experiment we only use the frustum association method by directly applying it on the radar point clouds without converting them to pillars first. This improves the NDS score by 25.9% relatively and mAP by 2.0%. Applying both pillar expansion and frustum association results in a relative 35.5% and absolute 4.3% improvement on the NDS and mAP scores respectively. Flip testing adds another 3.3% improvement on the NDS score and 3.9% on the mAP, resulting in a total of 37.8% and 8.4% improvement on NDS and mAP compared to the baseline method.
Table 4 shows the per-class contribution of each step on the mAP. According to the results, both pillar expansion and frustum association steps have contributed to the improvement of mAP in most object classes. The only class that has not improved from the baseline is the bicycle class, in which the CenterNet mAP score is better than CenterFusion by 0.5%.
8 Conclusion
In summary, we proposed a new radar and camera fusion algorithm called CenterFusion, to exploit radar information for robust 3D object detection. CenterFusion accurately associates radar detections to objects on the image using a frustum-based association method, and creates radar-based feature maps to complement the image features in a middle-fusion approach. Our frustum association method uses preliminary detection results to generate a RoI frustum around objects in 3D space, and maps the radar detection to the center of objects on the image. We also used a pillar expansion method to compensate for the inaccuracy in radar detections’ height information, by converting radar points to fixed-size pillars in the 3D space. We evaluated our proposed method on the challenging nuScenes 3D detection benchmark, where CenterFusion outperformed the state-of-the-art camera-based object detection methods.
References
- [1] A. Asvadi, P. Girão, P. Peixoto, and U. Nunes. 3d object tracking using rgb and lidar data. In 2016 IEEE 19th International Conference on Intelligent Transportation Systems (ITSC), pages 1255–1260, 2016.
- [2] Holger Caesar, Varun Bankiti, Alex H. Lang, Sourabh Vora, Venice Erin Liong, Qiang Xu, Anush Krishnan, Yu Pan, Giancarlo Baldan, and Oscar Beijbom. nuscenes: A multimodal dataset for autonomous driving. arXiv preprint arXiv:1903.11027, 2019.
- [3] Simon Chadwick, Will Maddern, and Paul Newman. Distant Vehicle Detection Using Radar and Vision. arXiv:1901.10951 [cs], May 2019.
- [4] Xiaozhi Chen, Huimin Ma, Ji Wan, Bo Li, and Tian Xia. Multi-view 3d object detection network for autonomous driving. 2017 IEEE Conference on Computer Vision and Pattern Recognition (CVPR), Jul 2017.
- [5] Xiaozhi Chen, Huimin Ma, Ji Wan, Bo Li, and Tian Xia. Multi-View 3D Object Detection Network for Autonomous Driving. arXiv:1611.07759 [cs], June 2017.
- [6] David Eigen, Christian Puhrsch, and Rob Fergus. Depth map prediction from a single image using a multi-scale deep network. In Advances in neural information processing systems, pages 2366–2374, 2014.
- [7] Yongkun Fang, Huijing Zhao, Hongbin Zha, Xijun Zhao, and Wen Yao. Camera and lidar fusion for on-road vehicle tracking with reinforcement learning. In 2019 IEEE Intelligent Vehicles Symposium (IV), pages 1723–1730. IEEE, 2019.
- [8] Di Feng, Christian Haase-Schuetz, Lars Rosenbaum, Heinz Hertlein, Claudius Glaeser, Fabian Timm, Werner Wiesbeck, and Klaus Dietmayer. Deep multi-modal object detection and semantic segmentation for autonomous driving: Datasets, methods, and challenges. arXiv:1902.07830 [cs], Feb. 2020.
- [9] Ross Girshick. Fast r-cnn. 2015 IEEE International Conference on Computer Vision (ICCV), Dec 2015.
- [10] Jason Ku, Melissa Mozifian, Jungwook Lee, Ali Harakeh, and Steven L. Waslander. Joint 3d proposal generation and object detection from view aggregation. 2018 IEEE/RSJ International Conference on Intelligent Robots and Systems (IROS), Oct 2018.
- [11] Abhijit Kundu, Yin Li, and James M. Rehg. 3D-RCNN: Instance-Level 3D Object Reconstruction via Render-and-Compare. In 2018 IEEE/CVF Conference on Computer Vision and Pattern Recognition, pages 3559–3568, Salt Lake City, UT, USA, June 2018. IEEE.
- [12] Bo Li. 3D Fully Convolutional Network for Vehicle Detection in Point Cloud. arXiv:1611.08069 [cs], Jan. 2017.
- [13] Bo Li, Tianlei Zhang, and Tian Xia. Vehicle Detection from 3D Lidar Using Fully Convolutional Network. arXiv:1608.07916 [cs], Aug. 2016.
- [14] Ming Liang, Bin Yang, Yun Chen, Rui Hu, and Raquel Urtasun. Multi-task multi-sensor fusion for 3d object detection. In The IEEE Conference on Computer Vision and Pattern Recognition (CVPR), June 2019.
- [15] Tsung-Yi Lin, Priya Goyal, Ross Girshick, Kaiming He, and Piotr Dollár. Focal Loss for Dense Object Detection. arXiv:1708.02002 [cs], Feb. 2018.
- [16] Gregory P. Meyer, Jake Charland, Darshan Hegde, Ankit Laddha, and Carlos Vallespi-Gonzalez. Sensor fusion for joint 3d object detection and semantic segmentation. 2019 IEEE/CVF Conference on Computer Vision and Pattern Recognition Workshops (CVPRW), Jun 2019.
- [17] Arsalan Mousavian, Dragomir Anguelov, John Flynn, and Jana Kosecka. 3D Bounding Box Estimation Using Deep Learning and Geometry. arXiv:1612.00496 [cs], Apr. 2017.
- [18] Arsalan Mousavian, Dragomir Anguelov, John Flynn, and Jana Kosecka. 3d bounding box estimation using deep learning and geometry. In Proceedings of the IEEE Conference on Computer Vision and Pattern Recognition, pages 7074–7082, 2017.
- [19] Ramin Nabati and Hairong Qi. RRPN: Radar region proposal network for object detection in autonomous vehicles. 2019 IEEE International Conference on Image Processing (ICIP), Sep 2019.
- [20] Ramin Nabati and Hairong Qi. Radar-Camera Sensor Fusion for Joint Object Detection and Distance Estimation in Autonomous Vehicles. arXiv:2009.08428 [cs], Sept. 2020.
- [21] Alejandro Newell, Kaiyu Yang, and Jia Deng. Stacked Hourglass Networks for Human Pose Estimation. arXiv:1603.06937 [cs], July 2016.
- [22] Felix Nobis, Maximilian Geisslinger, Markus Weber, Johannes Betz, and Markus Lienkamp. A Deep Learning-based Radar and Camera Sensor Fusion Architecture for Object Detection. In 2019 Sensor Data Fusion: Trends, Solutions, Applications (SDF), pages 1–7, Oct. 2019.
- [23] Charles R. Qi, Wei Liu, Chenxia Wu, Hao Su, and Leonidas J. Guibas. Frustum PointNets for 3D Object Detection from RGB-D Data. arXiv:1711.08488 [cs], Apr. 2018.
- [24] Thomas Roddick, Alex Kendall, and Roberto Cipolla. Orthographic feature transform for monocular 3d object detection. arXiv preprint arXiv:1811.08188, 2018.
- [25] Shaoshuai Shi, Xiaogang Wang, and Hongsheng Li. PointRCNN: 3D Object Proposal Generation and Detection from Point Cloud. arXiv:1812.04244 [cs], May 2019.
- [26] Andrea Simonelli, Samuel Rota Rota Bulò, Lorenzo Porzi, Manuel López-Antequera, and Peter Kontschieder. Disentangling Monocular 3D Object Detection. arXiv:1905.12365 [cs], May 2019.
- [27] Jun Wang, Shiyi Lan, Mingfei Gao, and Larry S Davis. Infofocus: 3d object detection for autonomous driving with dynamic information modeling. arXiv preprint arXiv:2007.08556, 2020.
- [28] Danfei Xu, Dragomir Anguelov, and Ashesh Jain. PointFusion: Deep Sensor Fusion for 3D Bounding Box Estimation. arXiv:1711.10871 [cs], Aug. 2018.
- [29] Yan Yan, Yuxing Mao, and Bo Li. SECOND: Sparsely Embedded Convolutional Detection. Sensors, 18(10):3337, Oct. 2018.
- [30] Bin Yang, Runsheng Guo, Ming Liang, Sergio Casas, and Raquel Urtasun. RadarNet: Exploiting Radar for Robust Perception of Dynamic Objects. arXiv:2007.14366 [cs], July 2020.
- [31] Bin Yang, Wenjie Luo, and Raquel Urtasun. PIXOR: Real-time 3D Object Detection from Point Clouds. arXiv:1902.06326 [cs], Mar. 2019.
- [32] Fisher Yu, Dequan Wang, Evan Shelhamer, and Trevor Darrell. Deep Layer Aggregation. In 2018 IEEE/CVF Conference on Computer Vision and Pattern Recognition, pages 2403–2412, Salt Lake City, UT, June 2018. IEEE.
- [33] R. Zhang, S. A. Candra, K. Vetter, and A. Zakhor. Sensor fusion for semantic segmentation of urban scenes. In 2015 IEEE International Conference on Robotics and Automation (ICRA), pages 1850–1857, 2015.
- [34] Xingyi Zhou, Dequan Wang, and Philipp Krähenbühl. Objects as points. arXiv preprint arXiv:1904.07850, 2019.
- [35] Yin Zhou and Oncel Tuzel. VoxelNet: End-to-End Learning for Point Cloud Based 3D Object Detection. arXiv:1711.06396 [cs], Nov. 2017.