11email: jeremy.tregloan-reed@uda.cl 22institutetext: TMT International Observatory, 100 West Walnut Street, Pasadena, CA 91124, USA. 33institutetext: European Southern Observatory, Alonso de Córdova 3107, Vitacura, Región Metropolitana, Chile 44institutetext: Centro de Astronomía (CITEVA), Universidad de Antofagasta, Avenida U. de Antofagasta 02800, Antofagasta, Chile 55institutetext: Institute of Astronomy, University of Cambridge, Madingley Road, Cambridge, CB3 0HA, UK 66institutetext: Departamento de Física, Universidad de Antofagasta, Avenida Angamos 601, Antofagasta, Chile
Optical-to-NIR magnitude measurements of the Starlink LEO Darksat satellite and effectiveness of the darkening treatment
Abstract
Aims. We aim to measure the Sloan r’, Sloan i’, J, and Ks magnitudes of Starlink’s STARLINK-1130 (Darksat) and STARLINK-1113 low Earth orbit (LEO) communication satellites and determine the effectiveness of the Darksat darkening treatment from the optical to the near-infrared.
Methods. Four observations of Starlink’s LEO communication satellites, Darksat and STARLINK-1113, were conducted on two nights with two telescopes. The Chakana 0.6 m telescope at the Ckoirama observatory (Chile) observed both satellites on 5 Mar 2020 (UTC) and 7 Mar 2020 (UTC) using a Sloan r’ and Sloan i’ filter, respectively. The ESO VISTA 4.1 m telescope with the VIRCAM instrument observed both satellites on 5 Mar 2020 (UTC) and 7 Mar 2020 (UTC) in the NIR J-band and Ks-band, respectively.
Results. The calibration, image processing, and analysis of the Darksat images give r 5.6 mag, i 5.0 mag, J 4.2 mag, and Ks 4.0 mag when scaled to a range of 550 km (airmass ) and corrected for the solar incidence and observer phase angles. In comparison, the STARLINK-1113 images give r 4.9 mag, i 4.4 mag, J 3.8 mag, and Ks 3.6 mag when corrected for range, solar incidence, and observer phase angles. The data and results presented in this work show that the special darkening coating used by Starlink for Darksat has darkened the Sloan r’ magnitude by 50 %, Sloan i’ magnitude by 42 %, NIR J magnitude by 32 %, and NIR Ks magnitude by 28 %.
Conclusions. The results show that both satellites increase in reflective brightness with increasing wavelength and that the effectiveness of the darkening treatment is reduced at longer wavelengths. This shows that the mitigation strategies being developed by Starlink and other LEO satellite operators need to take into account other wavelengths, not just the optical. This work highlights the continued importance of obtaining multi-wavelength observations of many different LEO satellites in order to characterise their reflective properties and to aid the community in developing impact simulations and developing mitigation tools.
Key Words.:
Astronomical instrumentation, methods and techniques – Techniques: photometric – Light pollution – Methods: observational1 Introduction
In January 2020, Starlink launched its fourth fleet of 60 low Earth orbit (LEO) communication satellites. Due to major concerns from the amateur and professional astronomical communities (see IAU press release, 2019/06/03, IAU press release, 2020/02/12, NSF’s NOIRLab and AAS Technical Report, and NSF’s NOIRLab and AAS Technical Report: Appendices) along with Dark sky advocates (see International Dark sky Association Press Release ; Gallozzi et al. 2020) regarding the reflective brightness of the LEO communication satellites, Starlink gave one of the LEO satellites launched in January 2020 a special darkening treatment. This satellite (STARLINK-1130), nicknamed ‘Darksat’, was the first attempt to reduce the reflective brightness of the satellites (SpaceX press kit, January 2020). The darkening treatment consisted of the white satellite surfaces being covered with a black diffuse applique,111Black diffuse appliques consist of a free-standing sheet of black material attached to a substrate. while the phased array and parabolic antennas were painted with a specular black paint (see Tyson et al., 2020, SpaceX updates April 2020).
Ground-based observations of Darksat show g 6.1 mag (Tregloan-Reed et al., 2020; Tyson et al., 2020) when normalised to the local zenith and accounting for the view angle subtended from the point of view of the satellite between the Sun and observer. When compared to STARLINK-1113, the darkening treatment used by Starlink reduced the reflective brightness of Darksat by 0.8 mag (Tregloan-Reed et al., 2020), which is a reduction factor of two, while Tyson et al. (2020) determined an average reduction in the reflective brightness of Darksat by 1.0 mag when compared to a group of Starlink satellites. The difference between Tregloan-Reed et al. (2020) and Tyson et al. (2020) highlights the complexity in accurately modelling the satellites and BRDF. Tyson et al. (2020) does not report a phase angle correction, only a range correction to the local zenith. When examining the range corrections from Tregloan-Reed et al. (2020) before the phase angle correction is applied, the magnitude difference between Darksat and STARLINK-1113 is mag. When the statistical mean and standard deviation of the magnitude difference between Darksat and the non-darkened satellites from Tyson et al. (2020) is calculated, a result of is found, which is in agreement with Tregloan-Reed et al. (2020), prior to the phase angle corrections.
The observed reduction in reflective brightness does not allow for non-linear image artefact correction on ultra-wide-field telescopes such as the Charles Simonyi telescope’s camera detectors at the Vera C. Rubin Observatory. Tyson et al. (2020) shows that the Starlink LEO satellites need to be at least g 7.0 mag to help ameliorate the impacts of electronic ghosts in the ultra-wide imaging exposures.
Several studies have been conducted to access the impact of LEO communication satellites on professional observatories. Hainaut & Williams (2020) examined their impact on ESO telescopes in the optical and infrared and concluded that the greatest impact of LEO satellites will be on large telescopes using large fields of view (tens of arcmin to a few degrees) and relatively long exposure times (order of few seconds to minutes). The photometric model used by Hainaut & Williams (2020) accurately predicts the magnitude of STARLINK-1113 given by Tregloan-Reed et al. (2020) when using the same satellite range and elevation. A second study by McDowell (2020) indicates that LEO satellites with an orbital height of km will have the greatest impact on twilight astronomy and long exposures using wide fields of view. The study also shows that satellites with a higher orbital height ( km to km), while being fainter, are visible longer through the night, with the greatest impact in summer. The satellites that are at an orbital height of 1000 km, or above, will be illuminated by the Sun even at the local midnight.
To date, all published observations (both professional and amateur) of the Starlink LEO communication satellites have been in the visible wavelength range. This is expected due to the concern raised by the professional and amateur astronomical communities and dark sky advocates regarding the naked eye visibility of the LEO satellites. However, there are some professional ground-based survey telescopes that observe at redder optical wavelengths (e.g. the Next Generation Transit Survey: Wheatley et al. 2013; SDSS: Gunn et al. 2006) and in the near-infrared (NIR; e.g. VISTA: Emerson et al. 2006; Dalton et al. 2006). Properly gauging the impact that LEO satellites could have on these types of observations requires empirical magnitude measurements of the LEO satellites.
We present the first NIR observations (J-band: 1250 nm; Ks-band: 2150 nm) of Darksat (international designation: 2020-001U) and STARLINK-1113 (international designation: 2020-001N) LEO communication satellites along with observations in the Sloan r’ (620.4 nm) and Sloan i’ (769.8 nm) passbands. We then make comparisons of the reflective brightness between the two satellites for each passband and infer the wavelength-dependent effectiveness of the darkening treatment used on Darksat.
2 Observations
STARLINK-1113 and STARLINK-1130 (Darksat) were observed by the Chakana 0.6 m telescope on 5 Mar 2020 using a Sloan r’ filter and on 7 Mar 2020 using a Sloan i’ filter. Both Starlink LEO satellites were also observed using the ESO Visible and Infrared Survey Telescope for Astronomy (VISTA) telescope with the VISTA InfraRed CAMera (VIRCAM) on 5 Mar 2020 in the NIR J-band and on 7 Mar 2020 in the NIR Ks-band. In all cases, the observations were taken in twilight with the Sun between and below the horizon.
2.1 Chakana 0.6 m telescope
The Chakana 0.6 m telescope is based at the Ckoirama Observatory (Char et al., 2016), the first Chilean state-owned observatory in northern Chile, and is managed and operated by the Centro de Astronomía (CITEVA), Universidad de Antofagasta. The Chakana telescope (f/6.5) is equipped with an FLI ProLine 16801 camera, operated with one of three Sloan filters (g’, r’, and i’). In this setup, the CCD covers a field of view of arcmin with a pixel scale of 0.47 arcsec pixel-1. With the exception of the Sloan r’ Darksat observation, which used no binning, the observations presented in this work from Ckoirama used binning to reduce the CCD readout dead-time.
By retrieving the Starlink two-line element (TLE) supplemental data from the Celestrak222https://celestrak.com/NORAD/elements/supplemental/starlink.txt. website, our telemetry code333The telemetry code used in this work is written in Python and makes use of the pyorbital package from the PyTroll project. The telemetry code is available to the community by request from the author. calculates the ephemerides (at a temporal resolution of 1 s) of the satellites and the Sun using the longitude and latitude of the chosen observatory (Ckoirama geodetic GPS WGS 84 coordinates: 24.0891 S, 69.9306 W, Altitude 966 m). Table 1 gives an observing log of the Chakana telescope observations presented in this work. The Chakana 0.6 m telescope FITS files are available from the author by request.
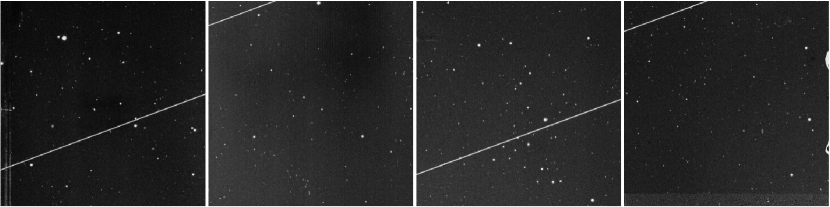
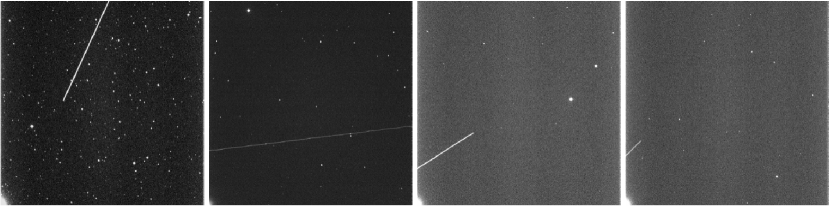
Figure 1 shows the raw Flexible Image Transport System (FITS) images of the satellite trails of Darksat and STARLINK-1113, observed using the Chakana 0.6 m telescope. Due to physical pointing restrictions at the Chakana telescope, it was only possible to capture a small section of the satellite trails on 7 Mar 2020.
| STARLINK-1130 | STARLINK-1113 | |||||||
| (Darksat) | ||||||||
| Date (J2000) | 5 Mar 2020 | 7 Mar 2020 | 5 Mar 2020 | 7 Mar 2020 | 5 Mar 2020 | 7 Mar 2020 | 5 Mar 2020 | 7 Mar 2020 |
| Time (UTC) | 00:34:27 | 00:27:01 | 00:29:55 | 00:23:58 | 00:20:37 | 00:11:55 | 00:14:54 | 00:09:07 |
| Telescope | Chakana | Chakana | VISTA | VISTA | Chakana | Chakana | VISTA | VISTA |
| Filter | Sloan r’ | Sloan i’ | J-band | Ks-band | Sloan r’ | Sloan i’ | J-band | Ks-band |
| Exposure time (s) | 10.0 | 1.0 | 30.0 | 10.0 | 2.0 | 1.0 | 30.0 | 10.0 |
| Altitude (km) | 564.01 | 562.08 | 563.73 | 560.28 | 563.32 | 562.77 | 564.32 | 560.75 |
| Range (km) | 866.39 | 991.73 | 1063.91 | 1146.11 | 718.89 | 880.06 | 1004.76 | 885.43 |
| Azimuth (∘) | 210.46 | 265.703 | 235.56 | 303.54 | 158.76 | 245.01 | 216.18 | 305.37 |
| Elevation (∘) | 37.72 | 30.93 | 30.51 | 24.86 | 49.63 | 36.78 | 30.51 | 36.28 |
| Airmass | 1.63 | 1.95 | 1.98 | 2.39 | 1.30 | 1.67 | 1.97 | 1.70 |
| RA (Sat) | 03 06 51.26 | 02 15 0.25 | 02 04 23.17 | 03 17 59.93 | 08 23 44.29 | 02 29 25.40 | 01 44 05.66 | 03 43 29.02 |
| DEC (Sat) | -60 47 16.89 | -40 18 18.00 | -40 57 33.32 | +16 14 44.37 | -59 30 02.72 | -33 40 21.07 | -57 37 41.22 | +10 11 39.22 |
| Angular velocity (arcsec s-1) | ||||||||
| RA (Sun) | 23 04 24.31 | 23 11 48.29 | 23 08 06.40 | 23 15 29.81 | 23 04 22.16 | 23 11 45.96 | 23 08 04.08 | 23 15 27.52 |
| DEC (Sun) | -05 56 41.05 | -05 10 14.32 | -05 33 30.56 | -04 46 53.85 | -05 56 54.49 | -05 10 29.02 | -05 33 45.13 | -04 47 08.36 |
| Sun–zenith angle (∘) | 110.7 | 109.5 | 109.4 | 108.6 | 107.6 | 106.2 | 106.1 | 105.3 |
| Sun–satellite angle (∘) | 72.3 | 51.6 | 53.2 | 64.8 | 117.3 | 56.8 | 61.3 | 70.5 |
2.2 ESO VISTA telescope
The 4.1 m VISTA telescope (f/3.25) is situated at the ESO Paranal observatory, Chile. It is equipped with an NIR camera, VIRCAM with a 1.65∘ diameter field of view, with a pixel scale of 0.34 arcsec pixel-1. The camera is operated with five broad-band filters (Z, Y, J, H, Ks) and three narrow-band filters (NB 980, NB 990, and 1.18 micron; see also Emerson et al. 2006; Dalton et al. 2006).
The camera is comprised of 16 detectors arranged in a matrix, with each detector having a arcmin field of view. The gaps between the detectors are 10.4 arcmin (horizontal) and 4.9 arcmin (vertical) giving a nominal field of view of on the sky. However, a single pointing (called an exposure) provides only partial coverage of the field of view. A five-point jitter was performed to remove the bright NIR sky-background this creates a stack image from the five exposures. This process was repeated six times with a different offset to obtain continuous coverage of the entire field of view, which is then combined to create a tile image. Because LEO satellite trails pass though the full field of view within a single pointing, and therefore only appear in a single exposure, a single five-point jitter was scheduled for the observations to allow the removal of the bright NIR sky background from the exposures.
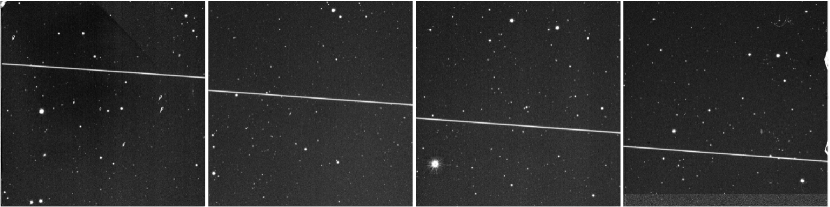
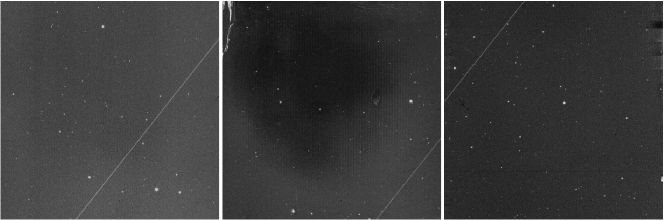
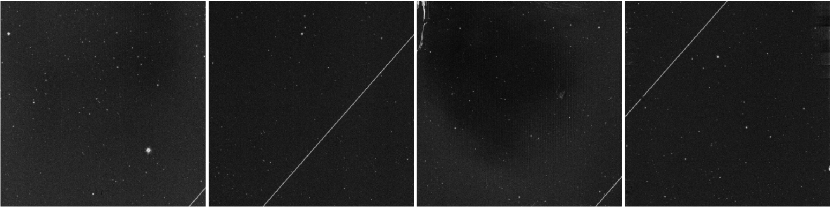
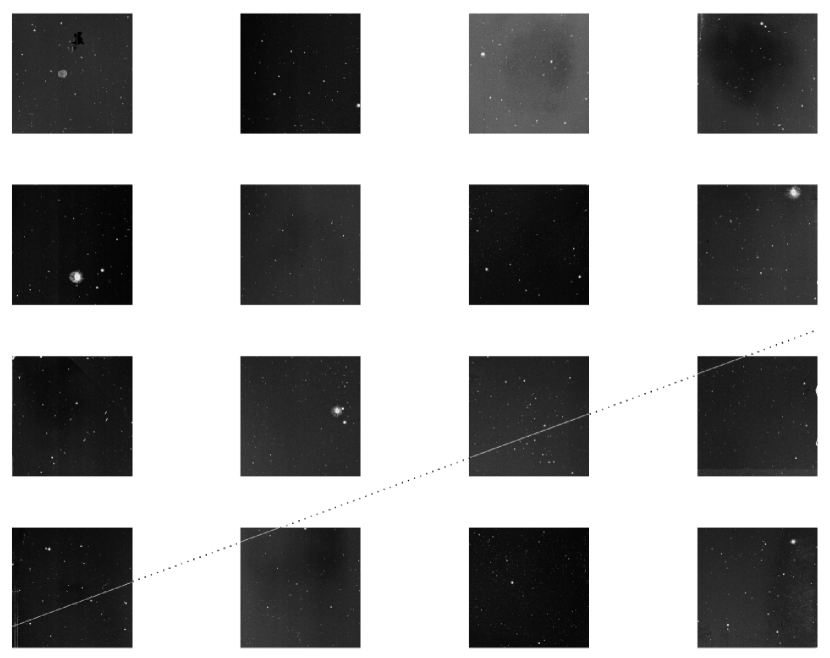
Figure. 2 shows the FITS images from all 16 detectors of VIRCAM during the Darksat observation from 5 Mar 2020. The detector gaps are scaled and the Darksat satellite trail between the detectors is marked. The satellite trails for both Darksat (Fig. 7) and STARLINK-1113 (Fig. 8) observed on 5 Mar 2020 lie on four detectors. For the observations conducted on 7 Mar 2020, the satellite trails lie on three detectors for Darksat (Fig. 9) and four detectors for STARLINK-1113 (Fig. 10). An observing log of the VISTA telescope observations is given in Table 1. The VISTA data were obtained in twilight through technical run 60.A-9801(P), and they are publicly available at the ESO archives.444http://archive.eso.org/cms.html
2.3 Data reduction
The FITS files from the Chakana 0.6 m telescope were calibrated and reduced using the same methodology described by Tregloan-Reed et al. (2020). The instrumental signature was removed from the images by subtracting the bias and dividing by the flat-field calibration frames. Standard aperture photometry was then conducted for each comparison star in the calibrated image.
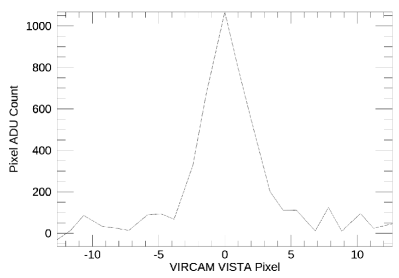
It has been shown that there is a strong cut-off edge between the satellite trail and the sky-background for LEOsat trails observed on the 0.6 m Chakana telescope (Tregloan-Reed et al., 2020). This is also true for for the images obtained using VIRCAM. Examination of the LEOsat trail transverse profiles in the VIRCAM J and Ks images show peaked point spread functions (PSFs), with a trail full width at half maximum (FWHM) = 4.5 pixels or 1.53 arcsec (Fig. 3). For comparison, Tyson et al. (2020) simulated a LEOsat at an orbital height of 550 km observed at a 50∘ elevation for the Rubin Observatory (8.4 m telescope with f/1.234) and found the trail would be out of focus with a FWHM = 2.57 arcsec. This allows for two parallel lines to be fitted along the satellite trail edge and the total integrated flux of the satellite trail to be calculated, after subtraction of the sky background. Combined with the calibration from the comparison stars, the integrated flux of the satellite trail is converted into magnitudes.
The VIRCAM images are processed at the Cambridge Astronomy Survey Unit (CASU). A simple summary of the data reduction process is provided here; for more detailed information, we invite the reader to consult González-Fernández et al. (2018). These images first undergo flat-field and gain correction, using a master flat-field frame obtained via a combination of several nightly sky flats. This master flat also allows for an initial gain correction to be applied by homogenising the measured sky level in all the detectors. By default, VISTA produces jittered images (sequences of pointings offset by a small, random amount), and these are combined with a recursive rejection algorithm to produce a sky frame. This sky emission is subtracted from all the individual images, along with the removal of readout artefacts (e.g. low-level pickup noise). An initial catalogue of detections is produced after this step, and cross-matching with 2MASS (Skrutskie et al., 2006) provides astrometric calibrators. A per-detector calibration is performed, with typical errors of 0.1 arcsec.
These individual frames are normally sent downstream in the processing workflow to produce the standard data products, which are stacked (i.e. jitter corrected) and tiled (mosaics) images. However, these steps are designed in part to remove the signature of artificial satellites, and so for this study, individual calibrated exposures are used.
3 Data analysis
For the Sloan r’ and Sloan i’ observations, the comparison stars were selected based on their respective signal-to-noise (S/N) above the sky-background and passband magnitude measurements present in the literature. For instance, while the Sloan r’ Darksat observation on 5 Mar 2020 contains HD 19801 in the field of view, the literature does not show a Sloan r’ magnitude, and so HD 19801 was not used as a comparison star. While it is possible to use a colour equation to convert the B and V magnitudes of HD 19801 to a Sloan r’ magnitude, with other comparison stars that have B, V, and r’ magnitudes (e.g. TYC 8860-962-1), we find that the colour equation (Table 1 Jester et al., 2005) does not agree with the measured Sloan r’ measurements. Hence, to avoid unknown systematics, we avoided stars that did not have a Sloan r’ or Sloan i’ magnitude in the literature. Due to the short exposures and small aperture of the Chakana 0.6 m telescope, we found only two to three comparison stars per image for the Sloan r’ and Sloan i’ observations. The comparison star magnitudes were selected from the following reference catalogues: the AAVSO Photometric All-Sky Survey DR 9 (Henden et al., 2016) and RAVE DR 4 (Kordopatis et al., 2013). However, due to the longer exposure times and larger aperture of the VISTA telescope for the NIR observations, we used six to 12 comparison stars in each detector for the J-band observations, while four to eight comparison stars were used for the Ks-band detector images. The comparison star magnitudes were selected from the 2MASS (Skrutskie et al., 2006) reference catalogue.
Tregloan-Reed et al. (2020) discusses the fact that an estimated magnitude of an LEO satellite can be calculated when the satellite trail is not fully contained in an image. It is possible to extrapolate a predicted satellite trail length for a given exposure time from the angular velocity of the satellite (calculated from the satellite telemetry and given in Table 1). Then, by comparing the measured and predicted ephemerides trail lengths, an ephemerides-estimated magnitude is found.
For the VISTA observations, the satellite trails appear in multiple detectors. To simplify the analysis, each detector image was independently analysed. The integrated flux from each satellite trail was converted to magnitudes using only the comparison stars within the same detector image.
Table 2 gives the weighted mean of the observed and estimated magnitudes from the different comparison stars along with the measured (length on detector) and predicted (multiplying the angular velocity of the satellite with the exposure time) ephemerides trail lengths for each detector, along with the time that the satellite spent on each detector. For the VISTA observations, each detector has a different observed satellite trail length. Therefore, we obtained an observed and estimated magnitude from each detector and then calculated the weighted mean for the estimated magnitude from the different detector results.
| Passband | Detector | Obs. trail length | Time on detector | Obs. | Est. trail length | Est. |
|---|---|---|---|---|---|---|
| (arcsec) | (s) | mag. | (arcsec) | mag. | ||
| STARLINK-1130 | ||||||
| Sloan r’ | 1 | |||||
| Sloan i’ | 1 | |||||
| J-band | 4 | |||||
| J-band | 8 | |||||
| J-band | 11 | |||||
| J-band | 15 | |||||
| Ks-band | 11 | |||||
| Ks-band | 13 | |||||
| Ks-band | 14 | |||||
| STARLINK-1113 | ||||||
| Sloan r’ | 1 | |||||
| Sloan i’ | 1 | |||||
| J-band | 3 | |||||
| J-band | 7 | |||||
| J-band | 11 | |||||
| J-band | 15 | |||||
| Ks-band | 8 | |||||
| Ks-band | 11 | |||||
| Ks-band | 13 | |||||
| Ks-band | 14 | |||||
When a Starlink LEOsat reaches its nominal orbit (on station), the solar arrays of the Starlink design are arranged above the main Starlink chassis. Reflected light from solar arrays is specular and is generally reflected towards space and not the Earth. When it is reflected towards the Earth, the glint lasts for a few seconds (e.g. satellite flares). However, since April 2020, Starlink – in an effort to reduce the reflective brightness of the satellites – has been automatically adjusting the solar array angles so that they are hidden behind the chassis, in order to prevent the solar arrays adding to the reflective specular brightness (see SpaceX updates April 2020).
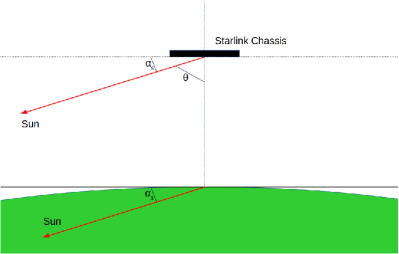
The observed reflective brightness of an LEO satellite is dependent on the satellite range to the observer (), the solar incidence angle (), and the observer angle () of the satellite. The solar phase angle () is the angle between the observer and the Sun as seen from the satellite. Therefore, to allow a direct comparison of the reflective brightness between Darksat and STARLINK-1113, the results presented in Table 2 need to be corrected for and and normalised to a standard range. When observed at the local zenith (airmass = 1), is equal to the orbital height (). We therefore normalise the magnitude of the satellites to the nominal , 550 km by scaling the magnitudes by .
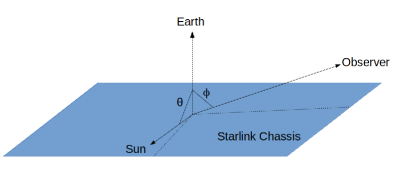
The observer phase angle is the angle between the observer and the unit normal of the Earth facing surface of the satellite (see Fig. 4). Tregloan-Reed et al. (2020) gave an equation to approximate using the straight line distance between the observer and the satellite footprint, nadir (), elevation (), and :
| (1) |
The solar incidence angle (see Fig. 4) can be calculated by evaluating the solar elevation angle () at the satellite nadir. As shown in Fig. 5, the body of the satellite is parallel to the tangent to the Earth’s surface at the nadir. With the Sun at infinity, the two vectors from the Sun to the satellite chassis and from the Sun to the satellite nadir can be approximated as parallel. Therefore, when is evaluated at the satellite nadir. The values of , , and for all observations of Darksat and STARLINK-1113 are given in Table 3, and for they were determined using pyorbital for the position (longitude and latitude) of the satellite at the time of the observations to find at the nadir.
| Starlink | Obs. | Solar phase | Solar incidence | Observer | Passband | Est. | Trail mag. |
|---|---|---|---|---|---|---|---|
| satellite | range (km) | angle (∘) | angle (∘) | angle (∘) | scaled mag. | arcsec-2 s-1 | |
| 1130 (Darksat) | 866.39 | 107.7 | 73.3 | 45.1 | r’ | ||
| 1130 (Darksat) | 991.73 | 128.4 | 77.4 | 51.9 | i’ | ||
| 1130 (Darksat) | 1063.91 | 126.8 | 75.5 | 54.8 | J | ||
| 1130 (Darksat) | 1146.11 | 115.2 | 78.2 | 57.7 | Ks | ||
| 1113 | 718.89 | 62.7 | 72.0 | 35.9 | r’ | ||
| 1113 | 880.06 | 123.2 | 79.3 | 48.9 | i’ | ||
| 1113 | 1004.76 | 118.7 | 76.7 | 51.8 | J | ||
| 1113 | 885.43 | 109.5 | 81.4 | 49.8 | Ks |
Most of the observed reflective light from a complex body like a Starlink satellite is diffused. This effect can be approximated by using a bidirectional reflectance distribution function (BRDF). As the observations presented in this work are from a single point along the satellite trajectory path, we estimated the BRDF using a parametrised BRDF model from Minnaert (1941) to give a first-order approximation:
| (2) |
where is the ratio of the solar phase attenuation between Darksat and STARLINK-1113; and is the Minnaert exponent and ranges from 0 to 1, with representing a perfect Lambertian surface. To approximate a dark surface, we set (Stamnes et al., 1999).
In Table 3, we report the estimated magnitudes of Darksat and STARLINK-1113 from each passband, after correcting for and and then normalising to a range of 550 km. The final results show that Darksat is dimmer than STARLINK-1113 by mag in the Sloan r’ passband, mag in the Sloan i’ passband, mag in the NIR J passband, and mag in the NIR K passband.
To aid observers and observatories in determining the impact of LEOsat trails on the various detectors in the community, in Table 3 we report the calculated trail brightness in units of mag arcsec-2 s-1. The angular velocity of a satellite effects the amount of time that the satellite illuminates a pixel or arcsec2 of a detector. Hence, after calculating the trail brightness in mag arcsec-2, we used the angular velocity of each observation to determine the brightness as a function of time. This allows models of satellite trails to accurately estimate satellite trail brightness on different detector pixels.
4 Summary and discussion
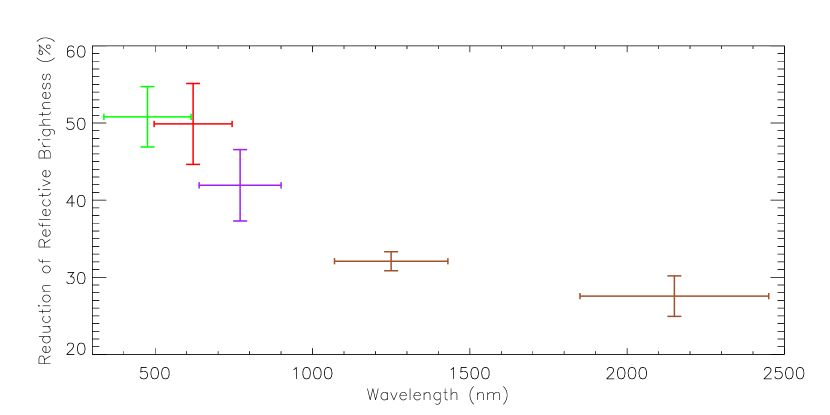
The Darksat and STARLINK-1113 results show that after correcting for the solar incidence and observer phase angles whilst normalising the range to the orbital height, 550 km (one airmass), Darksat is dimmer than STARLINK-1113 in both the optical and NIR. However, the results also show that both satellites increase in reflective brightness with increasing wavelength (towards redder bands), and the effectiveness of the darkening treatment used for Darksat reduces with increasing wavelength. Tregloan-Reed et al. (2020) gave an estimated scaled magnitude of STARLINK-1113 and Darksat in the optical (Sloan g’) and , respectively. Combining the results from this work with the results from Tregloan-Reed et al. (2020) shows that between 475.4 nm (Sloan g’) and 2150 nm (Ks), Darksat increases in reflective brightness by 2.13 mag ( times brighter). While STARLINK-1113 increases in reflective brightness by 1.71 mag ( times brighter).
The reduction in reflective brightness between Darksat and STARLINK-1113 is (475.4 nm), (620.4 nm), (769.8 nm), (1250 nm), and (2150 nm). Figure 6 shows that the effectiveness of the darkening treatment used for Darksat is reduced from the optical to the NIR.
As discussed in Tregloan-Reed et al. (2020), without BRDF measurements of Darksat and other non-darkened Starlink satellites, it is only possible to determine an estimated magnitude by using a parametrised BRDF model from Minnaert (1941). This approach takes the ratio of the solar phase attenuation between two satellites (Eq. 2) and removes the unknown BRDF component, which allows a comparison between the two satellites, irrespective of their attitudes at the time of the observations. However, by setting the Minnaert exponent to that of a dark surface, we obtain equivalent results to the first order approximation given by Hainaut & Williams (2020) for the solar phase attenuation for a diffusing sphere, thus validating the two different approaches.
Performing future observations of Darksat and other Starlink satellites at multiple points along a single trajectory path will allow for an accurate BRDF measurement. The observations can then be compared to different empirical reflectance BRDF models (e.g. Phong BRDF: Phong 1975; Lewis BRDF: Lewis 1994) to improve the accuracy of the estimated magnitude measurements.
The Darksat satellite was Starlink’s first mitigation experiment to reduce the reflective brightness of its LEO communication satellites. Simulations on the impact of mega-constellation LEO communication satellites show that the greatest impact to professional astronomy will be to ultra-wide imaging exposures from large telescopes (Hainaut & Williams, 2020; McDowell, 2020), such as the National Science Foundation’s Vera C. Rubin Observatory, formerly known as LSST. Studies on the mitigation of optical effects of bright LEO satellites on the Vera C. Rubin Observatory indicate that an optical magnitude of at least g mag is needed to allow for non-linear image artefact correction to the same level as background noise (Tyson et al., 2020). The results from this work and Tregloan-Reed et al. (2020) show that the reflective brightness of the standard Starlink satellite increases from 5 mag in the optical to 3 mag in the NIR, and Darksat increases from 6 mag in the optical to 4 mag in the NIR. This shows that the mitigation strategies being developed by Starlink and other LEO satellite operators need to take into account other wavelengths, not just the optical.
Since the launch of Darksat and subsequent observations (Tregloan-Reed et al., 2020; Tyson et al., 2020), Starlink launched its second mitigation experiment, STARLINK-1436, nicknamed ‘VisorSat’, with its eighth launch in June 2020. VisorSat is equipped with deployable sunshades (transparent in radio frequencies), which act to block sunlight from the phased array and parabolic antennas. Apart from reducing the reflective brightness of the satellite, it is hoped that the sunshades will also prevent heating issues caused by the specular black paint used for Darksat (see Tyson et al., 2020, SpaceX updates April 2020). Future optical and NIR observations are planned for VisorSat and other Starlink non-darkened satellites using the Chakana telescope along with other mid-sized telescopes in Chile and Spain, to provide measurements of both the magnitude and the effectiveness of the VisorSat sunshades in the optical to the NIR.
Acknowledgements.
We would like to thank the anonymous referee for their helpful comments, which improved the quality of this manuscript. This work was supported by a CONICYT / FONDECYT Postdoctoral research grant, project number: 3180071. JTR thanks the Centro de Astronomía (CITEVA), Universidad de Antofagasta for hosting the CONICYT / FONDECYT 2018 Postdoctoral research grant. Based on observations collected at the European Organisation for Astronomical Research in the Southern Hemisphere under ESO programme 60.A-9801(P). EU kindly acknowledges the work of Marco Rocchetto and Stephen Fossey to set up Ckoirama. The postgraduate students VM, JA, and RG of the Master of Astronomy programme of the Universidad de Antofagasta who are associated as co-authors of this manuscript acknowledges the Postgraduate School (Escuela de Postgrado) of the Universidad de Antofagasta for its support and allocated grants. JA and RG thank MINEDUC-UA project, code ANT 1795 for support. The postgraduate student EO of the Ph.D. programme in mathematical physics of the Universidad de Antofagasta who is associated as a co-author of this manuscript acknowledges the Postgraduate School (Escuela de Postgrado) of the Universidad de Antofagasta for its support and allocated grants. EO thanks the National Agency for Research and Development (ANID)/Scholarship Program / DOCTORADO BECAS NACIONAL CHILE/2018 - 21190387 for financial support. The following internet-based resources were used in the research for this paper: the NASA Astrophysics Data System; the ESO Online Digitized Sky Survey, the SIMBAD database and VizieR catalogue access tool operated at CDS, Strasbourg, France; and the ariv scientific paper preprint service operated by Cornell University.References
- Char et al. (2016) Char, F., Unda-Sanzana, E., Colque, J., Fossey, S., & Rocchetto, M. 2016, Boletin de la Asociacion Argentina de Astronomia La Plata Argentina, 58, 200
- Dalton et al. (2006) Dalton, G. B., Caldwell, M., Ward, A. K., et al. 2006, in Society of Photo-Optical Instrumentation Engineers (SPIE) Conference Series, Vol. 6269, Proc. SPIE, 62690X
- Emerson et al. (2006) Emerson, J., McPherson, A., & Sutherland, W. 2006, The Messenger, 126, 41
- Gallozzi et al. (2020) Gallozzi, S., Paris, D., Maris, M., Scardia, M., & Dubois, D. 2020, arXiv e-prints, arXiv:2003.05472
- González-Fernández et al. (2018) González-Fernández, C., Hodgkin, S. T., Irwin, M. J., et al. 2018, MNRAS, 474, 5459
- Gunn et al. (2006) Gunn, J. E., Siegmund, W. A., Mannery, E. J., et al. 2006, AJ, 131, 2332
- Hainaut & Williams (2020) Hainaut, O. R. & Williams, A. P. 2020, A&A, 636, A121
- Henden et al. (2016) Henden, A. A., Templeton, M., Terrell, D., et al. 2016, VizieR Online Data Catalog, II/336
- Jester et al. (2005) Jester, S., Schneider, D. P., Richards, G. T., et al. 2005, AJ, 130, 873
- Kordopatis et al. (2013) Kordopatis, G., Gilmore, G., Steinmetz, M., et al. 2013, AJ, 146, 134
- Lewis (1994) Lewis, R. R. 1994, Computer Graphics Forum, 13, 109
- McDowell (2020) McDowell, J. C. 2020, ApJ, 892, L36
- Minnaert (1941) Minnaert, M. 1941, ApJ, 93, 403
- Phong (1975) Phong, B. T. 1975, Commun. ACM, 18, 311–317
- Skrutskie et al. (2006) Skrutskie, M. F., Cutri, R. M., Stiening, R., et al. 2006, AJ, 131, 1163
- Stamnes et al. (1999) Stamnes, K., Thomas, G. E., & Stamnes, J. J. 1999, Radiative Transfer in the Atmosphere and Ocean, 2nd edn. (Cambridge University Press)
- Tregloan-Reed et al. (2020) Tregloan-Reed, J., Otarola, A., Ortiz, E., et al. 2020, A&A, 637, L1
- Tyson et al. (2020) Tyson, J. A., Ivezić, Ž., Bradshaw, A., et al. 2020, AJ, 160, 226
- Wheatley et al. (2013) Wheatley, P. J., Pollacco, D. L., Queloz, D., et al. 2013, in European Physical Journal Web of Conferences, Vol. 47, EPJWC, 13002
Appendix A VIRCAM VISTA FITS images