DeepOpht: Medical Report Generation for Retinal Images via Deep Models and Visual Explanation
Abstract
In this work, we propose an AI-based method that intends to improve the conventional retinal disease treatment procedure and help ophthalmologists increase diagnosis efficiency and accuracy. The proposed method is composed of a deep neural networks-based (DNN-based) module, including a retinal disease identifier and clinical description generator, and a DNN visual explanation module. To train and validate the effectiveness of our DNN-based module, we propose a large-scale retinal disease image dataset. Also, as ground truth, we provide a retinal image dataset manually labeled by ophthalmologists to qualitatively show, the proposed AI-based method is effective. With our experimental results, we show that the proposed method is quantitatively and qualitatively effective. Our method is capable of creating meaningful retinal image descriptions and visual explanations that are clinically relevant. DeepOpht Github.
1 Introduction
The World Health Organization (WHO) estimates that typical retinal diseases such as Age-related Macular Degeneration (AMD) and Diabetic Retinopathy (DR) are expected to affect over 500 million people worldwide shortly [49]. Besides, generally speaking, the traditional process of retinal disease diagnosis and creating a medical report for a patient takes time in practice. The above means that ophthalmologists will become busier and busier.
As we may know, the current state of the art in Artificial Intelligence (AI) involves deep learning research, and we claim deep learning is one of the promising ways to help ophthalmologists and improve the traditional retinal disease treatment procedure. Deep learning based models such as convolutional neural networks (CNN) or recurrent neural networks (RNN) for computer vision or natural language processing tasks, respectively, have achieved, and, in some cases, even exceeded human-level performance. There is no better time than now to propose an AI-based medical diagnosis method to aid ophthalmologists.
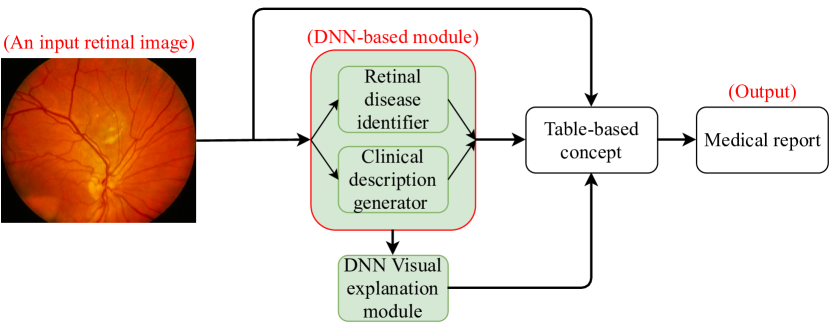
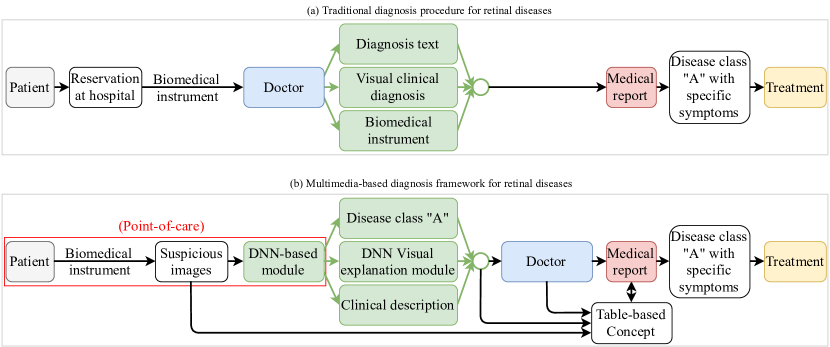
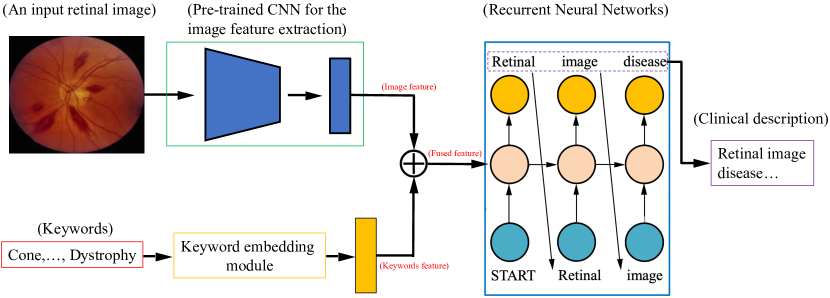
In this paper, we propose an AI-based method for automatic medical report generation based on an input retinal image, as illustrated in Figure 1. The proposed method intends to improve the traditional retinal disease diagnosis procedure, referring to Figure 2, and help ophthalmologists increase diagnosis efficiency and accuracy. The main idea of this method is to exploit the deep learning based models, including an effective retinal disease identifier (RDI) and an effective clinical description generator (CDG), to automate part of the traditional treatment procedure. Then, the proposed method will make the diagnosis more efficient.
To train our deep learning models and validate the effectiveness of our RDI and CDG, we introduce a new large-scale retinal disease image dataset, called DeepEyeNet (DEN). Besides, as ground truth, we provide a retinal image dataset manually labeled by ophthalmologists to qualitatively show that the proposed AI-based model is effective. The dataset helps us show the activation maps of our deep models are aligned with image features that are clinically recognized by ophthalmologists as linked with the identified disease. Our experimental results show that the proposed AI-based method is effective and successfully improves the traditional retinal disease treatment procedure. Our main contributions are summarized as follows:
Contributions.
-
•
To improve the traditional retinal disease treatment procedure and help ophthalmologists increase diagnosis efficiency and accuracy, we propose an AI-based method to generate medical reports for retinal images. In this method, we exploit the deep learning based models including an RDI and a CDG to automate part of the conventional treatment procedure.
-
•
We propose a large-scale retinal disease image dataset, called DeepEyeNet (DEN) dataset, with 15,709 images to train our deep models and validate the effectiveness of the proposed RDI and CDG quantitatively.
-
•
We provide another dataset with 300 retinal images labeled by ophthalmologists to qualitatively show our method is effective by visually confirming the activation maps of our models are aligned with image features clinically recognized by ophthalmologists.
2 Related Work
In this section, we divide the related works into retinal disease classification, image captioning, neural networks visual explanation, and retinal dataset comparison.
2.1 Retinal Disease Classification
Optical Coherence Tomography (OCT), Fluorescein Angiography (FA), and Color Fundus Photography (CFP) are the three most commonly used and important imaging methods for the diagnosis of retinal diseases [61]. Optical Coherence Tomography (OCT) is a technology of emerging biomedical imaging, and it provides high-resolution and non-invasive real-time imaging of highly scattering tissues. That is, OCT images [11, 33, 17] usually are used to show the structure of the retina. [5] have proposed an algorithm to segment and detect six different retinal layers, including Nerve Fiber Layer (NFL), Ganglion Cell Layer (GCL) + Inner Plexiform Layer (IPL), Inner Nuclear Layer (INL), Outer Plexiform Layer (OPL), Outer Nuclear Layer (ONL) + Photoreceptor Inner Segments (PIS), and Photoreceptor Outer Segments (POS), in OCT retinal images. Fluorescein Angiography (FA) has been used to realize the pathophysiologic course of Retinopathy of Prematurity (ROP) following intravitreal anti-Vascular Endothelial Growth Factor (Anti-VEGF) [35]. Color Fundus photography (CFP) is a simple and cost-effective technology for trained medical professionals. Image preprocessing is one of the important issues in the automated analysis of CFP. The authors of [67] have proposed a method to reduce the vignetting effect caused by non-uniform illumination of a retinal image. In this work, we mainly exploit the DNN-based methods [18, 53, 65] to further investigate the retinal disease classification [62] toward a multi-label task combining language information.
2.2 Image Captioning
Recently, computer vision researchers have proposed a new task, image captioning, and [30, 59, 14] are early works. In [30], the proposed model can embed visual and language information into a common multimodal space. The authors of [14] exploit a natural language model to combine a set of possible words, which are related to several small parts of the image, and then generate the caption of the given image. The authors of [59] use CNN to extract the image feature and use it as the input at the first time step of the RNN to generate the caption of the input image. The authors of [16] propose a new deliberate residual attention network for image captioning. The layer of first-pass residual-based attention prepares the visual attention and hidden states for generating a preliminary version of the captions, while the layer of second-pass deliberate residual-based attention refines them. Since the second-pass is based on the global features captured by the hidden layer and visual attention in the first-pass, their method has the potentials to generate better captions. In [40], the authors mention that existing image captioning models are usually trained via maximum likelihood estimation. However, the log-likelihood score of some captions cannot correlate well with human assessments of quality. Standard syntactic text evaluation metrics, such as METEOR [6], BLEU [48], and ROUGE [38], are also not well correlated. The authors of [40] show how to use a policy gradient method to optimize a linear combination of CIDEr [58] and SPICE [3]. In [19], the authors propose a method that focuses on discriminating properties of the visible object, jointly predicts a class label, and explains why the predicted label is proper for a given image. Through a loss function based on reinforcement learning and sampling, their model learns to generate captions. According to [59, 30, 16], existing image captioning models are only able to generate the rough description for a given image. So, in this work, we exploit keywords to make our CDG have better reasoning ability.
| Name of Dataset | Field of View | Resolution | Data Type | Number of Images |
| VICAVR [57] | Image | 58 | ||
| VARIA [46] | Image | 233 | ||
| STARE [21] | Image + Text | 397 | ||
| CHASE-DB1 [15] | Image | 14 | ||
| RODREP [1] | Image | 1,120 | ||
| HRF [45] | 3504*2336 | Image | 45 | |
| e-ophtha [12] | Image | 463 | ||
| ROC [43] | Image | 100 | ||
| REVIEW [2] | Image | 14 | ||
| ONHSD [10] | Image | 99 | ||
| INSPIRE-AVR [44] | Image | 40 | ||
| DIARETDB1 [32] | Image + Text | 89 | ||
| DIARETDB0 [31] | Image | 130 | ||
| MESSIDOR [13] | Image + Text | 1,200 | ||
| Drishti-GS [54] | Image | 101 | ||
| FIRE [20] | Image | 129 | ||
| DRIONS-DB [7] | Image | 110 | ||
| IDRiD [50] | Image | 516 | ||
| DRIVE [55] | Image | 40 | ||
| DeepEyeNet (DEN) | various | Image + Text* | 15,709 |
2.3 Neural Networks Visual Explanation
There are some popular CNN visualization tools, [70, 52, 64]. The authors of [70] have proposed a technique, called Class Activation Mapping (CAM), for CNN. It makes classification-trained CNN learn how to perform the task of object localization, without using a bounding box. In our previous works [42, 63], we exploit class activation maps to visualize the predicted class scores on retinal images, highlighting the discriminative object parts which are detected by the CNN. In [52], the authors have proposed the other similar features visualization tool, called Gradient-weighted Class Activation Mapping (Grad-CAM), for making a CNN-based model transparent by producing visual explanations of features. The authors of [69] introduce a CNN visualization technique that gives insight into the operation of the classifier and the function of intermediate feature layers. These visualizations allow us to find architectures of CNN models. The authors of [8] propose a generalized method, Grad-CAM++, based on Grad-CAM. The Grad-CAM++ method provides better visual explanations of CNN model predictions than Grad-CAM, in terms of better object localization [66] and occurrences explanation of multiple object instances in a single image. In [37], the authors propose another method different from the above methods which are trying to explain the network. They build up an end-to-end model to provide supervision directly on the visual explanations. Furthermore, the authors validate that the supervision can guide the network to focus on some expected regions. The aforementioned is more related to image data only visualization. The authors of [68, 51, 28] have proposed some methods for the multimedia data, such as text and images, visualization. In [68], the authors introduce five popular multimedia visualization concepts, including basic grid, similarity space, similarity-based, spreadsheet, and thread-based concepts. In this work, we exploit CAM to visually show that the activation maps of our deep models are aligned with image features that are clinically recognized by ophthalmologists as linked with the identified disease. In addition, we use a table-based concept, similar to the static spreadsheet concept, to visualize our medical report.
2.4 Retinal Dataset Comparison
Retinal disease research already has long history and many retinal datasets have been proposed, such as [55, 50, 7, 20, 54, 13, 31, 32, 44, 10, 2, 43, 12, 45, 1, 15, 21, 46, 57]. The DRIVE dataset [55] contains 40 retina images which are obtained from a diabetic retinopathy screening program in the Netherlands. These 40 images have been divided into a half training set and a half test set. For the training images, a single manual segmentation of the vasculature is available. For the test cases, two manual segmentations are available. The IDRiD dataset [50] is a dataset for retinal fundus image consisting of 516 images. The authors of IDRiD dataset provide ground truths associated with the signs of Diabetic Macular Edema (DME) and Diabetic Retinopathy (DR) and normal retinal structures given below and described as follows: (i) Pixel level labels of typical DR lesions and optic disc; (ii) Image level disease severity grading of DR, and DME; (iii) Optic disc and fovea center coordinates. The DRIONS-DB dataset [7] consists of 110 color digital retinal images, and it contains several visual characteristics, such as cataract (severe or moderate), light artifacts, some of the rim blurred or missing, moderate peripapillary atrophy, concentric peripapillary atrophy/artifacts, and strong pallor distractor. The FIRE dataset [20] consists of 129 retinal images forming 134 image pairs, and image pairs are split into three different categories depending on their characteristics. The Drishti-GS dataset [54] contains 101 images, and it is divided into 50 training and 51 testing images. The MESSIDOR dataset [13] has 1200 eye fundus color numerical images. Although the dataset contains a medical diagnosis for each image, there is no manual annotation, such as lesions contours or position, on the images. The DIARETDB0 dataset [31] consists of 130 color fundus images of which 20 are normal, and 110 contain signs of the DR. The DIARETDB1 dataset [32] consists of 89 color fundus images of which 84 contain at least mild non-proliferative signs of the DR, and five are considered as normal which do not contain any signs of the DR. The INSPIRE-AVR dataset [44] has 40 colorful images of the vessels and optic disc and an arterio-venous ratio reference standard. The ONHSD dataset [10] has 99 retinal images and it is mainly used for the segmentation task. The REVIEW dataset [2] consists of 14 images, and it is also mainly used for the segmentation task. The ROC dataset [43] aims to help patients with diabetes through improving computer-aided detection and diagnosis of DR. The e-ophtha [12] is a dataset of color fundus images specially designed for scientific research in DR. The HRF dataset [45] contains at the moment 15 images of healthy patients, 15 images of patients with DR and 15 images of glaucomatous patients. Also, binary gold standard vessel segmentation images are available for each image. The RODREP dataset [1] contains repeated 4-field color fundus photos (1120 in total) of 70 patients in the DR screening program of the Rotterdam Eye Hospital. The CHASE-DB1 dataset [15] is mainly used for retinal vessel analysis, and it contains 14 images. The STARE dataset [21] has 397 images and it is used to develop an automatic system for diagnosing diseases of the human eye. The VARIA [46] is a dataset of retinal images used for authentication purposes, and it includes 233 images from 139 different individuals. The VICAVR dataset [57] includes 58 images, and it is used for the computation of the ratio of A/V, (Artery/Vein). In this work, we propose a large-scale retinal images dataset, DeepEyeNet (DEN), to train our deep learning based models and validate our RDI and CDG. For convenience, we summarize the above retinal datasets in Table 1.
3 Dataset Introduction and Analysis
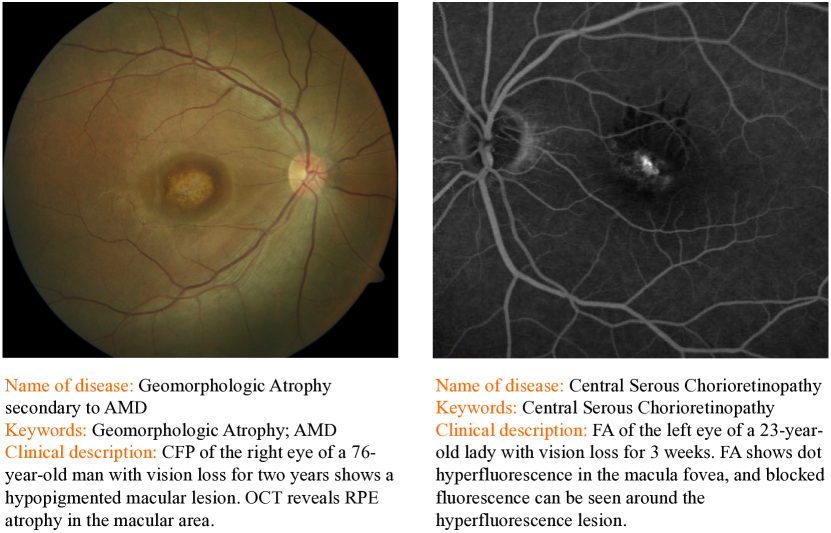
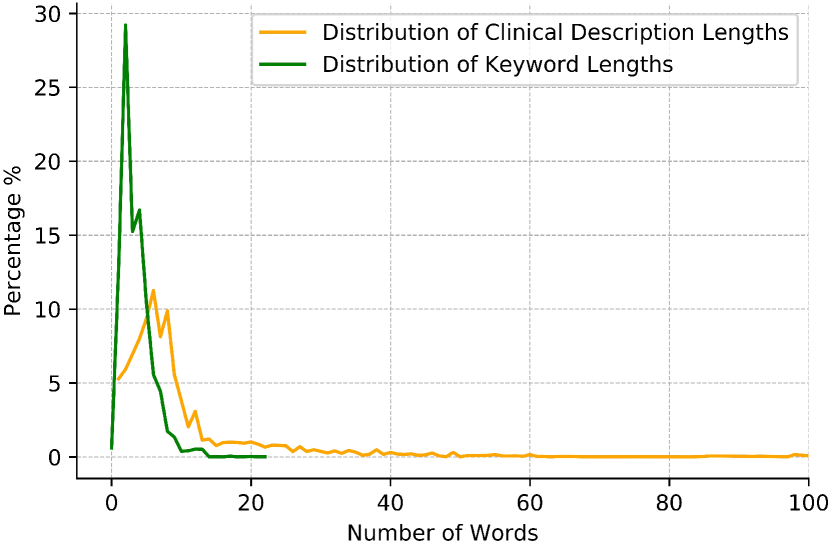
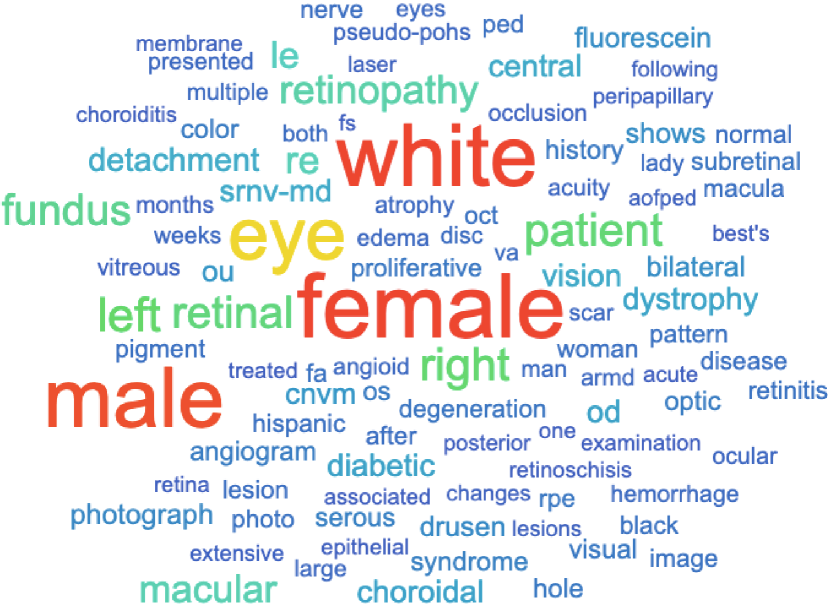
In this section, we start to describe our proposed DEN dataset in terms of types of retinal images and labels and some statistics of the dataset. Note that some of our group members are experienced ophthalmologists and they help us build the proposed DEN dataset sorted by 265 unique retinal symptoms from the clinical definition and their professional domain knowledge. In our proposed DEN dataset, there are two types of retinal images, grey scale FA and colorful CFP. The total amount of images is 15,709, including 1,811 FA and 13,898 CFP. As with most of the large-scale datasets for deep learning research, we create standard splits, separating the whole dataset into , i.e., , for training/validation/testing, respectively. Each retinal image has three corresponding labels including the name of the disease, keywords, and clinical description. For the total number of retinal diseases, the dataset contains 265 different retinal diseases including the common and non-common. For the keyword and clinical description, it contains 15,709 captions and 15,709 keywords labels. Keyword label denotes important information in the diagnosis process. Clinical description label represents the corresponding caption of a given retinal image. Note that all the labels are defined by retina specialists or ophthalmologists. To better understand our dataset, we show some data examples from the DEN dataset in Figure 3. Also, in Figure 4, we show the word length distribution of the keyword and clinical description labels. Based on Figure 4, we observe the longest word length in our dataset is more than words for keywords and words for clinical descriptions. Note that the longest word length of existing datasets for natural image captioning or VQA [4, 9, 39, 26, 23] is only around words. It implies that our proposed dataset is challenging. Additionally, we provide the Venn-style word cloud visualization results clinical description labels, referring to Figure 5. Based on Figure 5, in clinical description labels, we see there are specific abstract concepts, which makes the dataset more challenging.
4 Methodology
In this section, we start to describe the proposed AI-based method for automatic medical report generation. The proposed method is mainly composed of the DNN-based module and DNN visual explanation module.
4.1 DNN-based Module
The DNN-based module contains two components, i.e., a retinal disease identifier (RDI) and a clinical description generator (CDG). We introduce them in the following subsections. Note that we hypothesize an effective RDI and effective CDG help improve the conventional retinal disease treatment procedure and help ophthalmologists increase diagnosis efficiency and accuracy.
Retinal Disease Identifier (RDI). To identify retinal diseases, in our RDI sub-module, we provide two types of deep learning models based on [18, 53], pre-trained on ImageNet, and then trained on the proposed DEN dataset. From the lower level feature perspective, such as color, most of the medical images, e.g., radiology images of the chest, are mainly grey-scale [34] but retinal images are mainly colorful in our dataset. Using the ImageNet pre-trained at least helps extract the better lower level features information. So, in this case, we expect that pre-training on ImageNet can improve model performance.
Clinical Description Generator (CDG). To generate the clinical description for an input retinal image, we use a pre-trained CNN-based model, such as MobileNetV2, VGG16, VGG19, or InceptionV3, as our image feature encoder and a Long Short-term Memory (LSTM) as our decoder to generate text, referring to Figure 6. When we try to generate the clinical description by the LSTM unit, we incorporate the beam-search mechanism to get the better final output description. In ophthalmological practice, commonly existing keywords, with unordered nature, help ophthalmologists create medical reports. Inspired by this, we exploit keywords to reinforce our CDG sub-module. As shown in Figure 6, we use a keyword embedding module, such as bag of words, to encode our keyword information. Note that when keywords are used to reinforce CDG, it means we will have two types of input features, i.e., image and text features. In this work, we use the average method to fuse these two types of features, referring to Figure 6.
4.2 DNN Visual Explanation Modules
There are some existing DNN visual explanation methods, such as [70, 52, 22, 41]. The authors of [70] have proposed a technique, called Class Activation Mapping (CAM), for CNN. It makes classification-trained CNN learn how to perform the task of object localization, without using a bounding box. Furthermore, they exploit class activation maps to visualize the predicted class scores on a given image, highlighting the discriminative object parts which are detected by the CNN. To improve the conventional retinal disease treatment procedure, we incorporate the DNN visual explanation module in our proposed AI-based method. Also, we exploit this module to help verify the effectiveness of the method, referring to our Experiments section.
4.3 Medical Report Generation
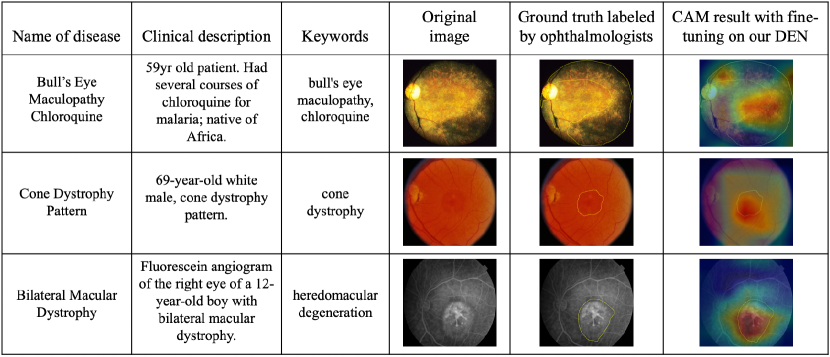
According to [68, 51], proper multimedia data visualization helps people get insight from the data efficiently. In some sense, we can say that multimedia visualization is a way to visually arrange multimedia data, and it sometimes even helps people get a deeper understanding and extra information from the visualized data. In this work, it contains five multimedia data, including the name of the disease, keyword, clinical description, retinal image, and CAM result image. So, we exploit the table-based concept, which is similar to the static spreadsheet-based concept [68], to visualize our medical report, referring to Figure 7. The medical report visualization intends to help ophthalmologists get the insight from the above image and text data efficiently and also increase the diagnostic accuracy.
5 Experiments
In this section, we compare our proposed method to baselines for verifying the effectiveness based on the assumption described in our Methodology section.
5.1 Retinal Disease Identifier (RDI) Verification
In our experiment, we try to show that the RDI model with ImageNet pre-training is better than the RDI model without ImageNet pre-training, i.e., our baseline. We exploit the ImageNet-pre-trained DNN-based deep model and non-ImageNet-pre-trained DNN-based deep model with different architectures to do fine-tuning on DEN. For empirical reasons, we use two recipes to train different models. For the RDI model based on [18], we start with a learning rate of and decay it times for every epoch. For the RDI model based on [53], we start with a learning rate of and decay it times for every epoch. According to the evaluation results in Table 2, we find that the RDI model based on [53] with ImageNet pre-training has better performance than others. We conjecture that RDI models based on [18, 29] may be too complicated for the proposed DEN dataset. Although DEN is a large-scale dataset from the retinal field perspective, the number of training images is still not enough for very deep models. Note that our proposed DEN dataset has classes, including common and non-common retinal diseases or symptoms, and only training images, so it is not easy to achieve high Prec@1 accuracy for human doctors and AI machines. That is one of the reasons why we investigate both Prec@1 and Prec@5. Also, reporting Prec@5 accuracy is more appropriate from the real-world scenario perspective.
| Model | BLEU-1 | BLEU-2 | BLEU-3 | BLEU-4 | BLEU-avg | CIDEr | ROUGE | |
|---|---|---|---|---|---|---|---|---|
| Karpathy, et al. [30] | w/o | 0.081 | 0.031 | 0.009 | 0.004 | 0.031 | 0.117 | 0.134 |
| w/ | 0.169 | 0.103 | 0.060 | 0.017 | 0.087 | 0.120 | 0.202 | |
| Vinyals, et al. [59] | w/o | 0.054 | 0.018 | 0.002 | 0.001 | 0.019 | 0.056 | 0.083 |
| w/ | 0.144 | 0.092 | 0.052 | 0.021 | 0.077 | 0.296 | 0.197 | |
| Jing, et al. [29] | w/o | 0.130 | 0.083 | 0.044 | 0.012 | 0.067 | 0.167 | 0.149 |
| w/ | 0.184 | 0.114 | 0.068 | 0.032 | 0.100 | 0.361 | 0.232 | |
| Li, et al. [36] | w/o | 0.111 | 0.060 | 0.026 | 0.006 | 0.051 | 0.066 | 0.129 |
| w/ | 0.181 | 0.107 | 0.062 | 0.032 | 0.096 | 0.453 | 0.230 | |
5.2 Clinical Description Generator (CDG) Verification
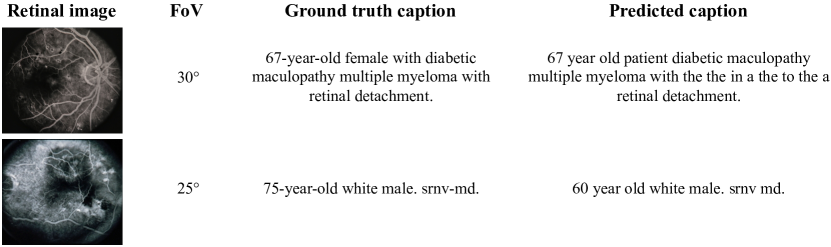
In [24, 27, 25], the authors mention that the evaluation of image description generators is very subjective and there is no such thing as the most proper metric to evaluate the text-to-text similarity. Different text-to-text similarity metrics have different properties, so we exploit six commonly used metrics, including BLEU-1, BLEU-2, BLEU-3, BLEU-4 [48], ROUGE [38], and CIDEr [58], to evaluate generated results by our CDG. Table 3 contains the evaluation results of our CDGs based on the above six different text-to-text similarity metrics. All CDG modules with the keyword-driven method have better performance than the non-keyword-driven CDGs, i.e., our baseline. It implies that using keywords to reinforce the CDGs is effective. Based on Table 3 and [29, 60], we find that the evaluation score of the medical image captioning, based on the above commonly used text evaluation metrics, is much lower than the evaluation score of the natural image captioning. One reason is that, typically, the length of the medical image caption is much longer than the natural image caption. Also, the medical image caption has more abstract words or concepts than the natural image caption. These abstract words/concepts will make algorithms difficult to generate correct captions. The other possible reason is that the innate property of the commonly used text-to-text similarity metrics [24, 27, 25] makes this happen. In addition, in Figure 8, we show some generated clinical description results. Based on Figure 8, we find that although our CDG module cannot always generate correct “age” or “gender”, the models are capable of generating correct descriptions to important characteristics for retinal images.
Based on the assumption mentioned in our Methodology section, subsection 5.1, and subsection 5.2, we have shown the proposed AI-based method is quantitatively effective.
5.3 Evaluation by DNN Visual Explanation Module
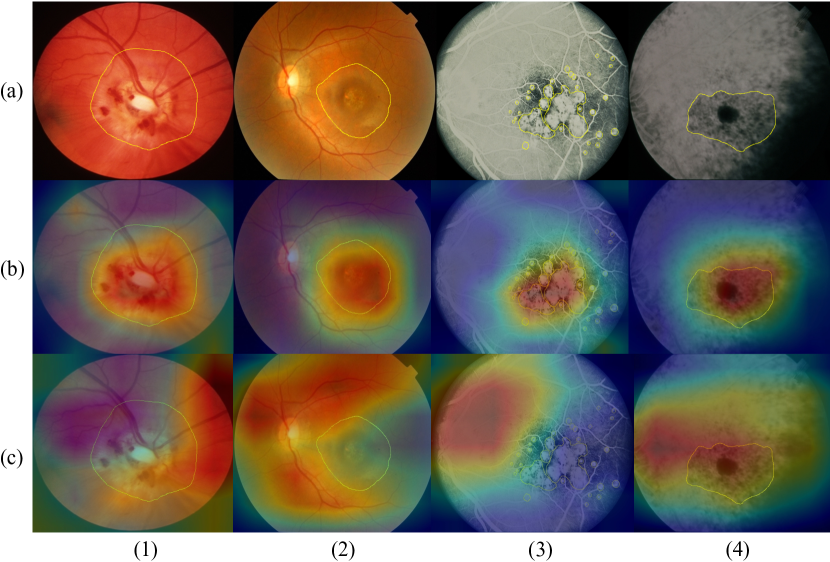
The main idea of DNN visual explanation module evaluation is that if our DNN visual explanation results generated by CAM [70] are accepted by ophthalmologists, it implies that the proposed method is qualitatively effective. To prove the claim, we build the other retinal image dataset with retinal images labeled by ophthalmologists and exploit the CNN visualization tool, CAM, to visualize the learned feature and compare it to the ground truth retinal image. We show the qualitative results in Figure 9. In Figure 9, row (a) shows the four different kinds of raw images of retina diseases and each raw image has a yellow sketch labeled by the ophthalmologist to highlight the lesion areas on the retina. The numbers from (1) to (4) denote the four different diseases, including Optic Neuritis, Macular Dystrophy, Albinotic Spots in Macula, and Stargardt Cone-Rod Dystrophy, respectively. We exploit CAM to generate row (b) to demonstrate the visualization results of our DNN-based model. Then, row (c) is produced by the same method as the row (b). Note that both row (b) and row (c) use the same pre-trained weights of ImageNet but row (b) has fine-tuning on DEN dataset and row (c) has no fine-tuning on DEN. The comparison of row (b) and row (c) shows that the DNN-based model successfully learns the robust features of retinal images by training on our DEN dataset. Also, row (b) indicates that the features learned by DNN agree with the domain knowledge of ophthalmologists. That is to say, the activation maps of our deep models are aligned with image features that are clinically recognized by ophthalmologists as linked with the identified disease. The above experimental results show our proposed AI-based method is qualitatively effective.
6 Conclusion
To sum up, we propose an AI-based method to automatically generate medical reports for retinal images to improve the traditional retinal diseases treatment procedure. The proposed method is composed of a DNN-based module, including RDI and CDG sub-modules, and DNN visual explanation module. To train our deep models and validate the effectiveness of our RDI and CDG, we propose a large-scale retinal disease image dataset, DEN. Also, we provide another retinal image dataset manually labeled by ophthalmologists to qualitatively evaluate the proposed method. Our experimental results show the proposed AI-based method is effective and successfully improves the conventional treatment procedure of retinal diseases.
7 Acknowledgments
This work is supported by competitive research funding from King Abdullah University of Science and Technology (KAUST) and University of Amsterdam.
References
- [1] Kedir M Adal, Peter G van Etten, Jose P Martinez, Lucas J van Vliet, and Koenraad A Vermeer. Accuracy assessment of intra-and intervisit fundus image registration for diabetic retinopathy screening. Investigative ophthalmology & visual science, 56(3):1805–1812, 2015.
- [2] Bashir Al-Diri, Andrew Hunter, David Steel, Maged Habib, Taghread Hudaib, and Simon Berry. A reference data set for retinal vessel profiles. In 2008 30th Annual International Conference of the IEEE Engineering in Medicine and Biology Society, pages 2262–2265. IEEE, 2008.
- [3] Peter Anderson, Basura Fernando, Mark Johnson, and Stephen Gould. Spice: Semantic propositional image caption evaluation. In European Conference on Computer Vision, pages 382–398. Springer, 2016.
- [4] Stanislaw Antol, Aishwarya Agrawal, Jiasen Lu, Margaret Mitchell, Dhruv Batra, C Lawrence Zitnick, and Devi Parikh. Vqa: Visual question answering. In Proceedings of the ICCV, pages 2425–2433, 2015.
- [5] Ahmet Murat Bagci, Mahnaz Shahidi, Rashid Ansari, Michael Blair, Norman Paul Blair, and Ruth Zelkha. Thickness profiles of retinal layers by optical coherence tomography image segmentation. American journal of ophthalmology, 2008.
- [6] Satanjeev Banerjee and Alon Lavie. Meteor: An automatic metric for mt evaluation with improved correlation with human judgments. In Proceedings of the acl workshop on intrinsic and extrinsic evaluation measures for machine translation and/or summarization, pages 65–72, 2005.
- [7] Enrique J Carmona, Mariano Rincón, Julián García-Feijoó, and José M Martínez-de-la Casa. Identification of the optic nerve head with genetic algorithms. Artificial Intelligence in Medicine, 43(3):243–259, 2008.
- [8] Aditya Chattopadhay, Anirban Sarkar, Prantik Howlader, and Vineeth N Balasubramanian. Grad-cam++: Generalized gradient-based visual explanations for deep convolutional networks. In 2018 IEEE Winter Conference on Applications of Computer Vision (WACV), pages 839–847. IEEE, 2018.
- [9] Xinlei Chen, Hao Fang, Tsung-Yi Lin, Ramakrishna Vedantam, Saurabh Gupta, Piotr Dollár, and C Lawrence Zitnick. Microsoft coco captions: Data collection and evaluation server. arXiv preprint arXiv:1504.00325, 2015.
- [10] Retinal Image Computing. Understanding,“onhsd-optic nerve head segmentation dataset,” university of lincoln, united kingdom, 2004, 2012.
- [11] Jeffrey De Fauw, Joseph R Ledsam, Bernardino Romera-Paredes, Stanislav Nikolov, Nenad Tomasev, Sam Blackwell, Harry Askham, Xavier Glorot, Brendan O’Donoghue, Daniel Visentin, et al. Clinically applicable deep learning for diagnosis and referral in retinal disease. Nature Medicine, page 1, 2018.
- [12] Etienne Decencière, Guy Cazuguel, Xiwei Zhang, Guillaume Thibault, J-C Klein, Fernand Meyer, Beatriz Marcotegui, Gwénolé Quellec, Mathieu Lamard, Ronan Danno, et al. Teleophta: Machine learning and image processing methods for teleophthalmology. Irbm, 34(2):196–203, 2013.
- [13] Etienne Decencière, Xiwei Zhang, Guy Cazuguel, Bruno Lay, Béatrice Cochener, Caroline Trone, Philippe Gain, Richard Ordonez, Pascale Massin, Ali Erginay, et al. Feedback on a publicly distributed image database: the messidor database. Image Analysis & Stereology, 33(3):231–234, 2014.
- [14] Hao Fang, Saurabh Gupta, Forrest Iandola, Rupesh K Srivastava, Li Deng, Piotr Dollár, Jianfeng Gao, Xiaodong He, Margaret Mitchell, John C Platt, et al. From captions to visual concepts and back. In CVPR, pages 1473–1482, 2015.
- [15] Muhammad Moazam Fraz, Paolo Remagnino, Andreas Hoppe, Bunyarit Uyyanonvara, Alicja R Rudnicka, Christopher G Owen, and Sarah A Barman. An ensemble classification-based approach applied to retinal blood vessel segmentation. IEEE Transactions on Biomedical Engineering, 59(9):2538–2548, 2012.
- [16] Lianli Gao, Kaixuan Fan, Jingkuan Song, Xianglong Liu, Xing Xu, and Heng Tao Shen. Deliberate attention networks for image captioning. AAAI, 2019.
- [17] Ulrich Gerckens, Lutz Buellesfeld, Edward McNamara, and Eberhard Grube. Optical coherence tomography (oct). Herz, 28(6):496–500, 2003.
- [18] Kaiming He, Xiangyu Zhang, Shaoqing Ren, and Jian Sun. Deep residual learning for image recognition. In CVPR, pages 770–778, 2016.
- [19] Lisa Anne Hendricks, Zeynep Akata, Marcus Rohrbach, Jeff Donahue, Bernt Schiele, and Trevor Darrell. Generating visual explanations. In European Conference on Computer Vision, pages 3–19. Springer, 2016.
- [20] Carlos Hernandez-Matas, Xenophon Zabulis, Areti Triantafyllou, Panagiota Anyfanti, Stella Douma, and Antonis A Argyros. Fire: fundus image registration dataset. Journal for Modeling in Ophthalmology, 1(4):16–28, 2017.
- [21] Adam Hoover and Michael Goldbaum. Locating the optic nerve in a retinal image using the fuzzy convergence of the blood vessels. IEEE transactions on medical imaging, 22(8):951–958, 2003.
- [22] Tao Hu, Pascal Mettes, Jia-Hong Huang, and Cees GM Snoek. Silco: Show a few images, localize the common object. In Proceedings of the IEEE International Conference on Computer Vision, pages 5067–5076, 2019.
- [23] Jia-Hong Huang. Robustness analysis of visual question answering models by basic questions. King Abdullah University of Science and Technology, Master Thesis, 2017.
- [24] Jia-Hong Huang, Modar Alfadly, and Bernard Ghanem. Vqabq: Visual question answering by basic questions. VQA Challenge Workshop, CVPR, 2017.
- [25] Jia-Hong Huang, Modar Alfadly, and Bernard Ghanem. Robustness analysis of visual qa models by basic questions. VQA Challenge and Visual Dialog Workshop, CVPR, 2018.
- [26] Jia-Hong Huang, Modar Alfadly, Bernard Ghanem, and Marcel Worring. Assessing the robustness of visual question answering. arXiv preprint arXiv:1912.01452, 2019.
- [27] Jia-Hong Huang, Cuong Duc Dao, Modar Alfadly, and Bernard Ghanem. A novel framework for robustness analysis of visual qa models. In Proceedings of the AAAI Conference on Artificial Intelligence, volume 33, pages 8449–8456, 2019.
- [28] Jia-Hong Huang and Marcel Worring. Query-controllable video summarization. In Proceedings of the 2020 International Conference on Multimedia Retrieval, pages 242–250, 2020.
- [29] Baoyu Jing, Pengtao Xie, Eric Xing, Baoyu Jing, Pengtao Xie, and Eric Xing. On the automatic generation of medical imaging reports. ACL, 2018.
- [30] Andrej Karpathy and Li Fei-Fei. Deep visual-semantic alignments for generating image descriptions. In CVPR, pages 3128–3137, 2015.
- [31] T Kauppi, V Kalesnykiene, et al. Diaretdb0-standard diabetic retinopathy database, calibration level 0. imageret project 2007.
- [32] Tomi Kauppi, Valentina Kalesnykiene, Joni-Kristian Kamarainen, Lasse Lensu, Iiris Sorri, A Raninen, R Voutilainen, J Pietilä, H Kälviäinen, and H Uusitalo. Diaretdb1—standard diabetic retinopathy database calibration level 1, 2007.
- [33] Andrew Lang, Aaron Carass, Matthew Hauser, Elias S Sotirchos, Peter A Calabresi, Howard S Ying, and Jerry L Prince. Retinal layer segmentation of macular oct images using boundary classification. Biomedical optics express, 2013.
- [34] Jonathan Laserson, Christine Dan Lantsman, Michal Cohen-Sfady, Itamar Tamir, Eli Goz, Chen Brestel, Shir Bar, Maya Atar, and Eldad Elnekave. Textray: Mining clinical reports to gain a broad understanding of chest x-rays. In International Conference on Medical Image Computing and Computer-Assisted Intervention, pages 553–561. Springer, 2018.
- [35] Domenico Lepore, Graham E Quinn, Fernando Molle, Lorenzo Orazi, Antonio Baldascino, Marco H Ji, Maria Sammartino, Fabio Sbaraglia, Daniela Ricci, and Eugenio Mercuri. Follow-up to age 4 years of treatment of type 1 retinopathy of prematurity intravitreal bevacizumab injection versus laser: fluorescein angiographic findings. Ophthalmology, 125(2):218–226, 2018.
- [36] Christy Y Li, Xiaodan Liang, Zhiting Hu, and Eric P Xing. Knowledge-driven encode, retrieve, paraphrase for medical image report generation. In Proceedings of the AAAI Conference on Artificial Intelligence, volume 33, pages 6666–6673, 2019.
- [37] Kunpeng Li, Ziyan Wu, Kuan-Chuan Peng, Jan Ernst, and Yun Fu. Tell me where to look: Guided attention inference network. In Proceedings of the IEEE Conference on Computer Vision and Pattern Recognition, pages 9215–9223, 2018.
- [38] Chin-Yew Lin. Rouge: A package for automatic evaluation of summaries. Text Summarization Branches Out, 2004.
- [39] Tsung-Yi Lin, Michael Maire, Serge Belongie, James Hays, Pietro Perona, Deva Ramanan, Piotr Dollár, and C Lawrence Zitnick. Microsoft coco: Common objects in context. In European conference on computer vision, pages 740–755. Springer, 2014.
- [40] Siqi Liu, Zhenhai Zhu, Ning Ye, Sergio Guadarrama, and Kevin Murphy. Improved image captioning via policy gradient optimization of spider. In Proceedings of the IEEE international conference on computer vision, pages 873–881, 2017.
- [41] Yi-Chieh Liu, Yung-An Hsieh, Min-Hung Chen, C-H Huck Yang, Jesper Tegner, and Y-C James Tsai. Interpretable self-attention temporal reasoning for driving behavior understanding. In IEEE International Conference on Acoustics, Speech and Signal Processing (ICASSP), pages 2338–2342. IEEE, 2020.
- [42] Yi-Chieh Liu, Hao-Hsiang Yang, Chao-Han Huck Yang, Jia-Hong Huang, Meng Tian, Hiromasa Morikawa, Yi-Chang James Tsai, and Jesper Tegner. Synthesizing new retinal symptom images by multiple generative models. In Asian Conference on Computer Vision, pages 235–250. Springer, 2018.
- [43] Meindert Niemeijer, Bram Van Ginneken, Michael J Cree, Atsushi Mizutani, Gwénolé Quellec, Clara I Sánchez, Bob Zhang, Roberto Hornero, Mathieu Lamard, Chisako Muramatsu, et al. Retinopathy online challenge: automatic detection of microaneurysms in digital color fundus photographs. IEEE transactions on medical imaging, 29(1):185–195, 2010.
- [44] M Niemeijer, X Xu, A Dumitrescu, P Gupta, B van Ginneken, J Folk, and M Abramoff. Inspire-avr: Iowa normative set for processing images of the retina-artery vein ratio, 2011.
- [45] J Odstrčilík, Jiri Jan, J Gazárek, and R Kolář. Improvement of vessel segmentation by matched filtering in colour retinal images. In World Congress on Medical Physics and Biomedical Engineering, Munich, Germany. Springer, 2009.
- [46] Marcos Ortega, Manuel G Penedo, José Rouco, Noelia Barreira, and María J Carreira. Retinal verification using a feature points-based biometric pattern. EURASIP Journal on Advances in Signal Processing, 2009:2, 2009.
- [47] Nitika Pant Pai, Caroline Vadnais, Claudia Denkinger, Nora Engel, and Madhukar Pai. Point-of-care testing for infectious diseases: diversity, complexity, and barriers in low-and middle-income countries. PLoS medicine, 9(9):e1001306, 2012.
- [48] Kishore Papineni, Salim Roukos, Todd Ward, and Wei-Jing Zhu. Bleu: a method for automatic evaluation of machine translation. In Proceedings of ACL, pages 311–318. Association for Computational Linguistics, 2002.
- [49] Louis Pizzarello, Adenike Abiose, Timothy Ffytche, Rainaldo Duerksen, R Thulasiraj, Hugh Taylor, Hannah Faal, Gullapali Rao, Ivo Kocur, and Serge Resnikoff. Vision 2020: The right to sight: a global initiative to eliminate avoidable blindness. Archives of ophthalmology, 122(4):615–620, 2004.
- [50] Prasanna Porwal, Samiksha Pachade, Ravi Kamble, Manesh Kokare, Girish Deshmukh, Vivek Sahasrabuddhe, and Fabrice Meriaudeau. Indian diabetic retinopathy image dataset (idrid): a database for diabetic retinopathy screening research. Data, 3(3):25, 2018.
- [51] Ork De Rooij and Marcel Worring. Efficient targeted search using a focus and context video browser. ACM Transactions on Multimedia Computing, Communications, and Applications (TOMM), 8(4):51, 2012.
- [52] Ramprasaath R Selvaraju, Michael Cogswell, Abhishek Das, Ramakrishna Vedantam, Devi Parikh, and Dhruv Batra. Grad-cam: Visual explanations from deep networks via gradient-based localization. In ICCV, pages 618–626, 2017.
- [53] Karen Simonyan and Andrew Zisserman. Very deep convolutional networks for large-scale image recognition. arXiv:1409.1556, 2014.
- [54] Jayanthi Sivaswamy, SR Krishnadas, Gopal Datt Joshi, Madhulika Jain, and A Ujjwaft Syed Tabish. Drishti-gs: Retinal image dataset for optic nerve head (onh) segmentation. In 2014 IEEE 11th International Symposium on Biomedical Imaging (ISBI), pages 53–56. IEEE, 2014.
- [55] Joes Staal, Michael D Abràmoff, Meindert Niemeijer, Max A Viergever, and Bram Van Ginneken. Ridge-based vessel segmentation in color images of the retina. TMI, 23(4):501–509, 2004.
- [56] Melissa H Tukey and Renda Soylemez Wiener. The impact of a medical procedure service on patient safety, procedure quality and resident training opportunities. Journal of general internal medicine, 29(3):485–490, 2014.
- [57] SG Vázquez, Brais Cancela, Noelia Barreira, Manuel G Penedo, M Rodríguez-Blanco, M Pena Seijo, G Coll de Tuero, Maria Antònia Barceló, and Marc Saez. Improving retinal artery and vein classification by means of a minimal path approach. Machine vision and applications, 24(5):919–930, 2013.
- [58] Ramakrishna Vedantam, C Lawrence Zitnick, and Devi Parikh. Cider: Consensus-based image description evaluation. In Proceedings of the IEEE conference on computer vision and pattern recognition, pages 4566–4575, 2015.
- [59] Oriol Vinyals, Alexander Toshev, Samy Bengio, and Dumitru Erhan. Show and tell: A neural image caption generator. In CVPR, pages 3156–3164, 2015.
- [60] Xiaosong Wang, Yifan Peng, Le Lu, Zhiyong Lu, and Ronald M Summers. Tienet: Text-image embedding network for common thorax disease classification and reporting in chest x-rays. In Proceedings of the IEEE conference on computer vision and pattern recognition, pages 9049–9058, 2018.
- [61] Ryan T Yanagihara, Cecilia S Lee, Daniel Shu Wei Ting, and Aaron Y Lee. Methodological challenges of deep learning in optical coherence tomography for retinal diseases: a review. Translational Vision Science & Technology, 9(2):11–11, 2020.
- [62] Chao-Han Huck Yang, Jia-Hong Huang, Fangyu Liu, Fang-Yi Chiu, Mengya Gao, Weifeng Lyu, I-Hung Lin, and Jesper Tegner. A novel hybrid machine learning model for auto-classification of retinal diseases. Workshop on Computational Biology, ICML, 2018.
- [63] Chao-Han Huck Yang, Fangyu Liu, Jia-Hong Huang, Meng Tian, MD I-Hung Lin, Yi Chieh Liu, Hiromasa Morikawa, Hao-Hsiang Yang, and Jesper Tegner. Auto-classification of retinal diseases in the limit of sparse data using a two-streams machine learning model. In Asian Conference on Computer Vision, pages 323–338. Springer, 2018.
- [64] Chao-Han Huck Yang, Yi-Chieh Liu, Pin-Yu Chen, Xiaoli Ma, and Yi-Chang James Tsai. When causal intervention meets adversarial examples and image masking for deep neural networks. In 2019 IEEE International Conference on Image Processing (ICIP), pages 3811–3815. IEEE, 2019.
- [65] Hao-Hsiang Yang, Chao-Han Huck Yang, and Yi-Chang James Tsai. Y-net: Multi-scale feature aggregation network with wavelet structure similarity loss function for single image dehazing. In ICASSP 2020-2020 IEEE International Conference on Acoustics, Speech and Signal Processing (ICASSP), pages 2628–2632. IEEE, 2020.
- [66] Hao-Hsiang Yang, Chao-Han Huck Yang, and Yu-Chiang Frank Wang. Wavelet channel attention module with a fusion network for single image deraining. arXiv preprint arXiv:2007.09163, 2020.
- [67] Aliaa AA Youssif, Atef Z Ghalwash, Amr S Ghoneim, et al. Comparative study of contrast enhancement and illumination equalization methods for retinal vasculature segmentation. International Biomedical Engineering Conferemce, 2006.
- [68] Jan Zahálka and Marcel Worring. Towards interactive, intelligent, and integrated multimedia analytics. In 2014 IEEE Conference on Visual Analytics Science and Technology (VAST), pages 3–12. IEEE, 2014.
- [69] Matthew D Zeiler and Rob Fergus. Visualizing and understanding convolutional networks. In ECCV, pages 818–833. Springer, 2014.
- [70] B. Zhou, A. Khosla, Lapedriza. A., A. Oliva, and A. Torralba. Learning Deep Features for Discriminative Localization. CVPR, 2016.