Mode Conversion and Period Doubling at Plasma- Unity in an Alfvén-Wave Experiment with Liquid Rubidium
Abstract
We report Alfvén-wave experiments with liquid rubidium at the Dresden High Magnetic Field Laboratory (HLD). Reaching up to 63 T, the pulsed magnetic field exceeds the critical value of 54 T at which the Alfvén speed becomes equal to the sound speed (plasma- unity). At this threshold we observe a period doubling of an applied 8 kHz CW excitation, a clear footprint for a parametric resonance between magnetosonic waves and Alfvén waves.
Since their discovery by Hannes Alfvén in 1942 Alfven1942 , Alfvén waves have played an ever increasing role in understanding astrophysical and fusion-related plasmas. They are, in particular, one of the main ingredients to explain the dramatic heating of the solar corona Tomczyk2007 and to accelerate the solar wind Kasper2019 , they are found in the Earth’s ionosphere Lysak2013 , and they are being employed for the heating of fusion plasmas Fasoli1995 ; Intrator1995 . More generally, Alfvén waves serve as a reference paradigm for a variety of waves and instabilities in rotating magnetized plasmas or liquid metals, in particular the magnetorotational instability Balbus1991 ; Stefani2006 and torsional oscillations in the Earth’s outer core Gillet2010 .
Laboratory experiments on Alfvén waves in liquid mercury Lundquist1949 and sodium Lehnert1954 had started soon after Alfvén’s theoretical prediction. Since those early times, many Alfvén wave experiments have been carried out, both with liquid metals Jameson1964 ; Druyvesteyn1968 ; Iwai2003 and, more extensively, with plasmas Gekelman1999 ; Amatucci2006 . Recently, liquid-metal experiments were resumed in order to study Alfvén waves with pulsed excitations Alboussiere2011 , as well as torsional Alfvén waves in spherical geometry Tigrine2019 .
The recent progress in generating pulsed magnetic fields beyond T Wosnitza2007 ; Zherlitsyn2012 opens up a completely new prospect for Alfvén-wave experiments with liquid metals. It is at those fields (51 T for caesium and 54 T for rubidium) that the Alfvén speed in higher alkali metals crosses the sound speed . This threshold, sometimes called plasma- unity (in plasma physics, is defined as the ratio of thermal to magnetic pressure), is of key importance for the mutual transformability of Alfvén waves and (slow and fast) magnetosonic waves Zaqarashvili2006a ; Warmuth2005 , and its crossing at the so-called “magnetic canopy” has been made responsible for the heating of the corona Hollweg1980 ; Bogdan2003 . One particular effect predicted to occur at this threshold is the transfer of the energy of magnetosonic waves of a given frequency into Alfvén waves of half that frequency (period doubling) that was explained in terms of parametric resonance, or swing excitation Zaqarashvili2006 .
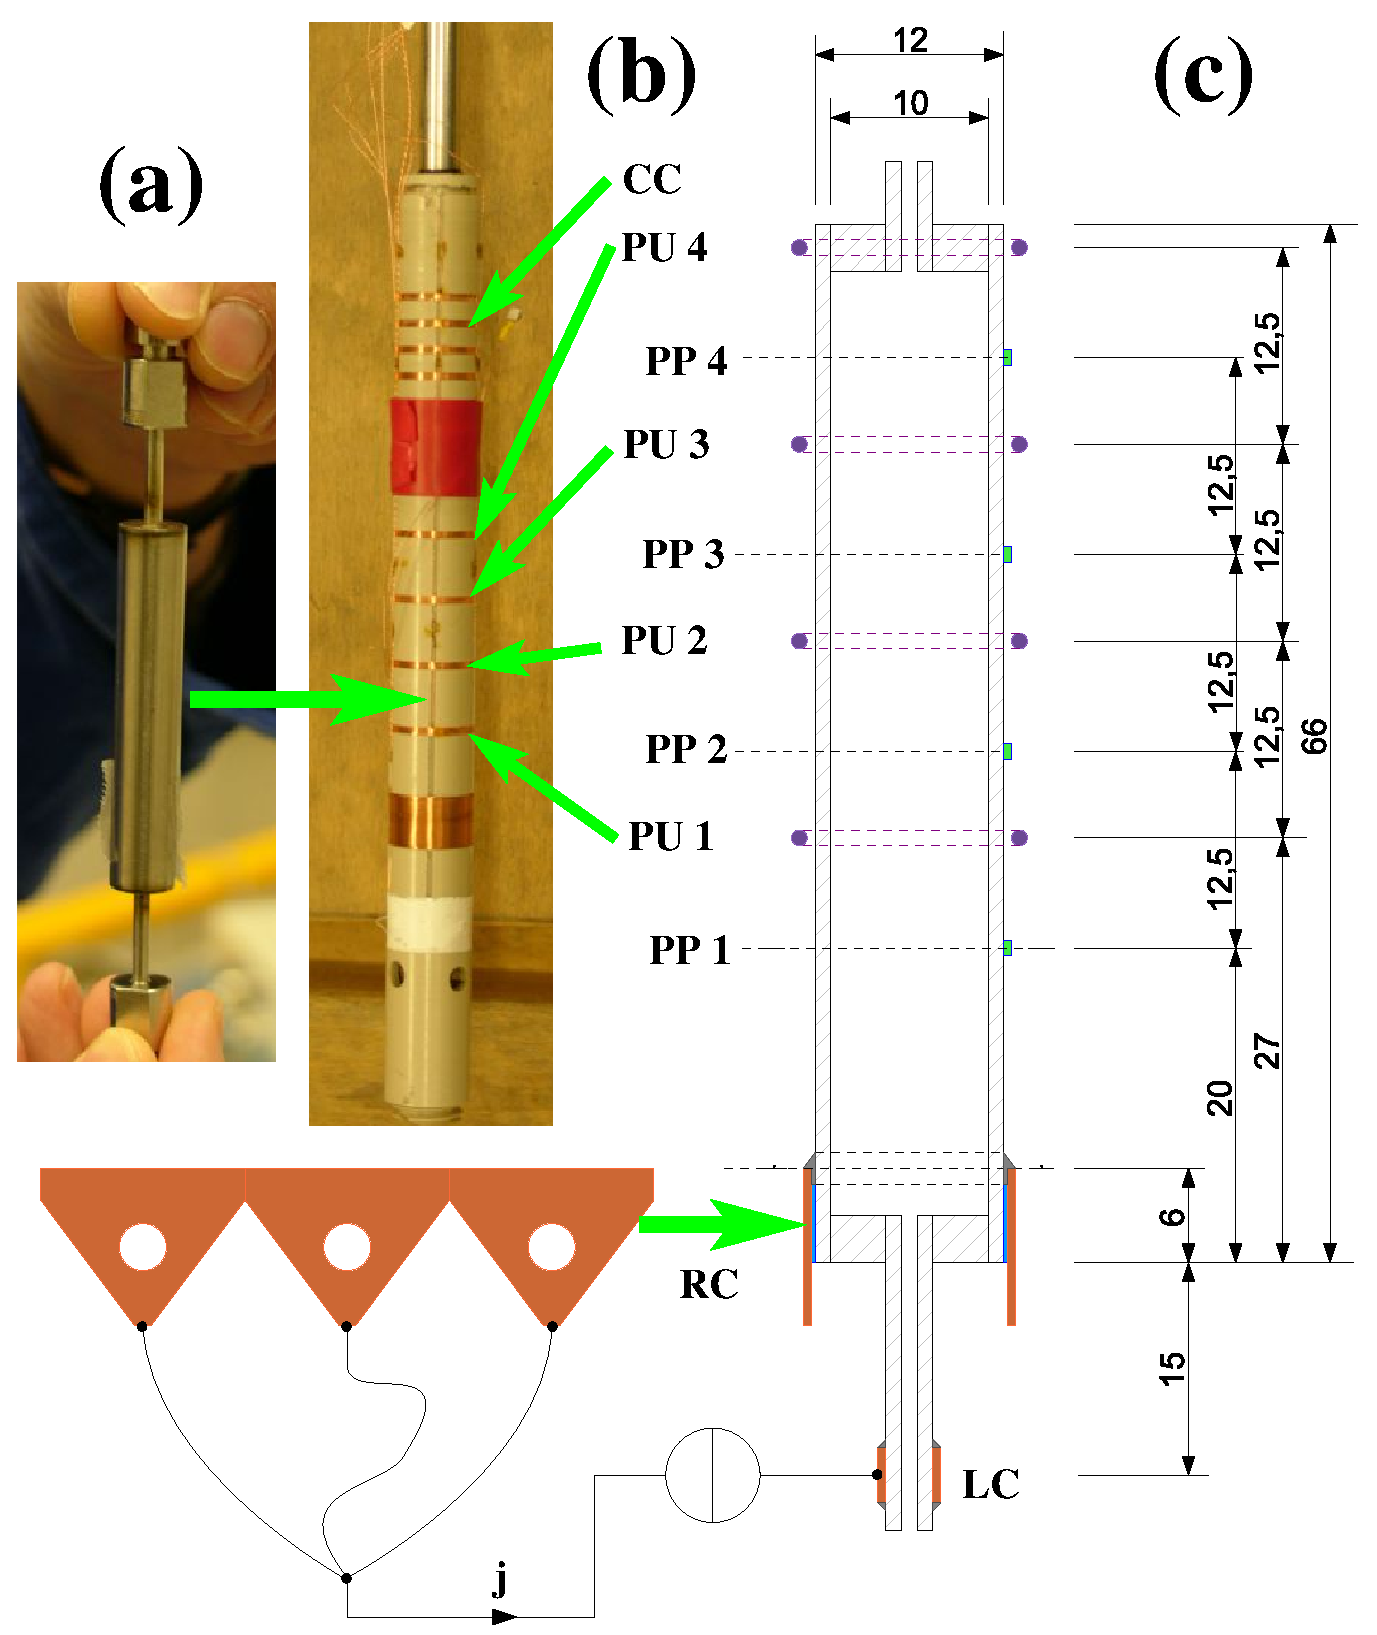
In this Letter, we report experimental evidence for the occurrence of this period-doubling effect in an Alfvén-wave experiment with liquid rubidium. Using one of the pulsed-field coils at the Dresden High Magnetic Field Laboratory (HLD), the achieved maximum field value of 63 T exceeds the threshold , reached at 54 T, by 17 per cent. Yet, the pulsed character of the field entails various technical challenges, among them a huge contribution of the magnetic-flux derivative to the voltage induced in the pick-up coils (an effect that is, by and large, overcome by using compensation coils), and a significant pressure buildup in the liquid metal leading to an uncontrolled background flow field. A further challenge is the limited size of the available experimental volume: the cold-bore diameter in the 70 T long pulse coil of the HLD Wosnitza2007 is 24 mm. Since the copper-alloy coil of the large magnet is immersed into liquid nitrogen, the (warm) rubidium experiment has to be shielded thermally from this cold surrounding by a double-wall Dewar lance which reduces the available diameter further. A holder for the pick-up coils is also necessary, so that the outer diameter of the stainless steel container for the Rubidium is 12 mm. As the pressure in the liquid, arising from the steep increase of the pulsed magnetic field, reaches values in the order of 50 bar, a container wall thickness of 1 mm is necessary, which reduces the ultimately available diameter of the rubidium column to 10 mm. The height of this column, limited by the homogeneity region of the magnetic field, has been chosen as 60 mm. The central part of the set-up, with the container, the coil holder, the pick-up coils and the electric-potential probes is visualized in Fig 1.
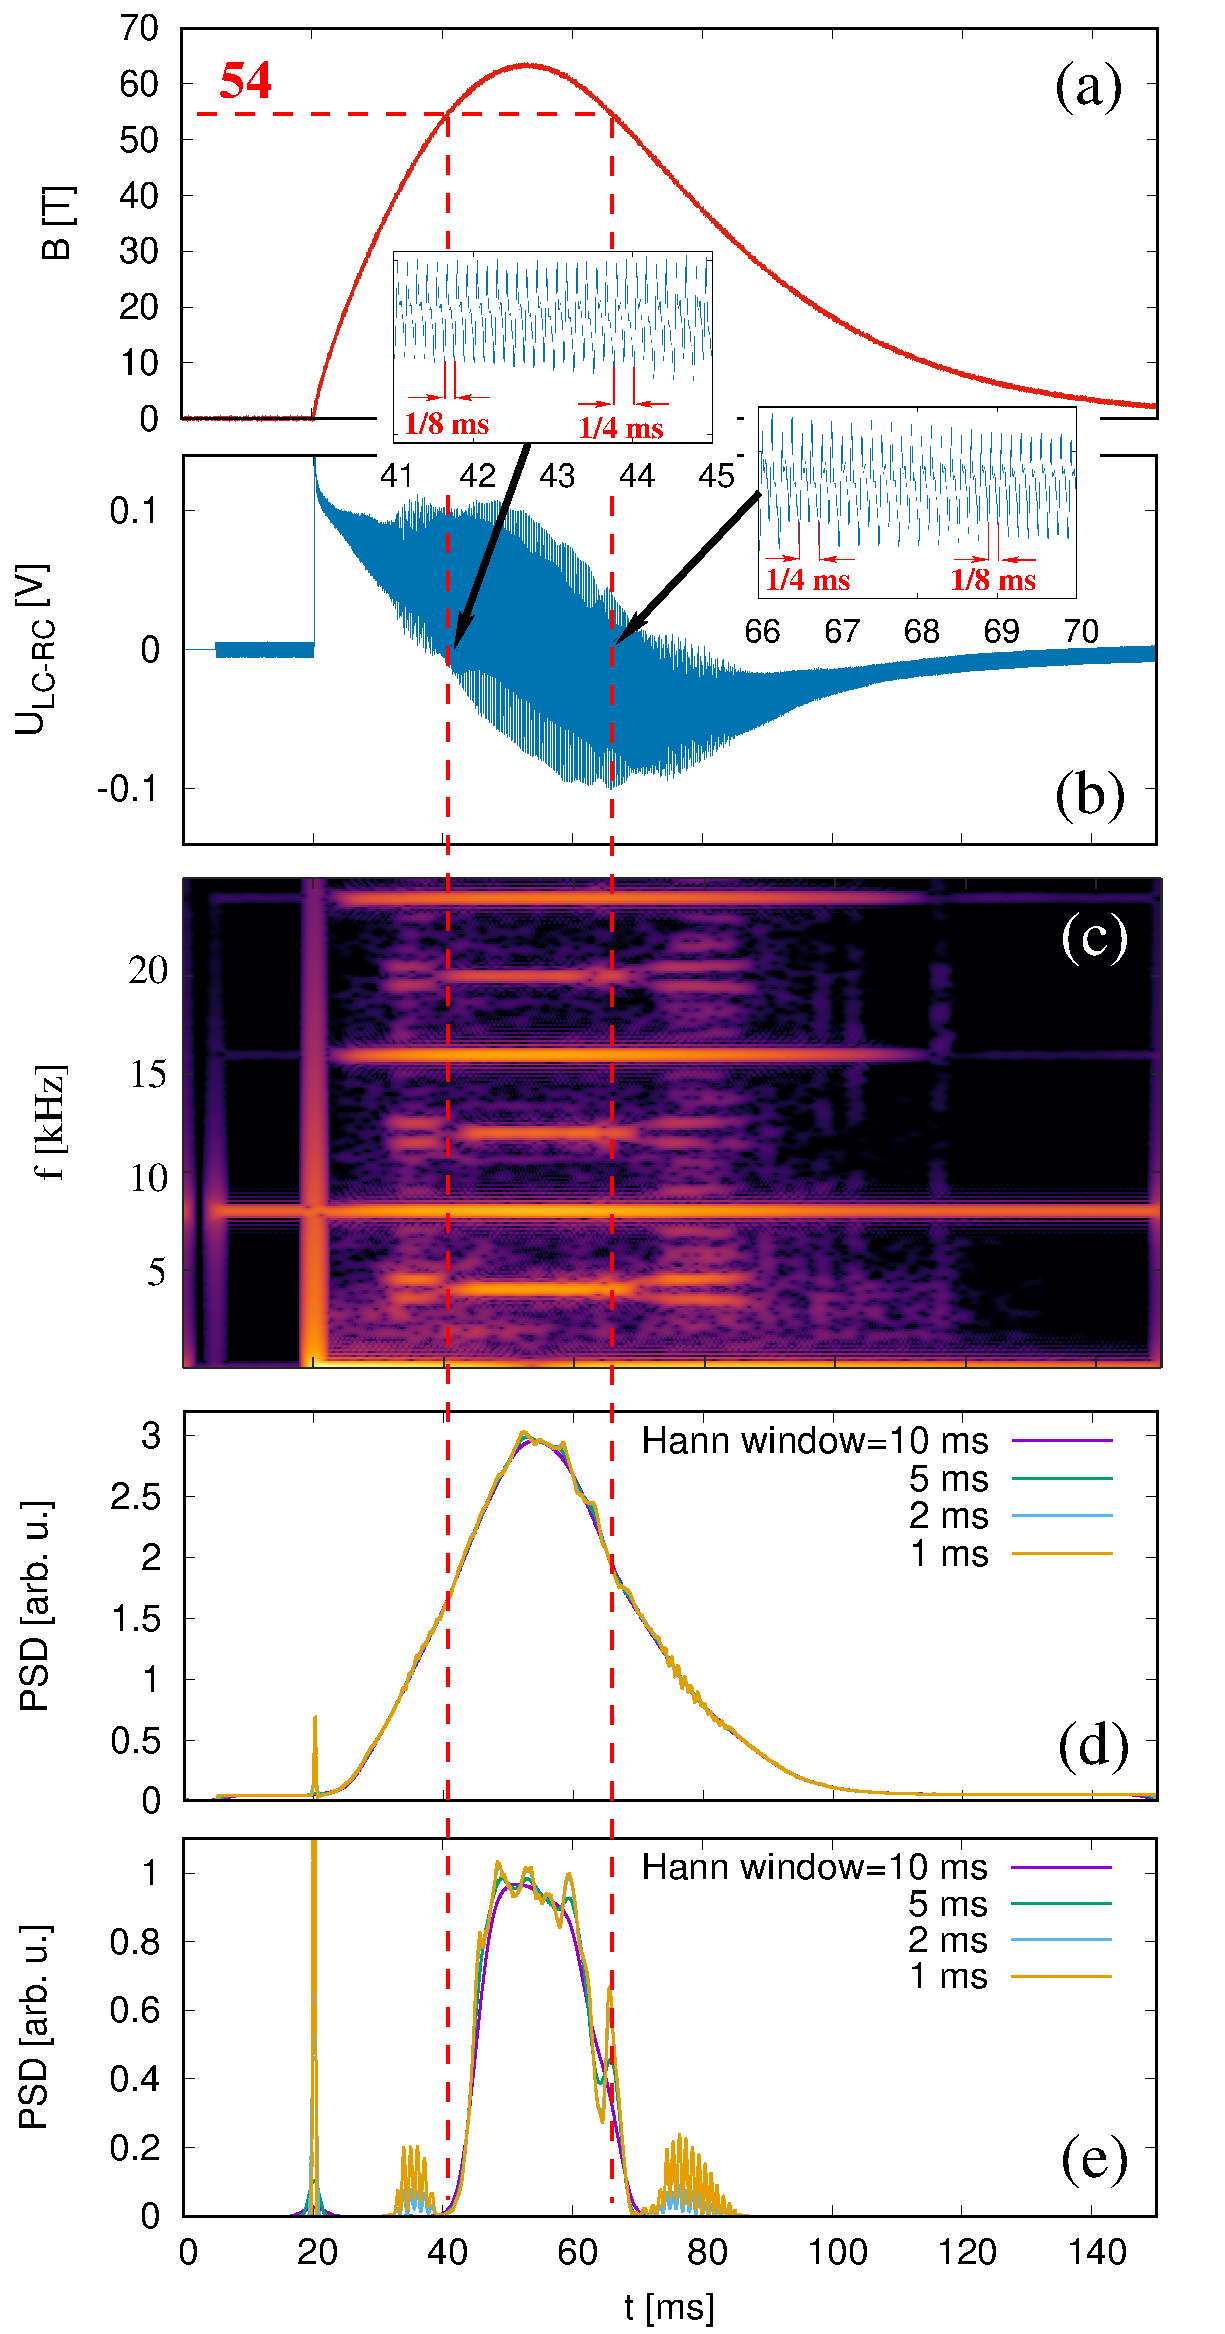
Figure 2 shows some chief results of one experimental run, carried out at a temperature of at which rubidium is liquid. After releasing, at ms, the energy from the capacitor bank (charged with 22 kV) the axial magnetic field [Fig. 2(a)] increases swiftly to attain its maximum value of 63.3 T at ms. From there on, the field declines slowly, reaching a value of 2.1 T at the end of the interval considered here ( ms). The period during which the critical value of 54 T is exceeded ranges from 40.5 ms until 66 ms, as indicated by the dashed red lines. During the entire experiment, a sinusoidal CW current (not shown) with constant amplitude of 5 A and frequency 8 kHz was applied between the lower contact (LC) and the three contacts (RC) encircling the lower rim of the container [illustrated at the lower left part of Fig. 1(c)]. The corresponding current density , which is concentrated in the bottom layer of the rubidium where it is basically directed in radial direction, generates together with the strong vertical field an azimuthal Lorentz force density that is supposed to drive a torsional Alfvén wave in the fluid.
The voltage measured between the contacts LC and RC comprises three contributions: First, a significant electro-motive force (emf) arising from the interaction of the toroidal velocity of the generated torsional (Alfvén) wave with the axial magnetic field . Second, the usual Ohmic voltage drop [giving an amplitude of approximately 5 mV, as seen at at the start and end of the magnetic-field pulse when the magnetic field is close to zero, Fig. 2(a)]. Third, a certain long-term trend resulting from the time derivative of the pulsed field (which is still induced in the wire system used for the electric contacts that is oriented not perfectly radially).
Already without having performed detailed numerical analyses, we can at least plausibilize the measured oscillation amplitude of this emf: with an applied current amplitude of 5 A, we obtain (for the given contact geometry) a current density of kA/m2, leading (with T and a density of kg/m3) to an azimuthal acceleration of m/s2. Acting over half an excitation period (1/16 ms), this acceleration can generate flow velocities of cm/s, which in turn induce (integrated over the container’s radius of mm) an emf of mV. This estimation is well compatible with the amplitude of the voltage oscillation as seen in the high-field segment of Fig. 2(b).
The measured voltage is now analyzed by means of a windowed Fourier transform (or Gabor transform, using the “ltfat” toolbox in Octave ltfat ). For a von Hann window width of 5 ms, Fig. 2(c) shows the arising spectrogram (i.e., the Power Spectral Density (PSD) over time), restricted here to the frequency range kHz, with a resolution of 100 Hz. The dominant feature of this spectrogram is, not surprisingly, the 8 kHz signal, whose time dependence is separately plotted in Fig. 2(d) for four different widths of the von Hann window. Since the amplitude of the velocity induced emf increases smoothly with , there is a negligible dependence on the window width. Another unsurprising feature seen in Fig. 2(c) is the appearance of various overtones of 8 kHz.
What is surprising, however, is the appearance of a strong period-doubling 4 kHz line (and its overtones) which shows up nearly exclusively in the time interval when the field is equal to, or larger than, the critical value of 54 T. Figure 2(e) illustrates this restriction quite clearly. Notable is a slight asymmetry in time: after crossing the threshold, the 4 kHz mode seems to require some time to fully develop, while it extends slightly beyond the end of the interval. Note also, exclusively at the (slowly) decreasing branch, the special peak appearing exactly at T, which is not visible on the (steeply) increasing branch. The remarkable cleanliness and the significant PSD amplitude of this 4 kHz mode (reaching one third of the PSD of the 8 kHz mode), is also highlighted in the two insets of Fig. 2(b) where the initial onset and the later decay of that mode are shown. Without an explanation at hand, we also hint to the obvious splitting of this 4 kHz mode into two sidebands, which occurs shortly before and after the critical threshold [Fig. 2(c)], in a field interval between 30 and 54 T.
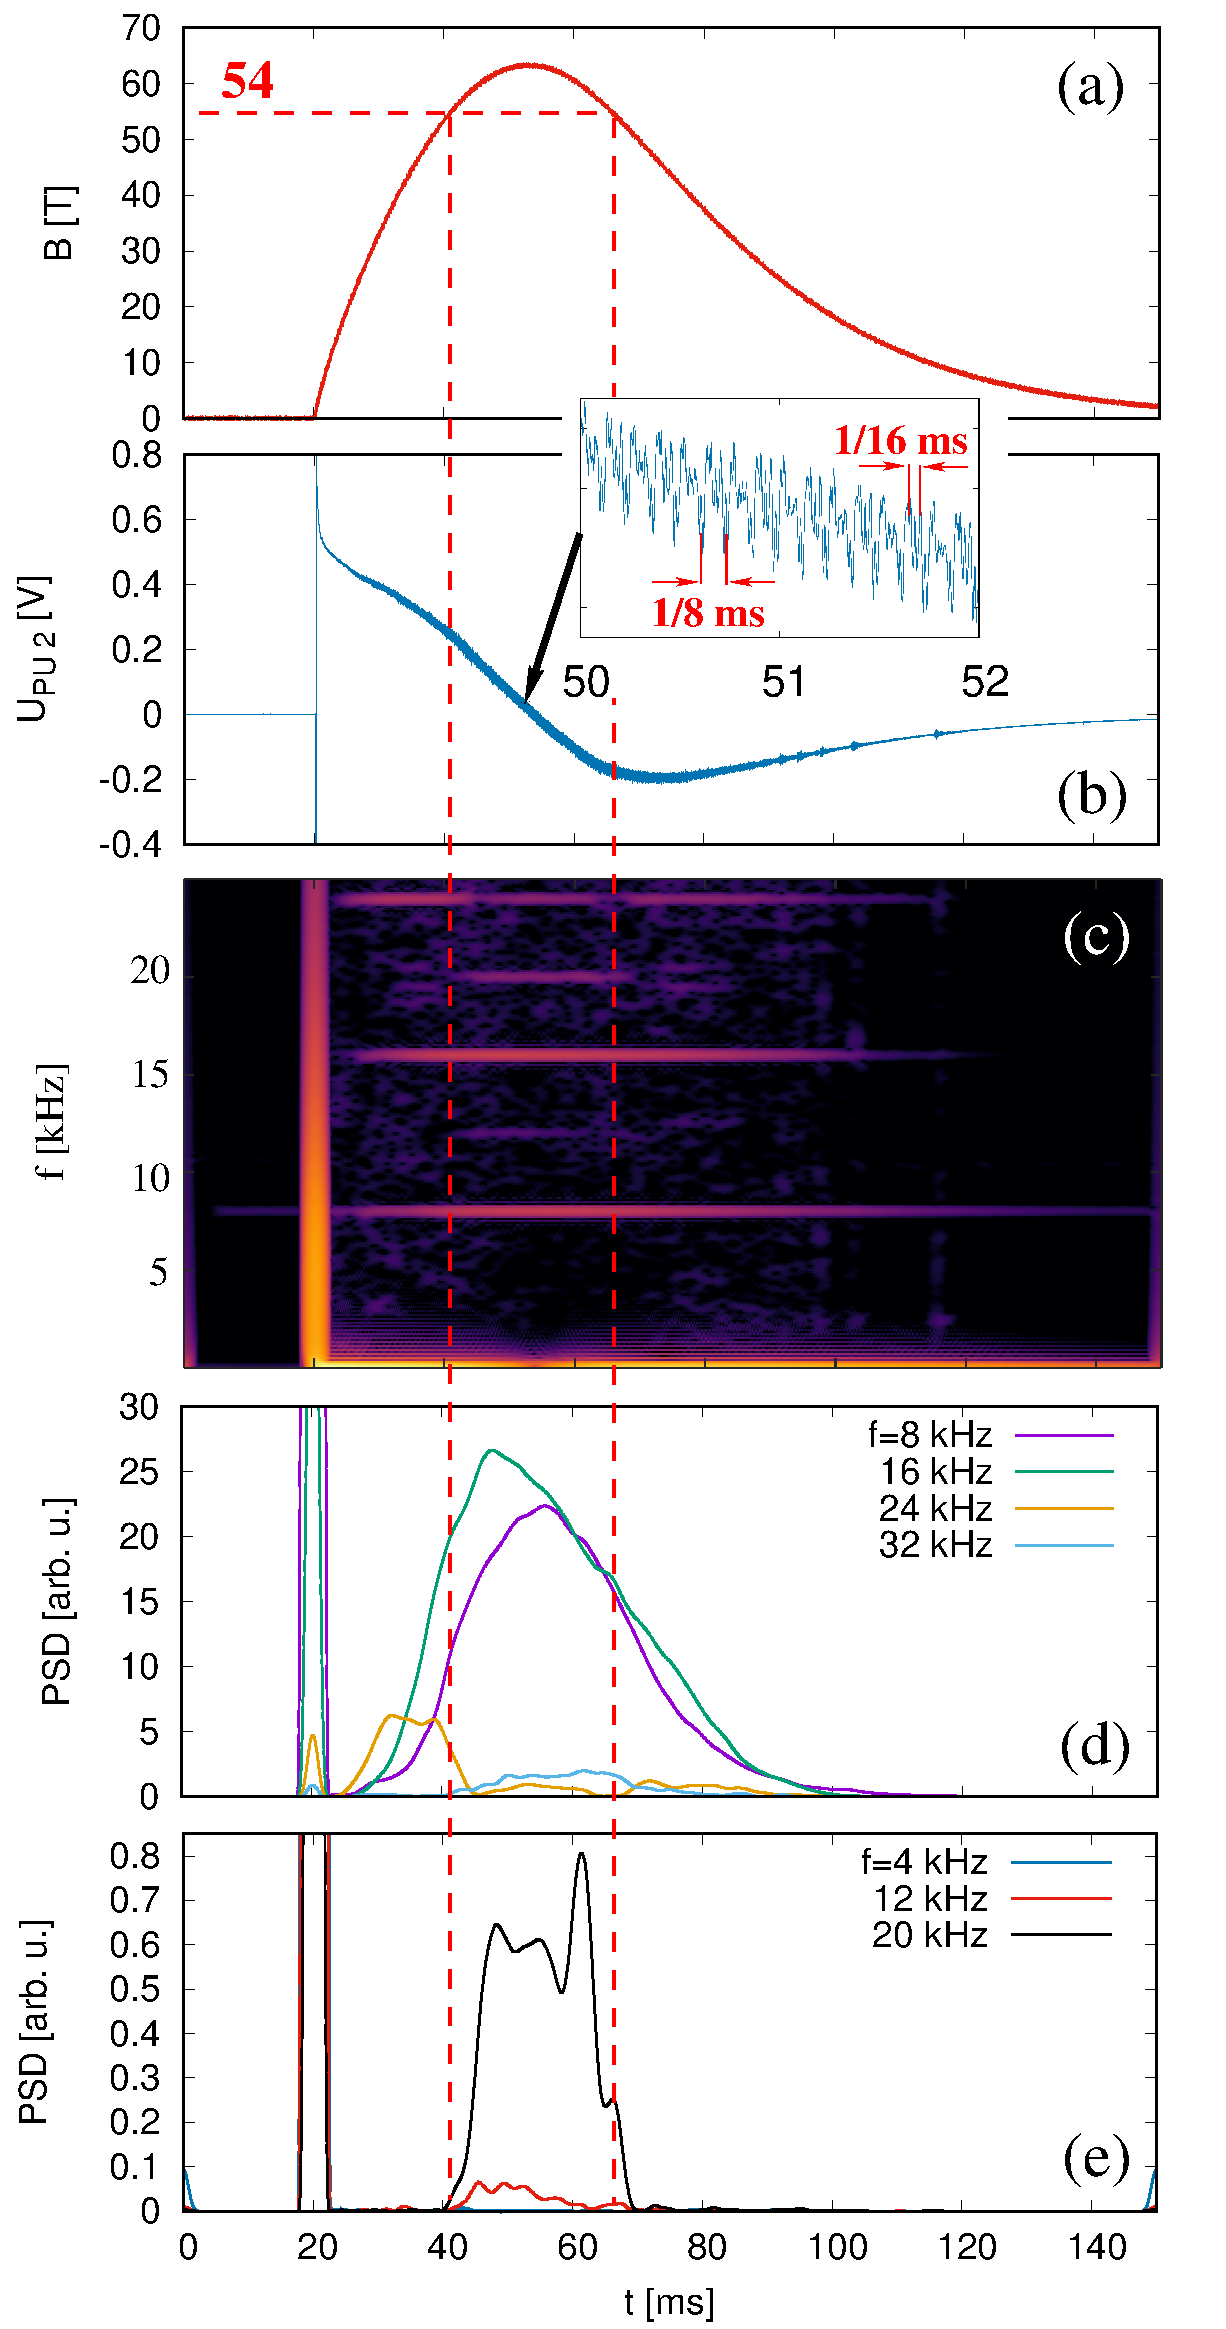
With Fig. 3, we turn now to the voltage measurements from the pick-up coil PU 2 that is located slightly above mid-height of the container (the signals of the other PU’s are similar). Despite a significant reduction due to the use of a compensation coil, the dominant part of this signal [Fig. 3(b)] is still coming from the time derivative of the pulsed magnetic field [note the similarity of this shape with the shape of the low-frequency part in Fig. 2(b)]. Superposed on that, we observe a high-frequency part comprising the usual 8 kHz, and a second-harmonic 16 kHz signal of approximately the same amplitude. How to explain that mixture? To start with, the voltage in the pick-up coils results from time derivatives of azimuthal currents which are typically produced by the induction effect of radial flow components with the axial field . That flow component, in turn, is intimately connected with radial and axial gradients of the pressure , and is, therefore, indicative of the presence of (fast and slow) magnetosonic waves. Hence, the appearance of the 16 kHz signal is a well-known consequence of the quadratic dependence of the pressure on the magnetic-field perturbation of the Alfvén wave, as already discussed for the gallium experiment of Iwai et al. Iwai2003 . As also observed in Iwai2003 , the original driving frequency (8 kHz in our case) is still present, and both frequencies have rather comparable amplitudes, as evidenced in Fig. 3(d). The third and fourth harmonics, however, are already much smaller.
Remarkably here is the nearly complete absence of any 4 kHz signal, and only very minor contributions from the higher kHz harmonics [note the significant differences of the PSD units between Figs. 3(d) and 3(e)]. This absence of any pressure related 4 kHz signal is in stark contrast to the quite significant share of this frequency band in the voltage measurements at T [Fig. 2(e)], which we attribute to the emergence of a new torsional Alfvén wave at the 54 T threshold related to .
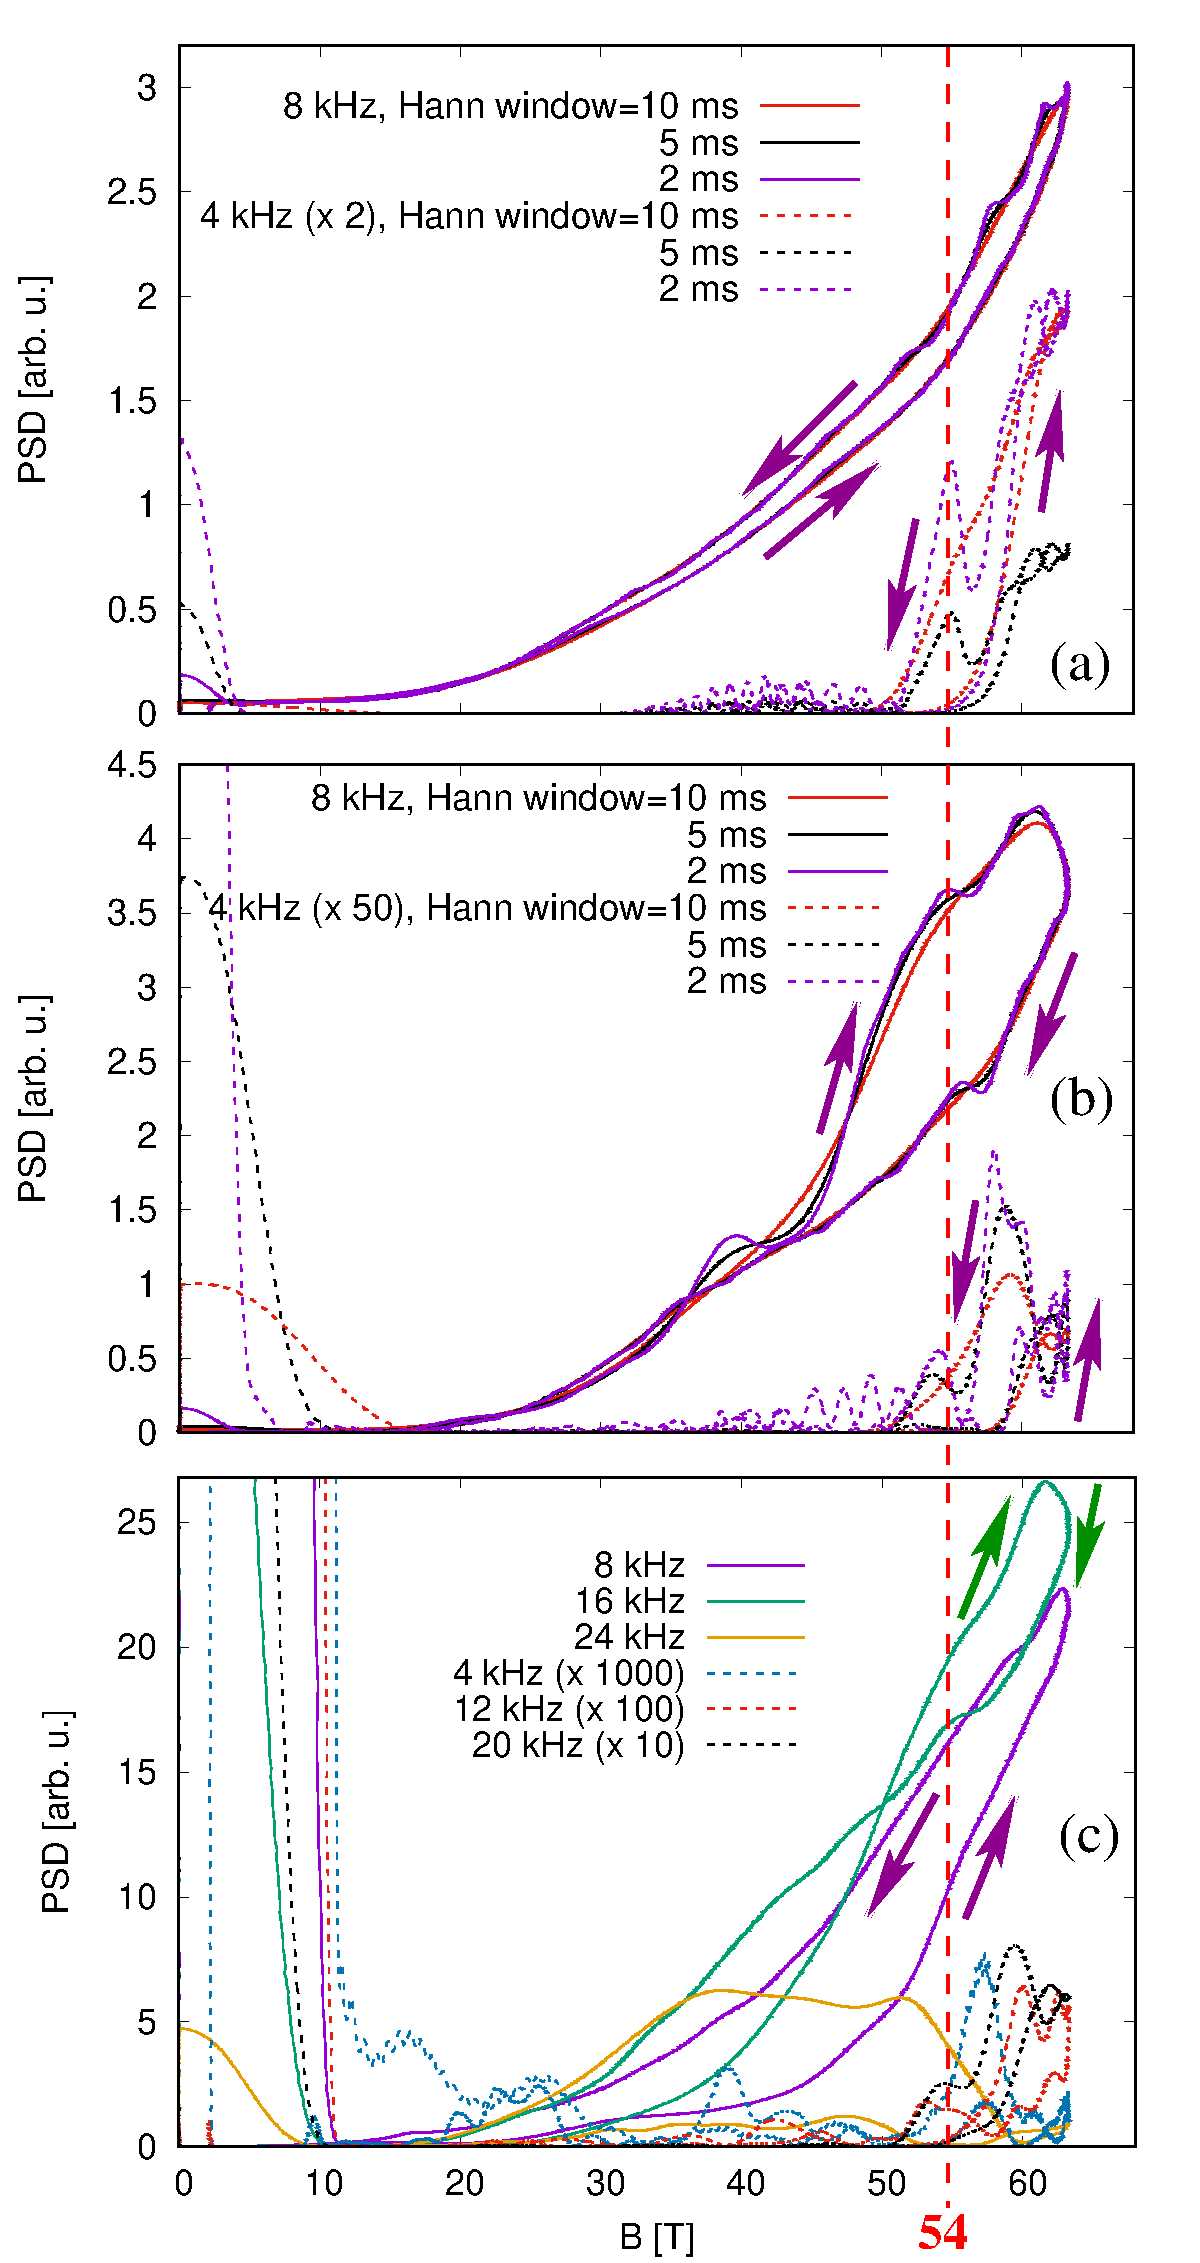
In Fig. 4, we translate those time series into corresponding magnetic-field dependencies, including both the increasing and decreasing branches. Based on the data from Fig. 2, Fig. 4(a) confirms, first, the expected quadratic dependence of the PSD of the driven 8 kHz mode (with only a slight difference between the increasing and the decreasing branch) and, second, a clear peak of the 4 kHz signal at 54 T coming from the decreasing branch, and another peak behind, coming from the increasing branch. Without proof, we assume that this asymmetry is due to the transient character of the experiment.
With Fig. 4b we add a further result from an electric potential measurement between the contacts PP 2 and PP 3. Basically, the underlying signal (not shown here) and the Gabor transform look quite similar to those presented in Fig. 2, except that the typical voltage is smaller by a factor 100 (this is due to the fact that the emf is mainly produced between the axis and the rim of the container, while PP 3 - PP 2 measures only some residual voltage difference in direction). We observe a similar behaviour as discussed before, with a mainly quadratic dependence of the 8 kHz signal on (with some stronger up-down asymmetry, however), and a steep increase of the 4 kHz signal at and beyond 54 T.
Figure 4(c) shows the PSD dependence on the magnetic field for the signal of the pick-up coil PU 2 from Fig. 3. Evidently the 8 and 16 kHz signals look quite similar, with some differences in the up-down relation which still remain to be understood. At any rate, the 4, 12, and 20 kHz curves are extremely small (note, in particular, the factor 1000 by which which the 4 kHz signal must be multiplied to become visible).
To the best of our knowledge, we have carried out the first systematic Alfvén wave experiment where the “magical” threshold plasma- unity has been crossed. In contrast to the many plasma experiments, which are usually carried out at small values of (but see Cekic1992 ; Okada2001 ; Flanagan2020 for exceptions), liquid metal experiments were up to present limited to the region with , or . Using liquid rubidium in the high pulsed fields available at the HLD, we were able to exceed this threshold by some 17 percent. Our main observation was the sudden appearance (at ) of a period-doubled 4 kHz mode, which we interpret as a new torsional Alfvén wave arising by parametric resonance, or swing excitation Zaqarashvili2006 , from the usual 8 kHz magnetosonic wave. Admittedly, the first realization of this astrophysically important phenomenon under strongly transient experimental conditions demands for substantial numerical support. Complementary experiments with longer pulses would also be desirable for a better understanding of the observed time asymmetries.
We acknowledge support of the HLD at HZDR, a member of EMFL, and the DFG through the Würzburg-Dresden Cluster of Excellence on Complexity and Topology in Quantum Matter - ct.qmat (EXC 2147, Project No. 390858490). F.S. acknowledges further support by the European Research Council (ERC) under the European Union’s Horizon 2020 Research and Innovation Programme (Grant No. 787544). We thank Jürgen Hüller for his assistance in the adventurous filling procedure of the rubidium container, and Frank Arnold, Carsten Putzke, Karsten Schulz and Marc Uhlarz for their help in preparing and carrying out the experiment.
References
- (1) H. Alfvén, Nature 150, 405 (1942).
- (2) S. Tomczyk, S. W. McIntosh, S. L. Keil, P. G. Judge, T. Schad, T. H. Seeley, and J. Edmondson, Science 317, 1192 (2007).
- (3) J. C. Kasper et al., Nature 576, 228 (2019).
- (4) R. L. Lysak, C. L. Waters, and M. D. Sciffer, J. Geophys. Res.: Space Phys. 118, 1514 (2013).
- (5) A. Fasoli et al., Nucl. Fusion 35, 1485 (1995).
- (6) T. Intrator et al., Phys. Plasmas 2, 2263 (1995).
- (7) S. A. Balbus and J. F. Hawley, Astrophys. J. 376, 214 (1991).
- (8) F. Stefani, T. Gundrum, G. Gerbeth, G. Rüdiger, M. Schultz, J. Szklarski, and R. Hollerbach, Phys. Rev. Lett. 97, 184502 (2006).
- (9) N. Gillet, D. Jault, E. Canet, and A. Fournier, Nature 465, 74 (2010).
- (10) S. Lundquist, Nature 164, 146 (1949).
- (11) B. Lehnert, Phys. Rev. 94, 815 (1954).
- (12) A. Jameson, J. Fluid Mech. 19, 513 (1964).
- (13) W. F. Druyvesteyn, C. A. A. J. Greebe, A. J. Smets, and R. Ruyg, Phys. Lett. 27A, 301 (1968).
- (14) K. Iwai, K, Shinya, K. Takashi, and R. Moreau, Magnetohydrodynamics 39, 245 (2003).
- (15) W. Gekelman, J. Geophys. Res., 104, 14417 (1999).
- (16) W.E. Amatucci, Radio Sci. Bull. 319, 32 (2006).
- (17) T. Alboussiere, P. Cardin, F. Debray, P. La Rizza, J.-P. Masson, F. Plunian, A. Ribeiro, and D. Schmitt, Phys. Fluids 23, 096601 (2011).
- (18) Z. Tigrine, H.-C. Nataf, N. Schaeffer, Ph. Cardin, and F. Plunian, Geophys. J. Int. 219, S83 (2019).
- (19) J. Wosnitza et al., J. Magn. Magn. Mat. 310 2728 (2007).
- (20) S. Zherlitsyn, B. Wustmann, T. Herrmannsdörfer, and J. Wosnitza, IEEE Trans. Appl. Supercond. 22, 4300603 (2012).
- (21) T. V. Zaqarashvili, R. Oliver, and J. L. Ballester, Astron. Astrophys 456, L13 (2006).
- (22) A. Warmuth, G. Mann, Astron. Astrophys. 435 1123 (2005).
- (23) J. V. Hollweg, S. Jackson, and D. Galloway, Solar Phys. 75, 35 (1980).
- (24) T. J. Bogdan et al., Astrophys. J. 599, 626 (2003).
- (25) T. V. Zaqarashvili and B. Roberts, Astron. Astrophys. 452, 1053 (2006).
- (26) https://octave.sourceforge.io/ltfat/index.html
- (27) M. Cekic, B. A. Nelson, and F. L. Ribe, Phys. Plasmas 4, 392 (1992).
- (28) S. Okada et al., Nucl. Fusion 41, 625 (2001).
- (29) K. Flanagan, J. Milhone, D. Endrizzi, J. Olson, E. E. Peterson, R. Sassell, and C. B. Forest, Phys. Rev. Lett. 125, 135001 (2020).