Dynamics and memory of boundary stresses in discontinuous shear thickening suspensions during oscillatory shear
Abstract
We report direct measurements of spatially resolved surface stresses of a dense suspension during large amplitude oscillatory shear (LAOS) in the discontinuous shear thickening regime using boundary stress microscopy. Consistent with previous studies, bulk rheology shows a dramatic increase in the complex viscosity above a frequency-dependent critical strain. We find that the viscosity increase is coincident with that appearance of large heterogeneous boundary stresses, indicative of the formation of transient solid-like phases (SLPs) on spatial scales large compared to the particle size. The critical strain for the appearance of SLPs is largely determined by the peak oscillatory stress, which depends on the peak shear rate and the frequency-dependent suspension viscosity. The SLPs dissipate and reform on each cycle, with a spatial pattern that is highly variable at low frequencies but remarkably persistent at the highest frequency measured ( rad/sec).
I Introduction
Dense colloidal and granular suspensions display a variety of non-Newtonian behaviors, including a dramatic increase in viscosity, , above a material dependent critical shear stress (reviewed in Morris (2020)). When the particle volume fraction is sufficiently high, suspensions can exhibit discontinuous shear thickening (DST), where the viscosity as a function of shear rate, measured during steady shear, increases abruptly by more than an order of magnitude.
While shear thickening can arise from the formation of particle clusters due to hydrodynamic forces Wagner and Brady (2009); Melrose et al. (1996); Bossis and Brady (1989); Gurnon and Wagner (2015), solid contact and friction, together with the short-range repulsive force between particles, are thought to be necessary for DST Wyart and Cates (2014); Seto et al. (2013); Mari et al. (2014, 2015). Wyart and Cates (WC) introduced a phenomenological model incorporating these elements, and a variety of results from experiments and simulations provide support for this model and its extensions Morris (2020), although many questions remain.
One set of questions concerns the spatiotemporal dynamics of DST. Suspensions subjected to constant shear stress or stain rate display a variety of complex fluctuations, including temporal fluctuations in bulk viscosity, and visual observations suggest some associated spatial heterogeneities Lootens et al. (2005); Guy et al. (2015); Saint-Michel et al. (2018); Park et al. (2019). We recently reported direct measurements of spatially resolved surface stresses over the entire surface of a dense suspension during DST under steady shear using boundary stress microscopy (BSM, Rathee et al. (2017); Arevalo et al. (2015)). We found that large fluctuations in the bulk rheological response at the onset of DST are the result of localized transitions to a state with very high stress, consistent with a fully jammed solid that makes direct contact with the shearing boundaries Rathee et al. (2020). Here, we report the application of BSM to a suspension undergoing DST during Large Amplitude Oscillatory Shear (LAOS).
LAOS is a powerful tool for characterizing the nonlinear response of complex fluids and soft solids Hyun et al. (2011), but its application to shear thickening suspensions has been somewhat limited Morris (2020). Studies of athermal (granular) suspensions have revealed that a strain amplitude of order is required to initiate particle contact and the attendant nonlinear increase in viscosity Ness et al. (2017), and that a transition from reversible to chaotic particle trajectories is associated with yeilding of the jammed phase, again at strain amplitudes below unity Galloway et al. (2020). Studies at higher strain amplitudes revealed that the appearance of strong shear thickening is primarily driven by the peak strain rate, rather than the peak strain Khandavalli and Rothstein (2015). LAOS in combination with rapid shear reversal or shear cessation has been used to determine how different contributions to the overall stress evolve over an oscillation cycle Ong et al. (2020). Using small angle x-ray scattering, Lee et al. Lee et al. (2018) revealed that, under certain conditions, a two-step thickening process can occur, with a strain-controlled order-to-disorder transition leading to moderate shear thickening, followed by a strain rate or stress controlled transition to a dramatically increased viscosity. For the sample studied here, nearly monodisperse Brownian spheres at a concentration that produces DST, bulk rheology during LAOS shows two step thickening, consistent with Lee et al. (2018). Using BSM, we show the the boundary stresses are uniform in the low viscosity and first thickened regime, but become strongly nonuniform coincident with the more dramatic shear thickening regime. At low frequencies, regions of very high stress appear on each cycle at a shear rate that is comparable to the rate required to induce DST in steady shear, with spatiotemporal dynamics that are consistent with the picture derived from our BSM measurement under steady shear Rathee et al. (2020): localized jammed solid like phases (SLPs), spanning the rheometer gap, form above a critical shear rate, but are immediately fractured, producing two separate SLPs that propagate in opposite directions, one that remains in contact with the bottom boundary and the other remains in contact with the top. At higher frequencies the shear rate required for the onset of SLPs increases, an effect that is attributable to a frequency-dependent decrease in viscosity, likely arising from particle ordering. The spatial pattern of the large stresses is highly variable at low frequencies but remarkably persist at high frequencies, indicating that the suspension retains memory of the configurations responsible for the SLPs throughout the oscillation cycle.
II Materials and methods
Colloidal suspensions were formulated with silica spheres of radius = 0.75 m (Angstorm, Inc.) suspended in a glycerol water mixture (0.8 glycerol volume fraction). The particle volume fraction was calculated from the mass used to prepare the suspension. Rheological measurements were performed on a stress-controlled rheometer (Anton Paar MCR 301) mounted on an inverted confocal (Leica SP5) microscope Dutta et al. (2013) using a cone of diameter 25 mm. Elastic substrates were deposited on glass cover slides of 40 mm diameter by spin coating PDMS (Sylgard 184; Dow Corning) and a curing agent with elastic modulus 15 kPa Rathee et al. (2020). Beads of 10 m were covalantly attached to the PDMS and an area of 5.6 mm2 was imaged, centered approximately 3 mm from the outer edge of the rheometer tool. Deformation fields were determined with particle image velocimetry (PIV) in ImageJ Tseng et al. (2012). The surface stresses at the interface are calculated using an extended traction force technique and codes given in ref. Style et al. (2014). Taking the component of the surface stress in the flow (velocity) direction, we obtain the scalar field , representing the spatiotemporally varying surface stress. The overall accuracy of the BSM is limited by uncertainty in the modulus of the PDMS layer Rathee et al. (2020), and measurement noise arises from the resolution of the PIV imaging and residual vibrations in the imaging system.
Oscillatory shear measurements were performed by applying a sinusoidal shear strain, , where is the strain amplitude and is the angular frequency. For a small strain amplitudes the stress response is given by , where is the phase lag. At larger strains where the response is non-linear, higher harmonics contribute to the stress response which can be expressed as . The elastic and loss modulii and the complex viscosity are calculated from the amplitude and phase of the fundamental, , , . The graphical representation of stress versus applied strain or strain rate is knows as a Lissajous figure. During LAOS measurements, the stress vs. strain data reported by the rheometer represent averages over four consecutive cycles.
III Large Amplitude Oscillatory Shear (LAOS) Rheology
The flow curve (viscosity measured during steady shear) for , shown in Fig. 1 (stars), exhibits the behavior typical of suspensions undergoing DST, with a region of shear thinning at low applied shear, followed by an abrupt increase in viscosity at a critical shear rate 20 s-1. The open diamonds in Fig. 1 show the complex viscosity determined by applying an oscillatory strain at fixed rad/sec and increasing . The oscillatory rheology reveals a two step shear thickening, where during first phase (peak shear rates s-1, corresponding to strain amplitudes ) the increase in the complex viscosity is gradual, until the peak shear rate approaches for DST, at which point increases abruptly. Similar behavior was observed in LAOS of suspensions of monodisperse silica spheres by Lee et al, Lee et al. (2018), where simultaneous small angle x-ray scattering revealed that the transition to the first shear thickening regime is associated with a strain-controlled order-to-disorder transition that disrupts the ordering-induced shear thinning that is observed at smaller amplitudes. This first shear thickening phase is not observed in steady shear, presumably because the oscillatory shear generates more substantial ordering, and therefore a lower viscosity, than steady shear. The second, more abrupt thickening transition occurs in both steady shear and LAOS, at roughly the same shear rate (Fig. 1) and peak shear stress.
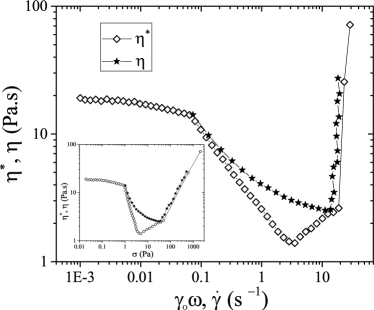
Figure 2A shows the complex viscosity data from Fig. 1 compared with and from the same measurement. At low frequencies, the elastic response dominates the viscous, with a crossover for , and both components show the same shear thinning and two stage shear thickening behavior seen in the viscosity. Note that the transition from the linear regime, with a roughly constant modulus at very low amplitudes, to shear thinning at is reminiscent of a yield stress behavior.
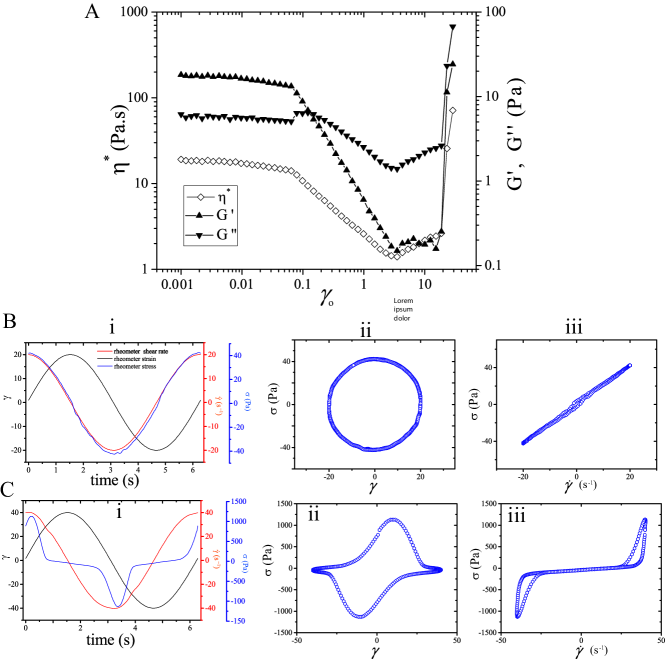
The data in Figure 2A include only the amplitude of the fundamental component of the stress response, and as such provide limited information about the nonlinear response. Additional insight can be obtained from investigating the stress vs. time (Fig. 2B,C ) and the stress vs. strain (Fig. 2B,C ) or strain rate (Fig. 2B,C ), known as Lissajous Figures. In the linear regime (Small Amplitude Oscillatory Shear, or SAOS), the stress response is harmonic, and because it is dominated the viscous component, closely tracks the sinusoidal applied strain rate (Fig. 2B), with a linear, closed viscous Lissajous Figure (Fig. 2B), indicating that the stress is everywhere nearly proportional to the strain rate. The figures look roughly similar throughout the shear thinning and first shear thickening regimes (, data not shown) because that the stress signal is primarily harmonic, indicating that the viscosity of the suspension is not changing during the oscillation cycle, even though it changes with oscillation amplitude. This suggests that the oscillation-induced ordering that underlies the non-Newtonian behavior of the complex viscosity in this regime persists throughout the oscillation cycle.
The situation changes dramatically at higher strain amplitudes, where the stress response becomes strongly non-harmonic. This can be seen clearly in Fig. 2C, which shows the stress vs time at and 40. As in earlier studies (Khandavalli and Rothstein (2015); Ness et al. (2017), a dramatic increase in stress is observed when the shear rate exceeds the value for DST in steady shear, as can be seen most clearly in the viscous Lissajous Figure ( vs. , Fig. Fig. 2C). As shown below, this abrupt increase in stress is a signature of the onset of large stress heterogeneities.
IV Boundary stress microscopy
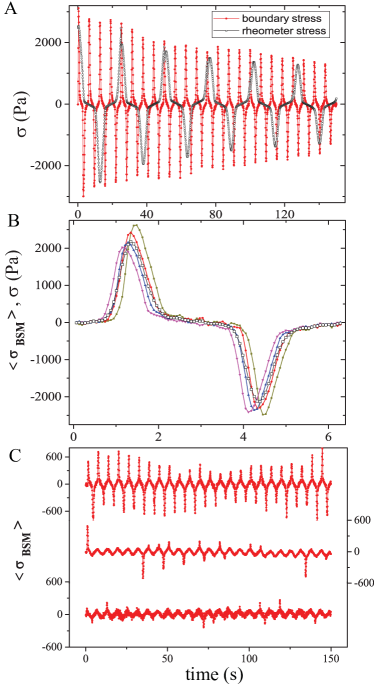
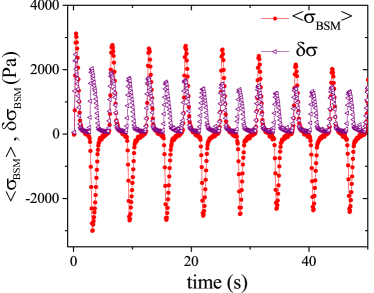
Boundary Stress Microscopy provides a direct readout of the spatially resolved stress at the bottom boundary of the suspension. We have shown that the net torque calculated from this stress matches the stress inferred from the torque on the rheometer tool (the reported rheomter stress) during steady shear when the entire sample surface is imaged in BSM Rathee et al. (2020). A direct comparison is complicated in this case in part because only a portion of the sample is imaged (see Methods), but also because in LAOS mode the Anton-Paar rheometer reports stress vs time averaged over 4 cycles. In Fig. 3A we directly compare the average stress in each BSM image, , with the stress vs. time from the rheometer. Unlike the rheometer output, BSM provides independent time-resolved measurements for each cycle. Note that both the rheometer and BSM show a gradual reduction in peak stress over the course of the measurement. Slow drifts like this are often seen in long experiments and can arise from a variety of sources including particle settling or migration, or slight mixing of the suspension and the surrounding oil at the boundary of the sample.
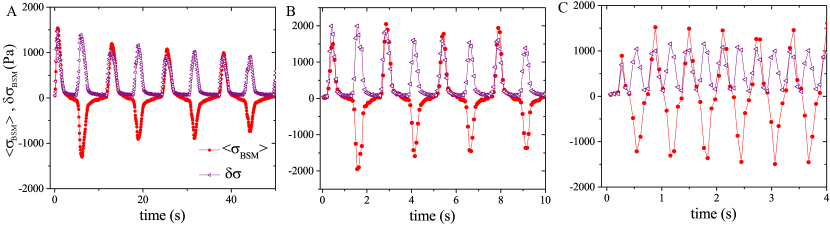
Figure 3B shows for four consecutive cycles, compared to the stress vs. time reported by the rheometer for those same cycles. The data acquisition for BSM is not synchronized with the rheometer, so the timing for each cycle is approximate, but overall matches the rheometer stress quite well. Fig. 3C shows the evolution of the dramatic shear thickening, from appearing only on a few cycles at to appearing on every cycle at
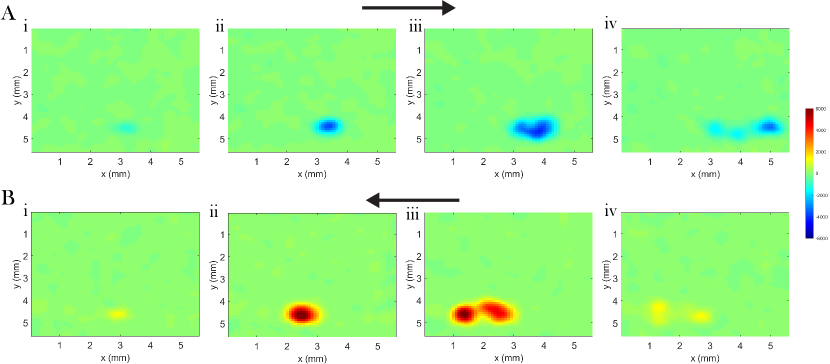
The real power of BSM, however, lies in its ability to reveal spatiotemporal dynamics of boundary stresses. Figure 4 shows a series of images of the spatial distribution of boundary stresses during one cycle of the run shown in Fig. 3C for (see also supplementary movie SM1 SM_ ). During the phase of the cycle where the shear rate is low (A,B ), the boundary stress is low and spatially uniform, to within the resolution of the measurement. When the shear rate gets large enough, however, localized regions of high stress appear () and then bifurcate (), and finally disappear as the shear rate drops (). It is clear from the time evolution (see SM1) that one of the bifurcated regions stays fixed, while the other region propagates in the shear direction. The behavior is strikingly similar to the dynamics we observed under steady shear close to the critical shear rate, where BSM revealed the localized transitions to fully jammed solid-like phases (SLPs) Rathee et al. (2020). After formation, the SLP rapidly fractures, producing two separate SLPs, one that is nearly fixed in space and presumably in contact with the bottom plate, and the other that appears to be moving with the top plate. We surmise that the same dynamic occurs in LAOS, on each cycle when the shear rate exceeds the critical shear rate for DST. We note that the size of the high stress regions is on the order of a few hundred microns, much larger than the particle size but of the same order of magnitude as the gap between the rheometer plates (m where the BSM is measured).
At higher strain amplitudes, the high stress regions cover more of the sample boundary and live longer, presumably because the system spends more time above . Figure 5 shows a series of images taken during one cycle of a measurement with and = 1 (see also supplementary movie SM2). During the phases of the cycle where the shear rate is low (Fig. 5 A, B) the boundary stress is uniform and low. As the shear rate increases, localized regions of high stress appear and bifurcate (Fig. 5 A, B), as at lower strain amplitudes. As the shear rate increases, these high stress regions grow in extent and new regions appear (Fig. 5 A, B), and then finally shrink and disappear as the shear rate decreases (Fig. 5 A, B).

The spatial heterogeneity or roughness of the boundary stress can be quantified by calculating the root mean square stress deviation in each image, , calculated by subtracting from each pixel, and computing the rms of the resulting stress variation for each frame. Figure 6 shows a plot of and vs. time for = 50 and = 1 rad/s. For large stresses, where exceeds , the roughness closely tracks the absolute value of the mean stress, while it remains close to zero when the mean stress is small. Thus the roughness provides a very clean measure of the presence of local high viscosity or jammed phases. It is evident from Fig. 6 that the roughness grows rapidly but decays slowly, similar to our previous measurements of high stress fluctuations at constant shear rate Rathee et al. (2020).
We observe a similar behavior at higher , with heterogeneous high stresses appearing when . Figure 7 shows representative roughness data at (A), 2.5 (B), and 10 (C) rad/sec, at strain amplitudes such that the peak shear rate is large enough to produce heterogeneous stresses on every cycle. At all frequencies the regions of large heterogeneous stresses are separated by periods when the stress is small and uniform. Those periods are barely resolvable at the = 10 rad/s (Fig. 7C), because our imaging speed (28 frames/sec) provides only about 5 frames per cycle. Note that our imaging is performed by laser scanning confocal microscopy, and the images shown are acquired from top to bottom, with acquisition of the bottom of one frame almost immediately followed by acquisition of the top of the next frame. Careful inspection of the movie from = 10 rad/s (Movie SM3) reveals a noticeable phase lag between the top and bottom the frames, but every cycle shows some regions with uniform low stress.
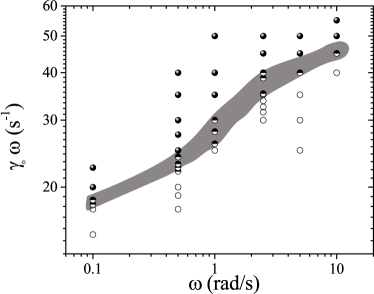
While the evolution from of the stress field from uniform low stress to heterogeneous high stress does not change as the frequency is increased, we do observe two notable changes. One is that peak shear rate required to generate heterogeneous high stresses increases with frequency. Figure 8 shows a Pipkin diagram, with open circles marking conditions that show only uniform low stress, filled circles indicate conditions where significant roughness is measured on every cycle, and the half-filled circles are conditions that produced high stress regions on some but not all cycles (e.g the regime shown in Fig. 3C, rad/sec ). The crossover region (shading in Fig. 8) increases from sec-1 at =0.1 (approximately equal to measured by steady shear) to sec-1 at = 10 rad/s. Note that the strain amplitude in the crossover region decreases from 170 at =0.1 rad/s to 4.5 at = 10 rad/s. As discussed below, the frequency dependence of the shear rate required to initiate heterogeneous stresses is consistent with a frequency independent critical shear stress, and a frequency dependence to the viscosity before thickening is observed.
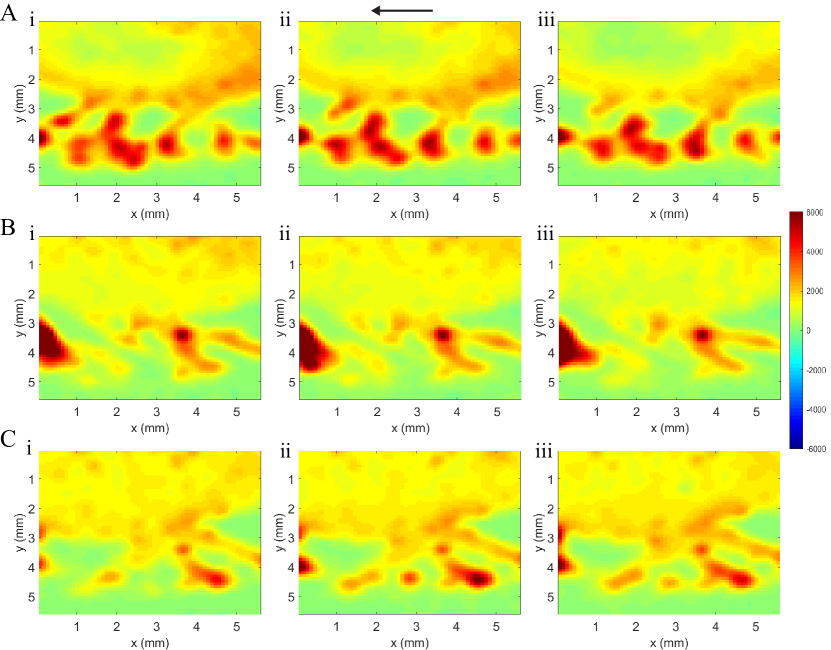
The other notable change in the spatiotemporal dynamics of the boundary stresses as frequency increases is an increase in the persistence of the pattern of stresses on successive cycles. This is visually evident when comparing the movies from and 10 rad/s (SM2 and SM3, respectively SM_ ), both with peak shear rates substantially above . Figure 9A shows the pattern of boundary stresses measured near the peak shear rate on three consecutive cycles at the beginning of a LAOS measurement lasting approximately 100 cycles (from movie SM3 SM_ ). The pattern is disordered, but the change from one cycle to the next is quite small, despite the fact that the cycles are separated by periods when the shear rate is low and no high stresses are visible. Figure 9B and 9C show stress patterns from three consecutive cycles at the middle and end, respectively, of the LAOS run. The patterns evolve over the course of many cycles, but consistently show a high degree of persistence between cycles. The implications of this observation are discussed below.
V Discussion and Conclusions
The results reported here are generally consistent with previous investigations of shear thickening colloidal suspensions during LAOS Khandavalli and Rothstein (2015); Lee et al. (2018) and our observations of boundary stresses in suspensions undergoing DST during steady shear Rathee et al. (2020): on each cycle, upon increasing shear rate, if and when the average stress exceeds a critical stress , large heterogenous boundary stresses appear in a manner consistent with the localized formation of fully jammed gap spanning solid like phases (SLPs) with a spatial extent in the flow-vorticity plane comparable to the rheometer gap. The imposed strain produces a rapid fracture of the SLPs, with pieces staying adhered to the top (moving) and bottom (stationary) boundaries. The SLPs and the associated large boundary stresses persist until the stress falls sufficiently below as a result of the decreasing imposed shear rate. As in steady shear, the onset of the large stress heterogeneity on each cycle is nearly instantaneous, while the decay is relatively gradual.
The frequency dependence of the minimum strain amplitude necessary to generate large stresses rules out a strong role for strain amplitude. For example, at rad/s, the onset occurs at a strain , whi1e it occurs at at rad/s and at rad/s (Fig. 8). The behavior of dense suspensions under oscillatory shear is sensitive to strain amplitudes for 1 Ackerson (1990); Ness et al. (2017); Galloway et al. (2020), however for the frequencies studied here strain amplitudes substantially larger than unity are required to reach . Similarly, the weak frequency dependence shown in Fig. 8 suggests that the Peclet number associated with the oscillatory period, , where is the particle diffusion coefficient and the radius, plays a minor role. Using the bare diffusion coefficient for the m radius particles suspended in 80:20 gycerol:water used here, ranges from at rad/s to at . Thus in the regimes studied here, DST always occurs at either very high or very high strain amplitude, so the regimes where Brownian motion has a significant impact on dense suspensions during LAOS, for example by enabling cage escape by Brownian motion Koumakis et al. (2013, 2016), are not encountered.
Consistent with previous results Lee et al. (2018), the transition to DST in LAOS for the suspension studied here is likely determined by , so the frequency dependence observed in Fig. 8 arises from a modest decrease in suspension viscosity as the oscillation frequency is increased, attributable to increased ordering of the nearly monodisperse particles Lee et al. (2018). Shear-induced ordering is common in dense monodisperse suspensions undergoing LAOS Ackerson (1990); Besseling et al. (2012), and can be quite complex, particularly for small amplitude oscillations. Ordering, both in the gradient direction (layering) and within the layers that form in the flow-vorticity plane, is sensitive to the boundary conditions, and a solid planar surface like that at the base of our rheometer can provide a nucleation site for crystals Shereda et al. (2010), and stabilize substantial layering many particle diameters away from the planar surface Ramaswamy et al. (2017); Pieper and Schmid (2016). The layering reduces the suspension viscosity, because the particles can flow past each other with reduced particle interactions, so the increased layering near the boundary will produce a local decrease in viscosity Zhao et al. (2016); Gallier et al. (2016), and a nonuniform shear profile. It is well established that bulk order-disorder transitions are not required for DST (reviewed in Morris (2020)), and in particular it was shown in Lee et al. (2018) that a small amount of polydispersity greatly reduces bulk ordering but doesn’t affect the rheology at and above . Layering that is confined to a region close to the suspension boundary, however, will not be detectable by bulk probes like the SAXS used in Lee et al. (2018), but may be robust to polydispersity and have a substantial impact on the dynamics of the instabilities that are observed during DST.
A striking feature revealed by BSM is the remarkable persistence of the stress patterns observed at high frequency (Fig. 9 and movie SM3 SM_ ), despite strain amplitudes , much larger than those that produce reversible trajectories Ness et al. (2017); Galloway et al. (2020) or hyperuniform structures Wilken et al. (2020) in non-Brownian suspensions. A recent study using shear reversal during LAOS revealed that residual structural anisotropy in the particle contact network provides a source of memory in dense suspensions Ong et al. (2020), but the patterns observed here are large compared to the size of the individual particles. We note that the SLPs observed in steady shear persist for very large strains ( 100) Rathee et al. (2020). We hypothesize that both the stability of SLPs in steady shear and the pattern persistence in LAOS arise from the presence of significant spatial variations in concentration, layering or other ordering over relatively large spatial scales.
In summary, the results presented hear show that dense suspensions that undergo discontinuous shear thickening during LAOS exhibit large spatial heterogeneous boundary stresses indicative of the cyclic formation and breakup of fully jammed solid-like phases. At high frequencies, memory of these heterogeneities persists despite large strain amplitudes. Uncovering the source of this memory will likely require measurements that can track spatial fluctuations in particle density, layering, and order during the onset of shear thickening.
VI Acknowledgements
The authors thank Emanuela Del Gado and Peter Olmsted for helpful discussions. This work was supported by the National Science Foundation (NSF) under Grant No. DMR-1809890. J.S.U. is supported, in part, by the Georgetown Interdisciplinary Chair in Science Fund.
References
- Morris (2020) J. F. Morris, Annual Review of Fluid Mechanics 52, 121 (2020), ISSN 0066-4189.
- Wagner and Brady (2009) N. J. Wagner and J. F. Brady, Phys. Today 62 (10), 27 (2009).
- Melrose et al. (1996) J. R. Melrose, J. H. van Vliet, and R. C. Ball, Phys.Rev. Lett. 77, 4660–4663 (1996).
- Bossis and Brady (1989) G. Bossis and J. Brady, J. Chem. Phys. 91, 1866–1874 (1989).
- Gurnon and Wagner (2015) A. K. Gurnon and N. J. Wagner, J. Fluid Mech. 769, 242 (2015).
- Wyart and Cates (2014) M. Wyart and M. E. Cates, Phys. Rev. Lett. 112, 098302 (2014).
- Seto et al. (2013) R. Seto, R. Mari, J. F. Morriss, and M. M. Denn, Phys. Rev. Lett. 111, 098302 (2013).
- Mari et al. (2014) R. Mari, R. Seto, J. Morris, and M. Denn, J. Rheol. 58, 1693–1724 (2014).
- Mari et al. (2015) R. Mari, R. Seto, J. Morris, and M. Denn, Proc. Natl. Acad. Sci. U.S.A. 112, 15326–15330 (2015).
- Lootens et al. (2005) D. Lootens, H. V. Damme, Y. Hemar, and P. Hebraud, Phys. Rev. Lett. 95, 268302 (2005).
- Guy et al. (2015) B. M. Guy, M. Hermes, and W. C. K. Poon, Phys. Rev. Lett. 115, 088304 (2015).
- Saint-Michel et al. (2018) B. Saint-Michel, T. Gibaud, and S. Manneville, Phys. Rev. X 8, 031006 (2018).
- Park et al. (2019) N. Park, V. Rathee, D. L. Blair, and J. C. Conrad, Phys. Rev. Lett. 122, 228003 (2019).
- Rathee et al. (2017) V. Rathee, D. L. Blair, and J. S. Urbach, Proceedings of the National Academy of Sciences 114, 8740 (2017), ISSN 0027-8424.
- Arevalo et al. (2015) R. C. Arevalo, P. Kumar, J. S. Urbach, and D. L. Blair, PLOS ONE 10, e0118021 (2015).
- Rathee et al. (2020) V. Rathee, D. L. Blair, and J. S. Urbach, Journal of Rheology 64, 299 (2020), ISSN 0148-6055.
- Hyun et al. (2011) K. Hyun, M. Wilhelm, C. O. Klein, K. S. Cho, J. G. Nam, K. H. Ahn, S. J. Lee, R. H. Ewoldt, and G. H. McKinley, Progress in Polymer Science 36, 1697 1753 (2011), ISSN 0079-6700.
- Ness et al. (2017) C. Ness, Z. Xing, and E. Eiser, Soft Matter 13, 3664 (2017), ISSN 1744-683X.
- Galloway et al. (2020) K. L. Galloway, D. J. Jerolmack, and P. E. Arratia, Soft Matter 16, 4373 (2020), ISSN 1744-683X.
- Khandavalli and Rothstein (2015) S. Khandavalli and J. P. Rothstein, Rheologica Acta 54, 601 (2015), ISSN 0035-4511.
- Ong et al. (2020) E. Y. X. Ong, M. Ramaswamy, R. Niu, N. Y. C. Lin, A. Shetty, R. N. Zia, G. H. McKinley, and I. Cohen, Journal of Rheology 64, 343 (2020), ISSN 0148-6055.
- Lee et al. (2018) J. Lee, Z. Jiang, J. Wang, A. R. Sandy, S. Narayanan, and X.-M. Lin, Physical Review Letters 120 (2018), ISSN 0031-9007.
- Dutta et al. (2013) S. K. Dutta, A. Mbi, R. C. Arevalo, and D. L. Blair, Rev Sci Instrum 84, 063702 (2013).
- Tseng et al. (2012) Q. Tseng, E. Duchemin-Pelletier, A. Deshiere, M. Balland, H. Guillou, O. Filhol, and M. Théry, Proc Natl Acad Sci U S A 109, 1506 (2012).
- Style et al. (2014) R. W. Style, R. Boltyanskiy, G. K. German, C. Hyland, C. W. MacMinn, A. F. Mertz, L. A. Wilen, Y. Xu, and E. R. Dufresne, Soft Matter 10, 4047 (2014), ISSN 1744-683X.
- (26) Supplementry Material, https://figshare.com/articles/media/oscillatory_shear_thickening/13146560.
- Ackerson (1990) B. J. Ackerson, Journal of Rheology 34, 553 (1990), ISSN 0148-6055.
- Koumakis et al. (2013) N. Koumakis, J. F. Brady, and G. Petekidis, Phys Rev Lett 110, 178301 (2013).
- Koumakis et al. (2016) N. Koumakis, J. F. Brady, and G. Petekidis, Journal of Non-Newtonian Fluid Mechanics 233, 119 (2016), ISSN 0377-0257, papers presented at the Rheology Symposium in honor of Prof. R. I. Tanner on the occasion of his 82nd birthday, in Vathi, Samos, Greece, URL http://www.sciencedirect.com/science/article/pii/S0377025716000367.
- Besseling et al. (2012) T. H. Besseling, M. Hermes, A. Fortini, M. Dijkstra, A. Imhof, and A. van Blaaderen, Soft Matter 8, 6931 (2012), URL https://doi.org/10.1039%2Fc2sm07156h.
- Shereda et al. (2010) L. T. Shereda, R. G. Larson, and M. J. Solomon, Phys Rev Lett 105, 228302 (2010).
- Ramaswamy et al. (2017) M. Ramaswamy, N. Y. C. Lin, B. D. Leahy, C. Ness, A. M. Fiore, J. W. Swan, and I. Cohen, Physical Review X 7, 041005 (2017).
- Pieper and Schmid (2016) S. Pieper and H.-J. Schmid, Journal of Non-Newtonian Fluid Mechanics 234, 1 (2016), ISSN 0377-0257.
- Zhao et al. (2016) Q. Zhao, C. E. Finlayson, D. R. E. Snoswell, A. Haines, C. Schäfer, P. Spahn, G. P. Hellmann, A. V. Petukhov, L. Herrmann, P. Burdet, et al., Nature Communications 7, 11661 (2016).
- Gallier et al. (2016) S. Gallier, E. Lemaire, L. Lobry, and F. Peters, Journal of Fluid Mechanics 799, 100 (2016), ISSN 0022-1120.
- Wilken et al. (2020) S. Wilken, R. E. Guerra, D. J. Pine, and P. M. Chaikin, Physical Review Letters 125, 148001 (2020), ISSN 0031-9007.
Supplementary Material
Supplementary Movie Captions
Supplementary Movie 1: Spatiotemporal dynamics of high stress events revealed by boundary stress measurements at frequency () = 1 and strain () = 26, for = 0.56. The total time elapsed is 150s having total 24 cycles. The corresponding snapshots are shown in Figure 4. The movie is played at 15 fps.
Supplementary Movie 2: Spatiotemporal dynamics of high stress events revealed by boundary stress measurements at frequency () = 1 and strain () = 50, for = 0.56. The total time elapsed is 150s having total 24 cycles. The corresponding snapshots are shown in Figure 5. The movie is played at 15 fps.
Supplementary Movie 3: Spatiotemporal dynamics of high stress events revealed by boundary stress measurements at frequency () = 10 and strain () = 9, for = 0.56. The total time elapsed is 90s having total 144 cycles. The corresponding snapshots are shown in Figure 9. The movie is played at 9 fps.