PoliWAM: An Exploration of a Large Scale Corpus of Political Discussions on WhatsApp Messenger
Abstract
WhatsApp Messenger is one of the most popular channels for spreading information with a current reach of more than 180 countries and 2 billion people. Its widespread usage has made it one of the most popular media for information propagation among the masses during any socially engaging event. In the recent past, several countries have witnessed its effectiveness and influence in political and social campaigns. We observe a high surge in information and propaganda flow during election campaigning. In this paper, we explore a high-quality large-scale user-generated dataset curated from WhatsApp comprising of 281 groups, 31,078 unique users, and 223,404 messages shared before, during, and after the Indian General Elections 2019, encompassing all major Indian political parties and leaders. In addition to the raw noisy user-generated data, we present a fine-grained annotated dataset of 3,848 messages that will be useful to understand the various dimensions of WhatsApp political campaigning. We present several complementary insights into the investigative and sensational news stories from the same period. Exploratory data analysis and experiments showcase several exciting results and future research opportunities. To facilitate reproducible research, we make the anonymized datasets available in the public domain.
1 Introduction
In the last decade, the majority of the political parties around the world are heavily spending on social media engagement platforms like Facebook, Twitter, Quora, WhatsApp, and Sharechat for fast and secure information spread. WhatsApp Messenger (hereafter ‘WAM’) is highly prevalent in 180 countries with installation over 90% of devices Bobrov (2018). WAM allows users to send instant messages, photos, videos, and voice messages in addition to voice and video calls over a secure end-to-end encryption channel. However, data curation from WAM remains a challenging task owing to privacy concerns, stringent encryption strategies, and system requirements.
WAM as Political Propaganda Tool: Several investigative journalism stories Tech (2018); Conversation (2018); Indian (2019) suggest ever-increasing global penetration of WAM-based political propaganda and the resultant mass polarization effects. India, the second-most-populous country with 1.3 billion population, has witnessed similar trends News (2018); Uttam (2018) during the past two General Elections Ruble (2014). WAM has emerged as a primary leader for delivery for political messaging with 95% of Android devices in India having WAM installation and maintaining a 75% daily active users percentage Bobrov (2018). For the first time, complementing the existing investigative journalism stories, we present a scientific study to understand the WAM messaging patterns and spread in the political scenario.
WAM Data Curation: To adhere to the WAM’s privacy policy Garimella and Tyson (2018), we consider only WAM public groups where users willingly share messages with known and unknown people. The biggest challenge with restricting to public groups is a large number of fake and dubious groups and the unavailability of a standard in-app filter functionality to identify such groups. To the best of our information, none of the previous works on WAM data curation have discussed any methodologies for filtering irrelevant groups. One of the earliest works on WAM dataset curation Garimella and Tyson (2018) considers a list of all WAM public groups available online. We claim that due to multilingualism coupled with code-mixing and multi-modal metadata, the genuine group identification problem is non-trivial. We present a novel manual group filtering strategy to filter fake and dubious groups by leveraging group metadata, i.e., group name, display picture, and the description. Owing to the user’s privacy in the WAM groups, we release the anonymized dataset111https://zenodo.org/record/4115660#.YUSln54zZQI. In addition, we are also releasing a fine-grained annotated dataset of 3,848 messages (see Section 3.2) for future research opportunities. The annotated dataset contains interesting fine-grained labels in four categories i.e., malicious activity, political orientation, political inclination, and message language.
Our Contributions: The main contributions are:
-
•
We present a novel WAM group filtering strategy leveraging the group’s metadata to filter the fake and dubious groups.
-
•
We analyze a total of 281 public groups distributed among 26 political parties, including all the seven national political parties.
-
•
In addition to the original anonymized dataset with 223,403 messages and 31,078 unique WAM users, we also release a publicly available fine-grained annotated dataset of 3,848 WAM messages with language, malicious activity, political orientation, and political inclination as labels.
-
•
We present several interesting insights from the analysis of users and the message content. We establish several correlations with the claims and reports of news media and survey articles from the same period.
-
•
We draw several interesting insights on co-occurrences of the political entities (leaders and parties) and social factors (agendas, religions, castes, and languages/ethnicity) from the linguistic perspective.
2 Related Work
People engage in various social media platforms such as Twitter, Facebook, etc., to discuss socially relevant topics such as politics. We witness a large volume of research focused on Twitter-based political discussions due to the easier availability of data and the large-scale involvement of the masses. For example, Bovet and Makse (2019) conducted a large-scale analysis of fake news propagation on Twitter during the 2016 U.S. presidential elections. Tumasjan et al. (2010) studied the usage of Twitter as a tool for political deliberation and election forecasting. They also used Twitter as a means to understand the political sentiment of the politicians and parties in the election campaigning. Conover et al. (2011) presented a study of the interaction between the network of users of different ideologies. They used Twitter as a medium to understand the political communication network. Colleoni et al. (2014) studied the structure of political homophily between different political groups on Twitter to understand the public sphere and echo chamber effect.
In contrast to Twitter-based studies, Vitak et al. (2011) studied student’s involvement in the political discussions on Facebook for the 2008 U.S. presidential election. Several studies looked at different offline modes of political discussions as well. For example, Ansolabehere et al. (2006) explored the effect of newspaper endorsement on the shift of vote margin. The largest circulation newspaper during the period of 1940–2002 is part of this experiment for the various U.S. elections. Barrett and Barrington (2005) conducted a study to understand the visual perception of the voter by the candidate’s photograph in the newspaper. Wang et al. (2015) proposed an innovative methodology on non-representative polls to forecast elections in contrast to the survey methods. They experiment with the data from the Xbox gaming platform for the 2012 U.S. presidential election. Ferreira et al. (2018) discuss the involvement of the ideological communities over 15 years. They used data on the public voting of Brazil and the U.S and study the polarization in the communities. Caetano et al. (2018) presented an analysis and characterization of WAM messages at three different layers.
Recently, we observe a growing interest in understanding the information flow on WAM with political discussions in focus Resende et al. (2019b, a); Pang and Woo (2020); Vermeer et al. (2021); Velasquez et al. (2021); Garimella and Eckles (2020); Saha et al. (2021); Javed et al. (2020); Yadav et al. (2020). In contrast to the existing works, we present a novel manual filtering strategy (see Section 3) to identify the potential WAM groups. Our group identification strategy results in a high-quality dataset with less dubious groups. Also, to understand the various user and message characteristics, we present a fine-grained annotated dataset of 3,848 messages.
3 Dataset
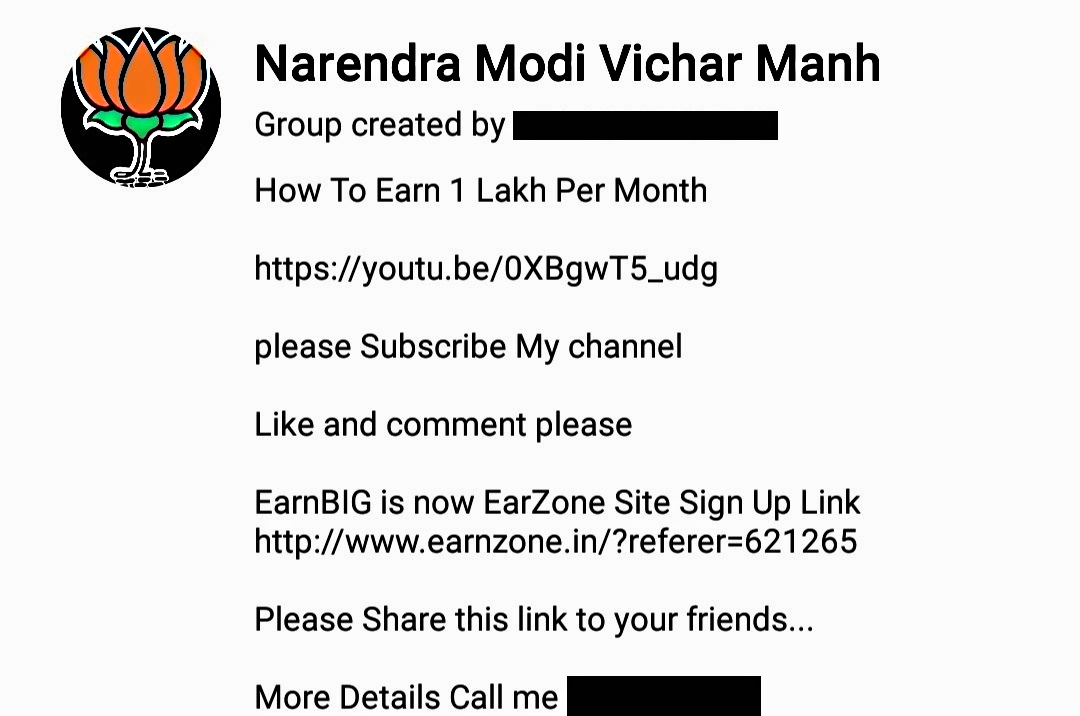
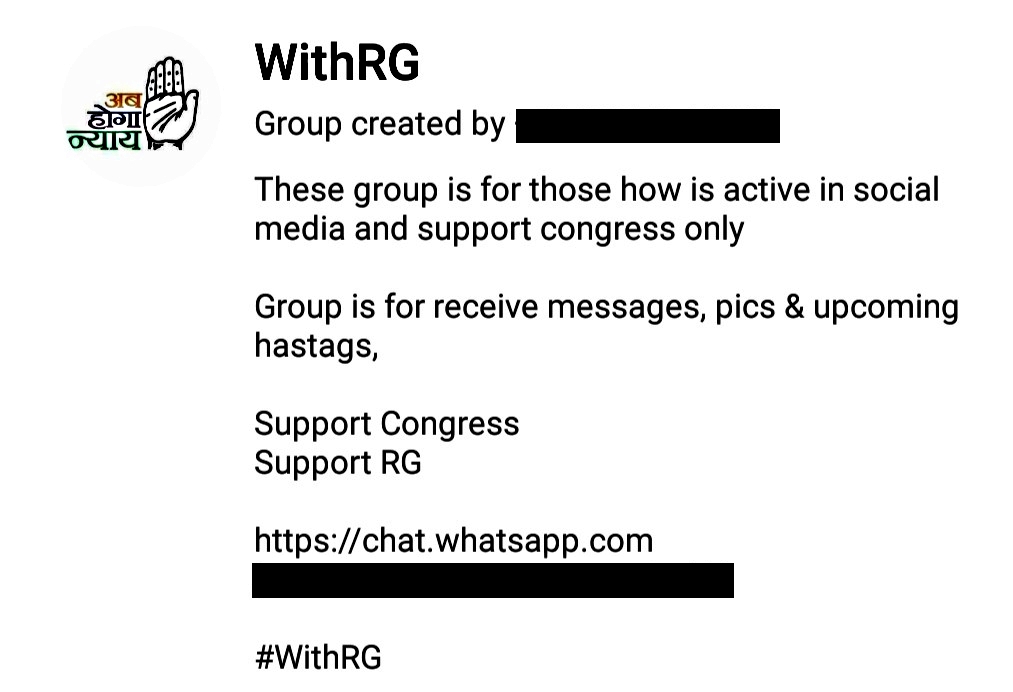
In contrast to other social media platforms, data curation from WAM public groups is a non-trivial task. Even, group identification itself is a challenging task as WAM does not support advanced content search feature. Majority of the online forums/blogs222https://www.opentechinfo.com/WhatsApp-groups/333https://chatwhatsappgrouplink.blogspot.com/p/join-whatsapp-group-links.html?m=1 comprises dubious public group links containing pornographic content, lucrative job, and lottery offers (see Figure 1).
 |
 |
| (a) | (b) |
As the initial step of data curation, we identify and join the relevant groups. We construct a seed set of Indian political WAM groups (based on the names of political parties and their top leaders) from several forums/blogs and social media platforms like Google, Facebook, and Twitter. The seed set consists of 50 groups. The seed set is obtained after manual pre-processing of 600 groups. Further, we enrich the seed set by following groups that were shared within the followed groups. Overall, we obtained 2600 group links collected between January 19, 2019 – May 19, 2019. Out of 2600, we only identify 281 (11%) relevant groups that are actively participating in Indian political discussions. Groups in which all the three metadata categories (i.e., name, display picture, and description) are indicative of the same political affiliation are considered genuine and relevant.
For decryption of the WAM database stored locally on the mobile device, we use a cipher key and a database extractor tool444 https://forum.xda-developers.com/showthread.php?t=2770982. We divide the complete data collection into three phases:
-
•
Before elections: January 19, 2019 – March 5, 2019
-
•
Active campaigning phase: March 6, 2019 – May 19, 2019
-
•
After elections: May 20, 2019 – June 15, 2019
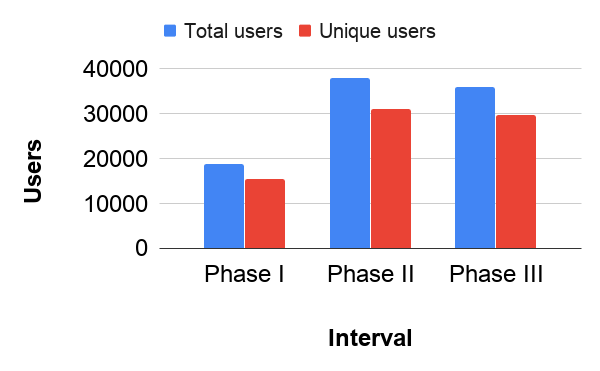
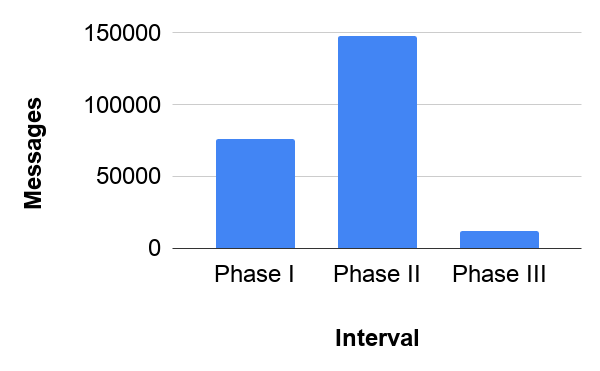
Figure 2 presents user and content statistics at three different phases. We observe a sharp decline in the message count after elections. Similarly, before elections, we find a low user count. Thus, in the rest of the paper, we focus on the active campaigning phase, where the maximum number of users has shared the highest number of messages.
 |
 |
| (a) | (b) |
3.1 Metadata Analysis
| Name | Count | Name | Count | Name | Count | Name | Count | Name | Count |
|---|---|---|---|---|---|---|---|---|---|
| BJP | 144 | AAP | 20 | AIMIM | 4 | RJD | 3 | Shivsena | 1 |
| INC | 45 | BSP | 9 | AIADMK | 3 | AITC | 3 | Others | 19 |
| SP | 21 | YSRCP | 5 | NCP | 3 | CPI(M) | 1 |
Table 1 shows the representation of different political parties out of the total 281 groups. Each group is manually affiliated to a single political party based on the group name, display picture, and description. BJP shows highest representation followed by INC and SP. All state-level parties, except AAP, show poor representation. Several media reports TOI (2019); BBC (2019) supports the insurgence of BJP WAM groups to communicate with the various stakeholders.
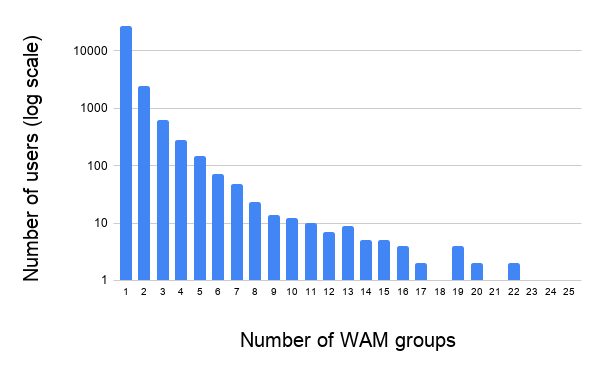
We found a total of 37,984 participants in 281 groups. Out of which, 31,078 (81.8%) comprise unique users. Figure 3 shows the user presence in multiple groups. Even though the majority of users (88.5%) are members of a single group, we find instances where few users are members of more than 20 political groups. For instance, one user is a member of 25 groups, whereas seven users are part of 20 or more groups. In addition, we find that during active campaigning phase, only a few (12.45%) of these groups have group strength 50 users. 63.34% of groups have 100 or more members.
3.1.1 Message formats
In phase II, a total of 1,47,220 messages are shared, out of which 58,008 messages contain media files. Table 2 shows the distribution of media files. 67.59% of the total media files are the image files in the JPEG format. This is consistent with the claims of several news articles that memes Hindu (2019a); Samosa (2019) are a powerful tool to attack or praise individuals and parties during campaigning. Images (in JPEG format) and videos (in MP4 format) constitute 95.06% of all the media files shared. Researchers conclude that image-based message sharing has extensively led to propaganda propagation Madhumita Murgia (2019). For example, political parties/candidates use doctored images Times (2019b); News (2019) of articles from reputable news media sources to demean opponent political parties/candidates.
| Type | Count | Type | Count | Type | Count | Type | Count |
| JPEG | 39,210 | OGG | 371 | 3GPP | 37 | MP3 | 1 |
| MP4 | 15,934 | MPEG | 288 | AAC | 39 | Octet-stream | 1 |
| WEBP | 1,221 | MP4 | 75 | AMR | 35 | Spreadsheets | 1 |
| 719 | APK | 66 | TXT | 10 |
3.1.2 Group metadata
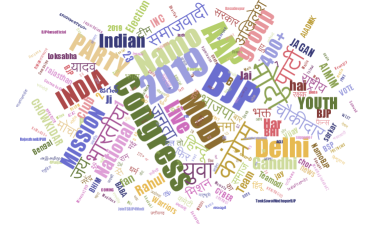
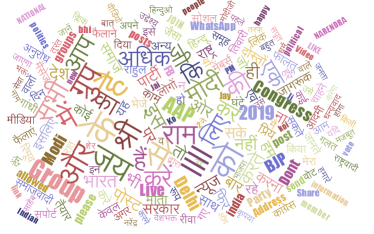
Group metadata comprises a display picture, name, and description. Most of the group display pictures are the official party symbols, pictures of the top leaders/influencers, and religious symbols/idols. The textual content in group names and descriptions shows phrases used in social election campaigning. Figures 4(a) and 4(b) show word clouds of the group names and group descriptions, respectively. We observe the most frequently used words to be in consistent with the claims newslaundry (2019); Scroll (2019a); SBS (2019) of various news and investigative studies. Several research and survey articles Hindu (2019b); Livemint (2019) shows conflicting user opinion on the impact of slogans and influencers in the campaigning. Group names mainly consist of party names as English tokens. Group descriptions mostly contain Hindi language tokens. Thus, any group identification process, either manual or automatic, require a deep understanding of multiple languages.
3.1.3 External link sharing
Several website links are shared among group members. We find a total of 16,582 links comprising news, video, and social media websites. YouTube videos with 5,456 links are the most shared external links. This high number is in line with the claims of several studies Scroll (2019b); Times (2019d) indicating the high influence of YouTube videos in the campaigning. Facebook, Twitter, Dailyhunt (Indian News mobile application), Jansatta (Hindi daily for North India), NDTV (an Indian television media company), etc., are the other popular websites with high number of links. The majority of the video links shared contain the news articles, speeches of the political leaders, and promotional content.
3.1.4 Contribution of top active users
All users do not actively participate in the conversations. The majority of the group members are passive consumers, while few users drive the topics of the conversation. In about 250 groups, the top 50% active users share 80-100% messages. Table 3 shows the contribution of top 1%, 10%, and 50% active users in the groups of different political parties. AAP has the most contribution from the top 1% users, whereas SP has the least contribution from top 1%, 10%, and 50% users. BJP and INC, the top two political parties (based on the number of groups), show similar participation from the top 50% active users. But, BJP leads INC in the participation of the top 1% active users. This disproportionate distribution of user activity can be attributed to:
-
•
Influencers: Presence of a few active participants/influencers in the groups who are possibly responsible for official campaigning of the party/candidates.
-
•
Neutral stance: Less participation from other members might indicate their neutral stance towards the ongoing campaigning, debates, and discussions Times (2019c).
-
•
Group invasion: Members from different political inclination join groups to share misinformation and fake news. Also, group invasion is possible to monitor (with least participation in discussions) the election campaigning of the opposition parties on WAM. Several claims Wire (2019); Diplomat (2019b) have been made that indicates the high usage of WAM for such activities.
 |
 |
| (a) | (b) |
| BJP | INC | AAP | SP | BSP | Others | |
| Top 1% | 30.84 | 27.33 | 33.88 | 18.04 | 24.44 | 28.44 |
| Top 10% | 67.20 | 64.63 | 69.82 | 52.17 | 56.20 | 65.23 |
| Top 50% | 93.53 | 93.97 | 94.37 | 88.67 | 90.25 | 93.05 |
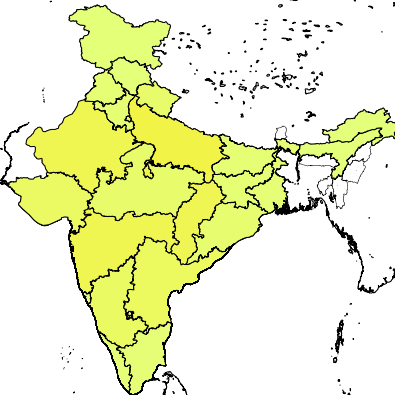
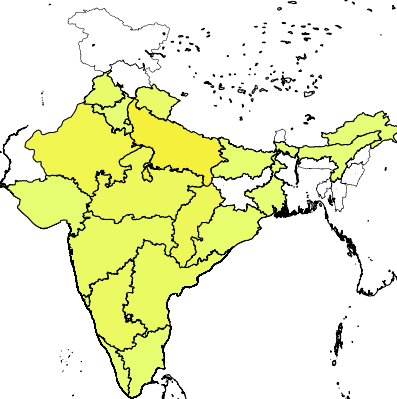
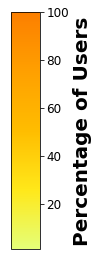
3.1.5 Geographical analysis
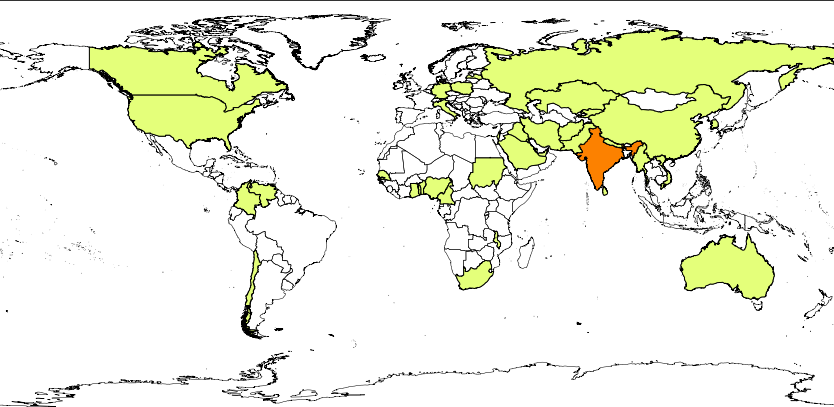
Next, we conduct the geographical analysis of group members based on their registered mobile number.555https://www.searchyellowdirectory.com/reverse-phone/ Surprisingly, we find users from 46 different countries discussing Indian politics. However, the majority of users belong to India. Figure 5(a) and 5(b) collectively show user locations outside and inside India. We also find that group administrators belong to five different countries (India, Pakistan, UAE, Latvia, and the USA). The above empirical findings confirm several claims about non-resident Indians participating in social media campaigns Chaturvedi (2020); Times (2019a); Diplomat (2019a). Figure 5(c) shows the locations of Indian group administrators. The majority of users and group administrators belong to northern and central India, strengthening the popular belief that WAM-based political campaigns are centrally managed by a team of IT experts headquartered in the Delhi-NCR region Ayush Tiwari (2020).
3.1.6 Group creation time
Table 4 shows the group creation time of all the 281 groups. As we can see, a significant number (51.60%) of groups are created in the first five months of the year 2019, which is consistent with claims made by several news articles Madhumita Murgia (2019); News (2018); Uttam (2018); Iyengar (2019).
| Interval | Groups | Interval | Groups | Interval | Groups |
|---|---|---|---|---|---|
| May’14-Dec’14 | 4 | May’16-Dec’16 | 11 | May’18-Dec’18 | 66 |
| Jan’15-Aug’15 | 2 | Jan’17-Aug’17 | 18 | Jan’19-May’19 | 145 |
| Sep’15-Apr’16 | 4 | Sep’17-Apr’18 | 31 |
3.1.7 Languages
Table 5 presents language identification666https://pypi.org/project/langdetect/ statistics. A total of 31, 22, and 45 unique languages are used in writing group names, group descriptions, and messages, respectively. English and Hindi are the two most frequently used languages. The findings reiterate the challenges in conducting WAM-based user analysis, due to multilingualism, in highly diversified countries like India.
| Top-5 languages in decreasing order of frequency | |
|---|---|
| Names | Hindi, English, Nepali, Marathi, Indonesian |
| Descriptions | Hindi, English, Nepali, Marathi, Tagalog |
| Messages | Hindi, English, Indonesian, Marathi, Somali |
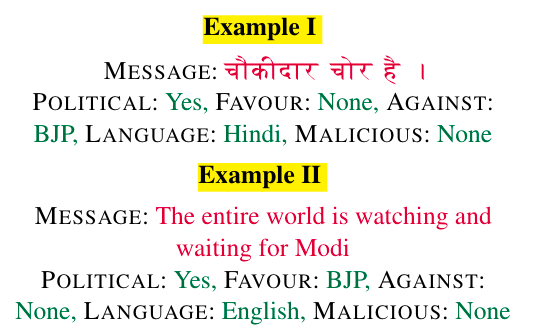
3.2 Annotation
We construct a fine-grained manually annotated dataset of 3,848 messages. Eight annotators have performed annotation of the messages. All of the eight annotators are native Hindi speaker and proficient in speaking and writing English. Figure 6 shows the example annotation of the messages. Before annotation, we pre-process the original dataset to filter out irrelevant/noisy messages by removing non-textual data like hyperlinks, emoticons, images, and videos, duplicate messages, and messages with length less than five characters or more than 150 characters and keeping messages written in either of two scripts Roman or Devanagari. Pre-processing results in 48,474 messages. We randomly sample 3,848 messages from pre-processed data for annotation. Each annotator annotates 481 samples. Each message has a fine-grained annotation with the labels in the following categories:
| Malicious activity | Political orientation | Language | |||||||
| Spam | Offensive | Advertisement | Others | Political | Non-political | Hindi | English | Others | |
| Count | 759 | 219 | 142 | 971 | 1797 | 2051 | 2965 | 549 | 334 |
-
•
Malicious activity: This category helps in identifying unusual and irrelevant activity within a group. A message is assigned one of the four labels in this category, i.e., spam, advertisement, offensive content, and others. Spam contains the textual messages that are irrelevant to the group and not part of any promotion of product/website/video/etc. Advertisement is specific to the promotional content. Others category contains the messages that are non-political and do not involve any other categories of malicious activities such as a non-political joke, historical content, personal conversation, etc. Others could be a set of messages with non-political and non-malicious content. Table 6 shows the malicious activity distribution. Spam is more prominent as compared to advertisement and offensive content.
-
•
Political orientation: Each message is assigned a binary label for the political orientation — political or non-political. Table 6 shows the count of messages having political or non-political orientation. Even though the group identification process is completely manual with strict selection guidelines, we witness non-political messages surpassing political messages. We claim that without a strict selection criterion (as presented in earlier works Resende et al. (2019b, a)), the insights will be highly noisy.
-
•
Political inclination: This category helps in identifying the political inclination (favor and against) of the messages based on their political affiliation. Similar to the categorization described in the previous section, we assign one of the seven labels (BJP, INC, SP, BSP, AAP, AITC, and Others) to each message. Table 7 shows the inclination of the messages for different political parties. BJP is the most favored party based on the number of messages shared in favor. Whereas INC is the most targeted party.
-
•
Language: Each message is assigned one of the three labels Hindi, English, and Others. Table 6 shows the distribution of languages used in different messages. Hindi is the most preferred language.
| BJP | INC | AAP | SP | BSP | AITC | Others | |
|---|---|---|---|---|---|---|---|
| Favour | 651 | 96 | 18 | 8 | 9 | 8 | 116 |
| Against | 298 | 600 | 44 | 42 | 44 | 52 | 114 |
4 A Study on Political and Social Co-occurrences
The majority of the political parties often declare the agendas for their election campaigns. These agendas are mostly driven by various factors that touch upon the needs, beliefs, and necessities of the stakeholders. During the election campaign, the information propagation on various social media platforms gets heavily influenced by these social factors.
In this section, we present a discussion on the co-occurrence of two political entities (i.e., leaders and parties) and four social factors (i.e., agenda, religion, caste, and languages/ethnicity) in the dataset. Table 8 shows the fine-grained categorization of the political entities and the social factors. In our analysis, we select the six political parties (i.e. BJP, INC, AAP, SP, BSP, and AITC) and the most popular leader from each of these political parties (Narendra Modi–BJP, Rahul Gandhi–INC, Arvind Kejriwal–AAP, Akhilesh Yadav–SP, Mayawati–BSP, and Mamata Banarjee–AITC). The choice of social factors is motivated by the various influential topics being continuously reported to impact the political discourse in India.
To this end, we learn the word representation using FastText Bojanowski et al. (2017) on the textual data in the messages. We pre-filter the noisy content in the dataset i.e. emoticons, special characters, and hyperlinks. To learn the representation, we use Gensim777https://radimrehurek.com/gensim/models/fasttext.html with Python interfaces and default parameters. English and Hindi are the two most popular languages in the dataset. The word representations from FastText has different representation for the same word in two languages. To address this challenge, we translate the political entities and the social factors in the English languages (Roman script) to the Hindi language (Devanagari script) using Google Translate888https://translate.google.com/. To understand the co-occurrence of the political entities and social factors in the dataset, we compute the cosine similarity between them. For similarity computation, we use the words in both languages (i.e. English and Hindi). The similarity between political entity and social factor is given as:
sim(, ) = max{sim(, ), sim(, ), sim(, ), sim(, )}, where and represents the word representation of word in the Hindi and the English language respectively.
For the entity/social factor with more than one word, we take the average of the word representation of the constituent words. Table 9 and 10 presents the top-k (k=5 for ‘Agendas’, ‘Religions’, ‘Languages/Ethnicity’ and k=4 for ‘Castes’) most similar social factors for the political leaders and political parties respectively. We draw following major insights from the co-occurrence analysis:
| Political | Parties | BJP, INC, AAP, SP, BSP, AITC | |||
| Leaders | Narendra Modi, Rahul Gandhi, Arvind Kejriwal, Akhilesh Yadav, Mayawati, Mamata Banerjee | ||||
| Social | Agendas |
|
|||
| Religion | Hinduism, Islam, Sikhism, Christianity, Buddhism, Jainism | ||||
| Castes | Forward Castes, Other Backward Class (OBC), Scheduled Castes (SC), Scheduled Tribes (ST) | ||||
|
|
| Agendas | Religions | Castes | Languages/Ethnicity | |||||||||
|---|---|---|---|---|---|---|---|---|---|---|---|---|
| Narendra Modi |
|
|
|
|
||||||||
| Rahul Gandhi |
|
|
|
|
||||||||
| Arvind Kejriwal |
|
|
|
|
||||||||
| Akhilesh Yadav |
|
|
|
|
||||||||
| Mayawati |
|
|
|
|
||||||||
| Mamata Banerjee |
|
|
|
|
| Agendas | Religions | Castes | Languages/Ethnicity | |||||||||
|---|---|---|---|---|---|---|---|---|---|---|---|---|
| BJP |
|
|
|
|
||||||||
| INC |
|
|
|
|
||||||||
| AAP |
|
|
|
|
||||||||
| SP |
|
|
|
|
||||||||
| BSP |
|
|
|
|
||||||||
| AITC |
|
|
|
|
-
•
‘Corruption’, ‘Literacy’, and ‘Development’ are three most sought after agendas for political leaders and the parties including the ruling (i.e. BJP) and the opposition parties.
-
•
‘Privatisation’ is among the top-5 social factors for ‘Narendra Modi’. No other leader or party has ‘Privatisation’ as the top-5 agendas.
-
•
Though ‘Poverty’ is a major concern for India, only ‘Mamata Banarjee’ from ‘AITC’ has ‘Poverty’ as the top-5 agendas.
-
•
Apart from ‘Corruption’, ‘Literacy’, and ‘Development’, the opposition leaders and parties shows high similarity with some fundamental issues such as ‘Healthcare’, ‘Unemployment’, ‘Education’, and ‘Taxation’.
-
•
Most of the political leaders shows low similarity with the two most debated religions in India (i.e. ‘Hinduism’ and ‘Islamism’). The political parties shows the opposite behaviour with ‘Hinduism’ and ‘Islamism’ as the most associated religions.
-
•
The order of similarity with ‘Hinduism’ and ‘Islamism’ for ‘BJP’ and ‘INC’ is opposite. ‘BJP’ is more similar with ‘Hinduism’ than ‘Islamism’ and vice-versa.
-
•
Most of the political leaders shows high similarity with the ‘Forward Castes’ whereas the political parties are more similar with the ‘Other Backward Class (OBC)’.
-
•
Apart from ‘Akhilesh Yadav’ and ‘Mayawati’, the ‘Scheduled Tribes (ST)’ remains the least similar with the political leaders.
-
•
The opposition leaders (i.e. leaders except ‘Narendra Modi’) shows high similarity with the Dravidian languages/ethnicity (i.e. ‘Tamil’, ‘Malayalam’, and ‘Kannada’).
-
•
‘Odia’ and ‘Assamese’ consistently shows high similarity with the political leaders and parties. The high similarity of ‘Odia’ can be attributed to the fact that state assembly elections of the state Odisha took place along with the Indian general elections 2019.
5 Conclusion and Future Work
In this paper, we present an exploration of the noisy user-generated data on WAM with a focus on Indian general elections 2019. In contrast to the existing works, we discuss a novel manual group filtering strategy to reduce the presence of noisy and dubious groups in the dataset. In addition, we present a fine-grained annotated dataset with multi-dimensional labels to understand various linguistic characteristics. Lastly, the co-occurrence analysis put forward several interesting insights from the Indian general elections 2019. In the future, the presented dataset would be useful in understanding various aspects (e.g., named-entities, POS tagging, language identification, etc.) of the noisy user generated textual data.
References
- Ansolabehere et al. (2006) Stephen Ansolabehere, Rebecca Lessem, and James M Snyder Jr. 2006. The orientation of newspaper endorsements in us elections, 1940–2002. Quarterly Journal of political science, 1(4):393.
- Ayush Tiwari (2020) Ayan Sharma Ayush Tiwari. 2020. Delhi bjp’s it cell is trying its best to take on aap. is it working? [Online; accessed 24-May-2020].
- Barrett and Barrington (2005) Andrew W Barrett and Lowell W Barrington. 2005. Is a picture worth a thousand words? newspaper photographs and voter evaluations of political candidates. Harvard International Journal of Press/Politics, 10(4):98–113.
- BBC (2019) BBC. 2019. India election 2019: Exit polls suggest narendra modi back as pm. [Online; accessed 25-May-2020].
- Bobrov (2018) Liron Hakim Bobrov. 2018. Mobile messaging app map-february 2018. [Online; accessed 12-May-2019].
- Bojanowski et al. (2017) Piotr Bojanowski, Edouard Grave, Armand Joulin, and Tomas Mikolov. 2017. Enriching word vectors with subword information. Transactions of the Association for Computational Linguistics, 5:135–146.
- Bovet and Makse (2019) Alexandre Bovet and Hernán A Makse. 2019. Influence of fake news in twitter during the 2016 us presidential election. Nature communications, 10(1):7.
- Caetano et al. (2018) Josemar Alves Caetano, Jaqueline Faria de Oliveira, Hélder Seixas Lima, Humberto T Marques-Neto, Gabriel Magno, Wagner Meira Jr, and Virgílio AF Almeida. 2018. Analyzing and characterizing political discussions in whatsapp public groups. arXiv preprint arXiv:1804.00397.
- Chaturvedi (2020) Rakesh Mohan Chaturvedi. 2020. Nri push for bjp lok sabha poll campaign. [Online; accessed 24-May-2020].
- Colleoni et al. (2014) Elanor Colleoni, Alessandro Rozza, and Adam Arvidsson. 2014. Echo chamber or public sphere? predicting political orientation and measuring political homophily in twitter using big data. Journal of communication, 64(2):317–332.
- Conover et al. (2011) Michael D Conover, Jacob Ratkiewicz, Matthew Francisco, Bruno Gonçalves, Filippo Menczer, and Alessandro Flammini. 2011. Political polarization on twitter. In Fifth international AAAI conference on weblogs and social media.
- Conversation (2018) The Conversation. 2018. Whatsapp skewed brazilian election, proving social media’s danger to democracy. [Online; accessed 25-May-2020].
- Diplomat (2019a) The Diplomat. 2019a. The indian diaspora’s influence on the general election. [Online; accessed 28-Aug-2020].
- Diplomat (2019b) The Diplomat. 2019b. Manufacturing islamophobia on whatsapp in india. [Online; accessed 15-Aug-2020].
- Ferreira et al. (2018) Carlos Henrique Gomes Ferreira, Breno de Sousa Matos, and Jussara M Almeira. 2018. Analyzing dynamic ideological communities in congressional voting networks. In International Conference on Social Informatics, pages 257–273. Springer.
- Garimella and Eckles (2020) Kiran Garimella and Dean Eckles. 2020. Images and misinformation in political groups: Evidence from whatsapp in india. Harvard Kennedy School Misinformation Review.
- Garimella and Tyson (2018) Kiran Garimella and Gareth Tyson. 2018. Whatapp doc? a first look at whatsapp public group data. In Twelfth International AAAI Conference on Web and Social Media.
- Hindu (2019a) The Hindu. 2019a. General elections 2019: Memes flood social media after the results. [Online; accessed 15-Aug-2020].
- Hindu (2019b) The Hindu. 2019b. Role of social media as influencer of voting choices overhyped: Csds study. [Online; accessed 15-Aug-2020].
- Indian (2019) The Logical Indian. 2019. Over 87,000 whatsapp groups may be using political propaganda to influence voters, says report. [Online; accessed 28-Aug-2020].
- Iyengar (2019) Rishi Iyengar. 2019. In india’s last election, social media was used as a tool. this time it could become a weapon. [Online; accessed 12-May-2019].
- Javed et al. (2020) R Tallal Javed, Mirza Elaaf Shuja, Muhammad Usama, Junaid Qadir, Waleed Iqbal, Gareth Tyson, Ignacio Castro, and Kiran Garimella. 2020. A first look at covid-19 messages on whatsapp in pakistan. In 2020 IEEE/ACM International Conference on Advances in Social Networks Analysis and Mining (ASONAM), pages 118–125. IEEE.
- Livemint (2019) Livemint. 2019. Now, more politicians want influencers to woo voters. [Online; accessed 15-Aug-2020].
- Madhumita Murgia (2019) Andres Schipani Madhumita Murgia, Stephanie Findlay. 2019. India: the whatsapp election. [Online; accessed 24-May-2020].
- News (2019) ABC News. 2019. India election body struggles with scale of fake information. [Online; accessed 15-Aug-2020].
- News (2018) KMoneycontrol News. 2018. Tmc draws plans to strengthen digital wing, will create 10,000 whatsapp groups: Report. [Online; accessed 12-May-2019].
- newslaundry (2019) newslaundry. 2019. Game of words: These are the most-used words by political parties in their manifestos. [Online; accessed 15-Aug-2020].
- Pang and Woo (2020) Natalie Pang and Yue Ting Woo. 2020. What about whatsapp? a systematic review of whatsapp and its role in civic and political engagement. First Monday.
- Resende et al. (2019a) Gustavo Resende, Philipe Melo, Julio CS Reis, Marisa Vasconcelos, Jussara M Almeida, and Fabrício Benevenuto. 2019a. Analyzing textual (mis) information shared in whatsapp groups. In Proceedings of the 10th ACM Conference on Web Science, pages 225–234.
- Resende et al. (2019b) Gustavo Resende, Philipe Melo, Hugo Sousa, Johnnatan Messias, Marisa Vasconcelos, Jussara Almeida, and Fabrício Benevenuto. 2019b. information dissemination in whatsapp: Gathering, analyzing and countermeasures. In Proc. of the The Web Conference (WWW’19).
- Ruble (2014) Kayla Ruble. 2014. Whatsapp and social media could determine india’s elections. [Online; accessed 12-May-2019].
- Saha et al. (2021) Punyajoy Saha, Binny Mathew, Kiran Garimella, and Animesh Mukherjee. 2021. “short is the road that leads from fear to hate”: Fear speech in indian whatsapp groups. In Proceedings of the Web Conference 2021, pages 1110–1121.
- Samosa (2019) Social Samosa. 2019. With bjp’s #5yearchallenge, 2019 general elections to see political war of memes. [Online; accessed 15-Aug-2020].
- SBS (2019) SBS. 2019. Analysis: The politics underlying india’s election buzzwords. [Online; accessed 15-Aug-2020].
- Scroll (2019a) Scroll. 2019a. Bhakt, mitron, demonetisation: 10 words or phrases that entered our dictionaries with the modi era. [Online; accessed 15-Aug-2020].
- Scroll (2019b) Scroll. 2019b. The indian youtube wars: Political video influencers are heating up the internet in election year. [Online; accessed 15-Aug-2020].
- Tech (2018) Tactical Tech. 2018. Whatsapp: The widespread use of whatsapp in political campaigning in the global south. [Online; accessed 25-May-2020].
- Times (2019a) Economic Times. 2019a. Nri push for bjp lok sabha poll campaign. [Online; accessed 28-Aug-2020].
- Times (2019b) Financial Times. 2019b. India: the whatsapp election. [Online; accessed 28-Aug-2020].
- Times (2019c) Hindustan Times. 2019c. Rural indians don’t trust messages on whatsapp blindly: Survey. [Online; accessed 28-Aug-2020].
- Times (2019d) The New York Times. 2019d. How youtube radicalized brazil. [Online; accessed 15-Aug-2020].
- TOI (2019) TOI. 2019. Timesmegapoll: 83% say modi-led government is most likely outcome after 2019 general election. [Online; accessed 25-May-2020].
- Tumasjan et al. (2010) Andranik Tumasjan, Timm O Sprenger, Philipp G Sandner, and Isabell M Welpe. 2010. Predicting elections with twitter: What 140 characters reveal about political sentiment. In Fourth international AAAI conference on weblogs and social media.
- Uttam (2018) Kumar Uttam. 2018. For pm modi’s 2019 campaign, bjp readies its whatsapp plan. [Online; accessed 12-May-2019].
- Velasquez et al. (2021) Alcides Velasquez, Andrea M Quenette, and Hernando Rojas. 2021. Whatsapp political expression and political participation: The role of ethnic minorities’ group solidarity and political talk ethnic heterogeneity. International Journal of Communication, 15:22.
- Vermeer et al. (2021) Susan AM Vermeer, Sanne Kruikemeier, Damian Trilling, and Claes H de Vreese. 2021. Whatsapp with politics?! examining the effects of interpersonal political discussion in instant messaging apps. The International Journal of Press/Politics, 26(2):410–437.
- Vitak et al. (2011) Jessica Vitak, Paul Zube, Andrew Smock, Caleb T Carr, Nicole Ellison, and Cliff Lampe. 2011. It’s complicated: Facebook users’ political participation in the 2008 election. CyberPsychology, behavior, and social networking, 14(3):107–114.
- Wang et al. (2015) Wei Wang, David Rothschild, Sharad Goel, and Andrew Gelman. 2015. Forecasting elections with non-representative polls. International Journal of Forecasting, 31(3):980–991.
- Wire (2019) The Wire. 2019. During general elections, whatsapp groups saw more automated, spam-like behaviour. [Online; accessed 15-Aug-2020].
- Yadav et al. (2020) Anshuman Yadav, Aditya Garg, Anup Aglawe, Ayush Agarwal, and Vivek Srivastava. 2020. Understanding the political inclination of whatsapp chats. In Proceedings of the 7th ACM IKDD CoDS and 25th COMAD, pages 361–362.