Fluctuating Cooper pairs in FeSe at temperatures exceeding double
Abstract
Temperature dependencies of excess conductivity, , have been studied in detail for three FeSe0.94 textured polycrystalline samples prepared by partial melting and solid state reaction. It was revealed that both and its temperature dependence are extremely sensitive to the method of sample preparation. Then, it was shown that in the range from the superconducting transition temperature K up to the characteristic temperature K, obeys the classical fluctuation theories of Aslamazov-Larkin (AL) and Hikami-Larkin (Maki-Thompson (MT) term) pointing to the existence of fluctuating Cooper pairs in FeSe at temperatures exceeding double . Like in cuprates, AL-MT crossover at is observed, which means the appearance of 3D-2D dimensional transition at this temperature. This allows us to determine the coherence length along the -axis, Å, and a set of additional samples’ parameters, including the phase relaxation time, , of fluctuating Cooper pairs, within a simple two-dimensional free-carrier picture. It was shown that in FeSe coincides with that found for YBa2Cu3O7-δ suggesting that the nature of superconducting fluctuations is very similar for these high-temperature superconductors of different types.
Despite the fact that FeSe has the simplest crystal structure among Fe-based superconductors, it possesses many unusual features, such as: enhanced anisotropic spin fluctuations below 80 K Ross , specific temperature dependences of resistivity Ross ; Sun1 ; Kar ; H2 , Hall effect Sun1 ; Kar and Kohler effect Ross ; Sun1 ; Kar , which are likely due to presence of both electron- and hole-like charge carriers, and specific structural transition at K Sun1 ; Kar ; H2 ; John . Understanding these features is believed to shed more light on the nature of high-temperature superconductors (HTSCs) in general (see Refs. Sad ; Kord and references therein), including the interplay between superconductivity and magnetism Maz ; Wang ; Kas ; We . One such feature is the temperature dependence of the resistivity, , which turned out to be semiconductor-like in a wide temperature range above K in single crystals Kar and above K in polycrystalline materials 300K . However, below K, transforms into roughly metallic-like dependence Kar ; 300K , and takes a shape resembling that observed for underdoped cuprate HTSCs (cuprates) Kord ; And and FeAs-based superconductors (Fe-pnictides) Sad2 ; SO . Eventually, as decreases, FeSe becomes superconducting (SC) with SC transition temperature K at ambient pressure Ross ; Sun1 ; Kar ; Sad ; Kord , unexpectedly in a rather narrow range of Se concentration Pom . Interestingly, is found to noticeably increase up to 38 K after applying pressure of 9 GPa H2 ; Med or by means of partial substitutions of the Se site with S or Te Sun1 ; MiT ; 4* . In some cases, pressure and intercalation being combined result in superconductivity with K Sun . Moreover, one-unit-cell-thick FeSe films are reported to demonstrate the critical temperature at about 109 K EugeneReffive ; KordRefsix ; KordRefseven likely pointing out new possibilities for superconductivity in this compound present well above the liquid nitrogen temperature KordRefnine .
It has been shown that the maximum in , observed for FeSe at about 315-350 K Kar ; 300K , is not related to electron-phonon scattering or spin fluctuations-charge carriers coupling Kar , nor charge carriers thermal activation Bach . Most likely, in the range of 315-350 K, the electron band structure of FeSe is reconstructed, which can lead to an increase in the density of charge carriers, , and, as a result, to the observed decrease in at lower temperatures (see Ref. Kar and references therein). It is important to note that no structural or magnetic transition at about 300-350 K was reported Kar ; 300K . A poorly recognized structural transition was identified at K GnRef ; Gnesd , and another well-known structural transition was revealed at K Sun1 ; Kar ; Pom ; McQ ; Bolg ; Galluz ; Wat1 . However, unlike Fe-pnictides, for FeSe, the transition at is not accompanied by the corresponding antiferromagnetic (AFM) transition, that is, it seems to be of the nematic type (see Refs. John ; Sad ; Kord and references therein). There are several pieces of evidence now which suggest charge induced nematicity in FeSe Sun1 ; Kar ; H2 ; Kord ; Mass ; Wat2 . This type of transition is associated with spontaneous breaking of the symmetry between the and directions in the Fe plane, reducing group symmetry of the lattice from tetragonal to orthorhombic. This fact reflects the intrinsic electronic instability of FeSe and complex evolution of the electronic band structure with temperature Sun1 ; Kar ; H2 ; John ; Sad ; Kord ; GnRef ; Gnesd ; McQ ; Wat1 ; Mass ; Wat2 ; Wat . Finally, one may conclude that the FeSe compounds are deep in the crossover regime between the BCS and Bose-Einstain-Condensation (BEC) limits Kas ; Mass ; Wat2 ; Wat ; Ran .
The behavior of FeSe differs markedly from that observed for cuprates (such as YBa2Cu3O7-δ (YBCO), etc.) where is a linear function of temperature in a wide temperature range above the pseudogap temperature Lang ; S1 . Below , deviates downward from the linearity resulting in appearance of the excess conductivity, , as a difference between the measured conductivity, , and the extrapolated normal-state linear conductivity, We ; Lang ; S1 . For YBCO, in a relatively short temperature range 15 K above Grb , is well fitted by the classical fluctuation theories of Aslamazov-Larkin (AL) and Hikami-Larkin (HL) (Maki-Thompson (MT) term) (see Refs. We ; S1 and references therein). This is the range of SC fluctuations or the range of fluctuation conductivity (FLC), which is characterized by the nonzero superfluid density, , because of formation of fluctuating Cooper pairs (FCPs) above Cor ; Kaw ; Yam . In this temperature range, FCPs behave in a good many way like SC Cooper pairs without long-range order, that is, the pairs which show so-called short-range phase correlations Ran ; EmeryK and somehow have to obey the BCS theory DeGen .
Studies of SC fluctuations have attracted a great deal of attention in the research of cuprate HTSCs (see Refs. Lang ; S1 ; Grb and references therein). The main reason for that is related to the nature of the pseudogap (PG), which is known to open below , that in underdoped cuprates is much above and may have superconducting nature S1 ; TS ; Tail ; DK . Unlike cuprates, there is an obvious lack of research on the SC fluctuations in FeSe. As a result, little is known about the existence of the FCPs above and their possible influence on the above mentioned properties of FeSe. Accordingly, the data reported on the possible realization of the PG state in FeSe compounds are rather contradictory Song ; Pall ; Sprau ; Ross .
In this paper, we report on the study of SC fluctuations in FeSe polycrystals. We have studied three samples prepared by different techniques Bolg to find out the influence of the sample structure and possible defects on FLC. The FCPs contributions to FLC were derived from and dependencies and analyzed within a model of local pairs (LPs) S1 . Our results show that in the range of SC fluctuations, near is well described by the three-dimension (3D) AL fluctuation theory. At higher temperatures, a crossover to the state well approximated by the two-dimensional (2D) HL fluctuation theory (2D MT term) occurs. The crossover temperature, , allows us to determine the coherence length along the -axis at zero temperature, , which is several angstroms for all samples. Taking into account the resulting coherence length, a set of additional important samples’ parameters was determined in the framework of a simple 2D model of free charge carriers, including , which is the lifetime of the FCPs in the region of SC fluctuations Mats ; Sug ; S3 . Important implications of these findings are also presented and discussed.
In earlier studies on the excess conductivity in FeSe it was assumed that the normal state occurs at temperatures close to Kas . The new approach presented in our work concerns the normal state at temperatures close to room temperature and for this choice we quote a number of arguments. The solution we propose is the only one that leads to results consistent with the results obtained with different methods, authenticating our approach.
2. EXPERIMENT
Three samples of FeSe0.94 were prepared by different technique, as described elsewhere Bolg . Two samples with nominal compositions FeSe0.94+4wt%Ag (S1) and FeSe0.94 (S3) were obtained by partial melting. The third sample, FeSe0.94 (S2), was obtained by the solid state reaction (SSR) method Bolg . Silver has been widely used as a dopant or additive to improve the microstructure and SC properties Bolgciteten ; Bolgciteeleven ; Fab . The role of Ag addition on structure and SC properties was investigated for polycrystalline Sr0.6K0.4Fe2As2 Bolgcitetwelve and FeSe0.5Te0.5 Bolgcitethirteen , where a small amount of Ag was found to enter into the crystal structure. Moreover, in our previous works it was established that a small amount of Ag incorporated in the grains of FeSe0.94 improves both intra- and intergranular SC properties Bolg ; Galluz . This results in an increase of , the upper critical field, , the Ginsburg-Landau parameter, , the critical current density, , and pinning energy, as well as in a decrease of the transition width, Bolg ; Galluz . It was also found that due to Ag doping the irreversibility field slightly increases and intergranular bonds are improved Bolgcitefourteen .
Powder X-ray diffraction measurements were carried out within the range from 5.3∘ to 80∘ 2 with a constant step 0.02∘ 2 on a Bruker D8 Advance diffractometer with Cu K radiation and a LynxEye detector. Phase identification was performed with Diffrac EVA using ICDD-PDF2 Database Bolg . It was found (see Fig. 1 in Ref. Bolg ) that both undoped samples, S2 and S3, consist mainly of the SC tetragonal phase with traces of the non-superconducting hexagonal phase present in sample S3 prepared by partial melting. No hexagonal phase was detected in the Ag doped sample, S1, where only 4 wt% of Ag and trace amounts of Fe were found as impurities. Thus, analogous to the Sn addition in FeSe Bolgcitefifteen , Ag seems to help suppress the formation of the hexagonal phase and to increase the amount of the SC tetragonal phase. The lattice parameters of samples prepared by melting (undoped and with addition of Ag) are similar (S3: a = 3.7650 Å, c = 5.5180 Å, and S1: a = 3.7671 Å, c = 5.5193 Å) indicating that Ag is most likely only slightly incorporated in the unit cell Fab . The lattice parameters of samples S2, obtained by the SSR method, are: a = 3.7759 Å, c = 5.5180 Å. It is well known that FeSe has the simplest crystal structure among other Fe-based superconductors, as mentioned above. A unit cell is a tetrahedron with Fe ion in the center and Se in its vertices. The symmetry group is P4/ with lattice constants a = 3.768 Å (Fe-Fe distance) and c = 5.517 Å (interlayer distance), with the height of the Se ions over the Fe planes, = 0.2343 ( Å) Kar ; Sad22 ; Str . Thus, the lattice parameters of our samples are consistent with those reported in literature.
Rectangular samples of about mm3 were cut out of the pressed pellets. A fully computerized setup on the bases of a physical properties measurement system (Quantum Design PPMS-14T) utilizing the four-point probe technique was used to measure the longitudinal resistivity, , with sufficient accuracy at low frequency ( Hz) of the measuring current. Silver epoxy contacts were glued to the ends of the sample in order to produce a uniform current distribution in the central region where voltage probes in the form of parallel stripes were placed.
Contact resistances below 1 were obtained for voltage stripes with a width less than 0.3 mm. We expected to find out the difference in the behavior of the samples, conditioned by the way they are prepared, i.e. the degree of disorder, analyzing the fluctuation conductivity derived from the resistivity results.
3. RESULTS AND DISCUSSION
3.1. Resistivity
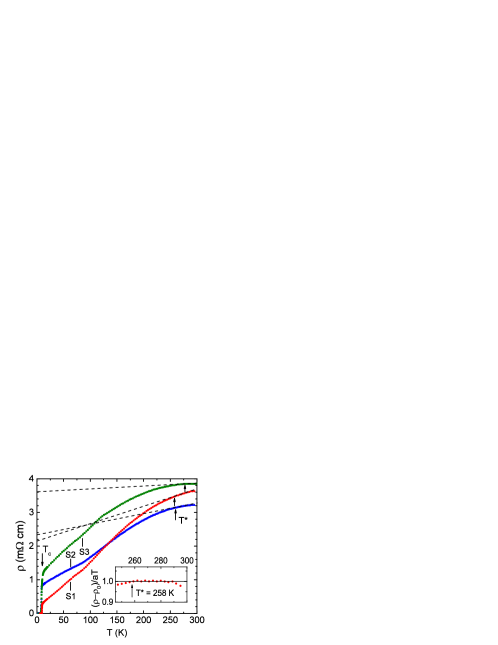
Figure 1 shows the temperature dependencies of the resistivity for all three samples, which exhibit a metallic behavior with positive d/d until the temperature decreases to . By extrapolating the linear part of at the SC transition to , the critical temperature is determined. Since the resistive transitions were quite sharp, especially in the case of S1 Bolg , the approach allows to get ’s values with high accuracy (Table I). As expected, the Ag-doped sample (S1) has the highest K and the lowest =10K) cm. This value is similar to =10K) and cm, as reported for single crystals in Refs Yang and Lei , respectively.
Besides that, S1 has the largest residual resistivity ratio RRR = 13.5, defined as R(300 K)/R(10 K). This RRR value is significantly higher than RRR = 9.3, observed for polycrystalline materials obtained by the self-flux method Song , which confirms the good quality of the sample structure.
On the other hand, sample S3 has much lover K and the highest =10K) 1010cm, most likely due to inclusions of the hexagonal phase, as observed by X-ray diffraction Bolg , which may perturb the sample structure. The lowest K has sample S2 prepared by the SSR method, despite of smaller =10K) cm.
Consequently, relatively small values of RRR, 3.9 for S2 and 3.8 for S3, have been observed, which indicate enhanced disorder in both samples.
Interestingly, despite these differences, samples S1 and S3, obtained by partial melting, have very similar shape of the dependencies. At the same time, the shape of for sample S2, manufactured by the SSR method, changes in a different way and below 90 K the slope of the curve becomes smaller than for samples S1 and S3. These observations confirm the expectations that the properties of bulk FeSe substantially depend on the method of manufacturing.
Nevertheless, an obvious kinklike behavior related to the structural transition is observed at for all three samples. The structural transition temperature, , is usually defined as the temperature at which takes its minimum value and occurs in the range between 90 and 80 K for FeSe Sun1 ; Kar ; Bolg . As mentioned above, in Fe-pnictides the structural transition is followed by the transition to the spin-density-wave AFM state Sad2 , that may be responsible for the electron pairing and superconductivity Maz ; Wang ; Tail .
3.2. Fluctuation conductivity
As mentioned above, the normal state in cuprates is well defined by the linear dependence at higher temperatures And ; S1 ; Lang and is also characterized by the stability of a Fermi surface Tail ; PB ; SP ; Bad ; FerS . Nevertheless, below a representative temperature , deviates downwards from the linearity and the system goes into the pseudogap state (see Refs. We ; Lang ; S1 and references therein) which is characterized by the partial reduction of the electronic density of states (DOS) at the Fermi level Allo ; Kond , probably due to reconstruction of the Fermi surface SP ; Bad ; PB ; FerS . Usually, is taken at the point where the curve starts to downturn from the high-temperature linear dependence We ; Lang ; S1 ; VS ; Oh ; Vovk ; Kond2 . The deviation results in the emergence of excess conductivity:
| (1) |
where is the extrapolated linear normal-state resistivity. Certainly, should contain information about fluctuation conductivity due to existence of the SC fluctuations above We ; S1 ; Lang ; VS .
Unlike cuprates, the normal state in FeSe is still uncertain, despite the seeming simplicity of its structure (see insert in Fig. 3). Ultimately, the normal state was chosen in the manner shown by the dashed lines in Fig. 1, based on the following considerations. First, below about 300 K the rearrangement of the electronic band structure is completed, and the FeSe system drops into a new state which is characterised by a metallic type of charge carriers scattering. In this state the Hall coefficient, , was found to be almost temperature independent down to about 250 K Sun1 ; Kar ; H2 . This, in turn, indicates the stability of the Fermi surface, which is the main feature of the normal state of any HTSC, as mentioned above. Additionally, it was found that the field-dependent magnetoresistance, ), measured under different temperatures, obeys Kohler’s law between 250 and 300 K Naz , also suggesting the stability of the Fermi surface in this temperature range. In that case the MR can be successfully scaled by , where is a function of the cyclotron frequency and the scattering time , if the scattering rate for charge carriers is equal at all points on the Fermi surface Zim . This result looks much more convincing for single crystals Sun1 and can be considered as a sign of the normal state of the system. Secondly, like in cuprates, for our samples turned out to be linear, but, as expected, in a relatively short temperature range below K. For greater certainty, we used a more accurate method of determining linearity exploring criterion , where designates the slope of the extrapolated linear dependence and corresponds to its intercept with axis 44 . Evidently, in the normal state = and [. Accordingly, the deviation from unity determines the representative temperature with an accuracy 1 K We ; S1 ; 44 .
Results of this approach are shown in the insert in Fig. 1, for sample S1 as an example. As one can see, deviates downward from the linearity both above K, due to the beginning of the reconstruction of the electron band structure, and below K, most likely due to a complex interplay between electron-like and hole-like charge carriers, which both are known to be present in FeSe compounds Sun1 ; Kar ; H2 ; Sad ; Kord ; John . It has been found that both Sun1 ; Kar ; H2 ; 300K and thermopower, Song , change their sign several times upon cooling, thereby confirming FeSe to be a compound with two types of charge carriers Sun1 ; Kar ; H2 ; Sad ; Kord ; Song . Importantly, we traditionally designate the characteristic temperature as , although the reason of changes that begin in is currently not clear Song ; Pall ; Sprau ; Ross . Ultimately, was calculated using Eq. (1) and the linear dependence shown in Fig. 1. This approach allowed us to get convincing self-consistent results, as will be presented and discussed below.
A significant part of the SC properties of HTSCs, both cuprates S2 and Fe-pnictides John ; SO , is determined by the extremely short coherence length in these compounds, , which determines the size of the Cooper pairs, both in the -plane, , and along the -axis, , which at low temperatures is smaller or comparable with the lattice parameter along this axis (S1 ; VS , and references therein). We consider , where is the coherence length at and is a reduced temperature, as defined by Eq. (3) DeGen . Near , , and the FCPs can interact in the entire sample volume, forming a 3D-state of SC fluctuations We ; S1 ; Lang ; Oh ; Vovk ; Kond2 ; VS . As a result, is extrapolated by the standard equation of the Aslamazov-Larkin (AL) theory AL with the critical exponent , which determines FLC in any 3D superconducting system:
| (2) |
as shown in Fig. 3 (dashed lines 1), where
| (3) |
is a reduced temperature and is a scaling factor used to fit the theory results to the experimental data S1 ; Oh ; Mats ; Sug . Accordingly, is a critical temperature in the mean-field approximation (, see Fig. 2) HL ; Xie , which separates the region of the SC fluctuations () from the region of the critical SC fluctuations around (where the SC order parameter VarL ), which is not taken into account in the Ginzburg-Landau (GL) theory DeGen .
Since above decreases rapidly with increasing temperature, above the characteristic temperature will become smaller than and the Josephson coupling between the FCPs along the -axis will be lost in the entire volume of the sample. But, in the temperature range from to , is still larger than , where is the distance between the inner conducting layers in the unit cell (see Fig. 3(a)), and the inner layers will remain connected by the Josephson coupling forming a 2D fluctuation state HL ; Xie ; VarL ; Varl2 . In this state is well fitted by the MT term of the HL theory HL :
| (4) |
as shown in Fig. 3 (solid curves 2) We ; Lang ; S2 . In Eq. (4),
| (5) |
is a coupling parameter and
| (6) |
is the pair-breaking parameter. Accordingly, is the mean-free path and is the phase relaxation time of the FCPs, which is determined as follows:
| (7) |
with sK S2 . Equation (7) was obtained assuming , which according to HL theory occurs at the temperature where the AL(3D)-MT(2D) crossover appears. Factor takes into account the approximation of the clean limit ) S1 ; S2 . It is worth to note that this approximation works only in well structured samples S1 ; VS . In HTSCs containing defects the contribution of MT fluctuations vanishes and above FLC is described by the Lowrence-Doniach model Oh ; HL .
As mentioned above, one more characteristic temperature of the FLC analysis is , at which the experimental results deviate downward from the theory of MT fluctuations (Fig. 3, ). This is because above , which actually limits the range of SC fluctuations from above, is lower than the distance We ; Lang ; S2 ; Xie . This, in turn, means that at all charge carriers, including the FCPs, are believed to be mainly confined within conducting As-Fe-As layers (Fe-pnictides) SO or CuO2 planes (cuprates) S2 , forming the quasi-2D conducting system S1 ; 44 ; Varl2 ; Xie ; Haus ; L ; Eng . At those temperatures, because , there is no direct interaction even between the internal conducting planes and now does not obey any conventional fluctuation theory. In the case of cuprates, this fact leads to a very unusual behavior of HTSCs observed over the wide temperature range from to , which is just called the pseudogap temperature Cor ; Kaw ; Yam ; Tal ; Kord2 . Thus, HTSCs appear to be quasi two-dimensional systems in the wide temperature range well above . In accordance with the theory, Gaussian fluctuations of the order parameter prevent any phase coherency in 2D compounds DK ; Haus ; L ; Eng . Consequently, the SC critical temperature of an ideal 2D metal is found to be zero (Mermin-Wagner-Hoenberg theorem) and a finite value is obtained only when three-dimensional effects are taken into account (see Refs. S1 ; VS ; Haus ; L ; Eng ; Tal ; Kord2 and references therein). That is why in HTSCs near , where , the three-dimensional state is realized and FLC is extrapolated by the standard 3D equation of the AL theory (Eq. (2)). This scenario is recognized as valid in the case of both cuprates S1 ; S2 and Fe-pnictides We ; SO ; S1 ; Salem ; Rey ; Ahmad ; Asiyaban .
In order to study the SC fluctuations in FeSe and examine their role in the formation of the SC state, it is proposed to calculate with Eq. (1) and plot it as a function of , and then fit the experimental data to the results predicted by fluctuation theories of AL and HL (2D MT term). But the first step in using this approach is to search for the mean-field critical temperature , which determines the reduced temperature (Eq. (3)). From Eq. (2) it is clear that near , diverges as . Consequently, becomes zero when , as (Eq. (3)) and Refs. Oh ; Bis ). Hence, in order to find , is plotted as a function of temperature for all samples studied, as shown in Fig. 2. The intersection of the linear part of each curve with axis determines the values of , which are listed in Table I. In Fig. 2, the critical temperature (taken at , as described in Ch. 3.1), , the Ginzburg temperature (taken at the deviation from the linearity), , and the 3D-2D crossover temperature, , are also shown. is a temperature which is generally accounted for by the Ginzburg criterion, which is related to the breakdown of the mean-field GL theory to describe the SC transition GL . This criterion is identified down to the lowest temperature limit for the validity of the Gaussian fluctuation region DeGen ; GL ; Kap . In Fig. 3, corresponds to the value marked ln().
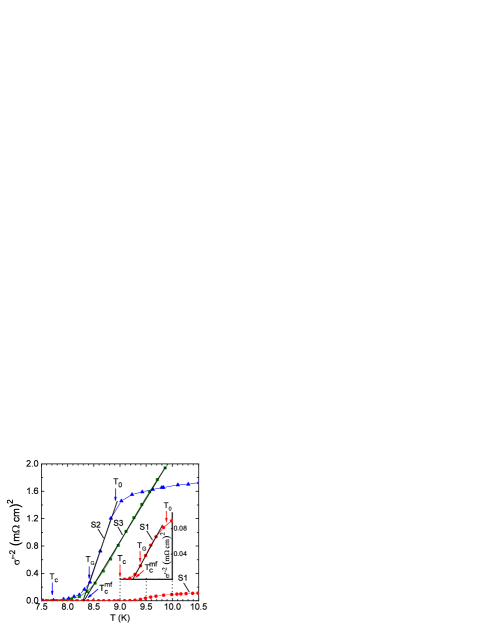
It is worth noting that the linear part of every curve in Fig. 2, extrapolated by a straight line at , corresponds to the temperature range where 3D AL fluctuations are present We ; S2 ; HL ; Xie ; VS . Above , where , the data deviate from the line, suggesting the contribution of 2D MT fluctuations S1 ; HL ; Xie , as will be discussed below in detail. In Fig. 3 this temperature corresponds to the value marked ln(). Evidently, at the coherence length is expected to amount to S2 ; Mats ; Sug ; HL , which yields:
| (8) |
and allows one to determine , which is one of the important parameters in the FLC analysis S1 ; Lang ; HL ; Xie ; VS . Importantly, it was found that the temperature of the 3D-2D crossover at (Fig. 3), and hence the value of , is independent on the choice of the normal state from which the linear part of is extrapolated to lower temperatures, so both and represent reliable values.
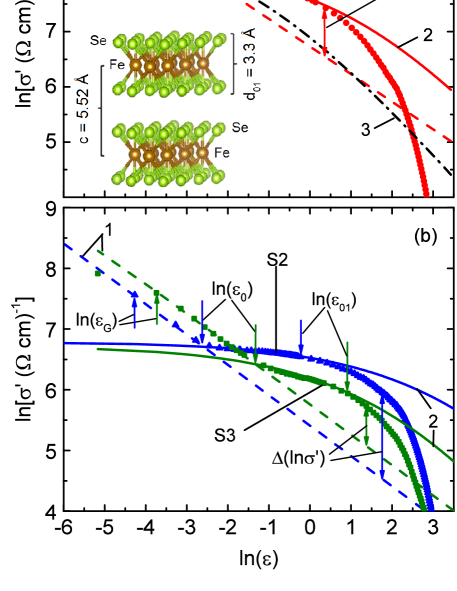
The excess conductivities of FeSe0.94 samples, derived from the resistivity measurements by means of Eq. (1), are plotted in Fig. 3 as a function of in double logarithmic scale. The experimental results (symbols) were fitted by the theoretical curves according with Eq. (2) (dashed lines) and Eq. (4) (solid curves). Results obtained for the Ag-doped sample (S1, dots in Fig. 3(a)) will be considered in details as an example. In agreement with the performed considerations, above K (from ln) and up to K (from ln), ln versus ln is expectedly well fitted by the 3D fluctuation term of the AL theory (Eq. (2)) with Å, as determined by Eq. (8) and with (Table I). By analogy with cuprates, to find we used Å and put , as obtained from ln. It should be emphasized that, despite the fact that FeSe lattice parameters are considered to be well established Kar ; Sad2 ; Bolg ; Sad22 , the value of the lattice parameter of the -axis used in the FLC analysis is still somewhat doubtful.
There is definite contradiction between stated in Chapter 2 Å and taken by us Å. As well as in all other Fe-based superconductors, the charge carrier transport in FeSe is assumed to be realized within the conducting Se-Fe-Se layers Kord ; Sad ; Sad2 . However, any such a layer alone can’t be superconducting and one needs more layers connected by SC correlations along the -axis to observe superconductivity: two layers to obtain the 2D state and at least three layers to observe the 3D state near , which is necessary to ensure a SC transition Xie ; Khas . Thus, it is clear that Å determines just the -axis lattice parameter of the ”superconducting unit cell”, whereas Å corresponds to the distance between the adjacent Fe layers. In Ref. Kord it is claimed that for FeSe-based superconductors, the photon energy dependence of the experimentally measured Fermi surface supports the idea of doubling of the unit cell along the -axis, thus confirming our approach to take Å.
For high- superconductors, the coherence length in the -plane is (10-15) VS ; S2 ; Oh ; Mats ; Sug . Taking Å, as derived above (Table I, S1), and Å, as obtained from magnetic measurements in our previous work Bolg , we have , which implies our estimation of to be correct. Moreover, Å, found for our FeSe sample, is approximately the same as obtained for EuFeAsO0.85F0.15 with K ( Å) SO and about 2 times larger than that received for SmFeAsO0.85 with K ( Å) Sm . This is not surprising, since we assume that , with regard to the BCS ratio DeGen . In other words, the lower the higher both and, respectively, , in accordance with our results. Both and the corresponding , as well as other parameters, have been found in the same way for other samples and are summarized in Table I.
Figure 3 shows that above the measured deviates noticeably upward from the linear dependence of the 3D AL theory (Eq. (2), dashed lines 1), which indicates the appearance of 2D MT fluctuations. So the 3D state is lost, however and the inner conducting layers are still connected by the Josephson coupling forming a state with 2D fluctuations as explained above and in Refs. HL ; Xie ; VarL . As a result, is well approximated by Eq. (4) (solid curves 2 in Fig. 3) up to , which for sample S1 is equal to 19 K (from ln. It is worth to emphasize that K is approximately double , in good agreement with results reported in Refs. Kas ; Naid .
| Sample | (25K) | ln | ||||||||||
|---|---|---|---|---|---|---|---|---|---|---|---|---|
| (mcm) | (K) | (K) | (K) | (K) | (K) | (K) | (-) | (Å) | (Å) | (Å) | (-) | |
| S1 | 0.50 | 9.0 | 9.25 | 9.4 | 9.9 | 19 | 9.6 | 3.04 | 2.8 | 34 | 2.7 | 0.90 |
| S2 | 1.00 | 7.7 | 8.31 | 8.4 | 8.9 | 15 | 6.6 | 0.87 | 2.9 | 43 | 3.2 | 1.42 |
| S3 | 1.47 | 7.8 | 8.32 | 8.5 | 10.5 | 29 | 20.5 | 2.40 | 5.6 | 36 | 3.6 | 0.66 |
Taking into account the considerations presented, one may conclude that and, in accordance with and Eq. (8), the following equality is met: . As far as both and have been determined, and besides Å, simple algebra yields: Å for S1 (Table I). In Fe pnictides, Å is the distance between As atoms in the conducting As-Fe-As layers Sm ; Ni ; J . By analogy with the Fe pnictides, in FeSe is expected to be the distance between Se atoms in the conducting Se-Fe-Se layers. Thus, Å is consistent with the crystal structure shown in the insert of Fig. 3. It is important to notice that in order to get the proper MT fit we have to put instead of into Eqs. (4-6) and instead of into Eq. (7) to calculate . Otherwise, using Eq. (4) we obtain the curve which does not fit the experimental results (dash-dotted curve in Fig. 3(a)) and characterizes non-magnetic cuprates S1 ; S2 . Therefore, this means that above FeSe exhibits an increased contribution of 2D FLC, which seems to be characteristic for magnetic superconductors We ; SO ; Sm , where fluctuations of magnetic moments are present Ross . However, as in cuprates, (Eq. (6)), which implies that all FLC parameters are defined properly S1 ; S2 . Finally, using Eq. (7) and assuming that Mats we get sK, and for K, we obtain s (S1, Table II).
The corresponding ln(ln) dependencies obtained for samples S2 and S3 are also shown in Fig. 3. Near , both dependencies are well fitted by Eq. (2) of the 3D AL approach, which implies the formation of the three-dimensional state at these temperatures. Above , which in the Figure is denoted as ln, the superconductors drop into the 2D state, and ln(ln) is now well fitted by the 2D MT term according to Eq. (4). Finally, above (ln in the Figure), the ln(ln) dependencies deviate downward from the prediction of the theory demonstrating behavior similar to that observed for sample S1. However, the ln(ln) curves show several differences, which are believed to arise from different samples’ compositions and/or preparation methods, as it was also concluded in Ref. Ross .
Analyzing the transport properties of our samples we found that the resistivity of sample S3 is at low temperatures about three times larger than that of sample S1 (see Fig. 1 and Table I), however both samples were prepared similarly by partial melting. At the same time, the fluctuation conductivity of S3 is about three times smaller than that of S1 (see Fig. 3). Despite the fact that S3 contains traces of the non-superconducting phases, it shows a very good fit of the experimental results to relations predicted by the theory in both 3D and 2D fluctuation regions, as presented in Fig. 3. Importantly, all three characteristic temperatures, , and , are clearly marked in the ln(ln) curve. Comparing to sample S1, and for S3 are significantly shifted towards higher temperatures, probably due to the increased range of 3D fluctuations, which is and 2.0 K, for S1 and S3, respectively. This leads to extremely high K (from ln in Fig. 3), showing that in S3 the range of SC fluctuations extends to temperatures about 3.7 times larger than K. Thus, one may conclude that various inhomogeneities, for example, traces of non-superconducting phases, not only increase the resistivity but also the range of SC fluctuations above . It seems to be reasonable if one assumes the existence of gossamer-like high-temperature superconductivity, which could appear in a form of disconnected superconducting islands, as was observed in FeSe by Sinchenko, , Goss . With this approach, it is believed that inhomogeneous superconductivity in FeSe may appear below K, much above K, most likely in the form of SC fluctuations, as we have found for our samples.
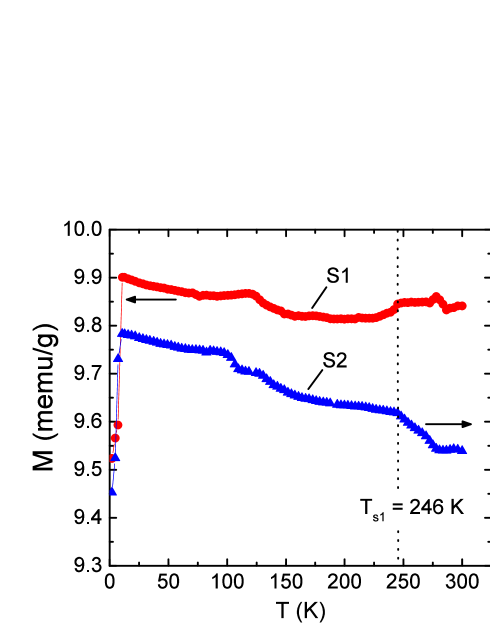
In the case of sample S2, prepared by the SSR method, the excess conductivity in the region of 3D AL fluctuations is smaller than that determined for S3 (see Fig. 3), however it is markedly larger in the region of 2D MT fluctuations resulting in the largest , which is characteristic of magnetic superconductors We ; SO ; Sm . Thus, for sample S2, one may conclude, that the increased contribution of 2D fluctuations is due to enhanced magnetic interaction. For greater confidence, we have measured the temperature dependence of the magnetisation, , for samples S1 and S2, and the results are shown in Fig. 4. For both curves, a clear anomaly has been observed at K, which corresponds to the mentioned less known structural or (less possible) magnetic transition present in FeSe compounds GnRef ; Gnesd . Interestingly, close to this temperature, the Hall resistance changes its sign to negative Sun1 . All these facts provide an additional argument to choose the particular state of FeSe above as the normal state of the sample, which is the reference state for calculation of the excess conductivity.
There are several differences in the dependencies observed for samples S1 and S2. Below , the magnetization for S1 changes more subtle than for S2. Namely, the increase in in the range from down to is for S2 about 3 times larger than for S1. This observation is consistent with the enhanced magnetic fluctuations in S2, as revealed in the FLC analysis, and supports the statement that the samples properties strongly depend on the sample preparation method. The enhanced magnetic fluctuations may lead to a rather specific shape of the experimental ln(ln curve, which for sample S2 is almost parallel to the axis in the 2D fluctuation range (Fig. 3).
Fitting the experimental ln(ln data for sample S2 by Eq. (4) allows us to determine ln (Fig. 3, K), and this yields Å in good agreement with the width of the Se-Fe-Se layer (see insert in Fig. 3). Here, Å has been independently determined by the 3D-2D (AL-MT) crossover temperature K (from ln), in a similar way as for samples S1 and S3. This value of results in a reasonable anisotropy of the coherence length, expressed by the ratio .
Smaller values of the anisotropy were found from the measurements of , namely Farrar , Shiogai and Her , indicating that the exact values of the anisotropy and their interrelationships are still under discussion.
The range of the SC fluctuations extends to the temperature K, which gives a ration and is still about two times higher than , comparable to the results obtained for S1 () and S3 (3.7). Finally, taking into account the characteristic temperatures we discussed, the parameters , , ln and were determined for all samples and are listed in Tables I and II.
| Sample | (25K) | K) | K) | K) | K) | K) | ||||
| (cm) | (10cm) | (cm/Vs) | (cm) | cm/s) | (-) | s) | s) | (-) | s) | |
| S1 | 1520 | 0.57 | 7.2 | 9.4 | 0.19 | 12.2 | 0.50 | 1.14 | 0.33 | |
| S2 | 870 | 0.57 | 12.6 | 16.4 | 0.32 | 7.3 | 0.52 | 1.47 | 0.46 | |
| S3 | 3530 | 0.57 | 3.1 | 4.1 | 0.17 | 13.3 | 0.24 | 0.48 | 0.14 | |
| F1 | 147(100K) | 2.55 | 16.6 | 48.5 | 1.17 | 4.7 | 0.42 | 15.1 | 4.5 |
3.3. Phase relaxation time comparative analysis
Having determined the FLC parameters it would be interesting to consider physical implication of the short coherence length within a simple two-dimensional free-carrier picture Mats ; Sug ; S3 . The approach allows to derive a set of additional important samples’ parameters including , which is actually the lifetime of the FCPs in the range of SC fluctuations. In HTSCs all parameters, including and , are functions of temperature. In the literature, the corresponding samples’ parameters are usually calculated at temperatures above but not far from , e.g. in YBCO at 100 K S3 . By analogy, we will perform our calculations at 25 K, which is just above the SC fluctuation region in FeSe0.94. Since has been already obtained Bolg (Table I), to calculate , and then to get using the value of (Table II), we need to know the mean free path, , which can be found from Mats . For FeSe single crystals, corresponding is reported in Refs. Sun1 ; H2 . However, most likely due to different ways of the single crystals preparation, (25K) and m3/C have been obtained in Sun1 and H2 , respectively. Eventually, we make use of average (25K) m3/C to roughly estimate all required parameters. As an example, we will analyze in details results obtained for sample S1, which has the best structural and superconducting properties Bolg ; Galluz .
In systems with a complicated charge-carrier scattering mechanism the charge-carrier density may be expressed as Sze . Here is the electron charge and the coefficient /, where determines the scattering mechanism in the normal state, as described before. Then, using the aforementioned value of (25K) m3/C, we obtain for sample S1: cm-3 (). This value of , together with the corrected resistivity (25K)cm Mats ; Sug , results in the mobility of Hall carriers cm2/Vs. Hence, the mean free path () at 25 K is estimated, K Å, from the relation with cm cm cm-2, similarly as it was done in Ref. S3 . In the general theory of superconductivity, DeGen , where is the SC order parameter at K. Since for HTSCs, S1 ; Yam ; Kord2 ; Sta , where is a pseudogap parameter, taking (S1) (4.6 for S2, and 3.0 for S3) S-New and setting Mats we have obtained the Fermi velocity cm/s, the scattering time (transport) for normal carriers (25K) s, and an effective carrier mass of . Finally, we have derived K and using (25K) s (found in the FLC analysis) we have obtained (25K) s, surprisingly in good agreement with the result for the well-structured YBCO film with K, in Table II marked as F1 S3 . Using the same approach as above, the set of corresponding parameters was calculated for other two samples, S2 and S3, and all these parameters are listed in Table II.
The result, that the transport mean free path is noticeably smaller than the in-plane coherence length (e.g., for S1, ) implies that, unlike cuprates, FeSe is the type-II superconductor in the dirty rather than in the clean limit. Importantly, most of the parameters derived for the FeSe samples differ markedly from those observed for the well-structured YBCO film (Table II, sample F1). Most of them are smaller than those found for the film, namely: (F1)/(S1) , (F1)/(S1) , (F1)/(S1) , and (F1)/(S1) . Note, that Fermi velocity cm/s, which is large but still lower than that observed for the YBCO film (F1), has been reported for an FeSe single crystal with 9.0 K Sun1 . At the same time, the effective mass of the charge carriers for sample S1, (S1), which, importantly, does not depend on , turned out to be markedly larger than that for the YBCO film, namely, (S1)(F1). These results indicate a profound difference in transport properties between FeSe and cuprates. But, despite all the differences discussed above, a rather interesting and surprising result has been obtained for the transport relaxation time of normal carriers () and, more importantly, the phase relaxation time of FCPs (). Both and turned out to be very similar for the FeSe samples and the YBCO film (Table II).
Results concerning the relaxation time allow us to infer that the SC fluctuations may have similar nature and roughly a similar temperature range () in different types of HTSCs. For our FeSe samples (Table I), extends from 9.6 K (S1) to 20.5 K (S3), which corresponds well with K in the YBCO film (F1) S1 ; S2 and with changes from 7 to 16 K in PrBCO-YBCO superlattices and heterostructures We .
Accordingly, K and K are reported in Ref. Grb , for the nearly optimally doped ( K) and deeply underdoped ( K) YBCO single crystals, respectively. Thus, we conclude that the SC fluctuations ranges from about 10 to about 20 K above in many different HTSCs. It has to be noted that sample S2, prepared by the SSR method, somehow drops out of the common picture. Indeed, it has the largest , , and , but the lowest resistivity and effective carrier mass of . However, despite all the differences and the fact that S2 has the smallest K, the phase relaxation time (25K) s has been determined, in good agreement with the results obtained for other samples.
CONCLUSION
For the first time, the fluctuation conductivity, , of FeSe0.94 samples prepared by different techniques has been analyzed within the local pair model showing that in the temperature range from to , is described by the 3D fluctuation theory of Aslamazov-Larkin (AL) AL and, in the range from to , by the 2D fluctuation theory of Hikami-Larkin (MT term) developed for HTSCs HL . Thus, as well as in cuprates, designates the range of SC fluctuations above , where the fluctuating Cooper pairs behave in good many ways like conventional superconducting pairs but without long-range ordering Ran ; PB ; Tail ; EmeryK . Importantly, in our FeSe samples the range of SC fluctuations, (Table I),was found to extend to temperatures exceeding double , which is relatively much further above than is observed for cuprates. The increased fluctuation contribution, ln (Table I), was revealed in the range of 2D MT fluctuations, i.e. between and . Such an increase seems to be characteristic of magnetic superconductors SO ; Sm and this indicates a marked increase of magnetic interactions in FeSe as compared with non-magnetic YBCO. Nevertheless, as in cuprates, AL-MT (3D-2D) crossover at is observed for all our samples. This allows us to determine a set of parameters which are important for fluctuation conductivity, such as the coherence length along the -axis, Å, the distance between the Se atoms in the Se-Fe-Se conducting layer, Å, and the phase relaxation time for fluctuating Cooper pairs, K) s. It should be noted that for all samples, the values of (Table I) are in good agreement with the results of structural studies.
Having determined the fluctuation conductivity parameters and using (25K) we calculated a set of additional important properties of FeSe (Table II) within a simple two-dimensional free-carrier model Mats ; S3 . Eventually, rather unexpected results were obtained. Namely, the phase relaxation time turned out to be practically the same for FeSe samples having different values of other parameters, and even for YBCO films (Table II). This result, in turn, means that the range of SC fluctuations, , should be similar in different types of HTSCs. And indeed, for our samples, ranges from 9.6 K (sample S1) up to 20.5 K (sample S3) (Table I) and, correspondingly, is equal to 9.2 K for YBCO film (F1), and ranges from 7.0 to 16 K for YBCO-PrBCO superlattices and heterostructures studied previously We . Accordingly, and 23 K is reported in Ref. Grb , for the nearly optimally doped ( 89 K) and deeply underdoped ( 57 K) YBCO single crystals, respectively. Moreover, similar temperature ranges of SC fluctuations have been found for FeAs-based compounds, K for SmFeAsO0.85 Sm , and K for EuFeAsO0.85F0.15 SO . All these results show that the range of SC fluctuations in many different types of HTSCs extends from about 5 to 25 K and that is not proportional to .
It is worth noting that sample S2, prepared by the solid state reaction method, has some parameters significantly different than the other two samples. Indeed, it has a much larger , , and and much smaller resistivity and effective mass of charge carriers, (Table II). But, in spite of that and the fact that sample S2 has the smallest K, (25K) s is determined in line with the results obtained for all other samples. This means that the phase relaxation time, which is the life time of the fluctuating Cooper pairs, is not the only parameter which determines the properties of SC fluctuations in FeSe and, additionally, that the properties strongly depend on the method of sample preparation.
Summing up the results presented in Table I and Table II, we can conclude that, somewhat unexpectedly, the Fermi velocity and rather large effective mass of charge carriers do not markedly affect the lifetime of the fluctuating Cooper pairs in the region of SC fluctuations between and . However, the question what happens with the fluctuating Cooper pairs above still remains open.
The curves (Fig. 1 and Refs. Kar ; Kas ; Ross ) and Sun1 ; H2 do not show any characteristic features (anomalies) in the temperature range from to K and this seems to imply that the local pairs in FeSe may exist at least up to Song ; Pall ; Ross .
To test this assumption and to study the role of the possible local pairs formation at , additional extended research will need to be performed.
ACKNOWLEDGMENTS
This work is partially conducted in the frame of Polish-Bulgarian and Polish-Ukrainian inter-academic research projects.
References
- (1) S. Rößler, C-L. Huang, L. Jiao, C. Koz, U. Schwarz, and S. Wirth, Phys. Rev. B 97, 094503 (2018).
- (2) Y. Sun, S. Pyon, and T. Tamegai, Phys. Rev. B 93, 104502 (2016).
- (3) S. Karlsson, P. Strobel, A. Sulpice, C. Marcenat, M. Legendre, F. Gay, S. Pairis, O. Leynaud, and P. Toulemonde, Supercond. Sci. Technol. 28, 105009 (2015).
- (4) J. P. Sun, G. Z. Ye, P. Shahi, J.-Q. Yan, K. Matsuura, H. Kontani, G. M. Zhang, Q. Zhou, B. C. Sales, T. Shibauchi, Y. Uwatoko, D. J. Singh, and J.-G. Cheng, Phys. Rev. Lett. 118, 147004 (2017).
- (5) D. C. Johnston, Adv. Phys. 59, 803 (2010).
- (6) I. A. Nekrasov, N. S. Pavlov, M. V. Sadovskii, and A. A. Slobodchikov, Low Temp. Phys. 42, 1137 (2016).
- (7) Yu. V. Pustovit, and A. A. Kordyuk, Low Temp. Phys. 42, 995 (2016).
- (8) I. I. Mazin, D. J. Singh, M. D. Johannes, and M. H. Du, Phys. Rev. Lett. 101, 057003 (2008).
- (9) F. Wang and D.-H. Lee, Science 332, 200 (2011).
- (10) S. Kasahara, T. Yamashita, A. Shi, R. Kobayashi, Y. Shimoyama, T. Watashige, K. Ishida, T. Terashima, T Wolf, F. Hardy, C. Meingast, H. v. Löhneysen, A. Levchenko, T. Shibauchi, and Y. Matsuda, Nature Communications, 7, 12843, (2016).
- (11) A. L. Solovjov, L. V. Omelchenko, V. B. Stepanov, R. V. Vovk, H.-U. Habermeier, H. Lochmajer, P. Przyslupski, and K. Rogacki, Phys. Rev. B 94, 224505 (2016).
- (12) C.-J. Liu, A. Bhaskar, H.-J. Huang, and F.-H. Lin, Appl. Phys. Lett. 104, 252602 (2014).
- (13) Y. Ando, S. Komiya, K. Segawa, S. Ono, and Y. Kurita, Phys. Rev. Lett. 93, 267001 (2004).
- (14) M. V. Sadovskii, Physics-Uspekhi 51, 1201 (2008).
- (15) A. L. Solovjov, L.V. Omelchenko, A.V. Terekhov, K. Rogacki, R. V. Vovk, E. P. Khlybov, and A. Chroneos, Mater. Res. Express 3, 076001 (2016).
- (16) E. Pomjakushina, K. Conder, V. Pomjakushin, M. Bendele, and R. Khasanov, Phys. Rev. B 80, 024517 (2009).
- (17) S. Medvedev, T. M. McQueen, I. A. Troyan, T. Palasyuk, M. I. Eremets, R. J. Cava, S. Naghavi, F. Casper, V. Ksenofontov, G. Wortmann, and C. Felse, Nat. Mater. 8, 630 (2009).
- (18) Y. Mizuguchi and Y. Takano, J. Phys. Soc. Jpn. 79, 102001 (2010).
- (19) M. H. Fang, H. M. Pham, B. Qian, T. J. Liu, E. K. Vehstedt, Y. Liu, L. Spinu, and Z. Q. Mao, Phys. Rev. B 78, 224503 (2008).
- (20) L. Sun, X.-J. Chen, J. Guo, P. Gao, Q.-Z. Huang, H. Wang, M. Fang, X. Chen, G. Chen, Q. Wu, C. Zhang, D. Gu, X. Dong, L. Wang, Ke Yang, A. Li, X. Dai, Ho-kwang Mao, and Z. Zhao, Nature 483, 67 (2012).
- (21) J.-F. Ge, Z.-L. Liu, C. Liu, C.-L. Gao, D. Qian, Q.-K. Xue, Y. Liu, and J.-F. Jia, Nat. Mater. 14, 285 (2015).
- (22) Q.-Y. Wang, Z. Li, W.-H. Zhang, Z.-C. Zhang, J.-S. Zhang, W. Li, H. Ding, Y.-B. Ou, P. Deng, and K. Chang, Chin. Phys. Lett. 29, 037402 (2012).
- (23) D. Liu, W. Zhang, D. Mou, J. He, Y.-B. Ou, Q.-Y. Wang, Z. Li, L. Wang, L. Zhao, S. He, Y. Peng, X. Liu, C. Chen, L. Yu, G. Liu, X. Dong, J. Zhang, C. Chen, Z. Xu, J. Hu, X. Chen, X. Ma, Q. Xue, and X. J. Zhou, Nat Commun 3, 931 (2012).
- (24) I. Bozovic and C. Ahn, Nat. Phys. 10, 892 (2014).
- (25) P. L. Bach, S. R. Saha, K. Kirshenbaum, J. Paglione, and R. L. Greene, Phys. Rev. B 83, 212506 (2011).
- (26) C. W. Luo, I. H. Wu, P. C. Cheng, J.-Y. Lin, K. H. Wu, T. M. Uen, J. Y. Juang, T. Kobayashi, D. A. Chareev, O. S. Volkova, and A. N. Vasiliev, Phys. Rev. Lett. 108, 257006 (2012).
- (27) V. Gnezdilov, Yu. G. Pashkevich, P. Lemmens, D. Wulferding, T. Shevtsova, A. Gusev, D. Chareev, and A. Vasiliev, Phys. Rev. B 87, 144508 (2013).
- (28) T. M. McQueen, A. J. Williams, P. W. Stephens, J. Tao, Y. Zhu, V. Ksenofontov, F. Casper, C. Felser, and R.J. Cava, Phys. Rev. Lett. 103, 057002 (2009).
- (29) E. Nazarova, N. Balchev, K. Nenkov, K. Buchkov, D. Kovacheva, A. Zahariev, and G. Fuchs, Supercond. Sci. Technol. 28, 025013 (2015).
- (30) A. Galluzzi, M. Polichetti, K. Buchkov, E. Nazarova, D. Mancusi, and S. Pace, Supercond. Sci. Technol. 30, 025013 (2017).
- (31) A. I. Coldea and M. D. Watson, Annu. Rev. Condens. Matter Phys. 9, 125 (2018).
- (32) P. Massat, D. Farina, I. Paul, S. Karlsson, P. Strobel, P. Toulemonde, M.-A. Measson, M. Cazayous, A. Sacuto, S. Kasahara, T. Shibauchi, Y. Matsuda, and Y. Gallais, Appl. Phys. Sci. 113, 9177 (2016).
- (33) M. D. Watson, T. K. Kim, A. A. Haghighirad, N. R. Davies, A. McCollam, A. Narayanan, S. F. Blake, Y. L. Chen, S. Ghannadzadeh, A. J. Schofield, M. Hoesch, C. Meingast, T. Wolf, and A. I. Coldea, Phys. Rev. B 91, 155106 (2015).
- (34) M. D.Watson, T. Yamashita, S. Kasahara, W. Knafo, M. Nardone, J. Bárd, F. Hardy, A. McCollam, A. Narayanan, S. F. Blake, T. Wolf, A. A. Haghighirad, C. Meingast, A. J. Schofield, H. v. Lǒhneysen, Y. Matsuda, A. I. Coldea, and T. Shibauchi, Phys. Rev. Lett. 115, 027006 (2015)
- (35) M. Randeria, Nature Phys. 6, 561 (2010).
- (36) W. Lang, G. Heine, P. Schwab, X. Z. Wang, and D. Bauerle, Phys. Rev. B 49, 4209 (1994).
- (37) A. L. Solovjov, in Superconductors - Materials, Properties and Applications, edited by A. Gabovich (InTech, Rijeka, 2012), Chap. 7, pp. 137-170.
- (38) M. S. Grbić, M. Požek, D. Paar, V. Hinkov, M. Raichle, D. Haug, B. Keimer, N. Barišić, and A. Dulčić, Phys. Rev. B 83, 144508 (2011).
- (39) J. Corson, R. Mallozzi, and J. Orenstein, J. N. Eckstein, and I. Bozovic, Nature (London) 398, 221 (1999).
- (40) K. Kawabata, S. Tsukui, Y. Shono, O. Michikami, H. Sasakura, K. Yoshiara, Y. Kakehi, and T. Yotsuya, Phys. Rev. B 58, 2458 (1998).
- (41) Y. Yamada, K. Anagawa, T. Shibauchi, T. Fujii, T. Watanabe, A. Matsuda, and M. Suzuki, Phys. Rev. B 68, 054533 (2003).
- (42) V. J. Emery and S. A. Kivelson, Nature (London) 374, 434 (1995).
- (43) P. G. DeGennes, Superconductivity of Metals and Alloys, W. A. Benjamin Inc., New York, Amsterdam, 1996, p. 280.
- (44) T. Timusk and B. Statt, Rep. Prog. Phys.62, 161, (1999).
- (45) L. Taillefer, Annu. Rev. Condens. Matter Phys. 1, 51 (2010).
- (46) S. Dzhumanov, E. X. Karimboev, U. T. Kurbanov, O. K. Ganiev, and Sh. S. Djumanov, Superlattices and Microstructures (Elsevier) 68, 6 (2014).
- (47) Y. J. Song, J. B. Hong, B. H. Min, K. J. Lee, M. H. Jung, J.-S. Rhyee, and Y. S. Kwon, J. of the Korean Phys. Soc. 59, 312 (2011).
- (48) I. Pallecchi, M. Tropeano, C. Ferdeghini, G. Lamura, A. Martinelli, A. Palenzona, and M. Putti, J Supercond Nov Magn 24, 1751 (2011).
- (49) P. O. Sprau, A. Kostin, A. Kreisel, A. E. Böhmer, V. Taufour,P. C. Canfield, S. Mukherjee, P. J. Hirschfeld, B. M. Andersen, and J. C. Séamus Davis, Science357,75(2017).
- (50) Y. Matsuda, T. Hirai, S. Komiyama, T. Terashima, Y. Bando, K. Iijima, K. Yamamoto, and K. Hirata, Phys. Rev. B 40, 5176 (1989).
- (51) J. Sugawara, H. Iwasaki, N. Kabayashi, H. Yamane, and T. Hirai, Phys. Rev. B 46, 14818 (1992).
- (52) A. L. Solovjov and V. M. Dmitriev, Low Temp. Phys. 35, 169 (2009).
- (53) P. Rani, A. Pal, and V. P. S. Awana, Physica C 497, 19 (2014).
- (54) R. Mawassi, S. Marhaba, M. Roumie, R. Awad, M. Korek, and I. Hassan, J. Supercond. Nov. Magn. 27, 1131 (2014).
- (55) K. Fabitha, M. S. Ramachandra Rao, M. Muralidhar, K. Furutani, and M. Murakami, J Supercond Nov Magn., DOI 10.1007/s10948-017-4117-2, (2017).
- (56) Q-P. Ding, T. Prombood, Y. Tsuchiya, Y. Nakajima, and T. Tamegai, Supercond. Sci. Technol. 25, 035019 (2012).
- (57) M. Migita, Y. Takikawa, K. Sugai, M. Takeda, M. Uehara, T. Kuramoto, Y. Takano, Y. Mizuguchi, and Y. Kimishima, Physica C 484, 66 (2013).
- (58) E. Nazarova, K. Buchkov, S. Terzieva, K. Nenkov, A. Zahariev, D. Kovacheva, N. Balchev, and G. Fuchs, J. Supercond. Nov. Magn. 28, 1135 (2015).
- (59) N. Chen, Z. Ma, Y. Liu, X. Li, Q. Cai, H. Li, and L. Yu, Journal Alloys Compd 588, 418 (2014).
- (60) Alaska Subedi, L. Zhang, D. J. Singh, and M. H. Du, Phys. Rev. B 78, 134514 (2008).
- (61) Y. Mizuguchi and Y. Takano, J. Phys. Soc. Jpn. 79, 102001 (2010).
- (62) H. Yang, G. Chen, X. Zhu, J. Xing, and H.-H. Wen, Pys. Rev. B 96, 064501 (2017).
- (63) H. Lei, R. Hu, and C. Petrovic, Phys. Rev. B 84, 014520 (2011).
- (64) R. Peters and J. Bauer, Phys. Rev. B 92, 014511 (2015).
- (65) B. P. Stojkovic and D. Pines, Phys. Rev. B 55, 8576 (1997).
- (66) S. Badoux, W. Tabis, F. Laliberte, G. Grissonnanche, B. Vignolle, D. Vignolles, J. Beard, D. A. Bonn, W. N. Hardy, R. Liang, N. Doiron-Leyraud, L. Taillefer, and C. Proust, Nature (London) 531, 210 (2016).
- (67) Ilya Ivantsov, Alvaro Ferraz, and Evgenii Kochetov, Phys. Rev. B 98, 214511 (2018).
- (68) H. Alloul, T. Ohno, and P. Mendels, Phys. Rev. Lett. 63, 1700 (1989).
- (69) T. Kondo, A. D. Palczewski, Y. Hamaya, T. Takeuchi, J. S. Wen, Z. J. Xu, G. Gu, and A. Kaminski, Phys. Rev. Lett. 111, 157003 (2013).
- (70) R. V. Vovk and A. L. Solovjov, Low Temp. Phys. 44, 111 (2018).
- (71) B. Oh, K. Char, A. D. Kent, M. Naito, M. R. Beasley, T. H. Geballe, R. H. Hammond, A. Kapitulnik, and J. M. Graybeal, Phys. Rev. B 37, 7861 (1988).
- (72) R. V. Vovk, G. Ya. Khadzhai, I. L. Goulatis, and A. Chroneos, Phys. B (Amsterdam, Neth.) 436, 88 (2014).
- (73) T. Kondo, Y. Hamaya, A. D. Palczewski, T. Takeuchi, J. S. Wen, Z. J. Xu, G. Gu, and J. Schmalian, Nat. Phys. 7, 21 (2011).
- (74) E. Nazarova, N. Balchev, K. Buchkov, K. Nenkov, D. Kovacheva, D. Gajda, and G. Fuchs, in High-Temperature Superconductors: Occurrence, Synthesis and Applications, edited by M. Miryala and M. R. Koblischka (Nova Science Publishers, ISBN: 978-1-53613-341-7, April 2018), Chap. 8, pp. 195-212.
- (75) J. M. Ziman, Electrons and Phonons, Classics Series (Cambridge University Press, Cambridge, UK, 2001).
- (76) E. V. L. de Mello, M. T. D. Orlando, J. L. Gonzalez, E. S. Caixeiro, and E. Baggio-Saitovich, Phys. Rev. B 66, 092504 (2002).
- (77) A. L. Solovjov, H-U. Habermeier, and T. Haage, Low Temp. Phys. 28, 99 (2002).
- (78) L. G. Aslamazov and A. L. Larkin, Phys. Lett. A 26, 238 (1968).
- (79) S. Hikami and A. I. Larkin, Mod. Phys. Lett. B 2, 693 (1988).
- (80) Y. B. Xie, Phys. Rev. B 46, 13997 (1992).
- (81) A. Larkin and A. Varlamov, in Theory of fluctuations in superconductors, Oxford University Press, USA, 2005, p. 552.
- (82) A. A. Varlamov, A. Galda, and A. Glatz, Rev. Mod. Phys, 90, 015009 (2018).
- (83) R. Haussmann, Phys. Rev. B 49, 12975 (1994).
- (84) V. M. Loktev, Low Temp. Phys. 22, 490 (1996).
- (85) J. R. Engelbrecht, A. Nazarenko, M. Randeria, and E. Dagotto, Phys. Rev. B 57, 13406 (1998).
- (86) J. L. Tallon, F. Barber, J. G. Storey, and J.W. Loram, Phys. Rev. B 87, 140508(R) (2013).
- (87) A.A. Kordyuk, Low Temp. Phys. 41, 319 (2015).
- (88) S. Salem-Sugui Jr, A. D. Alvarenga, R. I. Rey, J. Mosqueira, H-Q. Luo, and X-Y. Lu, Supercond. Sci. Technol. 26, 125019 (2013).
- (89) R. I. Rey, A. Ramos-Álvarez, C. Carballeira, J. Mosqueira, F. Vidal, S. Salem-Sugui Jr, A. D. Alvarenga, Rui Zhang, and Huiqian Luo, Supercond. Sci. Technol. 27, 075001 (2014).
- (90) D. Ahmad, W. J. Choi, D. Sóñora, Yoon Seok Oh, J. Mosqueira, Tuson Park, and Yong Seung Kwon, Sci. Rep. 8, 8556 (2018).
- (91) M. Asiyaban, S. R. Ghorbani, S. N. Mirnia, and X. L. Wang, J. Supercond. Nov. Magn. 33, 2535 (2020).
- (92) M. R. Beasley, Physica B 148, 191 (1987).
- (93) V. L. Ginzburg and L.D. Landau, JETP 20, 1064 (1950).
- (94) A. Kapitulnik, M. R. Beasley, C. Castellani, and C. DiCastro, Phys. Rev. B 37, 537 (1988).
- (95) R. Khasanov, K. Conder, E. Pomjakushina, A. Amato, C. Baines, Z. Bukowski, J. Karpinski, S. Katrych, H.-H. Klauss, H.Luetkens, A. Shengelaya, and N. D. Zhigadlo, Phys. Rev. B 78, 220510(R) (2008).
- (96) A. L. Solovjov, S. L. Sidorov, V. Yu. Tarenkov, and A. I. D’yachenko, Low Temp. Phys. 35, 826 (2009).
- (97) Yu. G. Naidyuk, G. Fuchs, D. A. Chareev, and A. N. Vasiliev, Phys. Rev. B 93, 144515 (2016).
- (98) N. Ni, J. M. Allred, B. Chan, and R. J. Cava, Proc. Natl Acad. Sci. 108, E1019 (2011).
- (99) S. Jiang, et al., Phys. Rev. B 93, 054522 (2016).
- (100) A.A. Sinchenko, P.D. Grigoriev, A.P. Orlov, A.V. Frolov, A. Shakin, D.A. Chareev, O.S. Volkova, and A.N. Vasiliev, Phys. Rev. B 95, 165120 (2017).
- (101) Liam S. Farrar, Matthew Bristow, Amir A. Haghighirad, Alix McCollam, Simon J. Bending, and Amalia I. Colde, npj Quantum Materials 5, 29 (2020).
- (102) Junichi Shiogai, Shojiro Kimura, Satoshi Awaji, Tsutomu Nojima, and Atsushi Tsukazaki, Phys. Rev. B 97, 174520 (2018).
- (103) J. L. Her, Y. Kohama, Y. H. Matsuda, K. Kindo, W-H. Yang, D. A. Chareev, E. S. Mitrofanova, O. S. Volkova, A. N. Vasiliev, and J-Y. Lin, Supercond. Sci. Technol. 28, 045013 (2015).
- (104) S. M. Sze, in Physics of Semiconductor Devices, Wiley-Interscience, New York, 1969, p. 328.
- (105) J. Stajic, A. Iyengar, K. Levin, B. R. Boyce, and T. R. Lemberger, Phys. Rev. B 68, 024520 (2003).
- (106) A. L. Solovjov, E. V.Petrenko, L.V. Omelchenko, E. Nazarova, K. Buchkov, and K. Rogacki, Low Temp. Phys. 46, 538 (2020).