The Cosmic Ultraviolet Baryon Survey (CUBS) II: Discovery of an H2-Bearing DLA in the Vicinity of an Early-Type Galaxy at 111Based on data gathered with the 6.5m Magellan Telescopes located at Las Campanas Observatory and the NASA/ESA Hubble Space Telescope operated by the Space Telescope Science Institute and the Association of Universities for Research in Astronomy, Inc., under NASA contract NAS 5-26555.
Abstract
We report the serendipitous detection of an H2-bearing damped Lyman- absorber at in the spectrum of the QSO J in the Cosmic Ultraviolet Baryon Survey. Spectroscopic observations from HST-COS in the far-ultraviolet reveal a damped absorber with log[(H I)/cm-2] and log[(H2)/cm-2] . The diffuse molecular gas is found in two velocity components separated by km s-1, with % of the total H2 column density concentrated in one component. At a metallicity of % of solar, there is evidence for Fe enhancement and dust depletion, with a dust-to-gas ratio . A galaxy redshift survey conducted with IMACS and LDSS-3C on Magellan reveals an overdensity of nine galaxies at projected distance proper kpc (pkpc) and line-of-sight velocity offset km s-1 from the absorber. The closest is a massive, early-type galaxy at pkpc which contains % of the total stellar mass identified at pkpc of the H2 absorber. The close proximity of the H2-bearing gas to the quiescent galaxy and the Fe-enhanced chemical abundance pattern of the absorber suggest a physical connection, in contrast to a picture in which DLAs are primarily associated with gas-rich dwarfs. This case study illustrates that deep galaxy redshift surveys are needed to gain insight into the diverse environments that host dense and potentially star-forming gas.
1 Introduction
The origin and extent of diffuse molecular gas in the circumgalactic medium (CGM) is an open question in astrophysics. The presence of circumgalactic molecules has important implications for the diversity of environments in which potentially star-forming gas is produced and/or transported. The Lyman and Werner band electronic transitions of H2 ( Å) provide a powerful tool for detecting and characterizing diffuse molecular gas in absorption against bright background QSOs. The H2-bearing damped Lyman- absorbers (with neutral hydrogen column density log[(H I)/cm-2] , DLAs) and strong Lyman limit systems ( log[(H I)/cm-2] , sLLSs) probed by these transitions thus provide a critical class of objects for characterizing the presence and properties of molecular gas in a range of galactic environments.
At high redshift where the Lyman and Werner band transitions are accessible from the ground (), over 100 H2-bearing DLAs and sLLSs have been detected through systematic searches (e.g., Ledoux et al., 2003; Noterdaeme et al., 2008) and mining of data archives, including the Sloan Digital Sky Survey and follow-up observations (e.g., Balashev et al., 2014; Balashev & Noterdaeme, 2018; Balashev et al., 2019; Noterdaeme et al., 2019). At low redshift (), Hubble Space Telescope (HST) observations in the ultraviolet (UV) have revealed less than 20 such systems (Crighton et al., 2013; Oliveira et al., 2014; Srianand et al., 2014; Dutta et al., 2015; Muzahid et al., 2015, 2016; Zahedy et al., 2020). There is evidence for a higher occurance rate of molecules in DLAs and sLLSs with higher metallicities, dust-to-gas ratios, and absorption line widths of low ionization states (e.g., Ledoux et al., 2003; Petitjean et al., 2006; Noterdaeme et al., 2008). The correlation between the incidence of H2-bearing gas and the line width may be due to star-formation feedback; alternatively, it may be secondary evidence of a metallicity dependence due to a mass-metallicity relationship (Ledoux et al., 2006). These factors suggest a picture in which H2-bearing absorbers are associated with metal-enriched, star-forming environments.
A key question in interpreting the nature of H2-bearing DLAs and sLLSs is whether they arise in the bound ISM of galaxies or are evidence of a circumgalactic molecular medium. At low redshift, the galactic environments of absorbers can be characterized in detail via ground-based galaxy redshift surveys. Of the 12 H2-bearing absorbers detected beyond the Milky Way at , 10 have candidate host galaxies, eight of which are spectroscopically confirmed to be at the redshift of the absorber (Crighton et al., 2013; Oliveira et al., 2014; Srianand et al., 2014; Muzahid et al., 2015, 2016; Zahedy et al., 2020). Eight of these host galaxy candidates have impact parameters proper kpc (pkpc).
If these galaxies are indeed the hosts of the absorbing gas, this implies a picture in which H2-bearing DLAs and sLLSs arise primarily outside of the inner disks of the identified galaxies. Suggested origins for the diffuse molecular gas include faint, undetected satellites, outflows from star-forming galaxies, and gas stripped from galaxies or their companions by tidal forces or ram pressure (e.g., Dutta et al., 2015; Muzahid et al., 2015). Galactic outflows from star-forming satellites may also contribute significantly to cool gas in the halos of massive galaxies (e.g., Hafen et al., 2019; Faucher-Giguère et al., 2016). However, our understanding of the host galaxies of molecular absorbers is limited by the small number of known systems and the absence of information about the large-scale galactic environments of these absorbers. The association between an absorber and a host galaxy candidate is ambiguous when additional galaxies without known redshifts remain in the field, including the possible presence of undetected dwarfs. It is also very difficult to detect galaxies at small impact parameters due to the challenges of subtracting the bright QSO light. The need remains for deep photometric surveys and follow-up spectroscopic observations to sub- sensitivities in the fields of H2-bearing DLAs and sLLSs to confidently characterize the galactic environments and origins of these absorbers (Muzahid et al., 2015).
Here, we report the serendipitous detection of an H2-bearing DLA at towards the background QSO J (RA, decl. 01h11m39.170s, -03d16m10.89s; Gaia Collaboration et al. 2018) in the Cosmic Ultraviolet Baryon Survey (CUBS; Chen et al. 2020). At a redshift of , the QSO (FUV = 18.5, NUV = 16.7; Bianchi et al. 2014) is part of an NUV-bright sample studied with the Cosmic Origins Spectrograph (COS) on HST and an accompanying ground-based galaxy redshift survey carried out spectroscopically on Magellan (IMACS, LDSS-3C) and the Very Large Telescope (MUSE). These observations permit a detailed characterization of the physical conditions in the H2-bearing gas and its galactic environment.
The outline of this paper is as follows. In §2, we describe the space- and ground-based FUV and optical absorption-line spectroscopy of J, and we discuss the galaxy redshift survey carried out in the field of the QSO. The following Section details our absorption-line profile analysis. In §4, we discuss the detection and characterization of H2-bearing gas, as well as the kinematics and chemical abundance pattern of the accompaning neutral and ionized atomic gas. The following Section describes the galaxy overdensity at the redshift of the H2-bearing DLA, and we consider possible origin scenarios for the absorber in §5. We summarize and conclude in §6. Throughout this work, we adopt the solar abundance pattern of Asplund et al. (2009) and assume a cosmology with , , and km s-1 Mpc-1.
2 Data
The CUBS survey design is described in detail in Chen et al. (2020). We summarize the relevant aspects of the ground- and space-based data collection and reduction procedures here.
2.1 HST-COS observations
We used HST-COS to obtain FUV spectroscopy of J between UT 4 - 29 July 2018 (Program ID: 15163; PI: Chen). The total exposure time was s and s for the G130M and G160M gratings, respectively. We used two central wavelengths (cenwaves) in the G130M regime and four in the G160M regime to provide continuous wavelength coverage across the CCD detector gap. At each cenwave, we used either two or four FP-POS settings to reduce the impact of fixed-pattern noise and to prevent spectral gaps due to Lyman--induced detector “holes.”
The wavelength coverage ranges from Å, with a full width at half maximum (FWHM) of the line spread function of 0.11 Å ( km s-1) at 1600 Å. The spectral resolution element (resel) is sampled by pixels. We used a custom pipeline to stack the x1d spectra output by CalCOS222https://github.com/spacetelescope/calcos/ (v3.3.5) for each grating, cenwave, and FP-POS and perform the continuum normalization (Chen et al., 2018). For the G160M grating, which is the spectral region of interest for the DLA reported here, the signal-to-noise ratio (S/N) per spectral resolution element decreases from S/N resel-1 at the blue end to S/N resel-1 at the red end, falling below S/N resel-1 only redward of 1750 Å.
2.2 MIKE observations
We used the Magellan Inamori Kyocera Echelle (MIKE; Bernstein et al. 2003) spectrograph on the Magellan Clay telescope to obtain optical spectroscopy of J on UT 1 Nov 2018. The blue (red) arm provides spectral coverage from Å ( Å). With a slit width, the instrumental line spread function has a FWHM of 7.5 km s-1 in the blue arm and 10 km s-1 in the red. There are 2.1 (2.0) pixels sampling a spectral resolution element in the blue (red) arm using 2 x 2 on-chip binning. An exposure time of s produced S/N resel-1 in the blue and S/N resel-1 in the red; this drops to S/N resel-1 at the ends of the useful spectral range. Chen et al. (2014) and Zahedy et al. (2016) discuss the spectral reduction, extraction, relative flux calibration, and continuum normalization using custom software. In addition to enabling access to an expanded suite of ionic transitions, the MIKE spectroscopy has improved spectral resolution with respect to COS by a factor of . These observations thus serve as an independent verification of the COS wavelength calibration and provide guidance for the kinematic analysis of COS absorbers (see §3).
2.3 Magellan galaxy spectroscopy
The Magellan galaxy survey design consists of two components: (1) a deep and narrow component with Magellan/LDSS-3C that targets all galaxies with and (and fainter at lower redshifts) within in angular radius from the QSO sightline ( pkpc for ) and (2) a shallow and wide component with Magellan/IMACS (Dressler et al., 2011) that targets galaxies at ( pMpc) from the QSO sightline.
For the deep and narrow LDSS-3C survey, we aim to establish a statistically representative sample of galaxies at for a comprehensive study of the CGM on individual halo scales ( pkpc) across a broad range in both stellar mass and star formation rate. To increase the efficiency of our ground-based survey, we devised a color-based prioritization scheme using the Ultra-VISTA survey (Muzzin et al., 2013). We prioritize galaxies with mag within the inner surrounding the QSO sightline with colors satisfying and . These criteria select nearly all log galaxies (both star-forming and passive) at and 50% at .
We obtained LDSS-3C data on UT 4 - 6 Oct 2018 and UT 2 - 3 Nov 2018 using the VPH-all 400 l/mm grism and a slit width, yielding wavelength coverage from Å at a spectral resolution of or km s-1. The exposure time was s for each of the five masks probing galaxies each, with more exposure time alloted to masks probing fainter galaxies. On UT 8 and 9 Sept and UT 9 Nov 2018, we obtained IMACS observations using the f/2 camera, 150 l/mm grism, and a slit width, yielding wavelength coverage from Å with a spectral resolution of ( km s-1) at the blaze wavelength of Å. The observations were divided among four masks, with galaxies observed for s per mask.
Multislit spectral reductions were performed using the CPDMap routine in the CarPy333https://code.obs.carnegiescience.edu/carnegie-python-distribution Python distribution, which implements techniques for rectification and sky subtraction as outlined in Kelson et al. (2000) and Kelson (2003). Redshifts were measured using custom software that constructs a template spectrum at regular redshift intervals by performing a minimization of a linear combination of the galaxy eigenspectra from Bolton et al. (2012). The redshift with the overall minimum was then selected as the galaxy redshift, with manual verification and exclusion of poor spectral regions.
3 Analysis
We characterize the column density (), velocity (), and Doppler parameter () of all absorbers detected in the COS and MIKE spectroscopy through a Voigt profile analysis. The transition wavelengths and oscillator strengths are taken from vpfit (v11.1) (Carswell & Webb, 2014) for the atomic lines and Ubachs et al. (2019) for the molecular lines. Using custom software, we fit the absorption lines for a given atomic, ionic, or molecular species with a Voigt profile function by minimizing the statistic on a grid in log(), , parameter space. We define as usual,
| (1) |
where and are the observed and modeled flux per spectral pixel and is the associated flux uncertainty. The summation is over the wavelength range that encompasses the extent of the absorption, excluding contaminated regions.
We take the minimum value as an estimate of the best-fit model parameters; we then refine these best-fit values and calculate their corresponding uncertainties using a Markov Chain Monte Carlo (MCMC) method that employs the Metropolis-Hastings algorithm (e.g., Ivezić et al., 2014). Here, the likelihood of a given model follows from the statistic as , and we impose model priors as discussed below. In summary, we apply no priors to fits of the suite of Fe II lines available in the MIKE data, and we require the remainder of the low ions observed with MIKE and COS to have the same and values for matching velocity components, where the COS lines are allowed to vary within wavelength calibration uncertainties of km s-1. Priors imposed on the H I and H2 absorption-line analyses are discused in §4.1 and §4.2, respectively.
We begin each MCMC run near the location of minimum in parameter space for efficiency (e.g., Zahedy et al., 2020), run each chain for steps, and discard the first 10% of the chain as the burn-in. The best-fit parameters correspond to the 50th percentile of the resultant marginalized posterior probability distributions, and the reported uncertainties correspond to the 16th and 84th percentiles of these same distributions. For non-detections, we report an upper limit on the column density determined from a upper limit on the equivalent width assuming a Doppler parameter chosen to match other atomic or molecular transitions with similar ionization or excitation states. This measurement is perfomed on the strongest available non-contaminated transition. The uncertainty analysis does not include possible modest contributions from the choice of continuum fit and line spread function, except where noted.
We leverage the high spectral resolution and S/N of the MIKE observations to guide the absorption-line profile analysis. From independent fits to the Mg II 2796, 2803 and Fe II 2344, 2374, 2382, 2586, and 2600 transitions, we determine that the line widths are dominated by turbulent rather than thermal motions, and thus we adopt the same parameter across low ionization states of different elements for a given velocity component. We first determine the best-fit log(), , and for the 10 components required to reproduce the absorption-line profiles for the five Fe II transitions; all other molecular, atomic, and ionic transitions require equal or fewer components (see Fig. 1). Due to the wide range of oscillator strengths among these five transitions (e.g., ), there are always multiple unsaturated transitions available. We then fix the values of and for each component when fitting the remaining low ion transitions available in MIKE and COS. Due to uncertainty in the COS wavelength calibration on the order of a few km s-1, we allow the velocity centroid for all COS lines to vary around the best-fit value from MIKE within km s-1.
For comparison, we also fit all metal-line profiles present in MIKE and COS allowing and to vary between elements and ionization states for a given component. The two approaches produce comparable column densities, which we corroborate with a curve-of-growth analysis. They also lead to consistent conclusions about the kinematic state of the gas. We report the results from the first fitting approach here. The saturation of the Lyman series lines limits our characterization of the H I velocity structure, and thus we fit these transitions separately from those discussed above (see § 4.1).
4 Results
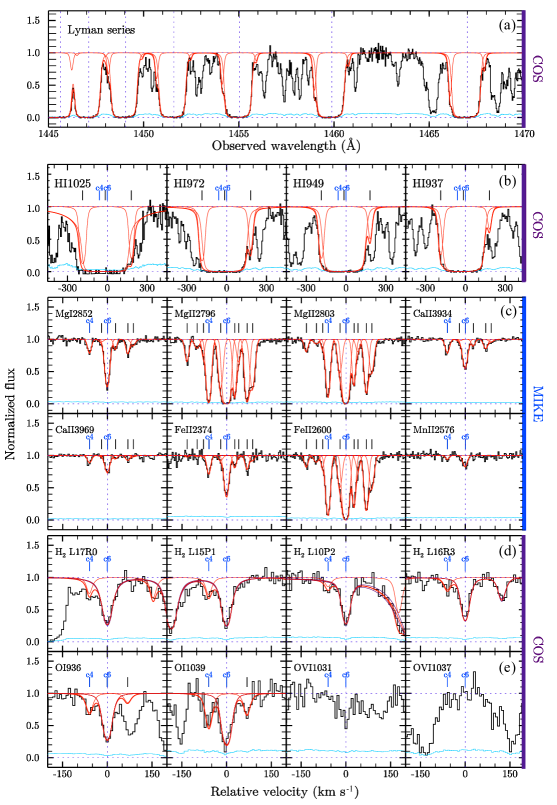
We detect absorption from the Lyman and Werner bands of molecular hydrogen (H2) at a redshift of in the COS spectrum of J. The COS and MIKE data reveal absorption from accompanying atomic hydrogen and a suite of neutral and ionized metals. In this Section, we describe the column densities and kinematics of the atomic (§4.1) and H2-bearing gas, including the excitation state of the molecular hydrogen (§4.2). We also examine the chemical abundance pattern (§4.3) and galactic environment (§4.4) of the absorber.
4.1 Atomic gas properties
In the COS spectrum, we detect absorption from the full Lyman series, with the exception of the Ly line which falls redward of our wavelength coverage for the absorber. Lyman continuum photons are not transmitted by this damped absorber, and thus no photons are detected blueward of an observed wavelength of Å.
As listed in Table 1 and shown in Fig. 1, a minimum of three velocity components are required to reproduce the H I absorption-line profiles (h1 - h3). The primary component has a column density of log[(H I)/cm-2] , where the uncertainty accounts for both statistical and systematic error associated with the continuum fitting of the Ly wings. Photoionization modeling suggests that the H I absorption arises from gas with a very low ionization fraction (see §4.2.1), and thus we refer to this system as a DLA due to its largely neutral nature. The large value measured for this absorber ( km s-1) likely indicates the presence of multiple, unresolved components. The velocity centroid is offset from the velocity zeropoint set by the strongest metal-line absorber by km s-1. Components h1 and h3 contribute negligibly to the total column density and do not have detectable associated metal lines, but they indicate the presence of H I-bearing gas over a velocity range of km s-1 km s-1.
| Comp. | (km s-1) | (km s-1) | log[/cm-2] |
|---|---|---|---|
| h1 | |||
| h2 | |||
| h3 |
We detect absorption from neutral and ionized metals associated with the DLA in both the COS and MIKE spectroscopy, including a suite of O I lines, O VI 1031, 1037, Mg I 2852, Mg II 2796, 2803, Ca II 3934, 3969, Mn II 2576, 2594, 2606, and Fe II 2344, 2374, 2382, 2586, and 2600. As shown in Fig. 1, the Fe II transitions require a minimum of 10 velocity components to reproduce the absorption-line profiles at the high spectral resolution of the MIKE data (c1 - c10); for all other atomic species, between two and 10 of these components show statistically significant absorption. The velocity components range from km s-1 and have a component-to-component velocity dispersion of km s-1. In Table 2, we summarize the best-fit values of log(), , and , where the velocity zeropoint is given by the strongest metal-line absorber in MIKE, . The median best-fit value, km s-1, significantly exceeds the thermal value for a K gas of km s-1, suggesting that the line width originates primarily in turbulent rather than thermal motions.
| Comp. | (km s-1) | (km s-1) | Ion | log[/cm-2] |
|---|---|---|---|---|
| c1 | Fe II | |||
| Mg II | ||||
| c2 | Fe II | |||
| Mg II | ||||
| c3 | Fe II | |||
| Mg II | ||||
| c4 | Fe II | |||
| Mg II | ||||
| Mg I | ||||
| Ca II | ||||
| Mn II | ||||
| O I | ||||
| c5 | Fe II | |||
| Mg II | ||||
| Mg I | ||||
| Ca II | ||||
| c6 | Fe II | |||
| Mg II | aaDue to the saturation of Mg II in c6, we report a 3 lower limit on (Mg II). | |||
| Mg I | ||||
| Ca II | ||||
| Mn II | ||||
| O I | ||||
| O VI | bbThe 3 upper limit on the O VI column density assuming a Doppler parameter of km s-1. | |||
| c7 | Fe II | |||
| Mg II | ||||
| Mg I | ||||
| Ca II | ||||
| c8 | Fe II | |||
| Mg II | ||||
| c9 | Fe II | |||
| Mg II | ||||
| Mg I | ||||
| Ca II | ||||
| O I | ||||
| c10 | Fe II | |||
| Mg II | ||||
| Mg I | ||||
| Ca II |
4.2 Diffuse molecular gas properties
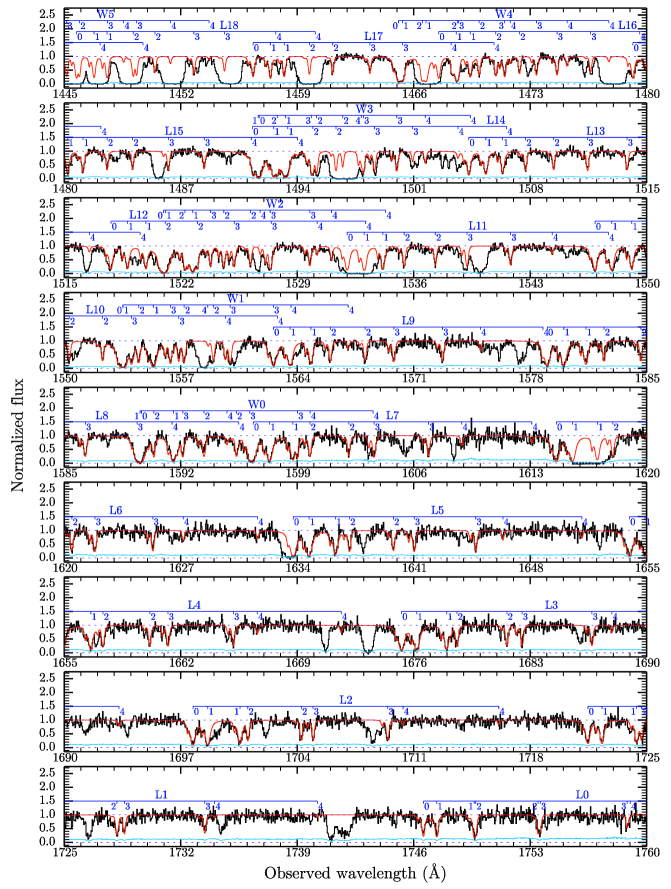
We detect absorption from molecular hydrogen associated with the metal-line components c4 and c6. This absorption manifests as Lyman and Werner band transitions that arise from the electronic ground state with lower rotational levels . The vibrational level of the lower state is , while the upper state has and for the Lyman and Werner bands, respectively. This produces approximately 230 observed absorption features between the Lyman limit and the red cutoff of our spectral coverage, a significant fraction of which are blended with each other or nearby atomic transitions.
To characterize the properties of the H2-bearing gas, we perform Voigt profile fitting for the stronger (associated with c6, km s-1) and weaker (c4, km s-1) components separately. These absorbers are sufficiently separated in velocity space to be fit individually with the appropriate choice of mask. The fitting window is km s km s-1 relative to the line center for the c6 component; the asymmetry is due to the presence of the c4 component. For the same reason, we choose a window of km s-1 for the weaker c4 component, with the best-fit model for the c6 component included in the fitting.
For each component, we fit transitions of a given value simultaneously to determine log[/cm-2] and as functions of . Despite the large number of available transitions, we find that the most robust results are obtained by fitting a small number of carefully selected lines that are chosen due to their relatively high S/N, lack of blending, and well-determined local continuum (for example, we fit for c6 based on the L0R0, L1R0, and L17R0 transitions). In practice, we include between two and six (one and three) transitions per value for the c6 (c4) component. As for the COS metal lines, we allow the velocity centroid of each transition to vary within km s-1 of the best-fit centroid determined from the MIKE metal lines.
We first performed the Voigt profile fitting for each level separately, imposing the prior that km s-1 based on the assumption that the turbulent line width traced by the molecules does not exceed that given by the low ions. For the c6 component, the model fitting for , , and produces a single peak in the probability distribution functions. However, for and , there are two peaks at high (log[/cm-2] ) and low (log[/cm-2] ) column density, with low ( km s-1) and high ( km s-1) Doppler parameters, respectively. The two peaks are well-separated in , space for but blended for .
For both levels, the most probable model corresponds to the high column density solution. However, we know this solution to be unphysical due to the absence of sufficiently high column density in the state (see Fig. 3). The best-fit values for and ( km s-1) are a factor of two smaller than the best-fit value for ( km s-1), suggesting that the Doppler parameter may rise with level (see § 4.2.1 for a discussion of the physical origin(s) of this trend). Additionally, as the levels are largely populated closer to the surface of the cloud in likely more diffuse and spatially extended gas (e.g., Abgrall et al., 1992), it is reasonable to expect that the values for higher rotational levels will be comparable to or exceed those of the lower levels. Thus, to obtain physical results for the column densities for and , we fit all levels again imposing the prior that the probability is zero for Doppler parameters less than and greater than km s-1.
We give the Voigt profile fitting results in Table 3, and we compare the best-fit model to the data in Fig. 2; these results yield a monotonic increase in value with level. If the line width is dominated by thermal motions, the km s-1 observed at low level implies a temperature K. At high level ( km s-1), this becomes K. Since this significantly exceeds the temperature expected for diffuse molecular gas, the line width appears to be dominated by turbulence in both cases, with turbulent motions a factor of two higher at high rotational state compared to low. We impose the same prior on the values for the H2 absorption observed in c4, but the large uncertainties associated with this weak component make conclusions about possible trends of value with level challenging.
The total H2 column density in the c6 (c4) component is log[(H2)/cm-2] (log[(H2)/cm-2] ). Since we cannot resolve the H I absorption associated with these velocity components, we calculate the H2 fraction, , by attributing all of the detected H I to the H2-bearing gas. This is supported by the observation that of the O I column density is found in the central, H2-bearing component (c6). This H2 fraction is among the highest observed for systems of comparable (H I) in both the local and high-redshift Universe (see, e.g., Crighton et al., 2013; Muzahid et al., 2015, and references therein).
| Comp. | (km s-1) | log[/cm-2] | (km s-1) | |
|---|---|---|---|---|
| c4 | ||||
| aa values for upper limits are fixed based on the trend of with for lower levels. | ||||
| Total | ||||
| c6 | ||||
| aa values for upper limits are fixed based on the trend of with for lower levels. | ||||
| Total |
4.2.1 H2 excitation
The H2 column density distribution as a function of rotational level gives insight into the excitation state of the molecular hydrogen. We focus our excitation analysis on c6 due to the weak nature and thus large associated uncertainties of c4. As shown in the left panel of Fig. 3, the H2 column densities in the and 1 states of c6 imply an excitation temperature of K assuming a Boltzmann distribution. However, the H2 column densities at are not well explained by this single temperature model; instead, these column densities significantly exceed their predicted values, with increasing discrepancy at higher level. The observed column densities can be well reproduced by a two-temperature model with K and K (see the middle panel of Fig. 3). The best-fit temperatures and associated uncertainties for the one- and two-phase models are determined by a maximum likelihood analysis; in the latter case, the upper limit on provides a strong constraint on . The failure of a single temperature model to reproduce the excitation state of the molecular hydrogen is commonly noted in absorbers at a range of redshifts (e.g., Spitzer & Jenkins, 1975; Noterdaeme et al., 2007; Rawlins et al., 2018; Balashev et al., 2019), and the observed is consistent with the excitation temperatures seen in H2-bearing DLAs and sLLSs of comparable (H2) (see, e.g., Muzahid et al., 2015, and references therein).
The presence of multi-phase gas produced by shocks or turbulent mixing layers (e.g., Gry et al., 2002; Ingalls et al., 2011) has been attributed to the excitation of H2-bearing gas observed in the Milky Way (e.g., Jenkins & Peimbert, 1997) and at higher redshift (e.g., Noterdaeme et al., 2007). However, excitation of the states via collisions in a thermalized medium requires relatively high gas density ( cm-3) and thus very small absorber size ( pc for the observed gas column). Although there is evidence for sub-pc sizes among known H2-bearing clouds (e.g., Reimers et al., 2003), the very small clump size required here implies an extremely low covering fraction of these H2 absorbers, making it unlikely to detect one in the 15 CUBS sightlines.
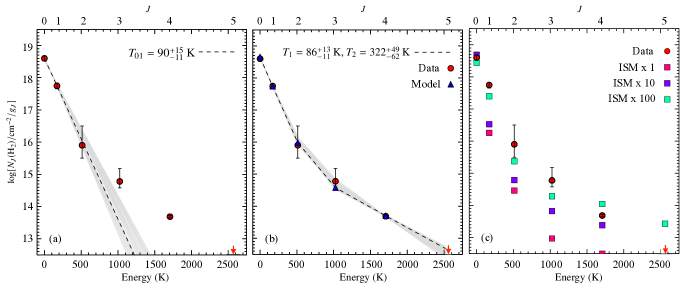
Alternative explanations for the elevated excitation state include pumping by an ambient UV radiation field (Jura, 1975) and direct formation on high rotational levels (e.g., Lacour et al., 2005). Here we explore the possibility that the excitation state of the H2 is due to UV pumping by estimating the required radiation field using the spectral sythesis code CLOUDY (v13.05; Ferland et al. 2013). Using the observed of the stronger molecular absorber as the stopping condition, we run a series of models at the total hydrogen volume density required to reproduce the observed and simultaneously in the presence of the chosen radiation field.
We assume a constant gas pressure across the cloud and impose a two-sided, plane-parallel geometry by modeling half of the observed and and mirroring the result. The models include grains consistent with the size distribution and abundance of the local Galactic ISM, with the abundance of both metals and grains reduced to 40 of the solar neighborhood values (see §4.3). We apply the Galactic cosmic ray background, which uses the H0 and H2 ionization rates of Indriolo et al. (2007) and Glassgold & Langer (1974), respectively. We use two ambient radiation fields available in CLOUDY in addition to the cosmic microwave background: the HM05 UV background at (a 2005 update to the Quasars+Galaxies field of Haardt & Madau 2001) and the unextinguished local ISM radiation field (Black, 1987), which is dominated by starlight at the wavelengths relevant to H2 excitation and dissociation. We adjust the latter radiation field by a scale factor ranging from . The suite of models considered here suggest that the H I resides in a largely neutral zone, with of the (H I) arising from regions with H ionization fractions .
We compare the observed and modeled as a function of level for a range of scale factors, , in the right panel of Fig. 3. A scale factor of roughly reproduces the excitation state of the H2 at , suggesting that a significantly elevated radiation field compared to that estimated locally is required to explain the excitation state of the molecular hydrogen if radiative pumping is the dominant mechanism. For , the model produces an H2 volume density of cm-3 (as compared to a total cm-3) and a kinetic temperature of K in the cloud core. At , this becomes cm-3 ( cm-3) and K. In the core of the cloud, these kinetic temperatures are comparable to the modeled , consistent with significant self-shielding. The difference between the observed and modeled may be due to a range of uncertainties in the model, including the shape of the incident radiation field and the relative geometries of the absorber and any local source(s) of UV photons.
We also produce alternative models imposing constant total hydrogen density, as well as both one- and two-sided geometries for the constant density and constant gas pressure cases. These models lead to the same general conclusion that a radiative pumping scenario requires an ambient radiation field elevated above that observed in the solar neighborhood by one to two orders of magnitude. Allowing for , as may be the case if not all of the observed is associated with the molecular absorber, does not significantly alter these conclusions. In this picture, the rise in value with level follows naturally from a stratified cloud in which the and levels are primarly populated closer to the interior of the cloud than the higher rotational levels and thus may arise from less turbulent and spatially extended gas (e.g., Abgrall et al., 1992; Balashev et al., 2009).
4.3 Chemical abundance pattern
We quantify the metallicity of the H2-bearing DLA using the available, uncontaminated O I transitions in the COS data, including O I 922, 936, and 1039, where the weak 922 line is unsaturated for all components. As shown in Fig. 1 and Table 2, there is detectable O I absorption associated with velocity components c4, c6, and c9. The O I column density, log[(O I)/cm-2] , yields a metallicity of % of solar. Since the H I column density associated with individual metal-line components is unknown, this is a velocity-integrated metallicity that represents an average value for the absorber.
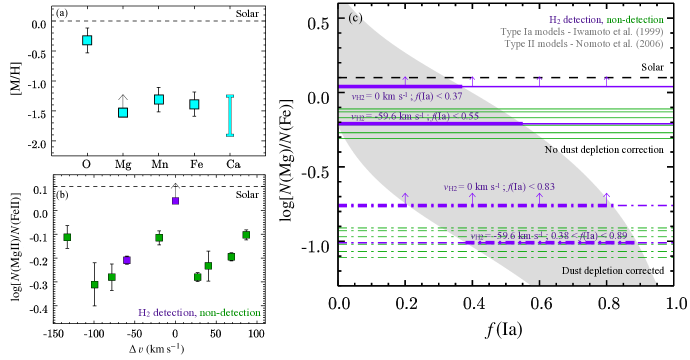
Interesting trends emerge when the chemical abundance pattern of other atomic species is considered. In panel (a) of Fig. 4, we plot the velocity-integrated metallicity, [M/H], of five atomic species: O (traced by (O I)), Mg ((Mg I) + (Mg II)), Mn ((Mn II)), Fe ((Fe II)), and Ca ((Ca II)). The suite of CLOUDY models produced in §4.2.1 suggest that the H I arises in a neutral zone with H ionization fraction , and thus we expect O I, Mg II, Mn II, and Fe II to be the dominant ionization state for each respective element. We use the CLOUDY models to corroborate that the contributions from other ionization states are negligible. Given the relatively low second ionization potential of Ca (11.9 eV), an ionization correction is required. We find for the range of assumptions explored in our photoionization models (one- vs. two-sided, constant gas pressure vs. density, ), and we thus display [Ca/H] as a band determined from this range of ionization corrections.
In the upper left panel of Fig. 4, the atomic species are ordered from least to most refractory. O, the least refractory element considered here, is expected to experience minimal depletion onto dust grains in the Milky Way (Savage & Sembach, 1996) and higher redshift DLA environments (e.g., De Cia et al., 2016). In contrast, in a dusty medium, we expect increasingly significant depletion of Mg, Mn, Fe, and Ca, and indeed we observe larger departures from solar metallicity for more refractory elements. We estimate the dust-to-gas ratio, , by taking X = O as the element least likely to be affected by dust depletion. This yields a velocity-integrated dust-to-gas ratio of , and it is possible that this ratio is even higher in the velocity components that are H2-bearing. This implies the presence of dust in the absorber, consistent with findings that higher H2 fractions tend to be found in systems with higher dust-to-gas ratios, although additional effects including the gas density and ambient radiation field are also relevant (e.g., Ledoux et al., 2003).
We can ask to what extent variation in the chemical abundance pattern is observed between different velocity components. In the absence of kinematically-resolved H I measurements, we examine the ratio of the Mg II and Fe II column densities, log[(Mg II)/(Fe II)], as a function of velocity, , in panel (b) of Fig. 4. Firstly, we note that all velocity components are consistent with sub-solar log[(Mg II)/(Fe II)], falling below the solar value by dex. Secondly, component-to-component variation in this column density ratio suggests a non-uniform chemical abundance and/or dust depletion pattern across the system.
However, some subsets of components have consistent log[(Mg II)/(Fe II)] within the errors. Notably, the H2-bearing component associated with c4 is consistent with c2, c3, c8, and c9 within . Relative homogeneity in the component-to-component chemical properties and ionization states of absorbers has been interpreted in other systems as arising from clouds sharing similar physical conditions and environments (e.g., Lopez et al., 2002; Prochaska, 2003). For the H2-bearing component associated with c6, we find log[(Mg II)/(Fe II)] ; as this exceeds the ratio observed for all other velocity components, we cannot infer that the stronger molecular absorber originates from the same astrophysical processes as the other velocity components based on their respective column density ratios.
In panel (c) of Fig. 4, we again show the observed log[(Mg)/(Fe)] for each velocity component compared to solar. These results suggest moderate Fe enhancement with respect to the solar abundance pattern, as is often associated with preferential enrichment from Type Ia supernovae (SNe). In the same panel, we indicate the range of log[(Mg)/(Fe)] expected for a given Type Ia fraction, , where and are the number of Type Ia and Type II events that have contributed to chemically enriching the gas, respectively. The range of model predictions for a given is due to the spread in chemical abundance pattern corresponding to a range of initial metallicities, deflagration speeds, and densities at ignition (Type Ia) and progenitor masses (Type II; ). The Type Ia yields are taken from Iwamoto et al. (1999), and the Type II yields are adopted from Nomoto et al. (2006) for .
As shown by solid lines in panel (c) of Fig. 4, the observed values of log[(Mg)/(Fe)] for the two H2-bearing absorbers suggest (c6) and ¡ 0.55 (c4). Thus, taken at face value, the observed log[(Mg)/(Fe)] is consistent with no enrichment by Type Ia SNe. However, as discussed above, the growing departure of [M/H] from solar metallicity for increasingly refractory elements strongly suggests the presence of dust depletion. As shown by dashed lines in the same Figure, we overplot log[(Mg)/(Fe)] corrected for the depletion pattern of De Cia et al. (2016) for a depletion factor of [Zn/Fe] = 1.2, chosen to approximate the warm disk of the Milky Way (Savage & Sembach, 1996). For the H2-bearing component associated with c4, this suggests , implying significant contributions from Type Ia SNe. Raising the metallicity of the Type II yield models of Nomoto et al. (2006) to has little effect on the results; a choice of increases the upper bound on the suggested by .
Given our lack of knowledge of the intrinsic chemical abundance and depletion patterns, we cannot definitively determine the presence and extent of Fe enhancement in the absorbing gas. The extent of the depletion is highly uncertain; depletion factors ranging from [Zn/Fe] are observed in DLAs with metallicities near solar (Zou et al., 2018). However, it is clear that simultaneously explaining all chemical abundance ratios strongly suggests the influence of both dust depletion and Fe enhancement, the latter of which is seen in systems where Type Ia SNe have made significant contributions to the chemical enrichment history.
4.4 The galaxy environment of the DLA
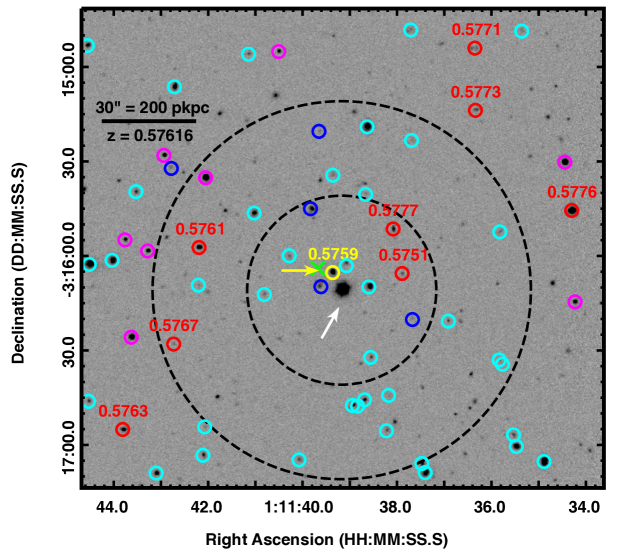
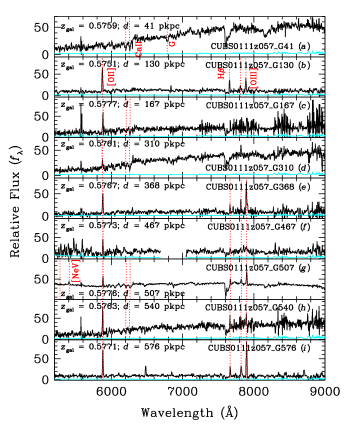
The Magellan galaxy redshift survey reveals nine galaxies with secure, multi-line redshifts within an impact parameter of pkpc and = 300 km s-1 of the H2-bearing absorber. We show the locations of these galaxies on a Magellan -band image of the field and their Magellan spectroscopy in Figs. 5 and 6, respectively. In Table 4, we tabulate their RA and decl. offsets (, ), angular separations (), and impact parameters () from the QSO. We also list their redshifts (), velocity offsets (), apparent and absolute -band magnitudes (, ), stellar masses (), and spectral types. Beyond the nine galaxies identified here, the next closest galaxy in projection is at pkpc within of the absorber redshift. The uncertainty on the galaxy redshift measurements is () for systems dominated by emission (absorption).
The galaxy at the closest projected distance to the QSO, pkpc, is also the most massive, with log. We estimate the stellar mass from the galaxy photometry following Johnson et al. (2015). As shown in panel (a) of Fig. 6, CUBS0111z057_G41 (hereafter G41) has an absorption-line dominated spectrum, suggesting that it is a massive, early-type system. We place a 2 upper limit on its star formation rate of yr-1 based on the absence of [O II] 3727, 3729 emission in its spectrum (Kewley et al., 2004). Using the fitting code bagpipes444https://bagpipes.readthedocs.io/en/latest/ (Carnall et al., 2018), we find the age of the stellar population to be Gyr assuming a single burst of star formation. A tau model (SFR ) produces a similar age of Gyr. This galaxy is offset in velocity from c6 by km s-1.
At over three times the projected distance, the next closest galaxy ( pkpc; CUBS0111z057_G130, hereafter G130) has a contrasting, emission-line dominated spectrum (see panel (b) of Fig. 6). This star-forming galaxy has an unobscured star formation rate of yr-1 inferred from its [O II] equivalent width (Kewley et al., 2004). Another galaxy of note, CUBS0111z057_G507 (hereafter G507), is the brightest in the field and is located at pkpc. As seen in panel (g) of Fig. 6, the clear detection of [Ne V] 3426 emission and a power-law term superimposed on the stellar continuum indicate the presence of an AGN. From Equation 12 of Reyes et al. (2008), we find a UV magnitude of (2500) = -22.1 at 2500 Å from the observed [O III] 5008 luminosity of the AGN. This suggests that any radiation field due to the AGN at the location of the DLA is likely sub-dominant compared to the UV background at the wavelengths relevant to the H2 excitaton. G130 and G507 are offset in velocity from c6 by km s-1 and km s-1, respectively.
It is natural to ask whether these nine galaxies clustered within pkpc and with velocity dispersion km s-1 are members of a bound group. Beginning with the most massive galaxy, G41, we use the estimated stellar mass, log, to infer the total dynamical mass, log, from the stellar mass - halo mass relation of Behroozi et al. (2019) at the redshift of the DLA. We then calculate the corresponding virial radius, kpc, using the formalism of Maller & Bullock (2004), who define based on the redshift-dependent overdensity criterion of Bryan & Norman (1998). This virial radius encloses four additional galaxies in projection, G130, CUBS0111z057_G167, CUBS0111z057_G310, and CUBS0111z057_G368. Repeating this process with the summed masses of all five galaxies yields a comparable that does not encompass any additional galaxies. A similar analysis for the next two most massive galaxies, G507 and CUBS0111z057_G310, finds no additional galaxies within the virial radii of these systems. This suggests that the nine galaxies do not represent a single bound group, but instead indicate a loose association in which G41 may be bound to its four closest projected neighbors. We discuss the possible association of the damped absorber with these galaxies in the following Section.
| aaRA offsets (), decl. offsets (), angular separations (), and impact parameters () are measured with respect to the QSO position at RA, decl. 01h11m39.170s, -03d16m10.89s. | bbVelocity offsets () are measured with respect to the strongest metal-line absorption at . | cc-band apparent magnitudes are from the Dark Energy Survey (Abbott et al., 2018), with the exception of the faintest galaxy, CUBS0111z057_G368; for this system, is from Magellan photometry. | ddThe characteristic rest-frame absolute -band magnitude is () for blue (red) galaxies following Cool et al. (2012). | ||||||||
|---|---|---|---|---|---|---|---|---|---|---|---|
| ID | Name | (′′) | (′′) | (′′) | (pkpc) | (km s-1) | (mag) | (mag) | logeeWe determine using the photometric fitting formulae of Johnson et al. (2015). Note that for CUBS0111z057_G507, whose spectrum suggests the presence of an AGN, we down-correct the estimated stellar mass by a factor of two, as % of the -band light appears to come from the compact nucleus. | TypeffSpectral type: absorption-dominated (abs), emission-dominated (em), or composite (abs/em). | |
| J | CUBS0111z057_G41 | 6.3 | 41.0 | 0.5759 | 10.9 | Abs | |||||
| J | CUBS0111z057_G130 | 19.9 | 130.1 | 0.5751 | 9.4 | Em | |||||
| J | CUBS0111z057_G167 | 25.4 | 166.5 | 0.5777 | 10.0 | Abs/Em | |||||
| J | CUBS0111z057_G310 | 47.3 | 310.1 | 0.5761 | 10.4 | Abs/Em | |||||
| J | CUBS0111z057_G368 | 56.0 | 367.6 | 0.5767 | 8.9 | Em | |||||
| J | CUBS0111z057_G467 | 71.1 | 466.9 | 0.5773 | 9.8 | Em | |||||
| J | CUBS0111z057_G507 | 77.2 | 506.9 | 0.5776 | 10.7 | Abs/Em | |||||
| J | CUBS0111z057_G540 | 82.3 | 540.0 | 0.5763 | 10.2 | Abs/Em | |||||
| J | CUBS0111z057_G576 | 87.7 | 575.5 | 0.5771 | 9.8 | Em |
5 Discussion
We report the detection of an H2-bearing DLA at in a well-characterized galaxy overdensity. The observed is high among known systems of comparable log[(H I)/cm-2] (see, e.g., Crighton et al., 2013; Muzahid et al., 2015, and references therein), possibly due to the relatively high dust-to-gas ratio (). This may also be due to ram pressure stripping or photoevaporation of the H I gas, as possibly observed at low redshift in star-forming regions that are spatially offset from the peak of the H I gas distribution in interacting galaxies (e.g., Mendes de Oliveira et al., 2004; Werk et al., 2008). The absence of associated O VI absorption, log[(O VI)/cm-2] , is notable. If O VI arises primarily at interfaces between cool clouds and a hot, volume-filling phase, the lack of O VI absorption suggests partial covering of such structures in the relevant galaxy halo(s) and intra-group medium.
For the stronger of the two H2-bearing velocity components, the excitation state of the molecules may be due to UV pumping by an ambient radiation field that is elevated above that observed in the solar neighborhood by a factor of . This field may be produced by shocks arising from collisions between cool clouds or at the interface between these clouds and the hot, ambient medium, or may imply the presence of undetected star formation obscured by dust or the glare of the QSO (see point III below). In this picture, the observed rise in value with level can be attributed to stratification in the cloud, in which levels are primarily populated closer to the surface of the cloud and thus in more diffuse and spatially extended gas than the lower rotational levels (e.g., Abgrall et al., 1992; Balashev et al., 2009).
The galaxy redshift survey presents an unprecedented opportunity to explore the origin and physical conditions of an H2-bearing DLA in the context of its galactic environment. Nine galaxies are detected within pkpc and = 300 km s-1 of the absorber, and here we discuss the possible association of the diffuse molecular gas and the relevant galaxies.
I. Association with a massive, early-type galaxy at pkpc. Several lines of evidence favor an association between the H2-bearing DLA and the massive elliptical galaxy, G41. In addition to having the smallest projected distance ( pkpc) and a modest velocity offset ( km s-1), this galaxy is also the most massive system observed at the redshift of the DLA and represents almost of the stellar mass of the small group comprised of this galaxy and its four closest neighbors. Furthermore, as discussed in § 4.3, the chemical abundance pattern suggests Fe enhancement consistent with significant contributions from Type Ia SNe. This chemical signature is commonly seen in the inner halos of massive quiescent galaxies ( pkpc), in contrast to their outer halos and star-forming systems (e.g., Zahedy et al., 2017). The observed sub-solar metallicity at pkpc is not in tension with the super-solar stellar metallicities often observed at the centers of massive quiescent galaxies, due to the stellar metallicity gradients observed in these systems (e.g., Spolaor et al., 2010) and the significant scatter seen within single luminous red galaxy halos suggesting a range of gas cloud origins and poor gas mixing (Zahedy et al., 2019). Given the observed projected distance, pkpc, the absorber could either be associated with the outer ISM or true CGM of this massive galaxy.
Significant amounts of neutral atomic and molecular gas have been observed in early-type galaxies at low and intermediate redshifts. In the local Universe, the ATLAS project yielded a detection rate of H I 21-cm emission in non-cluster environments in a volume-limited survey of early-type galaxies (Serra et al., 2012); a detection rate of CO emission in both cluster and non-cluster galaxies was found in a similar sample (Young et al., 2011). On larger scales, extensive reservoirs of cool gas have been detected in the CGM of intermediate-redshift, early-type galaxies using QSO absorption-line probes (e.g., Gauthier et al., 2009; Bowen & Chelouche, 2011; Huang et al., 2016; Chen et al., 2018). These studies have demonstrated that luminous red galaxy halos can host comparable amounts of cool gas as their star-forming counterparts (e.g., Zahedy et al., 2019).
To our knowledge, direct detections of molecules at distances of pkpc from early-type galaxies in non-cluster environments have not been reported in the literature. Indeed, published detections of molecules on scales of many tens of pkpc have been confined to interacting, star-forming galaxies in the local Universe (e.g., Appleton et al., 2006) and to proto-cluster environments at high redshift (e.g., Emonts et al., 2016, 2019). However, a lack of detections on comparable scales around normal, early-type galaxies at low and intermediate redshift is not surprising. In the local Universe, single-dish CO surveys such as ATLAS (e.g., Young et al., 2011) generally obtain single pointings, centered on the galaxies, with beam sizes of a few pkpc FWHM; thus, they are not designed to probe galaxy halos at large angular extents. At intermediate redshift, state-of-the-art sub-mm interferometers such as the Atacama Large Millimeter/submillimeter Array (ALMA) have detected the dense molecular gas reservoirs associated with the central regions of DLA host galaxies (e.g., Kanekar et al., 2018), but lack the sensitivity to probe the diffuse molecular gas that may be found in their outskirts.
However, there is indirect evidence that supports several scenarios for the presence of H2 at pkpc from a massive, early-type galaxy. In the local Universe, galaxy interactions appear to enhance the incidence and physical extent of cold gas outside of the densest group and cluster environments (Davis et al., 2011). Serra et al. (2012) report a diverse range of H I morphologies in early-type galaxies, including evidence for tidal tails and scattered clouds at tens of pkpc from the host galaxy. Similar phenomena are seen in emission from cool ionized gas (e.g., Johnson et al., 2018). Furthermore, such irregular H I morphologies are more commonly seen in denser environments, suggesting a causal relationship with close companions. It is possible that interactions between the early-type galaxy and member(s) of its (small) group environment resulted in transport and/or compression of gas in its hot halo, providing conditions for H2 survival or in situ formation (e.g., Walter et al., 2006).
Indeed, the Magellanic Stream is a local example of an extended H I gas distribution embedded in a hot halo that provides conditions suitable for H2 to survive and possibly to form (e.g., Richter et al., 2018). Stephan’s Quintet is another instance in which a shock front produced by a galaxy traveling supersonically through the hot intragroup gas can compress the ambient medium, leading to molecule formation in the dense, rapidly-cooling phase (Appleton et al., 2006, 2017). In these scenarios, the apparent Fe enhancement of the absorber suggests that the gas originates primarily in the early-type galaxy or in a companion in which star formation has not been active for a significant time. Additionally, AGN activity can produce molecules at distances of tens of kpc from host galaxies (e.g., Cicone et al., 2014; Salomé et al., 2016; Rudie et al., 2017), either through direct transport, compression of the ambient medium, or triggering its formation via cooling instabilities in outflows (Richings & Faucher-Giguère, 2018b, a). As there is no evidence for current AGN activity in the massive, early-type galaxy, this model requires the molecules to have survived from a past epoch of AGN activity.
II. Association with a star-forming galaxy at pkpc. The moderately star-forming galaxy (SFR yr-1) at pkpc is the next natural origin to consider for the DLA. Star-formation driven outflows can transport molecules into the CGM of late-type galaxies (e.g., Rupke et al., 2019), although these outflows typically occur on scales of kpc to tens of kpc, in contrast to the kpc scale implied here (see Cicone et al., 2014; Walter et al., 2017, and references therein). In addition to the large physical scale, the chemical abundance pattern of the H2-bearing DLA presents a challenge to this picture. Fe enhancement is not characteristic of the ISM or CGM of late-type galaxies (e.g., Zahedy et al., 2017), and thus is not expected in star-formation driven outflows.
III. Association with a galaxy hidden by the QSO. It is possible that the H2-bearing gas arises in a galaxy at very small impact parameter that is hidden by the bright background QSO ( pkpc derived from the seeing disk). At the redshift of the DLA, we place a 3 upper limit on the corresponding unobscured star formation rate of yr-1 based on an upper limit on the [O III] 5008 equivalent width within a circular aperature of radius following the relation of Moustakas et al. (2006) for dwarf galaxies with . A local source of UV photons from star-forming regions that radiatively pump the molecules to the observed excitation state is a potential appeal of this model, where stratification of the density profile and turbulent properties of the cloud may account for the observed variation in value with level. However, if the absorber originates in the ISM of its host galaxy, the large velocity spread among associated metal lines ( km s-1) suggests a significant circular velocity; thus, the DLA is unlikely to be associated with the bound ISM of a low-mass dwarf. Additionally, an origin in the ISM or CGM of a star-forming galaxy is again in tension with the observed Fe enhancement of the absorber.
We thus favor a model in which the H2-bearing DLA is associated with the outskirts of the massive, early-type galaxy at pkpc, as this model most fully reproduces the observed properties of the absorber. The quiescent nature of this system is a natural explanation for the apparent Fe enhancement of the absorber, a property that is challenging to explain if the gas is associated with a star-forming massive or dwarf galaxy. This system is only one of two known H2-bearing DLAs likely associated with a massive, quiescent galaxy (Zahedy et al., 2020). QSO absorption-line spectroscopy thus provides a powerful perspective on diffuse molecular gas properties in the vicinity of early-type galaxies, offering an additional probe of the cold gas reservoirs that persist in some systems despite the quiescence of their host galaxies.
6 Conclusion
We report one of two known H2-bearing DLAs likely associated with a massive, early-type galaxy. Detected serendipitously in Lyman and Werner band absorption at towards J in the CUBS program, this system highlights the importance of comprehensive galaxy redshift survey data to probe the diversity of environments in which a molecular medium is found.
This damped absorber (log[(H I)/cm-2] ) displays complex kinematic structure with at least 10 velocity components spread over km s-1. Two of these components, separated by km s-1, show Lyman and Werner band absorption that implies a total H2 column density of log[(H2)/cm-2] , or a total H2 fraction of . The excitation state of the molecular hydrogen and the observed rise in value with level may be explained by radiative pumping in a medium with stratification in turbulent properties if the radiation field is elevated above that seen in the solar neighborhood by one to two orders of magnitude.
A galaxy redshift survey reveals nine galaxies within pkpc and km s-1 of the absorber; the five galaxies at the smallest impact parameter may form a bound group. The galaxy at the closest projected distance to the QSO sightline is a massive, early-type galaxy at pkpc. An association betweeen the absorber and the outer ISM or CGM of this galaxy is supported by the chemical abundance pattern of the former, which suggests Fe enhancement consistent with preferential enrichment by Type Ia SNe. We discuss possible origins for the H2-bearing gas in the outskirts of this galaxy, including interactions with companion galaxies and a past epoch of AGN activity. Although we cannot rule out the presence of an undetected, intervening galaxy lost in the glare of the QSO light, the lack of [O III] 5008 emission in the quasar spectrum at the absorber redshift places a 3 upper limit on the star formation rate of yr-1.
Current facilities, including ALMA, have detected dense molecular gas in the central regions of galaxies with associated DLAs at intermediate redshift (e.g., Kanekar et al., 2018) and have the ability to place sensitive limits on the diffuse molecular gas surface density at the location of the QSO. Follow-up CO emission-line observations probing the molecular gas reservoirs associated with the early-type galaxy and its companions, including any undetected galaxies, will help to more definitively determine the origin of the molecular absorber.
At intermediate and high redshifts, QSO absorption-line spectroscopy remains the only viable method to directly detect molecular gas at the low and moderate column densities that may be characteristic of circumgalactic environments (log). Pairing such observations with comprehensive galaxy survey data thus remains a critical avenue for gaining further clarity about the diverse range of galactic evolutionary states and environments that host dense and potentially star-forming gas.
References
- Abbott et al. (2018) Abbott, T. M. C., Abdalla, F. B., Allam, S., et al. 2018, ApJS, 239, 18
- Abgrall et al. (1992) Abgrall, H., Le Bourlot, J., Pineau Des Forets, G., et al. 1992, A&A, 253, 525
- Appleton et al. (2006) Appleton, P. N., Xu, K. C., Reach, W., et al. 2006, ApJ, 639, L51
- Appleton et al. (2017) Appleton, P. N., Guillard, P., Togi, A., et al. 2017, ApJ, 836, 76
- Asplund et al. (2009) Asplund, M., Grevesse, N., Sauval, A. J., & Scott, P. 2009, ARA&A, 47, 481
- Balashev et al. (2014) Balashev, S. A., Klimenko, V. V., Ivanchik, A. V., et al. 2014, MNRAS, 440, 225
- Balashev & Noterdaeme (2018) Balashev, S. A., & Noterdaeme, P. 2018, MNRAS, 478, L7
- Balashev et al. (2009) Balashev, S. A., Varshalovich, D. A., & Ivanchik, A. V. 2009, Astronomy Letters, 35, 150
- Balashev et al. (2019) Balashev, S. A., Klimenko, V. V., Noterdaeme, P., et al. 2019, MNRAS, 490, 2668
- Behroozi et al. (2019) Behroozi, P., Wechsler, R. H., Hearin, A. P., & Conroy, C. 2019, MNRAS, 488, 3143
- Bernstein et al. (2003) Bernstein, R., Shectman, S. A., Gunnels, S. M., Mochnacki, S., & Athey, A. E. 2003, in Society of Photo-Optical Instrumentation Engineers (SPIE) Conference Series, Vol. 4841, Proc. SPIE, ed. M. Iye & A. F. M. Moorwood, 1694–1704
- Bianchi et al. (2014) Bianchi, L., Conti, A., & Shiao, B. 2014, VizieR Online Data Catalog, II/335
- Black (1987) Black, J. H. 1987, Heating and Cooling of the Interstellar Gas, ed. D. J. Hollenbach & J. Thronson, Harley A., Vol. 134, 731
- Bolton et al. (2012) Bolton, A. S., Schlegel, D. J., Aubourg, É., et al. 2012, AJ, 144, 144
- Bowen & Chelouche (2011) Bowen, D. V., & Chelouche, D. 2011, ApJ, 727, 47
- Bryan & Norman (1998) Bryan, G. L., & Norman, M. L. 1998, ApJ, 495, 80
- Carnall et al. (2018) Carnall, A. C., McLure, R. J., Dunlop, J. S., & Davé, R. 2018, MNRAS, 480, 4379
- Carswell & Webb (2014) Carswell, R. F., & Webb, J. K. 2014, VPFIT: Voigt profile fitting program, , , ascl:1408.015
- Chen et al. (2014) Chen, H.-W., Gauthier, J.-R., Sharon, K., et al. 2014, MNRAS, 438, 1435
- Chen et al. (2018) Chen, H.-W., Zahedy, F. S., Johnson, S. D., et al. 2018, MNRAS, 479, 2547
- Chen et al. (2020) Chen, H.-W., Zahedy, F. S., Boettcher, E., et al. 2020, MNRAS, 497, 498
- Cicone et al. (2014) Cicone, C., Maiolino, R., Sturm, E., et al. 2014, A&A, 562, A21
- Cool et al. (2012) Cool, R. J., Eisenstein, D. J., Kochanek, C. S., et al. 2012, ApJ, 748, 10
- Crighton et al. (2013) Crighton, N. H. M., Bechtold, J., Carswell, R. F., et al. 2013, MNRAS, 433, 178
- Davis et al. (2011) Davis, T. A., Alatalo, K., Sarzi, M., et al. 2011, MNRAS, 417, 882
- De Cia et al. (2016) De Cia, A., Ledoux, C., Mattsson, L., et al. 2016, A&A, 596, A97
- Dressler et al. (2011) Dressler, A., Bigelow, B., Hare, T., et al. 2011, PASP, 123, 288
- Dutta et al. (2015) Dutta, R., Srianand, R., Muzahid, S., et al. 2015, MNRAS, 448, 3718
- Emonts et al. (2019) Emonts, B. H. C., Cai, Z., Prochaska, J. X., Li, Q., & Lehnert, M. D. 2019, ApJ, 887, 86
- Emonts et al. (2016) Emonts, B. H. C., Lehnert, M. D., Villar-Martín, M., et al. 2016, Science, 354, 1128
- Faucher-Giguère et al. (2016) Faucher-Giguère, C.-A., Feldmann, R., Quataert, E., et al. 2016, MNRAS, 461, L32
- Ferland et al. (2013) Ferland, G. J., Porter, R. L., van Hoof, P. A. M., et al. 2013, Rev. Mexicana Astron. Astrofis., 49, 137
- Gaia Collaboration et al. (2018) Gaia Collaboration, Brown, A. G. A., Vallenari, A., et al. 2018, A&A, 616, A1
- Gauthier et al. (2009) Gauthier, J.-R., Chen, H.-W., & Tinker, J. L. 2009, ApJ, 702, 50
- Glassgold & Langer (1974) Glassgold, A. E., & Langer, W. D. 1974, ApJ, 193, 73
- Gry et al. (2002) Gry, C., Boulanger, F., Nehmé, C., et al. 2002, A&A, 391, 675
- Haardt & Madau (2001) Haardt, F., & Madau, P. 2001, in Clusters of Galaxies and the High Redshift Universe Observed in X-rays, ed. D. M. Neumann & J. T. V. Tran, 64
- Hafen et al. (2019) Hafen, Z., Faucher-Giguère, C.-A., Anglés-Alcázar, D., et al. 2019, MNRAS, 488, 1248
- Huang et al. (2016) Huang, Y.-H., Chen, H.-W., Johnson, S. D., & Weiner, B. J. 2016, MNRAS, 455, 1713
- Indriolo et al. (2007) Indriolo, N., Geballe, T. R., Oka, T., & McCall, B. J. 2007, ApJ, 671, 1736
- Ingalls et al. (2011) Ingalls, J. G., Bania, T. M., Boulanger, F., et al. 2011, ApJ, 743, 174
- Ivezić et al. (2014) Ivezić, Ž., Connelly, A. J., VanderPlas, J. T., et al. 2014, Statistics, Data Mining, and Machine Learning in Astronomy, by Z. Ivencić et al. Princeton, NJ: Princeton University Press, 2014
- Iwamoto et al. (1999) Iwamoto, K., Brachwitz, F., Nomoto, K., et al. 1999, ApJS, 125, 439
- Jenkins & Peimbert (1997) Jenkins, E. B., & Peimbert, A. 1997, ApJ, 477, 265
- Johnson et al. (2015) Johnson, S. D., Chen, H.-W., & Mulchaey, J. S. 2015, MNRAS, 449, 3263
- Johnson et al. (2018) Johnson, S. D., Chen, H.-W., Straka, L. A., et al. 2018, ApJ, 869, L1
- Jura (1975) Jura, M. 1975, ApJ, 197, 581
- Kanekar et al. (2018) Kanekar, N., Prochaska, J. X., Christensen, L., et al. 2018, ApJ, 856, L23
- Kelson (2003) Kelson, D. D. 2003, PASP, 115, 688
- Kelson et al. (2000) Kelson, D. D., Illingworth, G. D., van Dokkum, P. G., & Franx, M. 2000, ApJ, 531, 159
- Kewley et al. (2004) Kewley, L. J., Geller, M. J., & Jansen, R. A. 2004, AJ, 127, 2002
- Lacour et al. (2005) Lacour, S., Ziskin, V., Hébrard, G., et al. 2005, ApJ, 627, 251
- Ledoux et al. (2006) Ledoux, C., Petitjean, P., Fynbo, J. P. U., Møller, P., & Srianand, R. 2006, A&A, 457, 71
- Ledoux et al. (2003) Ledoux, C., Petitjean, P., & Srianand, R. 2003, MNRAS, 346, 209
- Lopez et al. (2002) Lopez, S., Reimers, D., D’Odorico, S., & Prochaska, J. X. 2002, A&A, 385, 778
- Maller & Bullock (2004) Maller, A. H., & Bullock, J. S. 2004, MNRAS, 355, 694
- Mendes de Oliveira et al. (2004) Mendes de Oliveira, C., Cypriano, E. S., Sodré, L., J., & Balkowski, C. 2004, ApJ, 605, L17
- Moustakas et al. (2006) Moustakas, J., Kennicutt, Robert C., J., & Tremonti, C. A. 2006, ApJ, 642, 775
- Muzahid et al. (2016) Muzahid, S., Kacprzak, G. G., Charlton, J. C., & Churchill, C. W. 2016, ApJ, 823, 66
- Muzahid et al. (2015) Muzahid, S., Srianand, R., & Charlton, J. 2015, MNRAS, 448, 2840
- Muzzin et al. (2013) Muzzin, A., Marchesini, D., Stefanon, M., et al. 2013, ApJS, 206, 8
- Nomoto et al. (2006) Nomoto, K., Tominaga, N., Umeda, H., Kobayashi, C., & Maeda, K. 2006, Nucl. Phys. A, 777, 424
- Noterdaeme et al. (2019) Noterdaeme, P., Balashev, S., Krogager, J. K., et al. 2019, A&A, 627, A32
- Noterdaeme et al. (2007) Noterdaeme, P., Ledoux, C., Petitjean, P., et al. 2007, A&A, 474, 393
- Noterdaeme et al. (2008) Noterdaeme, P., Ledoux, C., Petitjean, P., & Srianand, R. 2008, A&A, 481, 327
- Oliveira et al. (2014) Oliveira, C. M., Sembach, K. R., Tumlinson, J., O’Meara, J., & Thom, C. 2014, ApJ, 783, 22
- Petitjean et al. (2006) Petitjean, P., Ledoux, C., Noterdaeme, P., & Srianand, R. 2006, A&A, 456, L9
- Prochaska (2003) Prochaska, J. X. 2003, ApJ, 582, 49
- Rawlins et al. (2018) Rawlins, K., Srianand, R., Shaw, G., et al. 2018, MNRAS, 481, 2083
- Reimers et al. (2003) Reimers, D., Baade, R., Quast, R., et al. 2003, A&A, 410, 785
- Reyes et al. (2008) Reyes, R., Zakamska, N. L., Strauss, M. A., et al. 2008, AJ, 136, 2373
- Richings & Faucher-Giguère (2018a) Richings, A. J., & Faucher-Giguère, C.-A. 2018a, MNRAS, 478, 3100
- Richings & Faucher-Giguère (2018b) —. 2018b, MNRAS, 474, 3673
- Richter et al. (2018) Richter, P., Fox, A. J., Wakker, B. P., et al. 2018, ApJ, 865, 145
- Rudie et al. (2017) Rudie, G. C., Newman, A. B., & Murphy, M. T. 2017, ApJ, 843, 98
- Rupke et al. (2019) Rupke, D. S. N., Coil, A., Geach, J. E., et al. 2019, Nature, 574, 643
- Salomé et al. (2016) Salomé, Q., Salomé, P., Combes, F., & Hamer, S. 2016, A&A, 595, A65
- Savage & Sembach (1996) Savage, B. D., & Sembach, K. R. 1996, ARA&A, 34, 279
- Serra et al. (2012) Serra, P., Oosterloo, T., Morganti, R., et al. 2012, MNRAS, 422, 1835
- Spitzer & Jenkins (1975) Spitzer, L., J., & Jenkins, E. B. 1975, ARA&A, 13, 133
- Spolaor et al. (2010) Spolaor, M., Kobayashi, C., Forbes, D. A., Couch, W. J., & Hau, G. K. T. 2010, MNRAS, 408, 272
- Srianand et al. (2014) Srianand, R., Rahmani, H., Muzahid, S., & Mohan, V. 2014, MNRAS, 443, 3318
- Ubachs et al. (2019) Ubachs, W., Salumbides, E. J., Murphy, M. T., Abgrall, H., & Roueff, E. 2019, A&A, 622, A127
- Walter et al. (2006) Walter, F., Martin, C. L., & Ott, J. 2006, AJ, 132, 2289
- Walter et al. (2017) Walter, F., Bolatto, A. D., Leroy, A. K., et al. 2017, ApJ, 835, 265
- Werk et al. (2008) Werk, J. K., Putman, M. E., Meurer, G. R., et al. 2008, ApJ, 678, 888
- Young et al. (2011) Young, L. M., Bureau, M., Davis, T. A., et al. 2011, MNRAS, 414, 940
- Zahedy et al. (2020) Zahedy, F. S., Chen, H.-W., Boettcher, E., et al. 2020, ApJ, 904, L10
- Zahedy et al. (2017) Zahedy, F. S., Chen, H.-W., Gauthier, J.-R., & Rauch, M. 2017, MNRAS, 466, 1071
- Zahedy et al. (2019) Zahedy, F. S., Chen, H.-W., Johnson, S. D., et al. 2019, MNRAS, 484, 2257
- Zahedy et al. (2016) Zahedy, F. S., Chen, H.-W., Rauch, M., Wilson, M. L., & Zabludoff, A. 2016, MNRAS, 458, 2423
- Zou et al. (2018) Zou, S., Petitjean, P., Noterdaeme, P., et al. 2018, A&A, 616, A158