11email: ruslan.aliev@skoltech.ru 22institutetext: National Medical and Surgical Center named after N.I. Pirogov, Moscow, Russia
22email:
Convolutional neural networks for automatic detection of Focal Cortical Dysplasia
Abstract
Focal cortical dysplasia (FCD) is one of the most common epileptogenic lesions associated with cortical development malformations. However, the accurate detection of the FCD relies on the radiologist professionalism, and in many cases, the lesion could be missed. In this work, we solve the problem of automatic identification of FCD on magnetic resonance images (MRI). For this task, we improve recent methods of Deep Learning-based FCD detection and apply it for a dataset of 15 labeled FCD patients. The model results in the successful detection of FCD on 11 out of 15 subjects.
keywords:
FCD, Deep learning, MRI1 Introduction
The imaging and computational technologies’ latest achievements facilitated the rapid development of the decision support systems based on medical images [10]. Application of the machine learning and computer vision methods in medical imagery showed that the prediction and prognosis could be made automatically to identify pathological changes and make a medical prognosis [9]. At the same time, the high cost of the manual radiological examination determines the urge to develop such systems for the automated analysis in neuroimaging data as well as using machine learning methods to support the radiological process, increase the effectiveness and quality of the diagnostics.
Focal cortical dysplasia (FCD) is one of the most common epileptogenic lesions associated with malformations of cortical development [11]. The development of a decision support system for radiologists in FCD detection is important, and it urges large and rigorously annotated datasets. However, even on small samples with a weak annotation, the FCD detection could be enhanced with the means of deep learning tricks, such as autoencoder pretraining on unannotated data.
We acknowledge our project medical partner science-practical center n.a. Pirogov for annotated data. We acknowledge Zhores HPC cluster for the computation facilities. All code for experiments is publicly available111https://github.com/alievrusik/cnn_fcd_detection.
1.1 Related works
Currently, there are plenty of methods for automatic FCD detections. Previous approaches rely on the brain’s symmetric structure, template matching, and feature estimations, using conventional machine learning techniques. Some statistics (e.g., cortical thickness, GM-WM blur, T1 hyper-intensity) are estimated and fed into decision system (e.g. Support Vector Machine) [1], [2]. Such methods require severe feature engineering.
Recently, deep-learning-based methods were proposed for FCD detection. In [3] authors use U-Net like architecture for building FCD segmentation model. They train the network using sagittal slices and get DICE score of 52.47, which is superior to non-neural-networks approaches. In [13], authors combine classical computer vision and deep learning techniques using special patch extraction techniques, CNN classification, and post-processing. It yields state-of-the-art results in terms of accuracy (classification) and Intersection over Union (detection).
In this paper, we reproduce the state-of-the-art method proposed in [13], and made several significant improvements to enhance its performance on the dataset provided by our medical partners.
2 Data and methods
For training we used 15 labeled FCD subjects (Pirogov), 15 unlabeled FCD subjects (Pirogov) and 17 healthy control subjects from HCP [12] and LA5 [7] datasets. The subjects were scanned by the SIEMENS MAGNETRON Scyra 3T scanner with resolution 256x256x256 voxels. In all experiments, we use leave-one-out (LOO) validation scheme.
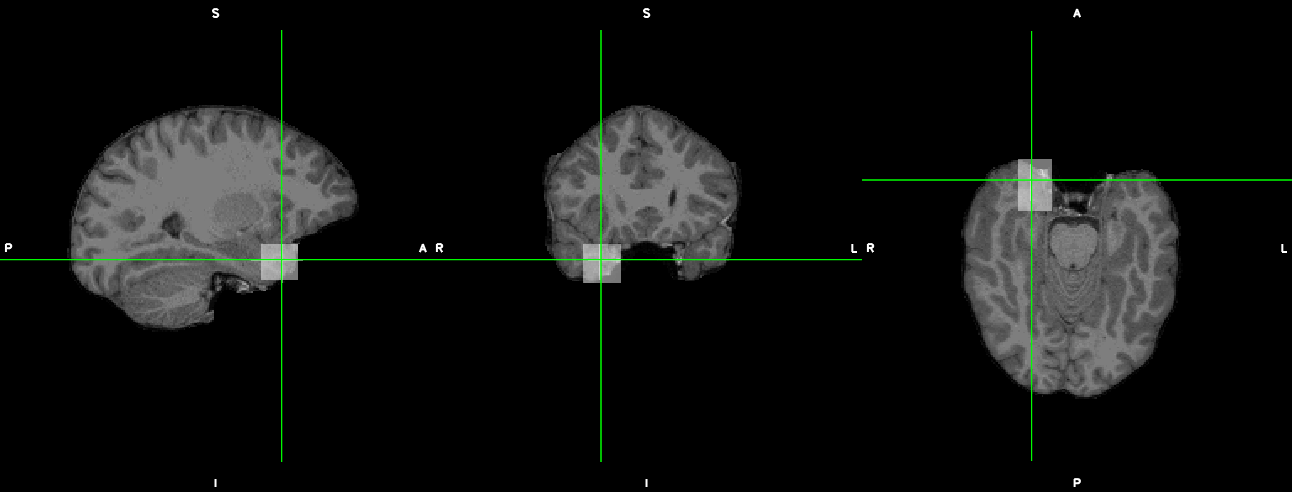
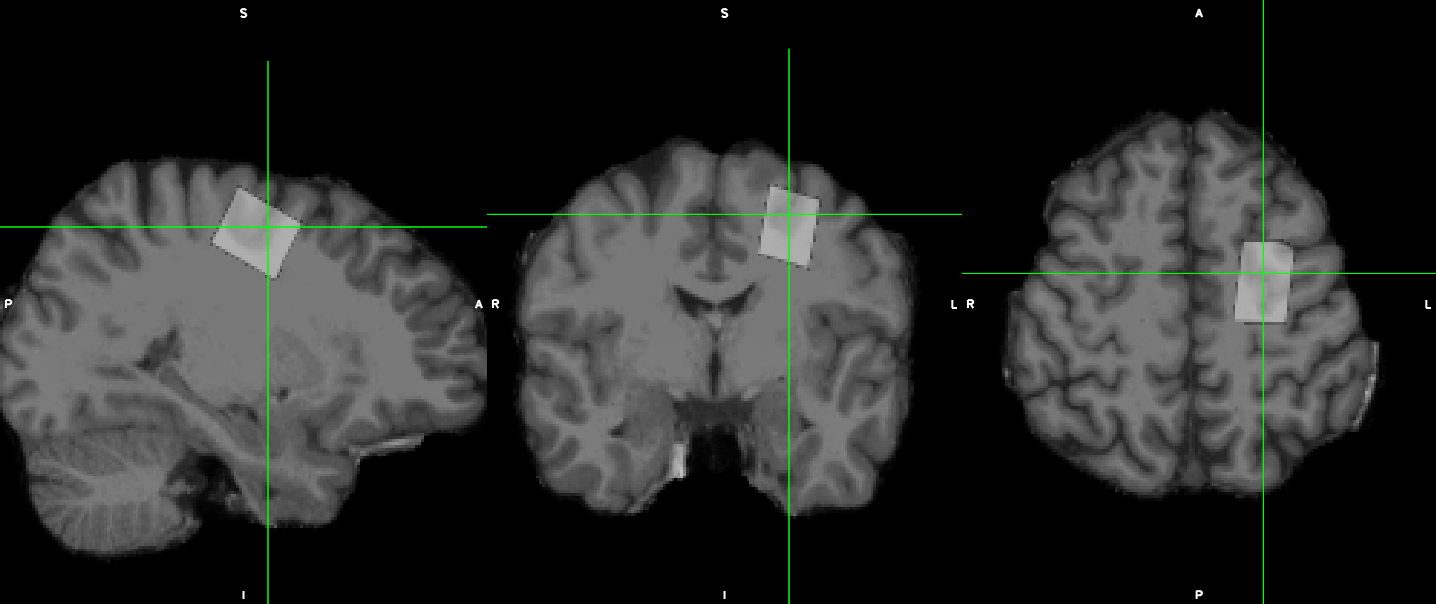
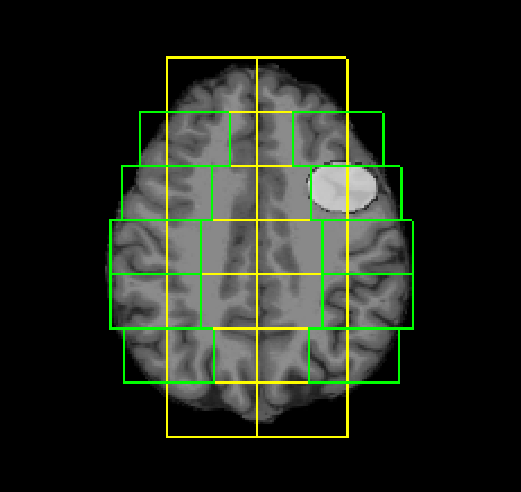
It worth to mention that unlikely to previous works we have weak annotation of FCD subjects. The labeled subjects are annotated with 2D bounding boxes per each view (sagittal, coronal, axial) by professional radiologist (see fig. 1(a)). The input MR image is first preprocessed to correct the bias field, align with a standard atlas (MNI152 1mm template [5]), and strip the non-brain tissues (FSL [4] and FreeSurfer [8] software). Also intensities were normalized with Histogram Standardization and Z-normalization using TorchIO library [6]. To obtain 3D ground truth FCD regions, for each subject we fitted parallelepiped into 2D boxes.
As a baseline model, we use the method proposed in [13]. It consists of 4 major steps: 1) preprocessing, 2) brain patch extraction, 3) deep learning classification, and 4) postprocessing. We suggest referring to the original article for further details.
Our main goal is to create an assisting tool for professional radiologists. As a key part of the algorithm is patch extraction, it seems natural to assess models by evaluating probabilities assigned to patches. So we introduce Top-k score metric for model evaluation. At the inference stage, we take top patches by probabilities and estimate whether at least one of them intersects with the ground-truth FCD region. In that case, we mark it as successful detection. Then we average it across all validation subjects.
2.1 Improvements
The baseline model yielded a top-k score of 0.2. We made some iterative improvements to boost its performance. Careful ablation study is given in table 1 (configurations a-g).
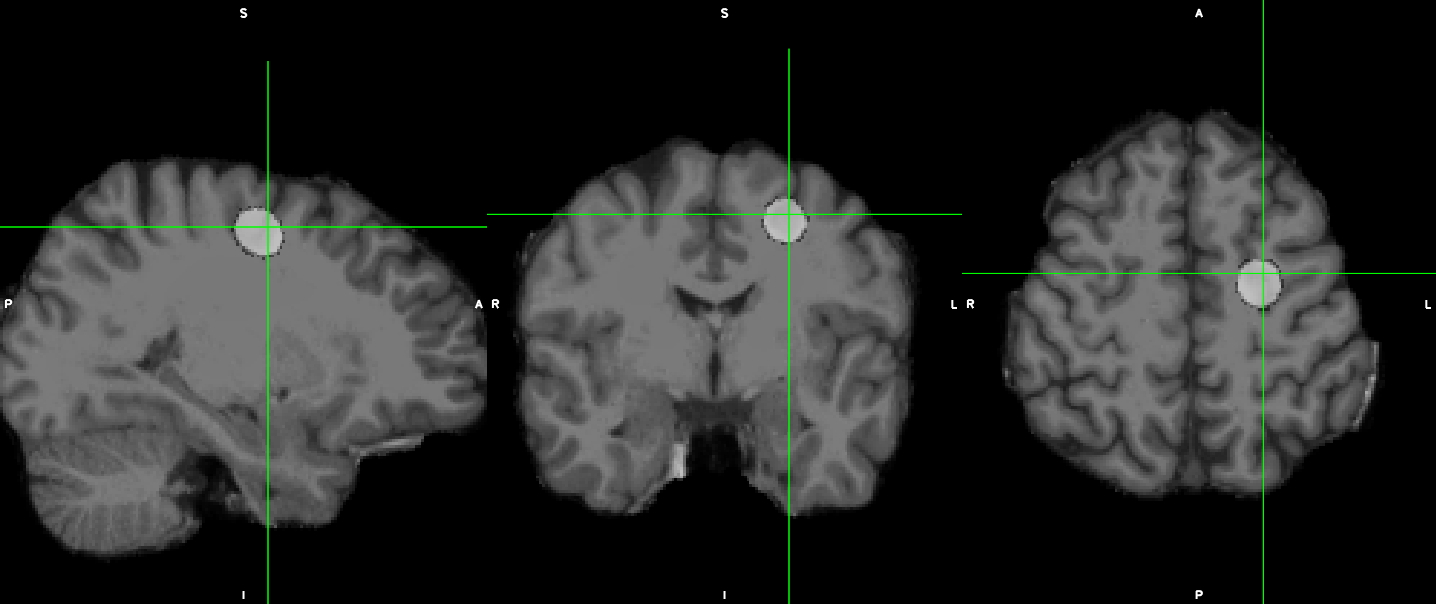
Data was labeled with 2D boxes on each of the axial, coronal, and sagittal slices. It is not correct to put a 3D rectangular box onto them, as, firstly, large non-FCD regions will be marked as FCD. Secondly, rectangularity is lost at the image alignment step. To overcome this issue, we inscribe a 3D ellipse to use it as a mask (see fig. 1(c)).
Furthermore, we refused to use hard labeling (i.e., any non-zero intersection leads to ’1’ labeling) for this task and, instead, use soft labeling. Ellipse mask still captures some non-FCD regions. Hence it is fair to give labels according to how big the overlap is. We calculated the number of overlapping voxels with an FCD mask for each patch, divided it by the maximum number for a given subject. We want labels for big-overlap patches to be close to 1, and labels for small-overlap patches to be around 0.5. This can be achieved by taking the fifth root of the acquired number.
Analyzing the patch extraction procedure, we noticed that size 16x32 is actually too small to cover all brain regions. Some FCD areas were just missed. So we increased the patch size from 16x32 to 24x40.
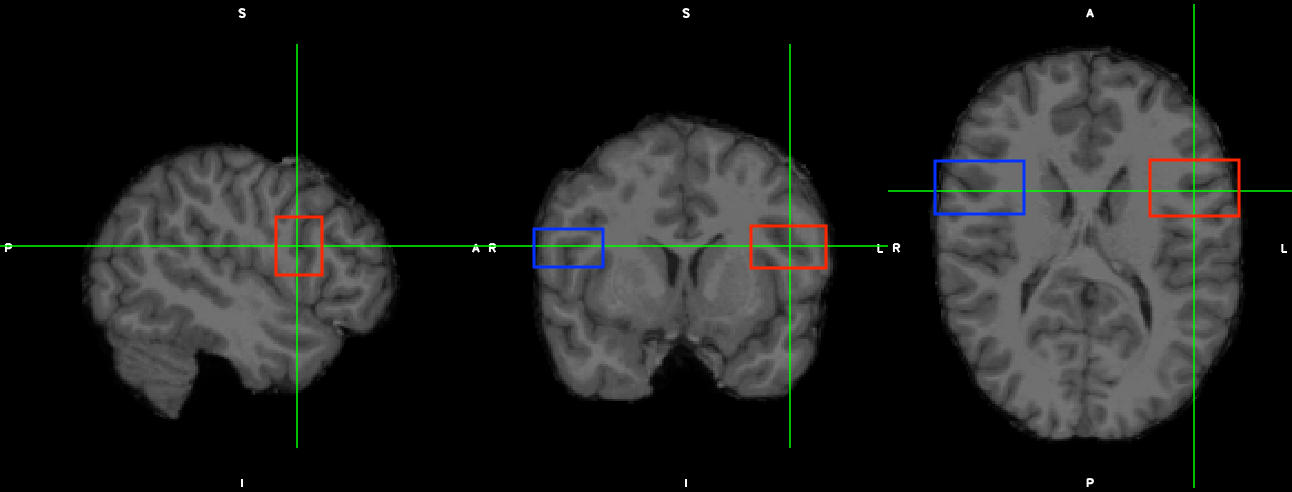
To further boost performance, we asked ourselves why not to use all dimensions, taking slices from coronal and sagittal slices. For each axial slice, one should consider the axial slice itself, coronal slice crossing with it at the center, and sagittal slice crossing with it at the center, as well as their ’mirrored’ neighbors (see fig. 2(a)). Now each input tensor is of shape 6x24x40.
It worth to mention that 8 out of 15 subjects have FCD located in the temporal gyrus, while 7 out of 15 subjects have FCD located in the non-temporal region. Temporal and non-temporal FCD regions are very different from their nature. CNN model tends to overfit to temporal zone, which results in model yielding high probabilities for temporal patches of non-temporal subjects. To overcome this issue, we separately train models for temporal and non-temporal FCD subjects. We will refer to it as ensembling specific-to-localization models.
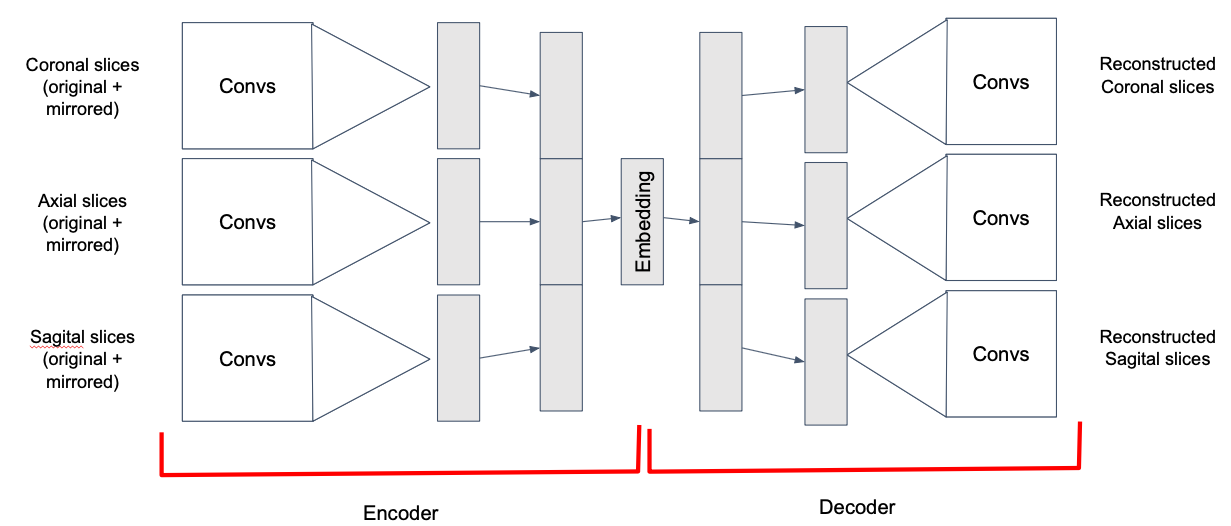
We also pretrain autoencoder to take advantage of 15 unlabeled FCD subjects of the same modality as the 15 labeled ones. It is incorrect to concatenate all slices into multi-channel image, so we use autoencoder with ’3 heads - 3 tails’ architecture (see 2(b)). Each slice pair is processed by its own convolution, concatenating results and applying one more linear operation afterward. The decoder is a mirrored version of the encoder.
3 Results
| Model | Top-20 score |
|---|---|
| (a) baseline model | 0.200 |
| (b) + soft patch labeling | 0.266 |
| (c) + increased patch size | 0.400 |
| (d) + autoencoder pretraining | 0.533 |
| (e) + specific-to-localization models | 0.733 |
| (f) + coronal slices | 0.667 |
| (g) + sagittal slices | 0.733 |
In table 1, it is shown that the largest boost in model performance was given by ensembling specific-to-localization models. Using coronal or sagittal slices did not lead to better results, though without ensembling specific-to-localization models, it did.
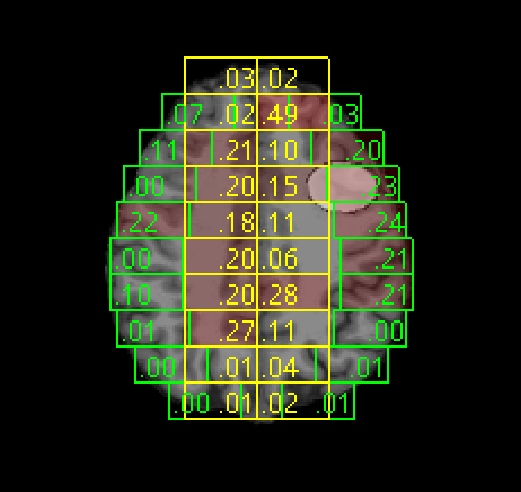
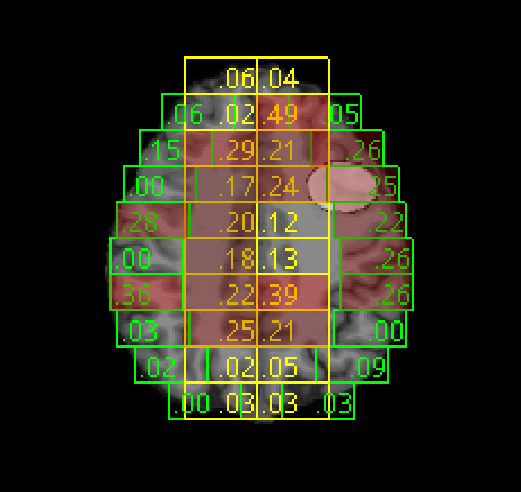
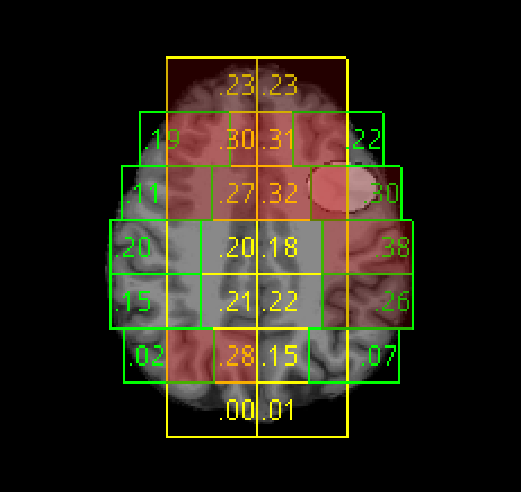
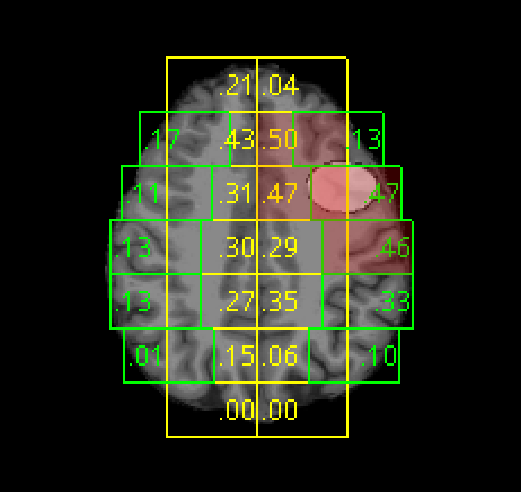
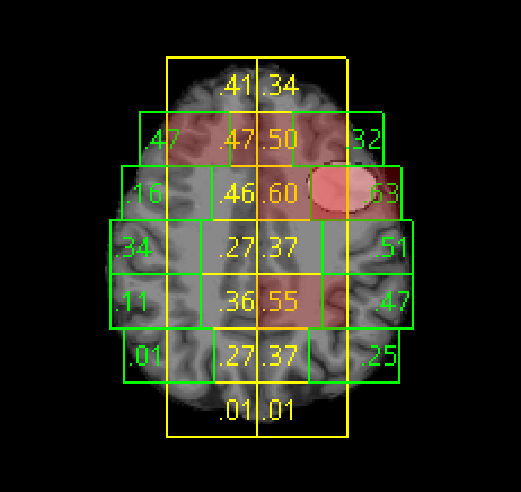
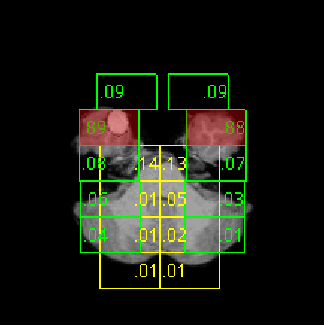
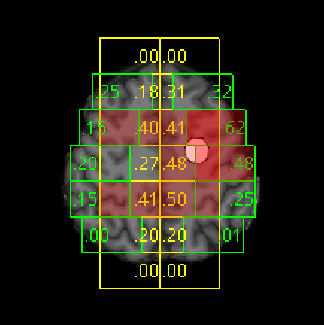
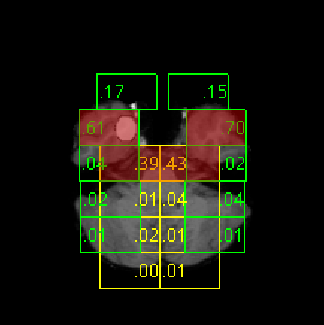
For each configuration visualisation is provided on figure 3. For configuration (a), one can notice that model tends to give higher probabilities for middle patches. Configurations (a)-(d) provides relatively high probabilities for non-FCD patches (False Positives), but captures desired. Configuration (f) tends to saturate the probabilities of patches. However, it does give the highest probability to FCD patch (see 3(f)). We did not notice an improvement in visualization for configurations (f) and (g) compared to (e).
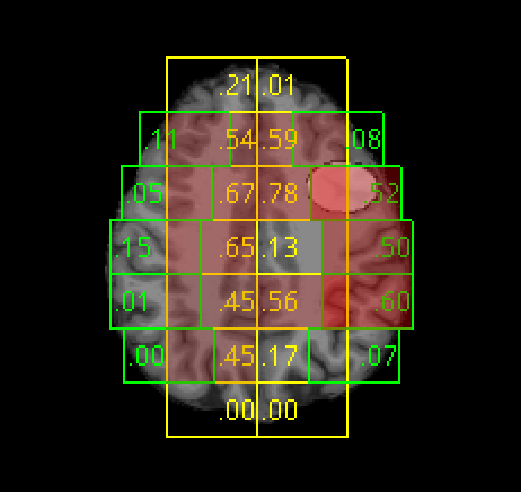
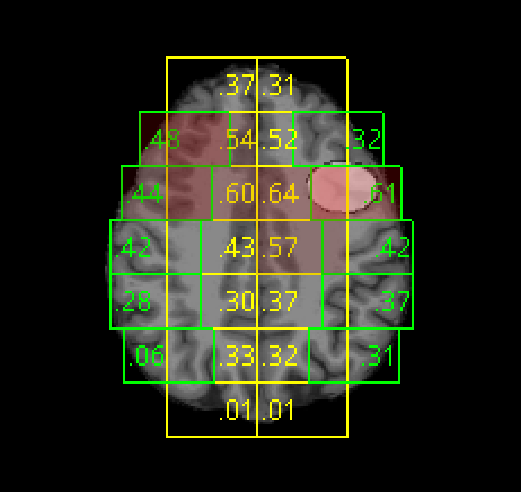
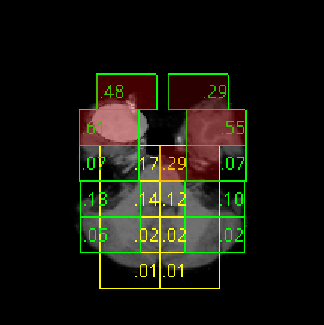
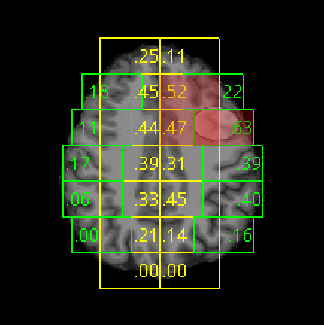
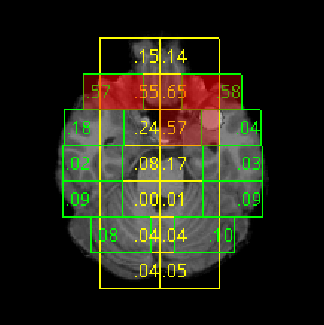
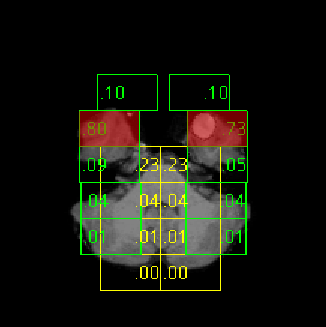
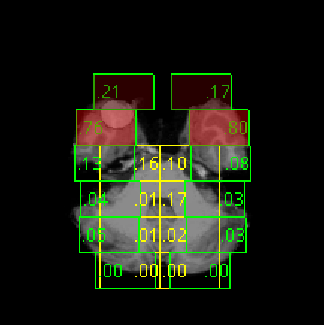
We provide several examples of configuration (e) model’s performance (see fig 4). Generally, model tends to capture all FCD-located patches. However, model has problem with distinguishing FCD patches and their mirrored versions, especially for ones located in temporal gyrus. Some FCD regions are predicted with relatively small probability. It is caused either by small size of FCD regions (4(b)) or by lack of characteristic features of FCD, e.g. increased thickness or assymetry (4(g)).
The best top-20 score is 0.733, so FCD regions were successfully detected for 11 out of 15 subjects. We recommend using configuration (e), as it is harder to interpret results by models using slices from extra dimensions (f, g).
4 Conclusion
In the current work we reproduced a state-of-the-art DL-based method for FCD detection and proposed new metric for FCD detection algorithm’s assessment. We investigated several ways to improve current approach specifically to deal with weakly annotated FCD data. We significantly boosted the FCD-detection CNN models performance with the use of soft labeling, autoencoder pretraining and ensembling specific-to-localization models.
References
- [1] Besson, P., Bernasconi, N., Colliot, O., Evans, A., Bernasconi, A.: Surface-based texture and morphological analysis detects subtle cortical dysplasia. In: International Conference on Medical Image Computing and Computer-Assisted Intervention. pp. 645–652. Springer (2008)
- [2] Colliot, O., Mansi, T., Bernasconi, N., Naessens, V., Klironomos, D., Bernasconi, A.: Segmentation of focal cortical dysplasia lesions on mri using level set evolution. Neuroimage 32(4), 1621–1630 (2006)
- [3] Dev, K.B., Jogi, P.S., Niyas, S., Vinayagamani, S., Kesavadas, C., Rajan, J.: Automatic detection and localization of focal cortical dysplasia lesions in mri using fully convolutional neural network. Biomedical Signal Processing and Control 52, 218–225 (2019)
- [4] Jenkinson, M., Beckmann, C.F., Behrens, T.E., Woolrich, M.W., Smith, S.M.: Fsl. Neuroimage 62(2), 782–790 (2012)
- [5] Mazziotta, J., Toga, A., Evans, A., Fox, P., Lancaster, J., Zilles, K., Woods, R., Paus, T., Simpson, G., Pike, B., et al.: A probabilistic atlas and reference system for the human brain: International consortium for brain mapping (icbm). Philosophical Transactions of the Royal Society of London. Series B: Biological Sciences 356(1412), 1293–1322 (2001)
- [6] Pérez-García, F., Sparks, R., Ourselin, S.: TorchIO: a Python library for efficient loading, preprocessing, augmentation and patch-based sampling of medical images in deep learning. arXiv:2003.04696 [cs, eess, stat] (Mar 2020), http://arxiv.org/abs/2003.04696, arXiv: 2003.04696
- [7] Poldrack, R.A., Barch, D.M., Mitchell, J., Wager, T., Wagner, A.D., Devlin, J.T., Cumba, C., Koyejo, O., Milham, M.: Toward open sharing of task-based fmri data: the openfmri project. Frontiers in neuroinformatics 7, 12 (2013)
- [8] Reuter, M., Schmansky, N.J., Rosas, H.D., Fischl, B.: Within-subject template estimation for unbiased longitudinal image analysis. Neuroimage 61(4), 1402–1418 (2012)
- [9] Sharaev, M., Artemov, A., Kondrateva, E., Sushchinskaya, S., Burnaev, E., Bernstein, A., Akzhigitov, R., Andreev, A.: Mri-based diagnostics of depression concomitant with epilepsy: in search of the potential biomarkers. In: 2018 IEEE 5th International Conference on Data Science and Advanced Analytics (DSAA). pp. 555–564. IEEE (2018)
- [10] Shin, H.C., Roth, H.R., Gao, M., Lu, L., Xu, Z., Nogues, I., Yao, J., Mollura, D., Summers, R.M.: Deep convolutional neural networks for computer-aided detection: Cnn architectures, dataset characteristics and transfer learning. IEEE transactions on medical imaging 35(5), 1285–1298 (2016)
- [11] Tassi, L., Colombo, N., Garbelli, R., Francione, S., Lo Russo, G., Mai, R., Cardinale, F., Cossu, M., Ferrario, A., Galli, C., et al.: Focal cortical dysplasia: neuropathological subtypes, eeg, neuroimaging and surgical outcome. Brain 125(8), 1719–1732 (2002)
- [12] Van Essen, D.C., Smith, S.M., Barch, D.M., Behrens, T.E., Yacoub, E., Ugurbil, K., Consortium, W.M.H., et al.: The wu-minn human connectome project: an overview. Neuroimage 80, 62–79 (2013)
- [13] Wang, H., Ahmed, S.N., Mandal, M.: Automated detection of focal cortical dysplasia using a deep convolutional neural network. Computerized Medical Imaging and Graphics 79, 101662 (2020)