Impact of crop diversification on tribal farmer’s income: A case study from Eastern ghats of India
Abstract
In this investigation we analyze impact of diversification of agriculture on farmer’s income, a study from primitive tribal groups from eastern ghats of India. We have taken crop diversification index to measure the extent and regression formalism to analyze the impact, of crop diversification. Descriptive statistics is employed to know the average income of the farmers, paired results of crop diversification index. We observed a positive impact on crop diversification in scheduled areas and investigated reasons where it did not work.
Key words— Diversification of agriculture, Tribal farming, Farm households, Agribusiness
JEL codes— Q12, Q13
1 Introduction
1.1 Crop diversification and tribal farming
Diversification of agriculture refers to shift of the production of a single crop to number of crops and from paddy to non-paddy crops, for example shift in the production pattern from the cereals to the high value crops [1]. It reduces the risk involved in traditional agricultural practices to get better returns in modern agricultural practices [2]. Agricultural diversification leads to increase in the standard of living of the people and increase in the demand of the high value crops [3]. The factors like High yielding variety (HYV) seeds, irrigation, rainfall, size of the lands availability of market, are key factors that influence diversification of agriculture practices [4].
The primitive tribal groups (PTGs) [5] in Eastern Ghats of India used to cultivate millet (Finger millet/Mandia, Foxtail millet/Kangu, Little millet/Suan) by Shift Cultivation (Podu cultivation) [6]. For rest of food requirements either they used hunting or depended on forest collections viz, edible roots (sweet patato), Bamboo shoots (Karadi), mahuwa flowers, tamarind etc. Podu cultivation caused heavy deforestation and added adverse effect to global warming [7]. So government agencies incorporated various steps [8] for suggesting them land based agriculture, which mostly was paddy (rice) until 2008-09 in the surveyed areas. Demonstration of few things convinced them for crop diversification viz.,benefit in less time, multiple time harvesting in single farming session, availability of market in local areas, possibility of higher price than traditional crops are few of them. The crop diversification started after that in small scale. Once the farmers get some short period benefits they started crop diversification to a larger extent.
We choose Koraput (18.8135 N, 82.7123 E) district of state of Odisha, situated around 2nd major mountain peaks of Eastern ghat (1672 m) and at elevation of 870 m. Here one can see 84% of tribal groups (52 tribes out of 62) seen in entire Odisha [9, 10]. Surveyed area chosen basing on two factors; areas where at least 60% of population dominated by tribal groups (Raniput/Village 1, Soralguda/Village2, Mundaguda/Village 3, Ekomba/Village 4 and Rupabeda/Village 5) and those areas have adopted crop diversification in recent years (13 such crops were considered).
As primary data, selection of village was done under purposive sampling according to the tribal concentration (ST). We had prepared structured interview schedule to collect the data of 80% of the households. These households were chosen from each village by simple random sampling method. The time period chosen was 2008-09, 2013-14 and 2018-2019. We choose 2008-09 as base year. For the reason, only few crops were attempted before and too less people involved in diversification. And then we collected data for 5 years after that, for two terms; i.e. 2013 and in 2018. Authors carefully surveyed those villages and collected primary data used for this analysis.
1.2 Profile of the Study Area
We have considered such villages where tribal groups are more than 60% and these villages should be small in size. Census data is represented in Tab. 1. The villages tribal population vary from 65% to 100% as per last census by Govt. of India [14]. Number of families in these villages vary from a minimum of 68 to 132 families, with all family members from 227 to 608 in maximum. Literacy goes as minimum of 16% (for mostly tribal populated village) to 53.91%; the upper limit even less than state average which is 72.87% [14].
| Particulars | Village 1 | Village 2 | Village 3 | Village 4 | Village 5 |
| No. of families | 103 | 122 | 134 | 100 | 68 |
| Total family members | 495 | 423 | 608 | 442 | 227 |
| Child (0-6 age) | 108 | 84 | 130 | 71 | 41 |
| Schedule Tribe (in %) | 65.05 | 64.77 | 77.3 | 80.77 | 99.56 |
| Schedule Caste (in %) | 20.08 | 21.04 | 0. | 0.97 | 0. |
| Literacy (in %) | 38.76 | 36.58 | 35.36 | 53.91 | 16.13 |
To get information about the number of people being involved in crop diversification, we prepared a list of worker class. This can be found in Tab. 2. Total workers who are involved in agricultural sector vary from a minimum of 144 to 317 maximum. Definition of main workers are those, who get the employment more than 6 months a year. And those who are engaged in works less than 6 months a year we call them marginal workers [14]. Except one village, we see almost a 50-50 number for main worker and marginal worker.
| Particulars | Village 1 | Village 2 | Village 3 | Village 4 | Village 5 |
|---|---|---|---|---|---|
| Total Workers | 215 | 244 | 317 | 267 | 144 |
| Main Worker (in %) | 45.12 | 47.95 | 47 | 35.12 | 56.94 |
| Marginal Worker (in %) | 54.88 | 52.05 | 53 | 64.79 | 43.06 |
1.3 Area allocation for crop diversification
One can get information about irrigated and non-irrigated areas (in possession ) of a village from the Govt sources [15, 16]. However the actual land used for cultivation may vary for various reasons. Authors from their filed survey inquired about the actual land used for crop diversification and presented them (in %) in Tab. 3. From irrigated areas (apart from paddy harvesting session which is 60-90 days), one needs 45-60 days for vegetable harvesting to start. Depending upon vegetable, it goes 60-90 days harvesting time.
| Year | Crop | Village 1 | Village 2 | Village 3 | Village 4 | Village 5 |
| 2008-09 | Paddy | 100 | 93.4 | 83.61 | 76.77 | 100 |
| Spiny gourd | 0 | 0 | 0 | 0 | 0 | |
| Pointed gourd | 0 | 0 | 0 | 0 | 0 | |
| Coccinia | 0 | 0 | 0 | 0 | 0 | |
| Brinjal | 0 | 4.26 | 3.42 | 0 | 0 | |
| Cowpea | 0 | 0 | 0 | 0 | 0 | |
| Ladies finger | 0 | 2.3 | 0 | 0 | 0 | |
| Tamato | 0 | 0 | 1.6 | 1.62 | 0 | |
| Beans | 0 | 0 | 0 | 0 | 0 | |
| Cabbage | 0 | 0 | 0 | 0 | 0 | |
| Green peas | 0 | 0 | 0 | 0 | 0 | |
| Pumpkin | 0 | 0 | 0 | 2.17 | 0 | |
| Maize | 0 | 0 | 0 | 7.83 | 0 | |
| Sugarcane | 0 | 0 | 11.37 | 8.61 | 0 | |
| 2013-14 | Paddy | 48 | 85.34 | 78.89 | 72.08 | 91.28 |
| Spiny gourd | 12.36 | 0 | 0 | 0 | 0 | |
| Pointed gourd | 9.84 | 0 | 0 | 0 | 0 | |
| Coccinia | 5.23 | 0 | 0 | 0 | 0 | |
| Brinjal | 5.76 | 7.26 | 4.92 | 0 | 8.72 | |
| Cowpea | 11.91 | 0 | 0 | 0 | 0 | |
| Ladies finger | 0 | 3.27 | 0 | 0 | 0 | |
| Tamato | 0 | 0 | 6.33 | 4.35 | 0 | |
| Beans | 0 | 4.13 | 0 | 0 | 0 | |
| Cabbage | 0 | 0 | 4.83 | 0 | 0 | |
| Green peas | 0 | 0 | 2.47 | 0 | 0 | |
| Pumpkin | 0 | 0 | 0 | 2.82 | 0 | |
| Maize | 0 | 0 | 0 | 11.54 | 0 | |
| Sugarcane | 6.9 | 0 | 2.56 | 9.21 | 0 | |
| 2018-19 | Paddy | 43 | 73.77 | 40.16 | 63.4 | 82.85 |
| Spiny gourd | 18.6 | 0 | 0 | 0 | 0 | |
| Pointed gourd | 11.2 | 0 | 0 | 0 | 0 | |
| Coccinia | 6.21 | 2.6 | 0 | 0 | 5.17 | |
| Brinjal | 5.14 | 8.42 | 4.37 | 0 | 9.4 | |
| Cowpea | 9.62 | 0 | 0 | 0 | 2.58 | |
| Ladies finger | 0 | 6.91 | 0 | 0 | 0 | |
| Tamato | 0 | 0 | 6.42 | 4.67 | 0 | |
| Beans | 0 | 8.3 | 0 | 0 | 0 | |
| Cabbage | 0 | 0 | 9.43 | 0 | 0 | |
| Green peas | 0 | 0 | 7.25 | 0 | 0 | |
| Pumpkin | 0 | 0 | 0 | 3.84 | 0 | |
| Maize | 0 | 0 | 0 | 14.52 | 0 | |
| Sugarcane | 6.23 | 0 | 12.66 | 13.57 | 0 |
1.4 Harvesting and selling strategy in study area
We asked individual farmers and about their selling strategy and price they got for it. They use to pluck the vegetable crops (Spiny guard, Pointed guard Coccinia, Cowpea, Ladies finger, tomatto, beans) in every 3 days a week for 3 months and sell it in the nearby markets (either in wholesale or retail). For Brinjal and Green peas they use to pluck once in a week for 2 months. Coming to Sugarcane, maize, pumpkin, cabbage, these are one time harvesting products but you can harvest sugarcane once in a year for 3 years. The farmers also sell Pumpkin plant’s fruit, flower and leaf. In a good market the farmer’s get a supporting price for the crops also depends on the spending habit of the people but it is not possible at some regions where the farmer’s won’t get a good market nearer to their villages. The crops like maize and sugarcane got a good market in recent years. From their unit selling price and total amount of crop yield, we estimated the total income of the farmer. In Tab. 4 we listed one can find crops yield amount per acre, for every single crop that we considered in this study.
| Year | Crop | Village 1 | Village 2 | Village 3 | Village 4 | Village 5 |
| 2008-09 | Paddy | NA | NA | NA | NA | NA |
| Spiny gourd | 0 | 0 | 0 | 0 | 0 | |
| Pointed gourd | 0 | 0 | 0 | 0 | 0 | |
| Coccinia | 0 | 0 | 0 | 0 | 0 | |
| Brinjal | 0 | 120 | 50 | 0 | 0 | |
| Cowpea | 0 | 0 | 0 | 0 | 0 | |
| Ladies finger | 0 | 110 | 0 | 0 | 0 | |
| Tamato | 0 | 0 | 80 | 40 | 0 | |
| Beans | 0 | 0 | 0 | 0 | 0 | |
| Cabbage | 0 | 0 | 0 | 0 | 0 | |
| Green peas | 0 | 0 | 0 | 0 | 0 | |
| Pumpkin | 0 | 0 | 0 | 20 | 0 | |
| Maize | 0 | 0 | 0 | 9 | 0 | |
| Sugarcane | 0 | 0 | 90 | 40 | 0 | |
| 2013-14 | Paddy | NA | NA | NA | NA | NA |
| Spiny gourd | 70 | 0 | 0 | 0 | 0 | |
| Pointed gourd | 60 | 0 | 0 | 0 | 0 | |
| Coccinia | 52 | 0 | 0 | 0 | 0 | |
| Brinjal | 70 | 90 | 60 | 0 | 51 | |
| Cowpea | 70 | 0 | 0 | 0 | 0 | |
| Ladies finger | 0 | 110 | 0 | 0 | 0 | |
| Tamato | 0 | 0 | 90 | 45 | 0 | |
| Beans | 0 | 120 | 0 | 0 | 0 | |
| Cabbage | 0 | 0 | 120 | 0 | 0 | |
| Green peas | 0 | 0 | 40 | 0 | 0 | |
| Pumpkin | 0 | 0 | 0 | 22 | 0 | |
| Maize | 0 | 0 | 0 | 10 | 0 | |
| Sugarcane | 120 | 0 | 120 | 40 | 0 | |
| 2018-19 | Paddy | NA | NA | NA | NA | NA |
| Spiny gourd | 92 | 0 | 0 | 0 | 0 | |
| Pointed gourd | 60 | 0 | 0 | 0 | 0 | |
| Coccinia | 52 | 2 | 0 | 0 | 70 | |
| Brinjal | 70 | 90 | 70 | 0 | 64 | |
| Cowpea | 85 | 0 | 0 | 0 | 60 | |
| Ladies finger | 0 | 110 | 0 | 0 | 0 | |
| Tamato | 0 | 0 | 55 | 40 | 0 | |
| Beans | 0 | 120 | 0 | 0 | 0 | |
| Cabbage | 0 | 0 | 80 | 0 | 0 | |
| Green peas | 0 | 0 | 40 | 0 | 0 | |
| Pumpkin | 0 | 0 | 0 | 16 | 0 | |
| Maize | 0 | 0 | 0 | 9 | 0 | |
| Sugarcane | 120 | 0 | 70 | 50 | 0 |
2 Methodology
2.1 Description of variables
We measured the crop diversification index through simple linear regression (SLR) model. It examines impact of crop diversification on farmer’s income in the study area.
Crop diversification Index (CDI) as given by Gibbs and Martin’s technique [17]:
| (1) |
Where X = area under individual crops (in %).
The value of CDI lies between zero and one; zero indicates no diversification and unity states cent percent diversification. We have taken 2 variables: Crop Diversification, Farmer’s income
Crop Diversification:
Crop diversification is considered as one of important parameters of growth of an economy [18]. In the study area the farmer’s started crop diversification from paddy to vegetables in the recent years. Here, we have taken the area diversified for crop from a traditional practice of paddy to vegetables. It is used as the independent variable.
Farmer’s income:
The income plays a very important role for the further inducement for investment and to take risks [19]. Here we have taken income as the dependent variable.
2.2 The Model
Here we have taken crop diversification as the independent variable and farmer’s income as dependent variable. Here, we would analyze change in the crop diversification leads to the change in farmer’s income.
Y = [20]
Where, Y = income (dependent variable),
= estimate of the regression intercept,
= estimate of the regression slope,
= crop diversification (Independent variable),
and is error term.
3 Results and discussion
3.1 Linear regression analysis
In Tab. 5 we have calculated regression variables for the year 2013-14 and 2018-19 along with base year 2008-09.
Standard Deviation (SD) of the mean value (by direct method) may be calculated as:
| (2) |
Where x = difference of value of X from it’s mean and N is number of data points.
| Variables | Year | Village 1 | Village 2 | Village 3 | Village 4 | Village 5 |
| CDI(X) | 2008-09 | 0 | 0.544635 | 0.534312 | 0.348866 | 0 |
| 2013-14 | 0.184757 | 0.374367 | 0.224981 | 0.314127 | 1. | |
| 2018-19 | 0.205522 | 0.2824 | 0.224834 | 0.322143 | 0.413927 | |
| Mean CDI | 0.130093 | 0.400467 | 0.328042 | 0.328379 | 0.471309 | |
| SD of CDI | 0.0923794 | 0.108636 | 0.145855 | 0.0148518 | 0.41026 | |
| Income (Y) (in crores) | 2008-09 | 0. | 0.14 | 0.27 | 0.32 | 0 |
| 2013-14 | 0.97 | 0.36 | 0.64 | 0.52 | 0.0247 | |
| 2018-19 | 1.82 | 0.71 | 1.03 | 0.86 | 0.063 | |
| Mean Income | 0.93 | 0.403333 | 0.646667 | 0.566667 | 0.0292333 | |
| SD of Income | 0.74355 | 0.23471 | 0.310304 | 0.22291 | 0.0259186 |
A simple linear regression (SLR) may be written as:
| (3) | ||||
| (4) | ||||
| (5) |
Application of SLR to the descriptive statistics can be found in Tab. 6. Here we have calculated SLR to all five village data.
| Village Name | |||
|---|---|---|---|
| Village 1 | 7.43324 | -0.0370122 | |
| Village 2 | -2.06297 | 1.22949 | |
| Village 3 | -1.82654 | 1.24585 | |
| Village 4 | -9.3954 | 3.65192 | |
| Village 5 | 0.0187025 | 0.0204187 |
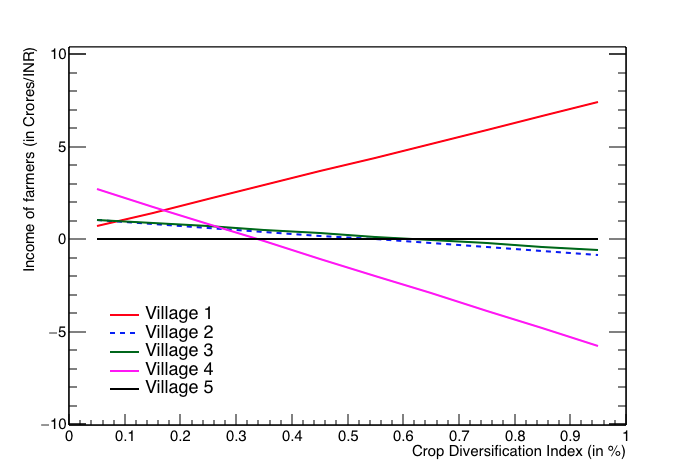
In Fig. 1 we have plotted regression equation with CDI as mentioned in Tab. 6. The figure explains the change of income of farmers by crop diversification in the study area. In Village 1 and Village 5, we can see there is an increasing trend (Village 5 change is not visible in the figure). The straight line speaks that there has been an increase, on the income of the farmers, in Village 1. The factors that supported for this positive impact can be a good nearby market i.e. Jeypore market, which is < 6km (Boipariguda market for Village 5, which is < 10kms)where the demand for the green vegetables is quite high supported by a better road communication. In the villages like Village 2 and Village 3, though there are instances of crop diversification but it hasn’t made a remarkable impact on the income of the farmer’s. There are two reasons responsible for this. In the first place they don’t have a good market and lack of a storage facility. So this made difference. In Village 4, we can experience a much decreasing trend because the village lacks low communication facility and lack of supporting price.
4 Conclusion and policy recommendations
We have investigated effect on tribal farmers income from crop diversification. Farmers data taken from such places where tribal population is dominated in South Odisha. From the area used for farming we observe that, there is increasing allocation of land for crop diversification from traditional paddy (rice or ragi) to vegetables (13 such we have analyzed). For the year 2008-09, where almost zero land used for vegetable crop, almost 50% of land used in the years 2013-14 and 2018-19. Hence CDI increases to a factor 11%. In case of some vegetables the extent of the crop diversification is very high but on an average it is very slow. Regression analysis suggests that, the crop diversification has a positive impact on the farmer’s income. This findings is consistent in all five areas where the data samples were taken.
Limitations of this study, is that we did not consider crop diversification or production, for house kitchen purposes. This factor although do not represent the amount of yield to be considered as crop diversification. Irrigation facility and availability of fertilizer & pesticides can be added constraint of the linear regression formalism we have considered. However most of tribal people in study area adopts organic farming and the cropped areas are rainfed only. So we safely ignored this constraint as well. Although climatic condition and soil type can be change the numbers represented here, but that’s beyond of someone’s control.
On policy suggestions, authors found and hence suggest that few things for further improvements. One major concern is to provide a supportive price and mini store houses. Since vegetables get rotten in 3-4 days, so famers forced to sell them in lesser price without having a storage facility. HYV seeds as per the climatic condition will be added benefit for them. Also learning programs should be provided to the farmers in their villages through Digital Green System where short videos of success stories should be screened.
References
- [1] Rao, P. P., Joshi, P. K., Kumar, S and Ganguly, K., (2008), Agricultural Diversification in Andhra Pradesh, India: Patterns, Determinants and Implications, (Published jointly with the International Food Policy Research
- [2] Tripathy.S, (2019) International Journal of Management and Social Research Review Vol. 6 Issue no. 3 pp 57-62
- [3] Pratap Singh Birthal, P. K. Joshi, Devesh Roy, Amit Thorat (2007), Diversification in Indian agriculture towards high-value crops The role of smallholders, International Food Policy Research Institute (IFPRI) Discussion Paper 00727
- [4] Acharya S.P., Basavaraja H., Kunnal L.B., Mahajanashetti S.B. and Bhat A.R.S. ( 2011). Crop Diversification in Karnataka: An Economic Analysis, Agricultural Economics Research Review Vol. 24 July-December 2011 pp 351-357
- [5] http://www.stscodisha.gov.in/PrimitiveTribesList.asp?GL=abt&PL=3
- [6] Kailash Chandra Das, "Podu Cultivation", The Tribal Tribune, Vol-2 Issue-12 https://www.etribaltribune.com/index.php/volume-2/mv2i12/podu-cultivation
- [7] https://www.thehindu.com/news/cities/Visakhapatnam/podu-cultivation-degrading-forest-cover/article3737719.ece
- [8] https://myknowledgebase.in/7-steps-for-successful-agricultural-practice-by-farmers/
- [9] Orissa DATA HIGHLIGHTS : THE SCHEDULED TRIBES, Census of India 2001, https://censusindia.gov.in/Tables_Published/SCST/dh_st_orissa.pdf
- [10] PhD thesis of Pradhan, Uttam Kumar, Sambalpur University, 2008 http://hdl.handle.net/10603/187067
- [11] http://www.desorissa.nic.in/latest_publications.html
- [12] http://agriodisha.nic.in/content/pdf/AgricultureStatistics_2013-14.pdf
- [13] Kamraju, M, Vani, and M.Anuradha, T (2017) Crop Diversification Pattern: A Case Study Of Telangana State: International Journal of Innovative Science and Research Technology, Vol : 2 issue: 5 pp. 366-371
- [14] Census of India 2011; INSTRUCTION MANUAL FOR HOUSELISTING AND HOUSING CENSUS
- [15] http://agricoop.nic.in/sites/default/files/Annual_rpt_201617_E.pdf
- [16] ftp://ftp.ecn.purdue.edu/vmerwade/class/GDT/Reports_Books/assessmentofirrigationinIndia.pdf
- [17] Gibbs, J. and Martin W. (1962). "Index of Diversification": Used from Quantitative Techniques in Geography: An Introduction. R. Hammond and P .S. McGullagh, Clarendon Press, Oxford. P. 21.
- [18] Birthal, P. S., Jha, A. K., Joshi, P. K., and Singh, D. K. (2006). Agricultural diversification in north-eastern region of India: implication for growth and equity. Indian Journal of Agricultural Economics, 61(3), 328-340.
- [19] Nayak, C. R. (2015). Crop diversification and land productivity in Odisha: role of rural infrastructure. PRAGATI: Journal of Indian Economy, 2(2), 1-18.
- [20] https://thork.people.uic.edu/fair/Regression.pdf