National Graphene Institute, University of Manchester, Booth Street East, Manchester, M13 9PL, United Kingdom \alsoaffiliationNational Graphene Institute, University of Manchester, Booth Street East, Manchester, M13 9PL, United Kingdom \alsoaffiliationHenry Royce Institute, Oxford Road, Manchester, M13 9PL, United Kingdom \alsoaffiliationCentre for Nanoscience and Nanotechnology, University of Bath, Claverton Down, Bath BA2 7AY, United Kingdom
Moiré Superlattice Effects and Band Structure Evolution in Near-30-Degree Twisted Bilayer Graphene
Abstract
In stacks of two-dimensional crystals, mismatch of their lattice constants and misalignment of crystallographic axes lead to formation of moiré patterns. We show that moiré superlattice effects persist in twisted bilayer graphene (tBLG) with large twists and short moiré periods. Using angle-resolved photoemission, we observe dramatic changes in valence band topology across large regions of the Brillouin zone, including the vicinity of the saddle point at and across 3 eV from the Dirac points. In this energy range, we resolve several moiré minibands and detect signatures of secondary Dirac points in the reconstructed dispersions. For twists , the low-energy minigaps are not due to cone anti-crossing as is the case at smaller twist angles but rather due to moiré scattering of electrons in one graphene layer on the potential of the other which generates intervalley coupling. Our work demonstrates robustness of mechanisms which enable engineering of electronic dispersions of stacks of two-dimensional crystals by tuning the interface twist angles. It also shows that large-angle tBLG hosts electronic minigaps and van Hove singularities of different origin which, given recent progress in extreme doping of graphene, could be explored experimentally.
keywords:
Twisted bilayer graphene, moiré superlattices, minigaps, photoemission, van Hove singularities, stacking-dependent electronic propertiesTwisted bilayer graphene (tBLG) is the archetype of van der Waals heterostructures – stacks of atomically thin materials with no directional bonding between consecutive layers and hence complete freedom of their relative rotational arrangement 1, 2. Tuning the twist angle, , between lattice directions of neighboring crystals leads to formation of moiré superlattices (mSL), represented visually by patterns observed, for example, with scanning probe techniques 3, 4, 5, and spatial modulation of interlayer coupling. This enables engineering of properties of a stack by tuning its stacking geometry, with examples including the observation of Hofstadter’s butterfly 6, 7 and interfacial polarons 8 in graphene/hexagonal boron nitride heterostructures, as well as interlayer excitons in transition metal dichalcogenide bilayers 9, 10. In tBLG, at small angles, , mSL generate flat bands which host correlated electronic behavior including superconductivity 11, 12. At the maximum twist angle, , because the height-to-width ratio of a regular hexagon involves the irrational , tBLG is a quasicrystal 14, 13. However, properties of tBLG with twist angles between these two limits remain relatively unexplored experimentally, with the current studies mainly focused on the van Hove singularity due to hybridization of Dirac cone crossings 15, 16, 17, 18, 19 which can be tuned with electric fields 20, 21 and influences the optical properties of the stack 22, 23, 20.
Here, we use angle-resolved photoemission spectroscopy (ARPES) to study evolution of the valence band structure of tBLG with large twist angles, . We observe extensive modifications of the band structure not only near the intersections of the bands of the individual layers, but across a wide range of energies, eV, away from the Dirac points: appearance of multiple minigaps, signatures of additional Dirac points appearing in the dispersion and hybridisation of the isotropic bottoms of the graphene -bands. We explain how these changes arise due to the coupling between the layers and mSL effects which persist at large twists when the apparent moiré wavelength is comparable to, but yet incommensurate with, the graphene lattice constant, and hence result in intervalley coupling. Our results demonstrate how, in a stack of two-dimensional crystals, the twist angle at an interface between two layers can be used to modify the electronic dispersion of the structure through a variety of mechanisms across a large range of . Moreover, given the successful extreme doping of monolayer graphene close to and past its van Hove singularity 24, 25, 26, 27, the richness of the band structure we observe suggests large-twist tBLG as a playground to explore interplay of interaction effects driven by van Hove singularities.
1 Results and Discussion
We fabricated three tBLG devices, A, B and C, on top of hexagonal boron nitride (-BN) using exfoliation and dry peel stamp transfer technique 28. The tBLG samples were characterized by low-energy electron microscopy (LEEM) and low-energy electron diffraction (LEED) in order to determine the twist angles, (tBLG-A), (tBLG-B) and (tBLG-C). For large twist angles, using reciprocal space LEED patterns to measure the twist is more precise than investigating the real space moiré periodicity with the scanning probe techniques (widely used for small ) because unit vectors for the latter are small, i.e. comparable with the graphene lattice constant. Our procedure, described in detail in the Supporting Information (SI), allows us to determine with the accuracy of . In turn, by comparing the widths of the zeroth and first order LEED spots, we estimate the maximum twist angle disorder as . This indicates relative homogeneity of the twist angle across areas of our devices much larger than the nano-ARPES spot size ( m in diameter). The bottom graphene layer is rotated by , and for the A, B and C devices, respectively, with respect to the underlying -BN – this is sufficient to avoid moiré effects at the -BN/graphene interface which are the strongest in highly-aligned -BN/graphene structures 6, 7 and decrease with increasing 29. All the measurements were performed at the Elettra Synchrotron and details of the fabrication process and discussion of the LEEM, LEED and ARPES experiments are provided in the SI.
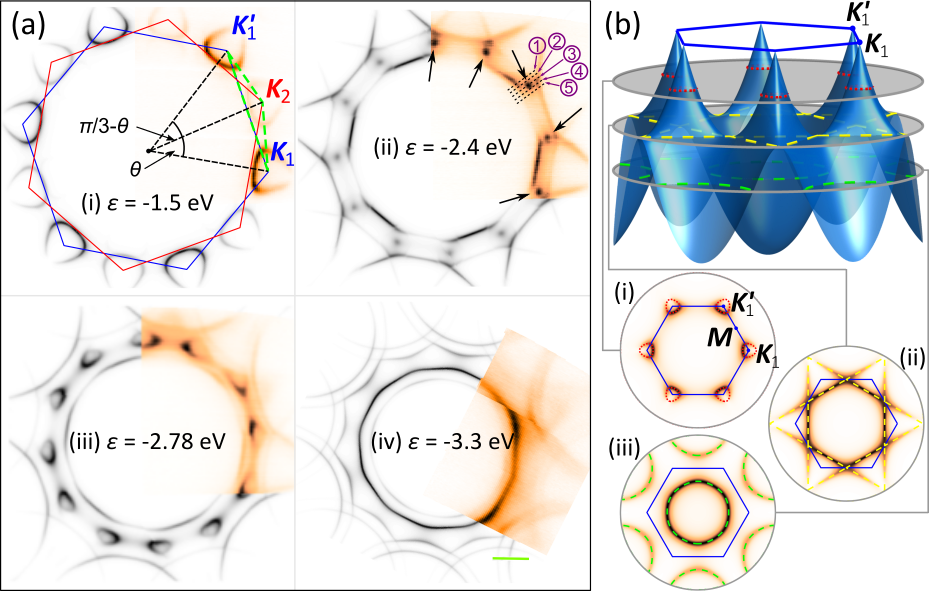
The importance of interlayer coupling and mSL effects in our structures is most strikingly captured by the constant-energy maps of ARPES intensity at energies eV below the Dirac points of the layers, shown in Fig. 1(a) for tBLG-C (experimental data in colours, simulation in black and white; we present constant-energy maps for tBLG-A and tBLG-B in SI). For comparison, evolution of the constant-energy line of monolayer graphene (MLG) is shown in Fig. 1(b). In undoped MLG, the constant-energy surface at the Fermi energy, , consists of points, known as Dirac points, located at the corners of the hexagonal Brillouin zone (BZ) and marked as and in the figure. For decreasing energy of the cut, each of the Dirac points gives rise to a closed contour, indicated with red dotted lines in the first plane cutting through the MLG dispersion in Fig. 1(b). Overall, two closed contours can be built from the pieces within the BZ, as seen in inset (i) below the MLG dispersion in which the contours and BZ shown in blue solid line are overlaid on the simulated ARPES intensity map for the same energy (note the crescent-like patterns of intensity around each valley, reflecting the topological nature of the Dirac points 30). The contours grow away from the Dirac points and connect at the points at the energy corresponding to the position of cut (ii) in Fig. 1(b). For energies , cut (iii), only one closed contour is present inside the BZ.
It is clear from the ARPES spectra in Fig. 1(a) that topology of large-angle tBLG bands is different. For energies eV, panel (i), ARPES maps show twelve crescent-like shapes indicating twice the number of Dirac points, in agreement with the presence of two graphene layers. The six less intense features come from the bottom graphene layer, signal from which is attenuated due to the electron escape depth effect. At the energy eV, the crescent shapes connect with each other and states belonging to different layers hybridize. This leads to the formation of one contour encircling the point, similarly to MLG at , as well as, at energy eV, panel (ii), to additional intense features indicated with black arrows. These intense features evolve into new crescent shapes as shown in panel (iii), eV, and the intensity patterns look strikingly similar to those in panels (a)(i) and (b)(i), suggesting the presence of secondary Dirac points akin to those detected in small-angle tBLG 31 or graphene aligned to underlying -BN 32, 33, 34. The crescent-like patterns merge together at eV so that for , panel (iv), the constant-energy maps contain two concentric contours. These are a consequence of hybridization of the approximately circular and degenerate bottoms of the -bands of the two layers due to interlayer coupling with the states shifted to higher (lower) energies giving rise to the inside (outside) contour.
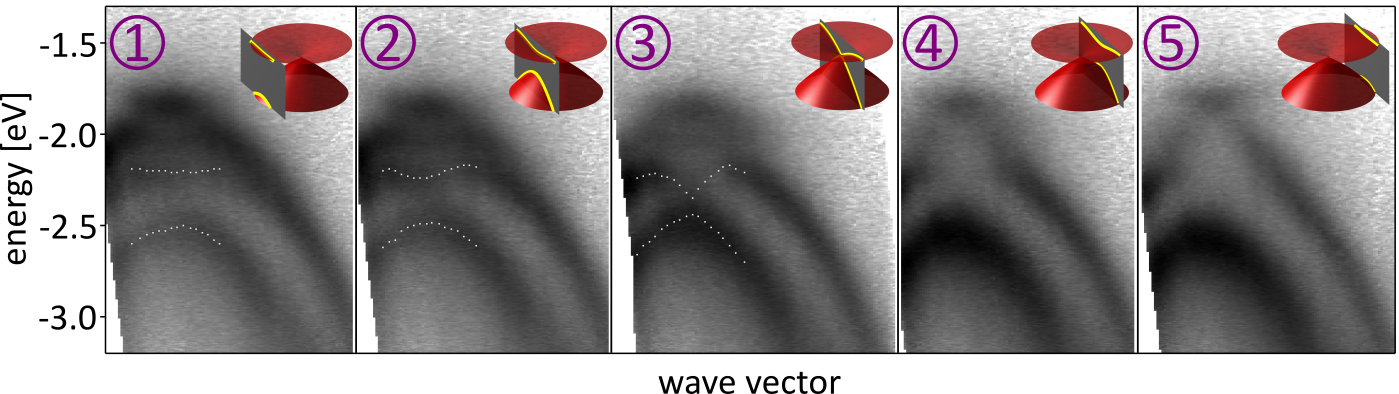
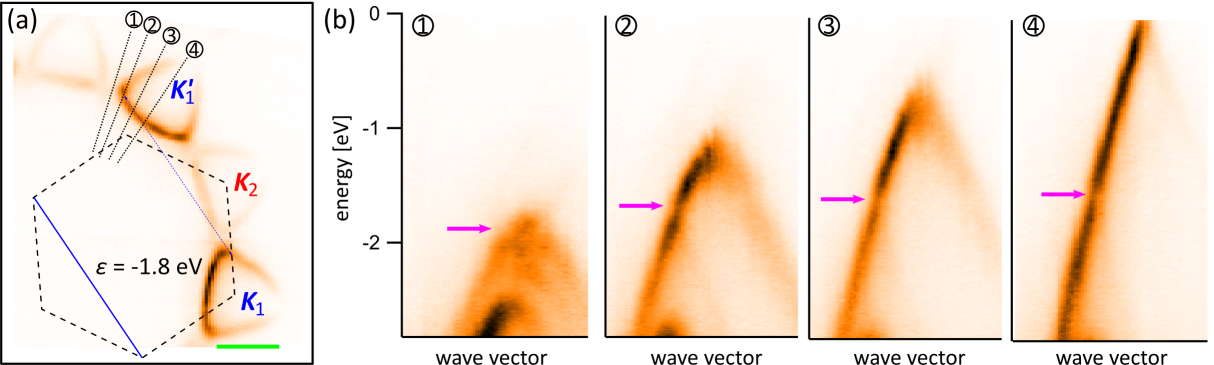
We investigate the secondary Dirac points from Fig. 1(a)(ii) in more detail by studying cuts marked 1-5 in that panel and show their photoemission maps in Fig. 2. For cuts 1-3, we fitted the positions of two bands around the energy eV with Gaussians (see SI for a description of the procedure), with their peaks as a function of wave vector marked with white dots. Our cuts suggest band structure feature containing a Dirac point as shown in the insets of each panel, where the gray planes indicate the location of the cut and the yellow lines highlight the band cut giving rise to the corresponding ARPES intensity. Our photoemission data cannot exclude the possibility that the secondary Dirac point is gapped; if so, the gap is smaller than eV (limit imposed by our energy resolution and precision of the fitting procedure). Finally, while the symmetry of the constant-energy maps in Fig. 1 implies that the band structure in cuts 1 and 2 is the same as in cuts 4 and 5, we do not see the band above the secondary Dirac point in the latter – this is because intensity from this part of the dispersion is affected by the Berry phase interference effects 30 responsible for crescent-like intensity patterns from otherwise circular contours in the vicinity of Dirac points in the maps in Fig. 1. In the SI, we show additional cuts in the vicinity of the new Dirac point in the direction roughly perpendicular to cuts in Fig. 2.
Changes in the topology of the constant-energy contours like these presented in Fig. 1(a) are reflected by discontinuities in the electronic density of states (DoS): merging of two contours involves a saddle point and generates a van Hove singularity peak (vHs) while appearance of a new one generates a step due to a contribution from a new band. With this in mind, we study the photoemission energy distribution curves obtained by integration of the photocurrent across -space. In Fig. 3(a), we compare the results for all tBLG samples as well as a reference monolayer region of one of the samples and DoS calculated using the continuum model 35, 36, 37 (see SI for description of the theoretical model). The MLG DoS displays a single peak, in the ARPES data reflected as a broad ”bump”, which corresponds to the saddle points at . The large width of this feature for MLG as compared to the theoretical DoS is due to the contribution from the valence band of -BN with its band edge eV below the graphene Dirac points responsible for the left side of the peak (while the -BN signal is strongly attenuated for tBLG, this is less so for the MLG with only one graphene layer on top of the substrate). A similar feature originating from the saddle points is also present at slightly shifted positions in all the tBLG DoS. However, the tBLG curves contain additional features indicating the presence of several vHs singularities and suggesting a more complicated band structure evolution than evident from the constant-energy maps. Positions of these features are well correlated with sharp peaks in the theoretical DoS below each experimental plot – we highlight with arrows the maxima and with triangles the minima of photocurrent that are of special interest below.
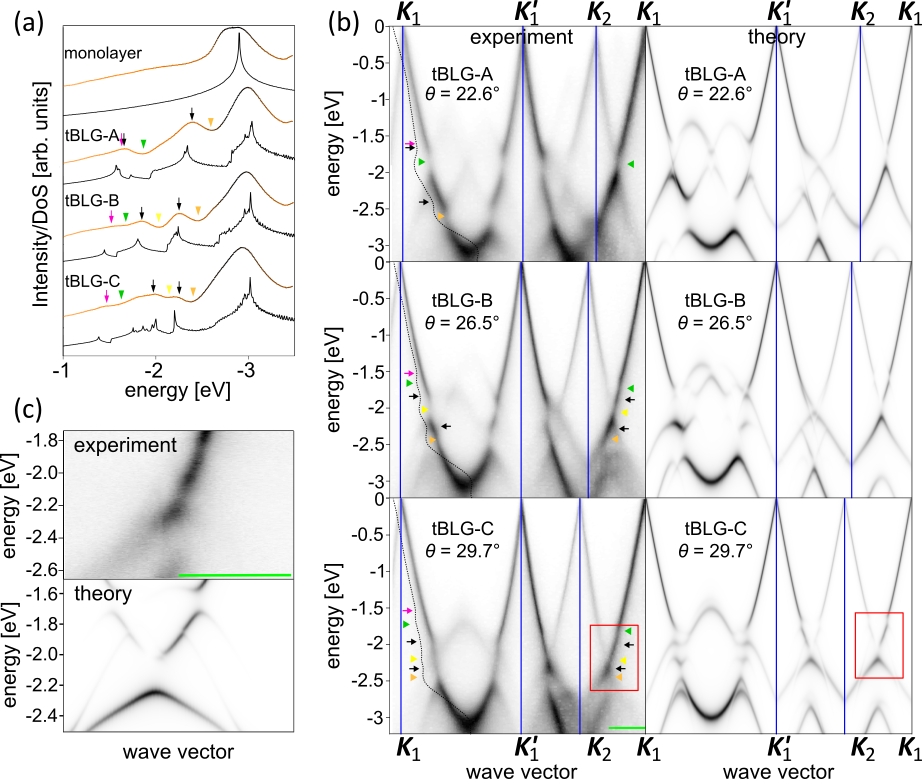
The top curve in Fig. 3(a) was obtained by moving the nano-ARPES spot off the region where the two layers overlap. This provides a direct comparison between monolayer and twisted bilayer and suggests that the changes in the photocurrent measured from tBLG areas are purely due to the interlayer interaction. In van der Waals heterostructures with twisted interfaces, two mechanisms are known to induce DoS peaks: (i) direct hybridization of states from different layers 15 and (ii) coupling between states backfolded by the mSL 38. Both lead to opening of gaps in the electronic spectrum as a consequence of coupling between electronic states, accompanied by the appearance of saddle points in the dispersion which in turn are responsible for the DoS peaks. Therefore, to understand the energy distribution curves in Fig. 3(a), we look for signs of minigap formation by investigating photoemission spectra along the -space paths connecting the valleys , and as shown in Fig. 1(a). We present these cuts in Fig. 3(b), together with simulations produced using a model established for ARPES studies of graphene on -BN 34 and applied to graphene stacks 39, 40 (see SI for details). The theoretical model captures all the qualitative features of the experimental data. Moreover, DoS minima in (a) coincide with the positions of the minigaps in (b). Because opening of minigaps in the electronic spectrum of two-dimensional materials must be accompanied by generation of saddle points, we identify the DoS maxima with a vHs in the vicinity of each minigap. For devices tBLG-C and tBLG-B, we can resolve at least three minigaps, as shown in more detail for the former in panel (c) which presents a separate measurement of the region indicated by the red rectangle in (b). This implies observation of four minibands, a testament of the outstanding quality of our samples.
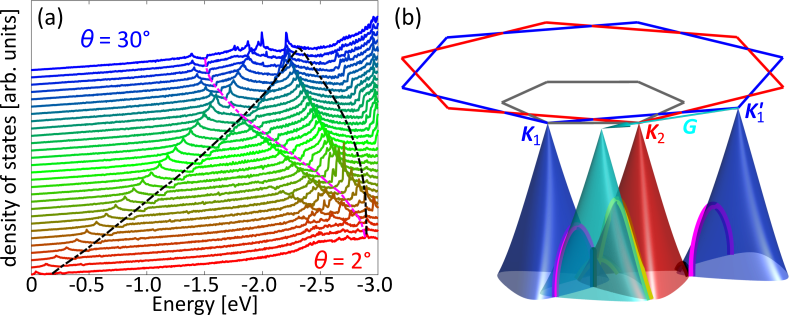
To discover the origin of the observed minigaps and vHs, we study the evolution of DoS calculated for twists , in steps of , shown in Fig. 4(a) (curves have been shifted vertically for clarity). In the absence of interlayer coupling, two MLG dispersions rotated with respect to each other by must intersect and we mark such crossings in black in Fig. 4(b) where we show conical valence band dispersions of the top (blue) and bottom (red) layers for . The neighbouring Dirac points are separated by a distance 35 ( and as marked in Fig. 1), where is the graphene lattice constant, or ( and ). The highest energies of crossings occur midway between every pair of Dirac points and the corresponding energies as a function of are indicated with the black dashed lines on top of the DoS curves in (a). Interlayer coupling hybridizes the degenerate states at the crossings, turning them into anti-crossings accompanied by a saddle point between the Dirac points and above the gap (note that the saddle point is shifted off the line connecting the Dirac points 38) and a quasi-quadratic edge of the next miniband below. The corresponding DoS features, peak at higher energies due to the saddle point and a step at lower energies due to the band edge, can be seen in the vicinity of both dashed black lines in the DoS curves in (a) (the hybridization minigap does not open a global band gap as other parts of the electronic dispersion overlap with it so that the electronic density of states does not go down to zero 17, 15, 36). At small twist angles, the feature closest to the Dirac points is due to mixing of states between pairs of Dirac cones closest to each other and has been studied using scanning tunnelling spectroscopy 15, 17, ARPES 16, 23 and magnetic focusing 31. At larger twists, separations between all pairs of neighbouring Dirac cones become comparable, driving the associated vHs into the energy range eV from the Dirac points. Guided by the approximate positions of minigaps indicated by the black dashed lines in Fig. 4(a), we ascribe the ARPES features marked with black arrows in Fig. 3(a) to vHs formed above direct-hybridization gaps while the gaps themselves correspond to features indicated with the yellow and orange triangles.
Interestingly, for tBLG-B and tBLG-C, the ARPES features marked in Fig. 3(a) with magenta arrows and green triangles cannot be explained by mixing of degenerate electronic states of the two layers by interlayer coupling. Instead, they evidence scattering of electrons by the mSL. In Fig. 4(b), we show in gray the moiré BZ in relation to the BZ of the graphene layers (red and blue for bottom and top, respectively). The primitive reciprocal vectors of the mSL correspond to the shortest vectors produced by subtraction of the reciprocal vectors of the two crystals 35, 41, with one such vector, , portrayed by the cyan arrow. Scattering of electrons from the valley of the top layer by that moiré reciprocal vector can be schematically depicted by translating the whole cone, producing the cyan surface which intersects with conical dispersion surfaces of the top layer around . We mark this intersection with a magenta line on the cone. We also mark in the same colour on cone the equivalent intersection of dispersion with translated by . The highest energy of these crossings, midway between and translated (or between and translated ), is indicated as a function of with the dashed magenta line in Fig. 4(a) and provides an estimate for the position of a vHs formed above a minigap opened due to the moiré-induced intervalley interaction of electrons with those in . For small twists, the primitive reciprocal vectors of mSL are short and replica intersects the original dispersion of the top layer far below the Dirac points. The energy of the intersection increases with increasing twist angle as the moiré reciprocal vector scatters electrons closer to . At , the distance between and replica is the same as between and so that the highest energies of the corresponding intersections are at similar energies (the energies are not identical because of the trigonal warping of the cone-like dispersions). This means that the related minigaps and vHs should also overlap as is indeed the case for DoS of sample tBLG-A with in Fig. 3(a). For larger twist angles, scattering on the moiré potential brings the states close enough to so that it is this process, rather than direct hybridization of and cones, that is responsible for the ARPES features closest to the Dirac points in tBLG-B and tBLG-C: minigaps indicated with green triangles and vHs marked with magenta arrows in Fig. 3.
Further confirmation that moiré-induced scattering is responsible for some of the minigaps and vHs we observe can be provided by explicitly connecting affected states with mSL reciprocal vectors. In the constant-energy map in Fig. 5(a), corresponding to the energy marked by the green triangle for tBLG-C in Fig. 3(b), eV, we connect positions of the minigaps around and with the moiré reciprocal vector (thin blue line; see SI for procedure used to determine the moiré BZ). Moreover, in panel (b) we show photoemission measured along the cuts 1-4 as numbered and marked in (a). Using these cuts, we can trace the crossing of cone with the one translated by and the resulting minigap, indicated with the magenta arrow for each cut, effectively following the magenta line on the cone in Fig. 4(b). Note that we do not observe any minigaps (or features in the experimental and theoretical DoS) due to the hypothetical crossings between states scattered by moiré superlattice and bottom layer dispersion around [yellow line in Fig. 4(b)]. This is because such process is higher order in the mSL perturbation (it involves additional interlayer tunnelling). Finally, scattering of bottom layer electrons on the potential of the top layer [moiré-induced coupling between and ; not shown in Fig. 4(b)] is difficult to observe because of the additional attenuation of the signal from the bottom layer.
With regards to the magnitudes of the minigaps, the largest direct hybridization gap we observe is the one for tBLG-C shown in Fig. 3(c), eV. For intermediate twist angles, , an estimate of this gap can be obtained via degenerate perturbation theory for two states coupled by eV 35, 36, yielding eV. At small angles, the moiré wave vector rapidly decreases with decreasing twist angle so that mSL couples states on Dirac cones with energy separation . Level repulsion between these densely packed states leads to miniband separations decreasing with and flat bands in the extreme limit of the magic angle 36. In turn, at large angles, as discussed earlier the moiré vectors are sufficiently long to couple the two degenerate states to states from other valleys, some with energies within from the band crossing. Such states lead to a slight increase of the hybridization minigap with angle and a complicated band structure in its vicinity with several additional (moiré-induced) minigaps as observed for tBLG-B and tBLG-C (in the limit of , moiré couples 12 equi-energetic states from both graphene layers 42). To estimate the size of the minigap opened due to moiré-induced scattering, , one must consider at least three states: two degenerate states on the crossing of the and cones [magenta line at the crossing of the blue and cyan cones in Fig. 4(b)] and an electronic state of the bottom layer at the same wave vector and at energy eV away. The first two states are not directly coupled to each other but only to the third one through the interlayer coupling , so that eV. Note that such a minimal three-level model underestimates the moiré-induced gaps we observe. We discuss our estimates for and in more detail in the SI.
We have checked that the suppression of photocurrent we identify with spectral minigaps cannot be ascribed to photoemission final state effects 43 which include dependence of the intensity on photon energy as well as polarization 44, 45, 46, 47, 48. In the SI, we show single-particle spectral weight of the electronic wave function for the wave vector and energy range as used for the ARPES spectra in Fig. 3(c). This spectral weight contains all of the minigaps discussed here which demonstrates that these are true spectral features and do not arise as a result of suppression of photointensity due to the Berry phase or final state effects. Moreover, we have performed measurements using photons both with energies 27 and 74 eV and observed little change in the spectra (a comparison of a cut along the direction for sample tBLG-C measured at both photon energies is shown in the SI). We use linearly-polarized light and our geometry is such that when measuring along the direction the detector is in the plane of incidence and the incident light is -polarized. This determines directions in the reciprocal space along which the photointensity is suppressed due to the Berry phase associated with the BZ corners 30, 44, 45, 46, 47 [in the valence band, starting from a BZ corner in the direction away from , as evident in the maps in Fig. 1(a)(i)] and allows us to confirm that these do not overlap with locations of the minigaps, see for example Fig. 5. Our observations also cannot be the result of secondary scattering of photoelectrons as this leads to band replicas but not gap opening 34.
2 Conclusions
Our results demonstrate the robustness of the moiré superlattice picture at large twist angles when the moiré wavelength is comparable to the graphene lattice constant, , and cannot correspond to a lattice constant of a commensurate superlattice. In large-angle twisted bilayer graphene with , gaps opened by the moiré, together with the associated van Hove singularities, are the closest to the Dirac points density of states features evidencing interaction of the two graphene layers. The direct hybridization minigap is located deeper in the valence band and is the largest for tBLG-C with the twist close to , eV. The interlayer coupling also modifies the topology of the dispersion at energies in the vicinity of and below the Brillouin zone points where the quasi-conical dispersions merge: we observe secondary Dirac points in the reconstructed spectrum as well as hybridization of the bottom parts of the valence bands. It is worth noting that the LEED spectra shown in SI indicate no strain reconstruction in our graphene crystals.
While a signature of moiré-induced scattering was observed previously for a twisted bilayer graphene with its aperiodic moiré 13, we show that these processes are not restricted to this special twist angle but rather provide a robust way of coupling electronic states, with the twist angle controlling the affected regions of reciprocal space. The recent work on graphene on InSe 49 suggests that moiré-induced scattering is not limited to twisted bilayer graphene.
Finally, it has been shown that it is possible to dope MLG sufficiently to move the chemical potential to the point van Hove singularity 24, 25, 26, 27 and so it might be feasible to explore large-angle tBLG in a similar regime. Interestingly, a superconducting instability was predicted for the MLG doped to the vHs 24 but magnetic ordering for tBLG doped to the Dirac cone anti-crossing 50 (situation not equivalent to magic-angle tBLG in which states coupled by moiré reciprocal vectors contribute significantly to the flat bands 36), with recent experimental studies in agreement with the latter 51. This suggests large-angle tBLG as a platform in which the interaction effects at vHs of different origin (in-plane nearest-neighbour coupling, interlayer Dirac cone anti-crossing, moiré-induced intralayer intervalley coupling) and competition between them could be explored.
3 Methods
First, laterally large (m) and thin ( nm) -BN was mechanically exfoliated onto a Ti/Pt (2/10nm) coated highly -doped silicon wafer. Monolayer graphene was then transferred onto the -BN using the poly(methyl methacrylate) (PMMA) dry peel stamp transfer technique 52, 28. To note, a few-layer graphene (connect to the monolayer) overlapped the edge of the -BN to form a ground to the highly conductive Ti/Pt/Si substrate. A second graphene flake was then deterministically transferred onto the stack to create the tBLG. The stack was then annealed at C for 3 hours to allow contamination trapped between flakes to agglomerate through the self-cleaning mechanism 53. The LEEM, LEED and ARPES measurements were performed at the Elettra Synchrotron 54, 55. All ARPES spectra in the main text were obtained using photons with energy of 74 eV, except Fig. 3(c) which has been obtained with 27 eV photons.
To simulate the ARPES spectra, we used the tight-binding model to describe each of the graphene layers coupled with a continuum description of the interlayer interaction 35, 36, 37. The layers are considered rigid (which is a good approximation at large angles for which variation of the interlayer distance across the moiré unit cell decreases to Å56) and the interlayer coupling is taken into account via the Fourier transform of the Slater-Koster-like 57 hopping between -orbitals. Values of the parameters in our model are based on those used previously in the literature and shown to be applicable to a large range of twist angles 37, 39 as well as the fit to the experimental ARPES data. The detailed discussion of the procedure used to produce photocurrent intensity is presented in SI.
4 Author Contributions
M.H. and R.G. fabricated the samples. A.G., V.K., F.G., T.O.M., A.L. and A.B. performed the LEED, LEEM and ARPES measurements. M.M.-K. built the theoretical model and simulated the ARPES spectra. A.B. and M.M.-K. analysed the ARPES data and wrote the manuscript with input from all the authors.
5 Acknowledgements
The authors thank N. Wilson and V. Fal’ko for insightful discussions. We acknowledge support from the Engineering and Physical Sciences Research Council (EPSRC) grant EP/V007033/1, the European Graphene Flagship Project, European Quantum Technology Flagship Project 2D-SIPC (820378) and the Royal Society. M.M.-K. acknowledges support by the University of Bath International Research Funding Scheme.
6 Supporting Information
The Supporting Information is available free of charge at https://pubs.acs.org/doi/10.1021/acsnano.1c06439.
Further details of the LEEM, LEED and ARPES measurements, determination of the twist angle, constant-energy ARPES maps for tBLG-A and tBLG-B, additional ARPES spectra for cuts across the secondary Dirac point and comparison of spectra taken with photons of different energy; description of the theoretical model used to obtain tBLG bands and ARPES spectra; effective model used to estimate magnitudes of the observed minigaps.
References
- 1 Geim, A. K.; Grigorieva, I. V. Van der Waals Heterostructures. Nature 2013, 499, 419-425.
- 2 Novoselov, K. S.; Mishchenko, A.; Carvalho, A.; Castro Neto, A. H. 2D Materials and van der Waals Heterostructures. Science 2016, 353, aac9439.
- 3 Xue, J.; Sanchez-Yamagishi, J.; Bulmash, D.; Jacquod, P.; Deshpande, A.; Watanabe, K.; Taniguchi, T.; Jarillo-Herrero, P.; LeRoy, B. J. Scanning Tunnelling Microscopy and Spectroscopy of Ultra-Flat Graphene on Hexagonal Boron Nitride. Nat. Mater. 2011, 10, 282-285.
- 4 Kang, J.; Li, J.; Li, S.-S.; Xia, J.-B.; Wang, L.-W. Electronic Structural Moiré Pattern Effects on MoS2/MoSe2 2D Heterostructures. Nano Lett. 2013, 13, 5485-5490.
- 5 Zhang, C.; Chuu, C.-P.; Ren, X.; Li, M.-Y.; Li, L.-J.; Jin, C.; Chou, M.-Y.; Shih, C.-K. Interlayer Couplings, Moiré Patterns, and 2D Electronic Superlattices in MoS2/WSe2 Hetero-Bilayers. Sci. Adv. 2017, 3, e1601459.
- 6 Ponomarenko, L. A.; Gorbachev, R. V.; Yu, G. L.; Elias, D. C.; Jalil, R.; Patel, A. A.; Mishchenko, A.; Mayorov, A. S.; Woods, C. R.; Wallbank, J. R.; Mucha-Kruczynski, M.; Piot, B. A.; Potemski, M.; Grigorieva, I. V.; Novoselov, K. S.; Guinea, F.; Fal’ko, V. I.; Geim, A. K. Cloning of Dirac Fermions in Graphene Superlattices. Nature 2013, 497, 594-597.
- 7 Dean, C. R.; Wang, L.; Maher, P.; Forsythe, C.; Ghahari, F.; Gao, Y.; Katoch, J.; Ishigami, M.; Moon, P.; Koshino, M.; Taniguchi, T.; Watanabe, K.; Shepard, K. L.; Hone, J.; Kim, P. Hofstadter’s Butterfly and the Fractal Quantum Hall Effect in Moiré Superlattices. Nature 2013, 497, 598-602.
- 8 Chen, C.; Avila, J.; Wang, S; Wang, Y.; Mucha-Kruczynski, M.; Shen, C.; Yang, R.; Nosarzewski, B.; Devereaux, T. P.; Zhang, G.; Asensio, M. C. Emergence of Interfacial Polarons from Electron-Phonon Coupling in Graphene/h-BN van der Waals Heterostructures. Nano Lett. 2018, 18, 1082-1087.
- 9 Fang, H.; Battaglia, C.; Carraro, C.; Nemsak, S.; Ozdol, B.; Kang, J. S.; Bechtel, H. A.; Desai, S. B.; Kronast, F.; Unal, A. A.; Conti, G.; Conlon, C.; Palsson, G. K.; Martin, M C.; Minor, A. M.; Fadley, C. S.; Yablonovitch, E.; Maboudian, R.; Javey, A. Strong Interlayer Coupling in van der Waals Heterostructures Built from Single-Layer Chalcogenides. Proc. Natl. Acad. Sci. U.S.A 2014, 111, 6198-6202.
- 10 Rivera, P.; Yu, H.; Seyler, K. L.; Wilson, N. P.; Yao, W.; Xu, X. Interlayer Valley Excitons in Heterobilayers of Transition Metal Dichalcogenides. Nat. Nanotechnol. 2018, 13, 1004-1015.
- 11 Cao, Y.; Fatemi, V.; Demir, A.; Fang, S.; Tomarken, S. L.; Luo, J. Y.; Sanchez-Yamagishi, J. D.; Watanabe, K.; Taniguchi, T.; Kaxiras, E.; Ashoori, R. C.; Jarillo-Herrero, P. Correlated Insulator Behaviour at Half-Filling in Magic-Angle Graphene Superlattices. Nature 2018, 556, 80-84.
- 12 Cao, Y.; Fatemi, V.; Fang, S.; Watanabe, K.; Taniguchi, T.; Kaxiras, E.; Jarillo-Herrero, P. Unconventional Superconductivity in Magic-Angle Graphene Superlattices. Nature 2018, 556, 43-50.
- 13 Yao, W.; Wang, E.; Bao, C.; Zhang, Y.; Zhang, K.; Bao, K.; Chan, C. K.; Chen, C.; Avila, J.; Asensio, M. C.; Zhu, J.; Zhou, S. Quasicrystalline 30∘ Twisted Bilayer Graphene as an Incommensurate Superlattice with Strong Interlayer Coupling. Proc. Natl. Acad. Sci. U.S.A 2018, 115, 6928-6933.
- 14 Ahn, S. J.; Moon, P.; Kim, T.-H.; Kim, H.-W.; Shin, H.-C.; Kim, E. H.; Cha, H. W.; Kahng, S.-J.; Kim, P.; Koshino, M.; Son, Y.-W.; Yang, C.-W.; Ahn, J. R. Dirac Electrons in a Dodecagonal Graphene Quasicrystal. Science 2018, 361, 782-786.
- 15 Li, G.; Luican, A.; Lopes dos Santos, J. M. B.; Castro Neto, A. H.; Reina, A.; Kong, J.; Andrei, E. Y. Observation of van Hove Singularities in Twisted Graphene Layers. Nat. Phys. 2010, 6, 109-113.
- 16 Ohta, T.; Robinson, J. T.; Feibelman, P. J.; Bostwick, A.; Rotenberg, E.; Beechem, T. E. Evidence for Interlayer Coupling and Moiré Periodic Potentials in Twisted Bilayer Graphene. Phys. Rev. Lett. 2012, 109, 186807.
- 17 Brihuega, I.; Mallet, P.; Gonzalez-Herrero, H.; Trambly de Laissardiere, G.; Ugeda, M. M.; Magaud, L.; Gomez-Rodriguez, J. M.; Yndurain, F.; Veuillen, J.-Y. Unraveling the Intrinsic and Robust Nature of van Hove Singularities in Twisted Bilayer Graphene by Scanning Tunneling Microscopy and Theoretical Analysis. Phys. Rev. Lett. 2012, 109, 196802.
- 18 Razado-Colambo, I.; Avila, J.; Nys, J.-P. ; Chen, C.; Wallart, X.; Asensio, M.-C.; Vignaud, D. NanoARPES of Twisted Bilayer Graphene on SiC: Absence of Velocity Renormalization for Small Angles. Sci. Rep. 2016, 6, 27261.
- 19 Liao, L.; Wang, H.; Peng, H.; Yin, J.; Koh, A. L.; Chen, Y.; Xie, Q.; Peng, H.; Liu, Z. van Hove Singularity Enhanced Photochemical Reactivity of Twisted Bilayer Graphene. Nano Lett. 2015, 15, 5585–5589.
- 20 Yu, K.; Luan, N. V.; Kim, T.; Jeon, J.; Kim, J.; Moon, P.; Lee, Y. H.; Choi, E. J. Gate Tunable Optical Absorption and Band Structure of Twisted Bilayer Graphene. Phys. Rev. B 2019, 99, 241405.
- 21 Jones, A. J. H.; Muzzio, R.; Majchrzak, P.; Pakdel, S.; Curcio, D.; Volckaert, K.; Biswas, D.; Gobbo, J.; Singh, S.; Robinson, J. T.; Watanabe, K.; Taniguchi, T.; Kim, T. K.; Cacho, C.; Lanata, N.; Miwa, J. A.; Hofmann, P.; Katoch, J.; Ulstrup, S. Observation of Electrically Tunable van Hove Singularities in Twisted Bilayer Graphene from NanoARPES. Adv. Mater. 2020, 32, 2001656.
- 22 Patel, H.; Havener, R. W.; Brown, L.; Liang, Y.; Yang, L.; Park, J.; Graham, M. W. Tunable Optical Excitations in Twisted Bilayer Graphene Form Strongly Bound Excitons. Nano Lett. 2015, 15, 5932-5937.
- 23 Yin, J.; Wang, H.; Peng, H.; Tan, Z.; Liao, L.; Lin, L.; Sun, X.; Koh, A. L.; Chen, Y.; Peng, H.; Liu, Z. Selectively Enhanced Photocurrent Generation in Twisted Bilayer Graphene with van Hove Singularity. Nat. Commun. 2016, 7, 10699.
- 24 McChesney, J. L.; Bostwick, A.; Ohta, T.; Seyller, T.; Horn, K.; Gonzalez, J.; Rotenberg, E. Extended van Hove Singularity and Superconducting Instability in Doped Graphene, Phys. Rev. Lett. 2010, 104, 136803.
- 25 Link, S.; Forti, S.; Stohr, A.; Kuster, K.; Rosner, M.; Hirschmeier, D.; Chen, C.; Avila, J.; Asensio, M. C.; Zakharov, A. A.; Wehling, T. O.; Lichtenstein, A. I.; Katsnelson, M. I.; Starke, U. Introducing Strong Correlation Effects into Graphene by Gadolinium Intercalation, Phys. Rev. B 2019, 100, 121407.
- 26 Rosenzweig, P.; Karakachian, H.; Link, S.; Kuster, K.; Starke, U. Tuning the Doping Level of Graphene in the Vicinity of the van Hove Singularity via Ytterbium Intercalation, Phys. Rev. B 2019, 100, 035445.
- 27 Rosenzweig, P.; Karakachian, H.; Marchenko, D.; Kuster, K.; Starke, U. Overdoping Graphene beyond the van Hove Singularity, Phys. Rev. Lett. 2020, 125, 176403.
- 28 Frisenda, R.; Navarro-Moratalla, E.; Gant, P.; Perez De Lara, D.; Jarillo-Herrero, P.; Gorbachev, R. V.; Castellanos-Gomez, A. Recent Progress in the Assembly of Nanodevices and van der Waals Heterostructures by Deterministic Placement of 2D Materials. Chem. Soc. Rev. 2018, 47, 53-68.
- 29 Jung, J.; Laksono, E.; DaSilva, A. M.; MacDonald, A. H.; Mucha-Kruczynski, M.; Adam, S. Moiré Band Model and Band Gaps of Graphene on Hexagonal Boron Nitride. Phys. Rev. B 2017, 96, 085442.
- 30 Mucha-Kruczynski, M.; Tsyplyatyev, O.; Grishin, A.; McCann, E.; Fal’ko, V. I.; Bostwick, A.; Rotenberg, E. Characterization of Graphene Through Anisotropy of Constant-Energy Maps in Angle-Resolved Photoemission. Phys. Rev. B 2008, 77, 195403.
- 31 Berdyugin, A. I.; Tsim, B.; Kumaravadivel, P.; Xu, S. G.; Ceferino, A.; Knothe, A.; Kumar, R. K.; Taniguchi, T.; Watanabe, K.; Geim, A. K.; Grigorieva, I. V.; Fal’ko, V. I. Minibands in Twisted Bilayer Graphene Probed by Magnetic Focusing. Sci. Adv. 2020, 6, eaay7838.
- 32 Wallbank, J. R.; Patel, A. A.; Mucha-Kruczynski, M.; Geim, A. K.; Fal’ko, V. I. Generic Miniband Structure of Graphene on a Hexagonal Substrate. Phys. Rev. B 2013 87, 245408.
- 33 Wang, E.; Lu, X.; Ding, S.; Yao, W.; Yan, M.; Wan, G.; Deng, K.; Wang, S.; Chen, G.; Ma, L.; Jung, J.; Fedorov, A. V.; Zhang, Y.; Zhang, G.; Zhou, S. Gaps Induced by Inversion Symmetry Breaking and Second-Generation Dirac Cones in Graphene/Hexagonal Boron Nitride. Nat. Phys. 2016 12, 1111-1115.
- 34 Mucha-Kruczynski, M.; Wallbank, J. R.; Fal’ko, V. I. Moiré Miniband Features in the Angle-Resolved Photoemission Spectra of Graphene/hBN Heterostructures. Phys. Rev. B 2016 93, 085409.
- 35 Lopes dos Santos, J. M. B., Peres, N. M. R.; Castro Neto, A. H. Graphene Bilayer with a Twist: Electronic Structure. Phys. Rev. Lett. 2007, 99, 256802.
- 36 Bistritzer, R.; MacDonald, A. H. Moiré Bands in Twisted Double-Layer Graphene. Proc. Natl. Acad. Sci. U.S.A 2011 108, 12233-12237.
- 37 Koshino, M. Interlayer Interaction in General Incommensurate Atomic Layers. New J. Phys. 2015, 17, 015014.
- 38 Garcia-Ruiz, A.; Thompson, J. J. P.; Mucha-Kruczynski, M.; Fal’ko, V. I. Electronic Raman Scattering in Twistronic Few-Layer Graphene. Phys. Rev. Lett. 2020, 125, 197401.
- 39 Thompson, J. J. P.; Pei, D.; Peng, H.; Wang, H.; Channa, N.; Peng, H. L.; Barinov, A.; Schroter, N. B. M.; Chen, Y.; Mucha-Kruczynski, M. Determination of Interatomic Coupling between Two-Dimensional Crystals Using Angle-Resolved Photoemission Spectroscopy. Nat. Commun. 2020, 11, 3582.
- 40 Zhu, J.; Shi, J.; MacDonald, A. H. Theory of Angle-Resolved Photoemission Spectroscopy in Graphene-Based Moiré Superlattices. Phys. Rev. B 2021, 103, 235146.
- 41 Wallbank, J. R.; Mucha-Kruczynski, M.; Chen, X.; Fal’ko, V. I. Moiré Superlattice Effects in Graphene/Boron‐Nitride van der Waals Heterostructures. Ann. Phys. (Berlin) 2015, 527, 359-376.
- 42 Moon, P.; Koshino, M.; Son, Y.-W. Quasicrystalline Electronic States in 30∘ Rotated Twisted Bilayer Graphene. Phys. Rev. B 2019, 99, 165430.
- 43 Kurtz, R. L.; Browne, D. A.; Mankey, G. J. Final State Effects in Photoemission Studies of Fermi Surfaces. J. Phys.: Condens. Matter 2007, 19, 355001.
- 44 Gierz, I.; Lindroos, M.; Hochst, H.; Ast, C. R.; Kern, K. Graphene Sublattice Symmetry and Isospin Determined by Circular Dichroism in Angle-Resolved Photoemission Spectroscopy. Nano Letters 2012, 12, 3900-3904.
- 45 Liu, Y.; Bian, G.; Miller, T.; Chiang, T.-C. Visualizing Electronic Chirality and Berry Phases in Graphene Systems Using Photoemission with Circularly Polarized Light. Phys. Rev. Lett. 2011, 107, 166803.
- 46 Gierz, I.; Henk, J.; Hochst, H.; Ast, C. R.; Kern, K. Illuminating the Dark Corridor in Graphene: Polarization Dependence of Angle-Resolved Photoemission Spectroscopy on Graphene. Phys. Rev. B 2011, 83, 121408.
- 47 Hwang, C.; Park, C.-H.; Siegel, D. A.; Fedorov, A. V.; Louie, S. G.; Lanzara, A. Direct Measurement of Quantum Phases in Graphene via Photoemission Spectroscopy. Phys. Rev. B 2011, 84, 125422.
- 48 Damascelli, A.; Hussain, Z.; Shen, Z.-X. Angle-Resolved Photoemission Studies of the Cuprate Superconductors. Rev. Mod. Phys. 2003, 75, 473.
- 49 Graham, A. J.; Zultak, J.; Hamer, M. J.; Zolyomi, V.; Magorrian, S.; Barinov, A.; Kandyba, V.; Giampietri, A.; Locatelli, A.; Genuzio, F.; Teutsch, N. C.; Salazar, T.; Hine, N. D. M.; Fal’ko, V. I.; Gorbachev, R. V.; Wilson, N. R. Ghost Anti-Crossings Caused by Interlayer Umklapp Hybridization of Bands in 2D Heterostructures. 2D Mater. 2021, 8, 015016.
- 50 Gonzalez, J. Magnetic and Kohn-Luttinger Instabilities near a van Hove Singularity: Monolayer versus Twisted Bilayer Graphene. Phys. Rev. B 2013, 88, 125434.
- 51 Liu, Y.-W.; Qiao, J.-B.; Yan, C.; Zhang, Y.; Li, S.-Y.; He, L. Magnetism near Half-Filling of a van Hove Singularity in Twisted Bilayer Graphene. Phys. Rev. B 2019, 99, 201408.
- 52 Ponomarenko, L. A.; Geim, A. K.; Zhukov, A. A.; Jalil, R.; Morozov, S. V.; Novoselov, K. S.; Grigorieva, I. V.; Hill, E. H.; Cheianov, V. V.; Fal’ko, V. I.; Watanabe, K.; Taniguchi, T.; Gorbachev R. V. Tunable Metal-Insulator Transition in Double-Layer Graphene Heterostructures. Nat. Phys. 2011, 7, 958-961.
- 53 Haigh, S. J.; Gholinia, A.; Jalil, R.; Romani, S.; Britnell, L.; Elias, D. C.; Novoselov, K. S.; Ponomarenko, L. A.; Geim, A. K.; Gorbachev, R. V. Cross-Sectional Imaging of Individual Layers and Buried Interfaces of Graphene-Based Heterostructures and Superlattices. Nat. Mater. 2012, 11, 764-767.
- 54 Mentes, T. O.; Zamborlini, G.; Sala, A.; Locatelli, A. Cathode Lens Spectromicroscopy: Methodology and Applications. Beilstein J. Nanotechnol. 2014, 5, 1873-1886.
- 55 Dudin, P.; Lacovig, P.; Fava, C.; Nicolini, E.; Bianco, A.; Cautero, G.; Barinov, A. V. Angle‐Resolved Photoemission Spectroscopy and Imaging with a Submicrometre Probe at the SPECTROMICROSCOPY‐3.2L Beamline of Elettra. J. Synchrotron Radiat. 2010, 17, 445-450.
- 56 Gargiulo, F.; Yazyev, O. V. Structural and Electronic Transformation in Low-Angle Twisted Bilayer Graphene. 2D Mater. 2018, 5, 015019.
- 57 Slater, J. C.; Koster, G. F. Simplified LCAO Method for the Periodic Potential Problem. Phys. Rev. 1954, 94, 1498-1524.