A Family Tree of Optical Transients from Narrow-Line Seyfert 1 Galaxies
Abstract
The Zwicky Transient Facility (ZTF) has discovered five new events belonging to an emerging class of AGN undergoing smooth flares with large amplitudes and rapid rise times. This sample consists of several transients that were initially classified as supernovae with narrow spectral lines. However, upon closer inspection, all of the host galaxies display resolved Balmer lines characteristic of a narrow-line Seyfert 1 (NLSy1) galaxy. The transient events are long-lived, over 400 days on average. We report UV and X-ray follow-up of the flares and observe persistent UV-bright emission, with two of the five transients detected with luminous X-ray emission, ruling out a supernova interpretation. We compare the properties of this sample to previously reported flaring NLSy1 galaxies, and find that they fall into three spectroscopic categories: Transients with 1) Balmer line profiles and Fe II complexes typical of NLSy1s, 2) strong He II profiles, and 3) He II profiles including Bowen fluorescence features. The latter are members of the growing class of AGN flares attributed to enhanced accretion reported by Trakhtenbrot et al. (2019). We consider physical interpretations in the context of related transients from the literature. For example, two of the sources show high amplitude rebrightening in the optical, ruling out a simple tidal disruption event scenario for those transients. We conclude that three of the sample belong to the Trakhtenbrot et al. (2019) class, and two are TDEs in NLSy1s. We also aim to understand why NLSy1s are preferentially the sites of such rapid enhanced flaring activity.
1 Introduction
A galaxy center hosting an active galactic nucleus (AGN) is dominated by its continuum emission. Therefore, a flare originating from this nuclear region requires a distinctly powerful event to be detectable above this stochastically variable continuum. A small number of rapid111We refer to flare timescales as “rapid” when they occur on week to month timescales., smoothly evolving flares have been observed to be associated with AGN (e.g. Drake et al. 2011; Blanchard et al. 2017), with few known mechanisms that can cause these events to occur.
Intrinsic UV/optical flares, such as those due to enhanced accretion onto the central supermassive black hole (SMBH) in the form of gaseous material or stars passing too close to the nucleus, have been observed in the form of: tidal disruption events (e.g. Gezari et al. 2012; van Velzen et al. 2020a), UV-bright flaring events that are associated with accretion rate changes (Trakhtenbrot et al., 2019a), transients with double peaked line profiles linked to accretion disk emission (e.g. Halpern & Eracleous 1994), or changing-look AGN — the dramatic change in spectroscopic AGN classification following a rise in continuum level, thought to be connected to unstable changes in accretion state (e.g. LaMassa et al. 2015; Runnoe et al. 2016; MacLeod et al. 2016; Ruan et al. 2016; Stern et al. 2018; Ross et al. 2018; Trakhtenbrot et al. 2019b; Frederick et al. 2019; Graham et al. 2020).
Phenomena extrinsic to the SMBH accretion engine, such as microlensing of a quasar by a foreground Galactic source (e.g. Lawrence et al. 2012) or slowly evolving super-luminous supernova (SLSN) explosions, have also been observed to cause smooth large-amplitude flares from galaxies with AGN (Graham et al., 2017). In rare cases these can be astrometrically indistinguishable from the galactic nucleus, and therefore it becomes difficult to discern whether an explosive disruption to the accretion flow has occurred, and to differentiate this from AGN variability (Terlevich et al., 1992).
Multiwavelength approaches are required to disentangle this diverse family of observed flaring behaviors from AGN. In the golden era of time domain astronomy, even with many multichromatic instruments trained on the sky, a number of newly-discovered objects continue to defy placement into a clear-cut observational category.
In order of discovery, we present a photometric class comprised of five rapid flares with similar smooth light curve shapes occurring in a subclass of AGN observed by the Zwicky Transient Facility (ZTF) survey:
-
a)
ZTF19aailpwl/AT2019brs ()
-
b)
ZTF19abvgxrq/AT2019pev ()
-
c)
ZTF19aatubsj/AT2019fdr ()
-
d)
ZTF19aaiqmgl/AT2019avd ()
-
e)
ZTF18abjjkeo/AT2020hle ()
In Section 2 we present the follow up of these flares. In Section 3 we compare the results of their respective multiwavelength follow up campaigns to observations of a variety of related objects found in recent years, and in Section 4 we attempt to place them into a classification scheme based on observational properties, summarized in Section 5. All transients in the sample are referred to by their ZTF alert names throughout. All magnitudes are reported in the AB system and light curves are shown in the observed frame unless otherwise stated. We have adopted the following cosmology: = 70 km s-1 Mpc-1, = 0.73 and = 0.27.
2 Observations
The Zwicky Transient Facility Survey (Bellm et al., 2019a; Graham et al., 2019) is comprised of the automated Palomar 48-inch Samuel Oschin Telescope (P48) as well as the Palomar 60-inch SED Machine (P60 SEDM; Blagorodnova et al. 2018; Rigault et al. 2019), and has surveyed the Northern Sky with - and -band filters with a 3-night cadence since 2018 (Bellm et al., 2019b). At least 15 images meeting good quality criteria were stacked to build a coadded reference image of each observing field and quadrant in each filter band. Science images are subtracted by their references and processed each night by the Infrared Processing and Analysis Center (IPAC) pipeline (Masci et al., 2019). The candidate transient alert stream (Patterson et al., 2019) is distributed by the University of Washington Kafka system, and filtered through the AGN and black holes Science Working Group’s Nuclear Transients222A nuclear transient was defined as that within 0.5” of the reference galaxy center. Over 9000 nuclear transients passed this filter and were ranked during ZTF Phase I, of which 27 were TDEs, over 7% were classified as SN, and over half were AGN or candidate AGN. parameter criteria (outlined in van Velzen et al. 2019, 2020b) by the Ampel broker (Nordin et al., 2019; Soumagnac & Ofek, 2018), with the GROWTH Marshal user interface utilized for the coordination of follow-up efforts (Kasliwal et al., 2019).
All 5 transients included in the sample presented here were selected based on the following criteria: large amplitude, nuclear variability ( mag in difference imaging photometry, and within 0.5″ of the center of the host galaxy in the reference image) with follow-up or pre-flare spectra consistent with an AGN classification. This selection was not systematic (and therefore not complete), but rather the result of ongoing intersecting and collaborative searches for changing look AGN (Frederick et al., 2019), TDEs (van Velzen et al., 2019, 2020b), and superluminous supernovae (Lunnan et al., 2019; Yan et al., 2020) relying on partial human vetting from the ZTF transient alert stream, from which this sample emerged as more examples were collected. A systematic search for NLSy1 transients in ZTF will be the focus of a future study.
2.1 Optical Photometry
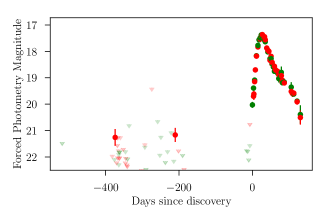
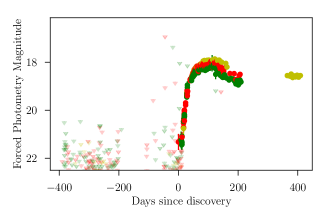
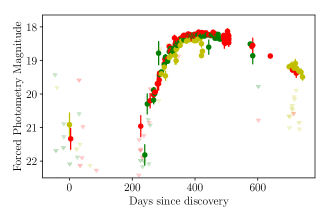
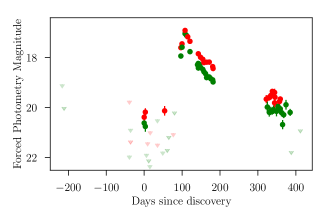
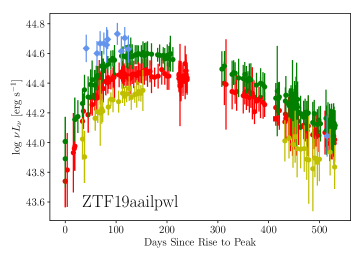
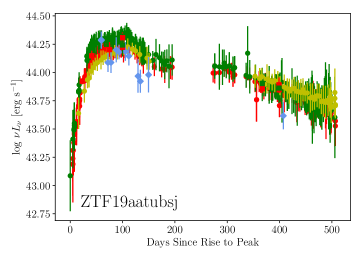
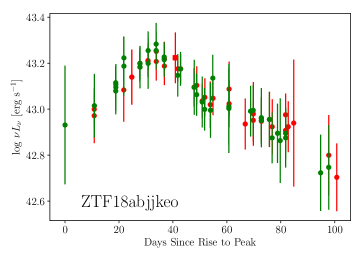
All transients in the sample were detected pre-peak using ZTF difference imaging photometry. The smooth light curve shapes (with scatter mag) of the sample are shown in Figure 1. All magnitude changes are reported in band unless otherwise noted. An analysis of the rise times to peak are measured and reported in Section 3.1.1. We report the -band magnitude-weighted offsets for each transient, calculated using Equation 3 in van Velzen et al. (2019). ZTF forced photometry for the sample is shown in Figure 10 of the Appendix.
ZTF19aailpwl — (RA=14:27:46.41, Dec=+29:30:38.6, J2000.0) was first detected on 2019 Feb 08 as a nuclear transient within 017 of the host galaxy center. The host galaxy displayed some variability at the mag level in the Catalina Real-Time Transient Survey (CRTS; Drake et al. 2009) from 2005 to 2013.
ZTF19abvgxrq333ZTF19abvgxrq passed the ZTF TDE working group’s tidal disruption event criteria, and was given the nickname “Stannis Baratheon” for ease of discussion. When it was found to be among a class of AGN-associated objects serendipitously detected by ZTF, the other sources in the class were retroactively given the names of other Game of Thrones characters in the same Great House - and collectively referred to fondly as “The Baratheons”, whose motto is, appropriately, “Ours is the Fury”. — (RA=04:29:22.72, Dec=+00:37:07.6, J2000.0), also known as Gaia19eby, was first detected on 2019 Sept 04 as a nuclear transient within 015 of the host galaxy center. ATLAS, Gaia, and PanSTARRs also reported observations of this source on the Transient Name Server (TNS) with discovery dates of 2019 Sep 04, 2019 Sep 13, and 2019 Sep 26, respectively. The host galaxy displayed no variability above the 0.5 mag level in CRTS.
ZTF19aatubsj — (RA= 17:09:06.86, Dec=+26:51:20.7, J2000.0) was detected on 2019 Apr 27 with a significant flux increase with respect to the reference image and with an offset from the nucleus of its host of 013. During a coverage gap in the first 40 days of the rise, ATLAS reported an intriguing “bump” feature (Smartt et al., 2019). The host galaxy displayed variability at the 2 mag level in V-band CRTS data from 2009 to 2013 (variability which was not observed in ZTF forced photometry prior to the transient).
ZTF19aaiqmgl — (RA=08:23:36.77, Dec=+04:23:02.5, J2000.0), also known as eRASSt J082337+042303444This was the only source in the sample to be detected by the extended ROentgen Survey with an Imaging Telescope Array (eROSITA, part of the Russian-German ”Spectrum-Roentgen-Gamma” (SRG) mission; Cappelluti et al. 2011), and was given the name eRASSt J082337+042303. This X-ray detection coincident with the transient’s host galaxy is described in Section 2.4., was detected by ZTF beginning on 2019 Feb 09 within 006 of its host galaxy. The host showed no variability in CRTS for 15 years prior to its rapid rise to peak.
ZTF18abjjkeo — (RA=11:07:42.91, Dec=+74:38:02.0, J2000.0) was detected beginning on 2020 Apr 05 within 002 of its host galaxy center. The ZTF forced photometry for this source shows no variability above the level of the galaxy for days. The host galaxy of ZTF18abjjkeo was beyond the survey limits of CRTS.
2.2 Optical Spectroscopy
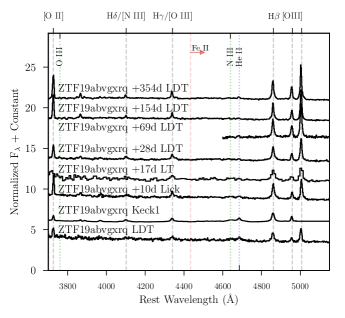
All spectroscopic follow-up observations for the sample are summarized in Table 1, and each epoch is shown in Figure 11 of the Appendix. The phases of the optical follow-up spectra with respect to the features in the ZTF light curves are annotated on Figure 1. All transients in this sample have spectral characteristics of NLSy1 galaxies, i.e. strong Balmer line emission with FWHM km s-1, along with other spectral features which are highlighted below and explored in detail in Section 3.2. We reduced Palomar 60” SED Machine (P60/SEDM; Program PIs: Gezari, Sollerman, Kulkarni) spectra with pysedm (Rigault et al., 2019), and all other spectra with pyraf using standard procedures.
| Name | Obs UT | Instrument | Exposure (s) | Reference |
| ZTF19aailpwl | 2006 Jul 01 | SDSS | 3000 | Abolfathi et al. (2018) |
| 2019 Mar 15 | FLOYDS-N | 3600 | Arcavi et al. (2019) | |
| 2019 Jun 22 | LDT Deveny | 900 | This work | |
| ZTF19aatubsj | 2019 May 25 | Palomar 60” SEDM | 2250 | This work |
| 2019 Jun 17 | LT SPRAT | 900 | This work | |
| 2019 Jun 22 | LDT Deveny | 900 | This work | |
| 2019 Jul 03 | Palomar 200” Hale | 600 | This work | |
| 2020 Apr 30 | NOT ALFOSC | 1750 | This work | |
| ZTF19abvgxrq | 2019 Sep 08 | Palomar 60” SEDM | 2250 | This work |
| 2019 Sep 15 | LT SPRAT | 500 | This work | |
| 2019 Sep 22 | Palomar 60” SEDM | 2250 | This work | |
| 2019 Sep 24 | LDT Deveny | 600 | This work | |
| 2019 Sep 25 | Keck LRIS | 300 | This work | |
| 2019 Sep 25 | NICER | 2000 | Kara et al. (2019) | |
| 2019 Oct 01 | Chandra LETG | 45400 | Miller et al. 2019 | |
| 2019 Oct 05 | Lick 3-m KAST | 1500 | This work | |
| 2019 Oct 12 | LT SPRAT | 500 | This work | |
| 2019 Oct 15 | Chandra LETG | 91000 | Mathur et al. 2019 | |
| 2019 Oct 23 | LDT Deveny | 900 | This work | |
| 2019 Nov 01 | Palomar 60” SEDM | 2250 | This work | |
| 2019 Dec 03 | LDT Deveny | 2400 | This work | |
| 2020 Feb 26 | LDT Deveny | 2600 | This work | |
| 2020 Jan 30 | Swift XRT | 94700 | This work | |
| ZTF19aaiqmgl | 2020 Mar 15 | NOT ALFOSC | 1800 | Malyali et al. 2020, in prep. |
| 2020 Apr 28 | eROSITA SRG | 140 | Malyali et al. 2020, in prep. | |
| 2020 May 10 | FLOYDS-S | 3600 | Trakhtenbrot et al. (2020) | |
| ZTF18abjjkeo | 2020 May 16 | Palomar 60” SEDM | 2250 | This work |
| 2020 May 18 | LT SPRAT | 1000 | This work |
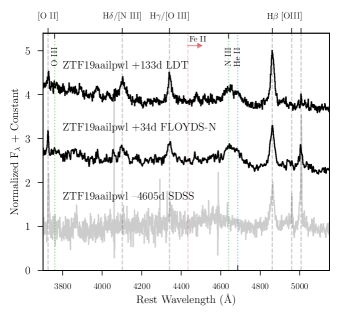
ZTF19aailpwl — showed a striking difference to the SDSS spectrum showing it was a NLSy1 as early as 2006 (Abolfathi et al., 2018; Rakshit et al., 2017). The follow-up Folded Low Order whYte-pupil Double-dispersed Spectrograph North (FLOYDS-N; Arcavi et al. 2019 and Lowell Discovery Telescope (LDT, formerly DCT; PI: Gezari) spectra showed a steep blue continuum and a strong He II profile with Bowen fluorescence features, indicating it became a flaring SMBH belonging to the observational class established by Trakhtenbrot et al. (2019a).
ZTF19abvgxrq — was spectroscopically identified as a NLSy1 on 2019 Sept 15 with the Liverpool Telescope (LT; PI: Perley) SPectrograph for the Rapid Acquisition of Transients (SPRAT), based on the width of the Balmer emission lines and the strength of the [O III] 5007 emission line. Gezari et al. (2019) reported that the LT spectrum showed evidence for blue-shifted He II 4686 emission as well as N III 4640 emission, due to the Bowen fluorescence mechanism, placing it again in the observational subclass of the Trakhtenbrot et al. (2019a) objects. Near peak it was observed with Keck 10-m Low Resolution Imaging Spectrometer (LRIS; PI: Graham) as well as the LDT Deveny Spectrograph (PI: Gezari) and the KAST Double Spectrograph on the Lick 3-m Shane Telescope (PI: Foley), which confirmed the strong blue continuum and clearly defined and persistent Bowen fluorescence features.
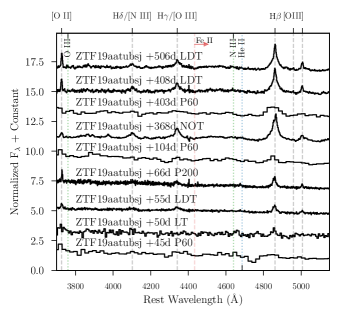
ZTF19aatubsj — was observed 8 days after peak on 2019 Jul 03 with the Double Spectrograph (DBSP) on the Palomar 200-inch Hale Telescope (P200; PI: Yan). We measured a significant “blue horn” component of H and marginally detected He II. The transient continuum of ZTF19aatubsj faded to reveal an underlying Fe II complex in the Nordic Optical Telescope (NOT; PI: Sollerman) spectrum taken nearly 368 days after peak on 2020 Apr 30, with no evidence for He II emission.
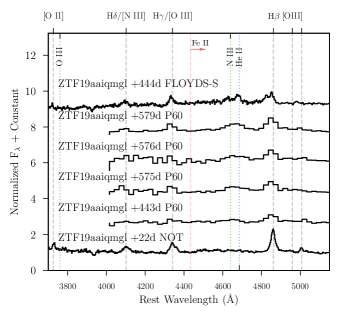
ZTF19aaiqmgl — The spectrum taken with NOT (PI: Sollerman) on 2019 Mar 15 near the first optical peak showed strong Balmer line emission, no detection of a He II line complex, and evidence for a Fe II complex, characteristic of NLSy1 galaxies. A follow-up FLOYDS-S spectrum taken 444 days after peak and reported to the Transient Name Server (TNS) by Trakhtenbrot et al. (2020) showed the appearance of He II and Bowen fluorescence features and a “blue horn” in H. Again this event was classified as a member of the Trakhtenbrot et al. (2019a) observational class of flaring NLSy1s.
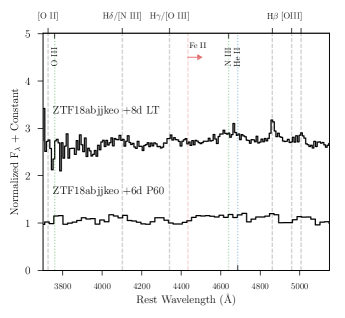
ZTF18abjjkeo — In the LT (PI: Perley) spectrum of ZTF18abjjkeo taken on 2020 May 18 8 days after peak, the narrow component of the He II profile is significantly blueshifted. No Fe II line complex was detected in the spectra of this transient.
2.3 UV Photometry
We triggered target-of-opportunity monitoring observations with the Neil Gehrels Swift Telescope (Gehrels et al., 2004) for all transients in the sample. Using the HEASOFT command uvotsource we extracted UVOT photometry within a 5″-radius circular aperture and using an annular background region centered on the coordinates of the optical transient.
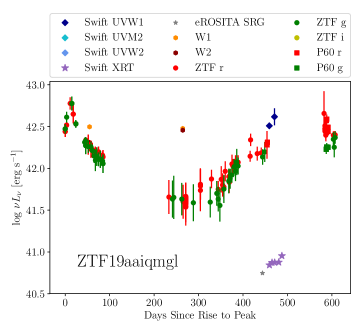
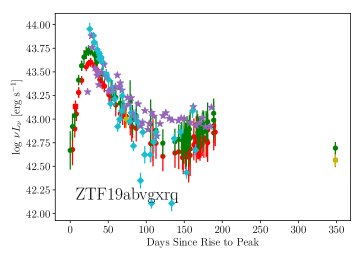
Figure 2 shows the light curves of all flares in the sample. We compare ZTF and band difference imaging, WISE difference imaging, Swift XRT monitoring, and Swift UVOT detections subtracted by the archival Galaxy Evolution Explorer (GALEX; Bianchi et al. 2017) All-Sky Imaging Survey (AIS) near-UV (NUV, Å) host measurements (measured with a 6-″radius aperture).
We found all transients in the sample to be UV-bright, but with varying UV colors. The UV color of ZTF19aaiqmgl ( mag) was similar to that of ZTF19abvgxrq ( mag) and ZTF19aailpwl (ranging from mag to mag in 80 days), but ZTF19aatubsj was the only transient in the sample with positive UV color ( mag). The UV light curves of the sample tend to follow the shape of the optical. ZTF19abvgxrq became host dominated over time as the transient faded. but with strong scatter in the light curve as it approached the host magnitude.
2.4 X-rays
We found only two transients in the sample to be X-ray bright in follow-up Swift XRT observations: ZTF19abvgxrq and ZTF19aaiqmgl. ZTF19aailpwl was detected only once, and then only at a low level. We measured an XRT upper limit of 0.004 counts s-1 for ZTF19aatubsj. X-ray follow-up spectra are reported in Table 1. Swift photometry compared to WISE W1- and W2-band and ZTF and -band photometry is shown in Figure 2. The X-ray bright flares in this sample tend to vary in lockstep with the slow UV/optical flares.
ZTF19aailpwl — was detected only once in 11 observations during a 16-month monitoring campaign between 2019 Mar 21 and 2020 Jul 7. We measured a 3- detection of 0.003 counts s-1 on 18 Apr 2019, just brighter than the limiting flux.
ZTF19abvgxrq — Similar to the UV light curve, the shape of the X-ray flare of ZTF19abvgxrq followed the optical, from its fade through its second rise (See Figure 2 and Section 3). The unabsorbed keV flux from the stacked XRT spectrum of ZTF19abvgxrq was erg cm-2 s-1. ZTF19abvgxrq was previously detected in ROSAT, and NICER observations show an increase in flux from this by 100 times ( erg cm-2 s-1), variable from 11 to 14 counts s-1 in 3 hours (Kara et al., 2019). A 50 ks Chandra LETG grating observation taken just 8 days after peak and reported by Miller et al. (2019) found a flux consistent with this, with the spectral shape a good fit to a keV blackbody, and the source variable at the 25% level on ks timescales. Mathur et al. (2019) reported a decrease in keV flux to erg cm-2 s-1; their 91 ks Chandra LETG observation was a good fit to a consistent blackbody model and a power law component typical of AGN with spectral index , with no intrinsic absorption required.
ZTF19aaiqmgl — was observed only during the second optical flare (on 2020 Apr 28, 350 days after the first ZTF detection), and was the only X-ray bright transient in the sample with much fainter X-ray than that of the optical (shown in Figure 2). Like ZTF19abvgxrq, the shape of the X-ray rise followed that of the second rise. It was detected by eROSITA as eRASSt J082337+042303, a soft X-ray transient consistent with the galaxy 2MASX J08233674+0423027 (Malyali et al. 2020, Malyali et al. 2020, in prep.) Prior to this, the XMM Slew Survey reported a non-detection at the location of the host galaxy, with an upper limit of erg-1 s-1 cm-2 assuming eV and cm-2. The SRG flux of erg-1 s-1 cm-2 was 90 times brighter than this upper limit. No hard X-ray component was detected above 2.3 keV. No strong short-term variability on hours-long timescales was detected, and no strong variability was detected between SRG and the 3 Swift XRT monitoring observations taken afterward with a week-long cadence. Swift and NICER observations over the next 5 months showed an additional increase in X-ray flux by a factor of 10 (Pasham et al., 2020). A careful study of the X-ray properties of this transient is forthcoming (Malyali et al. 2020, in prep.)
2.5 IR
Malyali et al. (2020) reported that the WISE color of ZTF19aaiqmgl was atypically low ( mag) compared to typical AGN values ( mag, Stern et al. 2012; Assef et al. 2013). The WISE colors of ZTF18abjjkeo (neoWISE: 0.35 mag, AllWISE: 0.036 mag) and ZTF19abvgxrq ( mag) are also inconsistent with an AGN, though not quite as low as that of ZTF19aaiqmgl. Only ZTF19aailpwl truly appeared as an AGN in IR, with mag. The WISE AGN classification of the sample is summarized in Table 3 in Section 4.
A flare in the IR was detected in NeoWISE at the location of ZTF19aaiqmgl and concurrent with the optical and X-ray transient. Though the IR flare began much sooner in 2009, Figure 2 shows that the peak of the flare was delayed with respect to the first optical peak. Prior to this flare, WISE photometry detected no variability at the location of ZTF19aaiqmgl for nearly 5 years.
3 Analysis
3.1 Photometry
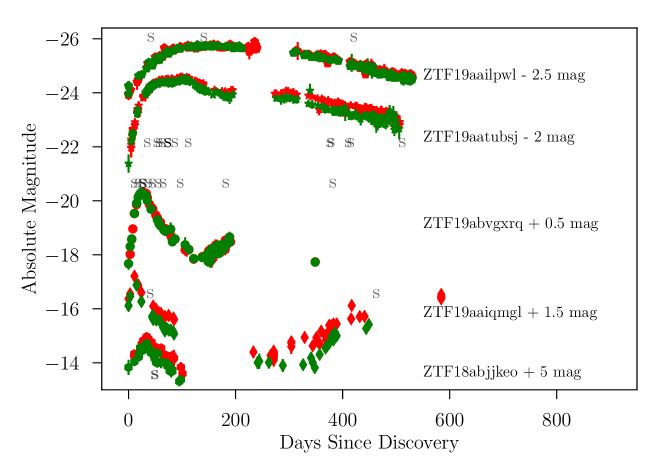
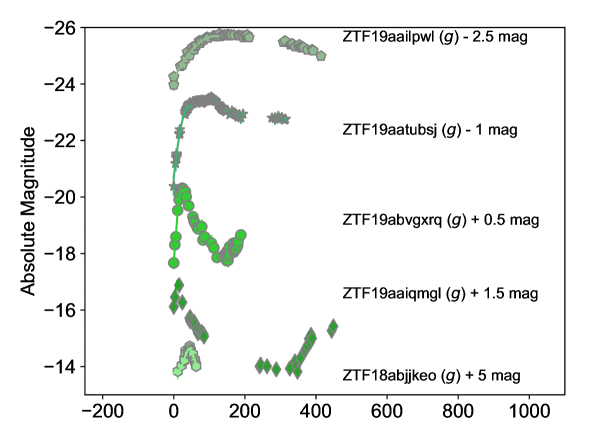
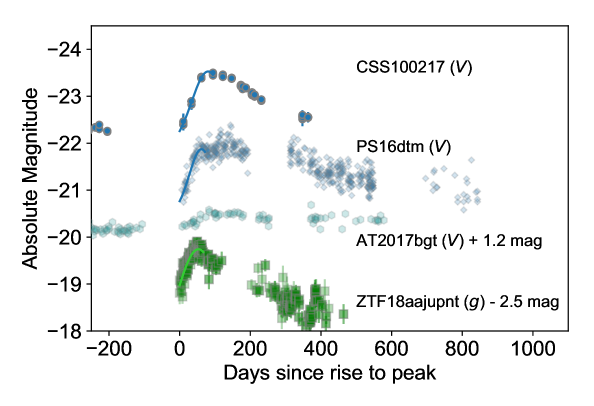
The difference imaging light curves for the sample are shown in terms of absolute magnitudes in Figure 3.
We show the sample alongside various NLSy1-related events from the literature, which are described in more detail in Section 4. CSS100217 displayed some variability prior to the transient, unlike any of the events in this sample. AT2017bgt was observed only during its fade in difference imaging, so we instead show its aperture photometry (from the ASAS-SN Photometry Database555https://asas-sn.osu.edu/photometry; Jayasinghe et al. 2019) which also shows the rise of the source. ZTF18aajupnt is by far the least luminous transient shown. We note the similarity of the shapes of the light curves of ZTF19aatubsj and PS16dtm, which is discussed further in Section 4.
3.1.1 Light Curve Timescales
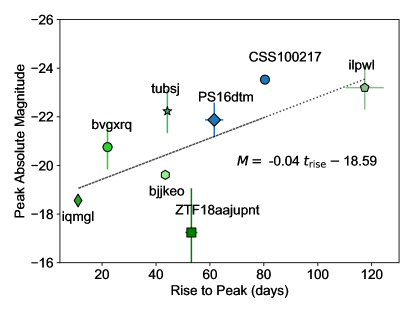
We measured the rise-to-peak timescales of the sample by fitting Gaussians to the light curves shown in Figure 3 using the lmfit package. We observe a correlation between the luminosity (specifically the absolute magnitudes and ) and rise-to-peak timescales of the sample () with the following relation: , shown in Figure 4. Fitting the light curves with quadratic functions resulted in the same correlation within the error estimates. Interestingly, TDEs also show a positive correlation between rise time to peak and luminosity (van Velzen et al., 2020b). ZTF18aajupnt appears under-luminous for how fast it rises. AT2017bgt was observed only during its fading phase in difference imaging, and so was excluded from this portion of the analysis.
3.1.2 Rebrightening
It is noteable that two sources in the sample, ZTF19abvgxrq and ZTF19aaiqmgl, each have a dramatic rebrightening episode. Following a flare and an approximately 2 mag fade from peak, both return to nearly half their maximum luminosity before seasonal gaps in visibility. This is in contrast to that of almost all TDEs and SN in the literature (e.g. Sollerman et al. 2019, 2020), although they can show plateaus and “humps” (e.g. Hammerstein et al. 2020, in prep.)666We note that ASASSN-15lh showed a large amplitude “double-humped” structure in its UV light curve. We explore possible interpretations of this rebrightening in Section 4.
3.1.3 UV/Optical to X-ray Ratio
We derive the simultaneous UV/optical-to-X-ray spectral slope ratio () from the Swift UVOT and XRT observations of the sample, (as well as upper limits assuming , when applicable). We compute unabsorbed X-ray flux densities at 2 keV using the PIMMS v4.10 web tool777https://cxc.harvard.edu/toolkit/pimms.jsp. Following Eq. 4 of Tananbaum et al. (1979) and Eq. 11 of Grupe et al. (2010), the definition of this ratio is . Of the transients detected in X-rays, the of ZTF19abvgxrq evolves over 150 days between 1.1 and 1.4, and ZTF19aailpwl is observed in X-rays during only one epoch with , equivalent to that of the late time detections of ZTF19aaiqmgl. The range of measured for the sample is consistent with that of NLSy1s (; Gallo 2006).
3.2 Spectroscopy
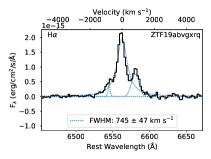
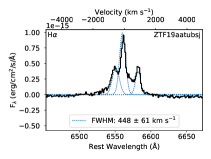
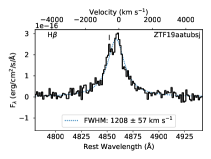
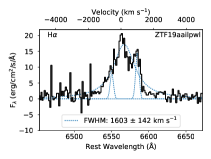
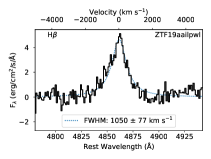
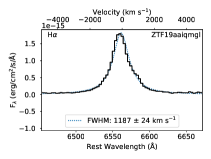
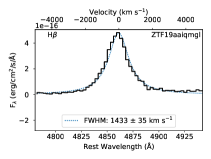
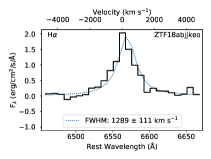
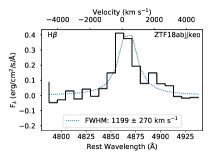
From the FWHM of the broad Balmer emission lines, we classified all sources in the sample as NLSy1s. We fit the H and H line profiles of the host (when available) and transient spectra of the sample with the non-linear least-squares minimization and curve-fitting routine in the lmfit Python package. The results of these fits are shown in Figure 5. Using a Lorentzian profile for the broad H component fit provided an improvement of the fit over that of a Gaussian profile, as would be expected based on studies of NLSy1s (e.g. Nikołajuk et al. 2009).

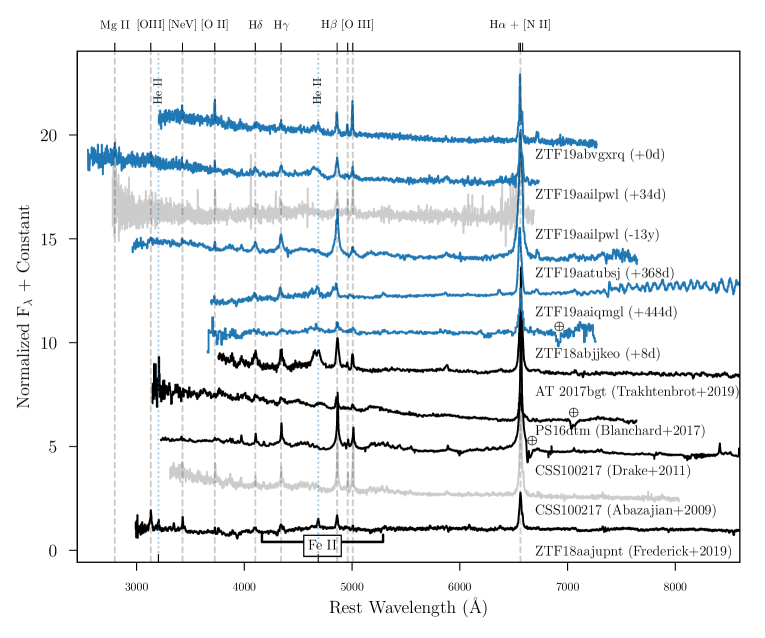
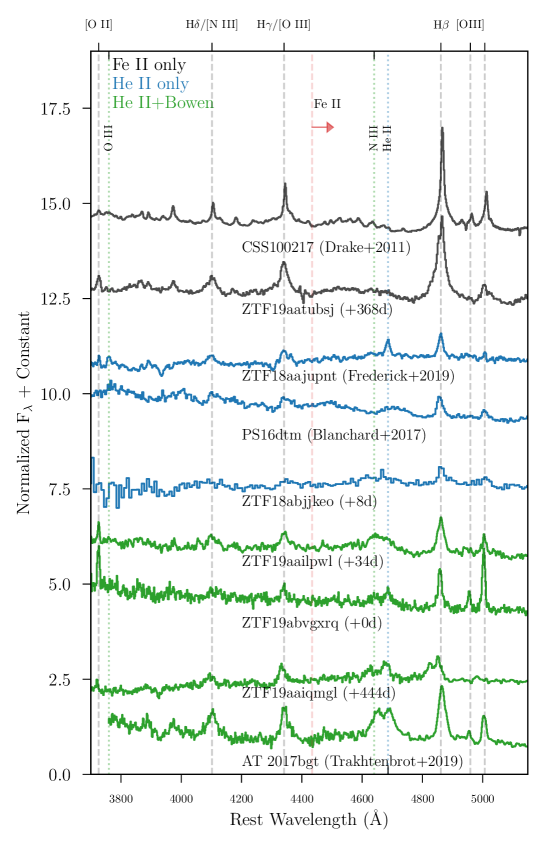
We compare the host (when available) and transient spectra of this sample to other transients in NLSy1s in Figures 6 (showing the full wavelength range of the observations) and 7 (rest wavelength Å, showing clearly the He II, Fe II, and H line profiles). In Figure 7 we color-code the sample (as well as these known NLSy1-related transients in the literature) based on the observational classification scheme we establish in Section 4.3, named after the features discussed in the following sections: “He II only”, “He II+N III”, and “Fe II only”888We note that although “only” is used in the categorization naming based on the presence of spectral features, all have strong Balmer features..
When compared to the newly discovered flaring events to those in the literature, it is clear that AT2017bgt (Trakhtenbrot et al., 2019a) has a much stronger He II+N III Bowen fluorescence profile, CSS100217 (Drake et al., 2009) has stronger narrow emission lines overall, and ZTF18aajupnt (Frederick et al., 2019) has a weaker blue continuum. The presence and strength of Fe II is uncorrelated with other spectroscopic properties of the transients shown. Of the ZTF sample, the transient spectrum of ZTF19aatubsj shows the strongest Fe II complex. However, ZTF19aatubsj shows no strong He II + Bowen fluorescence features while the others in the ZTF sample do. ZTF19aatubsj and ZTF19aaiqmgl both show offset blue components of H.
3.2.1 Strong He II profiles in AGN?
In the discovery paper for transient ASASSN-18jd, Neustadt et al. (2020) emphasized the relatively rare nature of strong He II emission in AGN in general, noting the exceptions in the Trakhtenbrot et al. (2019a) observational class of flares as well as the rapid changing-look AGN event ZTF18aajupnt (Frederick et al., 2019). A strong He II line profile is common (but not ubiquitous) in the spectra of TDEs, and they are typically accompanied by Bowen fluorescence features (e.g. Blagorodnova et al. 2019; van Velzen et al. 2020b). ZTF19aaiqmgl, ZTF19abvgxrq, ZTF19aailpwl look the most similar to AT2017bgt spectroscopically. They are spectroscopically classified as “He II+N III”-type flares in Figure 7.
3.2.2 The Fe II complex
A strong Fe II line complex (blueward and redward of H+[O III] in optical spectra, between 4434 Å and 5450 Å) is a distinguishing feature of NLSy1 galaxies. Reverberation mapping studies of AGN show that the line complex emitting region is measured farther than the Balmer line emitting region (e.g. Barth et al. 2013; Rafter et al. 2013). The Fe II complex seen in PS16dtm was interpreted as evidence of the system being a NLSy1 prior to the onset of the flare. CSS100217 also displayed a strong Fe II complex and was interpreted as a SN in a NLSy1 (Drake et al., 2011). TDE AT2018fyk also showed low ionization lines including an Fe II (37,38) emission multiplet emerging for 45 days during the tidal disruption event, and forms a class of Fe-rich TDEs along with ASASSN–15oi and PTF–09ge (Wevers et al., 2019). Therefore, this feature may indicate the presence of an AGN, but is not always useful in determining the nature of a particular AGN-related flare. For two of the transients in this sample, whether or not the Fe II complex can be seen in optical spectra depends on the phase and the continuum brightness of the transient — for ZTF19aatubsj it was not observed for 368 days, and for ZTF19aaiqmgl it became no longer visible during the second rise 444 days after the initial spectrum was taken.
3.3 X-rays
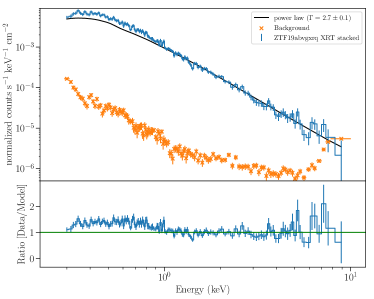
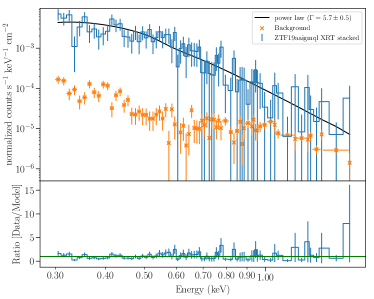
There are only two significantly X-ray detected transients in the sample: ZTF19abvgxrq and ZTF19aaiqmgl. We show their X-ray spectra in Figure 8 fit to power law models. The third, ZTF19aailpwl, was only detected in one epoch and not at a level that allowed for the signal-to-noise necessary for a spectrum.
The X-ray spectrum of ZTF19abvgxrq is measured by Swift XRT with a power law index of , typical of the strong soft X-ray excess observed below 1 keV in NLSy1s (; Boller et al., 1996; Forster & Halpern, 1996; Molthagen et al., 1998; Rakshit et al., 2017). The spectrum of ZTF19abvgxrq could also be explained by a 150 eV blackbody with a power law component and no intrinsic absorption (Kara et al., 2019). We note that the soft excess observed in NLSy1s can mimick the blackbody temperatures expected for TDEs (e.g. Boller et al. 1996).
The spectral index of ZTF19abvgxrq () was similar to that of AT2018fyk, interpreted as a TDE with late-time disk formation (Wevers et al., 2019), as well as ZTF18aajupnt, interpreted as a changing-look LINER “turning-on” into a NLSy1 (Frederick et al., 2019). The X-ray spectral index of ZTF19aaiqmgl was quite high even with regard to these events, with .
3.4 Black Hole Masses
We measured the black hole masses of the sample using two different methods, each with important caveats: The virial mass method, which may systematically underestimate BH masses for NLSy1s, and the host galaxy luminosity, which may be contaminated by the presence of an AGN. The calculated from the host galaxy luminosity is following McLure & Dunlop (2002), and the standard virial method (e.g. Shen et al. 2011) was employed to obtain the virial black hole masses from FWHM H reported in Table 2. The transient Eddington ratio estimates depend on the BH masses () as erg s-1, For each transient in the sample, we report a range of Eddington ratios in Table 2 bracketed by the Eddington ratio measured assuming the virial mass estimate for the BH mass, and the Eddington ratio measured assuming BH mass derived from the host galaxy luminosity. The range in BH masses, and therefore Eddington ratios, shown in Table 2 is quite large. We estimate statistical and systematic uncertainties of dex on these mass and Eddington ratio measurements, due to the typical scatter associated with single-epoch mass scaling relationships as well as the unknown BLR geometry (e.g. Merloni et al. 2015; Runnoe et al. 2016; Liu et al. 2018a, 2020).
Miller et al. (2019) obtained an independent measurement of the BH mass of ZTF19abvgxrq. They measured from the observed Chandra X-ray luminosity (this observation is described in more detail in Section 2.4). This is closer to, but not consistent with, the virial mass estimate, meaning that the transient may not have been accreting near the Eddington limit at the time of the X-ray observation.
| Name | FWHM | log | log | |||
|---|---|---|---|---|---|---|
| (mag) | ( erg s-1) | (km s-1) | [] | [] | ||
| -21.36 | 5.00 0.04 | 878 49 | 7.7 | 6.4 | 0.066-1.5 | |
| -20.94 | 2.24 0.02 | 1199 270 | 7.5 | 6.4 | 0.048-0.62 | |
| -22.38 | 42.6 0.8 | 1050 77a | 8.2 | 7.2 | 0.17-1.97 | |
| -20.35 | 0.553 0.008 | 1433 35 | 7.2 | 6.1 | 0.023-0.29 | |
| -21.51 | 21.9 0.2 | 1208 57 | 7.8 | 7.1 | 0.24-1.2 |
a. The FWHM(H) for ZTF19aailpwl agrees with the measurement in Rakshit et al. (2017) within the error estimates.
4 Discussion
In this section, we rule out possible physical scenarios for each outburst, beginning with core collapse supernovae IIn. We review why the supernova interpretation was quickly ruled out in favor of a supermassive black hole accretion scenario, and discuss how many of the characteristics of the objects are consistent with both NLSy1s and TDEs. We compare the available evidence with other scenarios including TDEs, extreme AGN variability, and binary SMBHs in detail. We also discuss NLSy1 galaxies as the preferential hosts for these and other similar events, and outline a scheme for classifying future events based on the presence of spectral features.
4.1 “IIn or not IIn?”: Preliminary Observational Classification of the Flare Sample
Identification of the sample presented here occurred with a slew of conflicting preliminary classifications at early times, which we describe below.
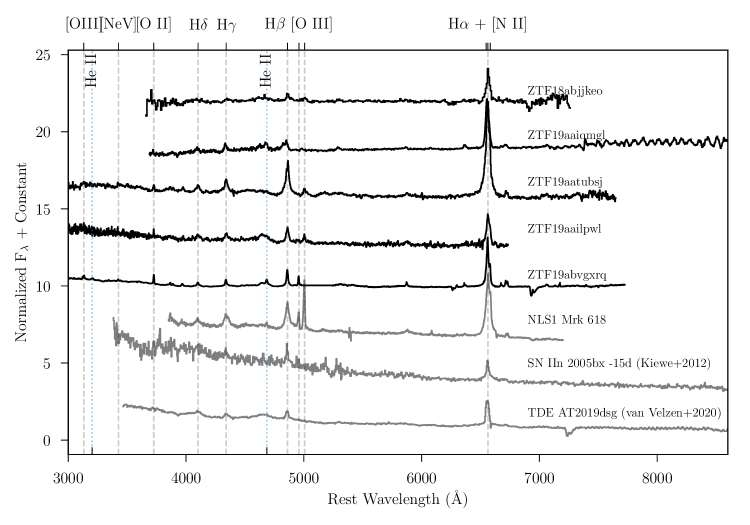
The narrow emission lines in the spectra of some SLSN (Type IIn) are a result of the highly luminous interaction of supernova ejecta from a massive progenitor with dense circumstellar medium. Therefore, under special circumstances, nuclear SNe can look spectroscopically very similar to rapid999With rise times on the order of days to weeks. flares from NLSy1s in the optical (e.g. Moriya et al. 2018). The shapes of the light curves of the transients in this sample looked rather like those of such supernovae, in the absence of additional observations. The smoothness of the flares in particular was unique with respect to typical stochastic AGN variability, and made these transients noteworthy for allocation of follow-up resources. Therefore, the narrow Balmer features in the spectra of these transients, coupled with their light curve shapes, left uncertainty in their early classifications. They could have been either Type IIn supernovae or NLSy1 AGN, while those with persistent strong He II 4686 features in their spectra looked similar to that of TDEs. To illustrate this, Figure 9 shows spectra of the sample alongside a Type IIn SN as well as a TDE with Bowen fluorescence features. Additional follow-up observations in the UV/X-rays helped distinguish this sample of transients from SNe.
4.2 A Preponderance of Rapid Optical Transients in Narrow-line Seyfert 1 Host Galaxies
In the Analysis section (§3), we compared our sample to data from nuclear transients in the literature that happened to be hosted in NLSy1 galaxies. In this and the next sections, we discuss NLSy1s as an interesting AGN subtype, and observationally classify and link these events to one another on the basis of their shared host properties.
The narrower broad-line Balmer profiles and high amplitude variability, (especially in the X-rays, e.g. Pogge 2000; Frederick et al. 2018) in NLSy1s may be evidence of smaller black hole masses in these systems (5 log() 8; e.g. Mathur et al. 2001), and/or higher observed accretion rates (Pounds et al., 1995; Wang et al., 1996; Marconi et al., 2008; Grupe et al., 2010; Xu et al., 2012). The virial masses derived from spectral measurements of the population may also be explained with geometrical effects, when interpreted as the classic broad-line AGN seen along a lower inclination angle between the broad-line emitting region and the line of sight (Decarli et al., 2008; Baldi et al., 2016; Rakshit et al., 2017).
Studies of NLSy1s typically find them to be highly photometrically variable only in the X-rays. At optical wavelengths, however, Klimek et al. (2004) found that rapid, high amplitude variability was rare in a sample of 172 observations of NLSy1s across 33 nights. Ai et al. (2010) also found that NLSy1s had systematically lower optical variability amplitudes ( mag) than broad-line Seyfert 1s in a sample of 275 AGN at in 3 years of SDSS data.
However, optical flares are not unheard of in NLSy1s (e.g. NGC 4051, Guainazzi et al. 1998; Uttley et al. 1999). Klimek et al. (2004) noted the exception of IRAS 13224-3809, which showed both dramatic X-ray and optical variability on short timescales (Miller et al., 2000). Here we describe a number of distinct events, including the Trakhtenbrot et al. (2019a) observational class of optical flares, the “on” state of ZTF18aajupnt, and the host of PS16dtm and CSS100217:102913+404220, which were all consistent with NLSy1 related activity.
Trakhtenbrot et al. (2019a) established a new observational class of dramatic AGN flares accompanied by Bowen fluorescence features. The events in this class all originated from active black holes that were classified as NLSy1 galaxies by their Balmer FWHMs. Their optical spectra were unusual for NLSy1s in that they showed strong “double-peaked” He II profiles with contributions from the N III 4640 Bowen fluorescence feature, indicating the presence of a strong UV ionizing continuum. This was consistent with the UV brightness observed in the small sample of objects as well as the steep blue continua in these sources. The slow UV and spectral emission line evolution over a period of 450 days ruled out a TDE, and these were instead interpreted as enhanced accretion onto the SMBH of a pre-existing AGN. AT2017bgt was presented as the prototype of these dramatic SMBH UV/optical flares irradiating the BLR. It showed a very slow decrease in optical flux over several months following a relatively shallow (0.5 mag) rise to peak over 80 days from a previous non-variable state. During the transient, the X-rays increased by a factor of from a previous measurement by ROSAT. The persistence of the UV emission over 500 days distinguished it from SNe, and the extremely intense nature of the UV continuum as well as presence of the Bowen fluorescence features in the optical spectrum distinguished it from CLAGN. Two other NLSy1s, OGLE17aaj (Gromadzki et al., 2019) and ULIRG F01004-2237 (Tadhunter et al., 2017) (the latter previously interpreted as a TDE), were retroactively reclassified as belonging to this new observational class of NLSy1s.
We compare with ZTF18aajupnt, a changing-look AGN which transformed from a LINER galaxy to a NLSy1. It was identified as such primarily based on X-ray and UV spectra. It displayed strong high ionizaiton forbidden (i.e. “coronal”) emission in the optical and UV spectra, an X-ray flare delayed by 60 days, and showed a late-time color change as it faded slowly over 1 year. This was the only AGN with Balmer lines consistent with a NLSy1 among a new class of “changing-look LINERs”, including SDSS 1115+0544 (Yan et al., 2019).
PS16dtm (iPTF16ezh/SN 2016ezh) was a near-Eddington but X-ray-quiet nuclear transient with strong Fe II emission and K. It rose over 50 days to “superluminous” levels (log ) at peak before plateauing twice over 50 and 100 days while maintaining a constant blackbody temperature. The event was interpreted as a TDE exciting the BLR in a well studied, spectroscopically-confirmed NLSy1 with (Blanchard et al., 2017). X-ray upper limits showed dimming by at least an order of magnitude compared to archival observations, but Blanchard et al. 2017 predicted the X-rays would reappear after the obscuring debris (oriented perpendicularly to the accretion disk) had dissipated. We show the -band ASASSN photometry for PS16dtm in Figure 4 which appears similar in shape and absolute magnitude to ZTF19aatubsj, though longer in duration.
CSS100217:102913+404220 displayed a high state ( at 45 days post-peak) accompanied by broad H and was interpreted either as a Type IIn SN (Drake et al., 2011) or a TDE (Saxton et al., 2018) near the nucleus (150 pc) of a NLSy1 in a star forming galaxy. It eventually faded back to slightly below its original level after one year, which was interpreted as interacting with and subsequently flushing a portion of the accretion disk.
Similar events are not unheard of in broad-line AGN systems, though they may be comparatively more rare. Neustadt et al. (2020) reported a candidate for such a rapidly flaring event with quasar-like properties, ASASSN 18jd, although continued observations of this transient will be critical for a better understanding of the properties of the host.
4.3 Observational Classification: The “Family Tree” of NLSy1-associated Transients
In Table 3, we use this sample to motivate a framework for quickly classifying similarly ambiguous flaring events. We investigate the following:
- •
-
•
TDE characteristics (host black hole mass below the Hills mass (), and a lack of cooling or significant rebrightening),
-
•
X-ray properties (the presence of which can occur in both AGN and TDEs, but are less likely in the SN scenario).
We apply these criteria in Table 3 and color code them as blue or green based on whether they favor the TDE or AGN scenario, respectively (as the SN scenario has been ruled out in Section 4.1). The spectroscopic class, based on the presence of N III Bowen fluorecence features, Fe II, and/or He II 4686, which can occur in both TDEs as well as flaring NLSy1s, is then interpreted in the context of one of these scenarios. Based on this table, we confirm the interpretations for three of the four NLSy1-associated transients reported in the literature, except for CSS100217 for which we favor the AGN scenario over the SN interpretation.
Summarized briefly: We expect transients with strong Fe II complexes are most likely associated with AGN, those with very steep soft X-ray spectra () and no intrinsic absorption are most likely associated with TDEs, and those with strong Bowen fluorescence profiles and slow UV and spectral evolution are likely associated with enhanced accretion onto supermassive black holes from a pre-existing accretion disk. The timing of a mid infrared flare may also help to distinguish between an AGN and a TDE — if it precedes the optical, it is likely associated with AGN variability, but if it follows as an echo, it may be associated with a TDE (van Velzen et al., 2016).
van Velzen et al. (2020b) established a spectroscopic classification scheme for the sample of TDEs discovered during the first half of the ZTF survey, distinguishing those with and without He II in a single epoch. About half of the TDEs in that sample were “H-only”, and only one was “He-only”. They found that higher density conditions were likely for the rest of the TDEs which had H and He lines, as well as Bowen features.
For the flaring NLSy1 sample presented here, we establish the following spectroscopic classes to describe each of the transients based on the presence or absence emission features crucial to their physical interpretations:
-
1.
“He II only”,
-
2.
“He II+N III”, and
-
3.
“Fe II only”,
and we propose the following naming convention for these classes: “NLSy1-HeII”, “NLSy1-HeII+NIII”, and “NLSy1-FeII”.101010We note that although hydrogen features are not explicitly named in this feature classification scheme, all spectra of the transients show resolved narrow ( FHWM km s-1) Balmer features (see Section 3.2).
| Name | \cellcolor[HTML]bcecf4 log<8 | \cellcolor[HTML]bcf4bf H<2000 | \cellcolor[HTML]bcf4bf Fe II | \cellcolor[HTML]bcf4bf [OIII]/H | \cellcolor[HTML] bcecf4 | \cellcolor[HTML] bcecf4 UV-bright | X-ray | \cellcolor[HTML]bcf4bf W1-W2 | \cellcolor[HTML]bcf4bf Re- | Spec. class | Interp. |
| \cellcolor[HTML]bcecf4 [] | \cellcolor[HTML]bcf4bf km s-1 | \cellcolor[HTML]bcf4bf | \cellcolor[HTML]bcf4bf [flux ratio] | \cellcolor[HTML]bcecf4 mag | \cellcolor[HTML]bcecf4 | \cellcolor[HTML]bcf4bf 0.7 maga | \cellcolor[HTML]bcf4bf brighten | ||||
| ZTF19abvgxrq | \cellcolor[HTML] bcecf4 | \cellcolor[HTML]bcf4bf | \cellcolor[HTML] bcecf4 | \cellcolor[HTML]bcf4bf | \cellcolor[HTML] bcecf4 | \cellcolor[HTML] bcecf4 | \cellcolor[HTML]bcf4bf 3 | \cellcolor[HTML] bcecf4 | \cellcolor[HTML]bcf4bf | HeII+NIII | \cellcolor[HTML]bcf4bf AGN |
| ZTF19aailpwl | \cellcolor[HTML]bcf4bf | \cellcolor[HTML]bcf4bf | \cellcolor[HTML]bcf4bf | \cellcolor[HTML]bcf4bf | \cellcolor[HTML]bcecf4 | \cellcolor[HTML]bcecf4 | \cellcolor[HTML]bcecf4 | \cellcolor[HTML]bcf4bf | \cellcolor[HTML]bcecf4 | HeII+NIII | \cellcolor[HTML]bcf4bf AGN |
| ZTF19aatubsj | \cellcolor[HTML] bcecf4 | \cellcolor[HTML]bcf4bf | \cellcolor[HTML]bcf4bf | \cellcolor[HTML]bcf4bf | \cellcolor[HTML] bcf4bf | \cellcolor[HTML] bcecf4 | \cellcolor[HTML] bcecf4 | \cellcolor[HTML] bcecf4 | \cellcolor[HTML] bcecf4 | FeII | \cellcolor[HTML]bcecf4 TDE |
| ZTF19aaiqmgl | \cellcolor[HTML] bcecf4 | \cellcolor[HTML]bcf4bf | \cellcolor[HTML]bcf4bf | \cellcolor[HTML]bcf4bf | \cellcolor[HTML] bcf4bf | \cellcolor[HTML] bcecf4 | \cellcolor[HTML] bcecf4 5 | \cellcolor[HTML] bcecf4 | \cellcolor[HTML]bcf4bf | HeII+NIII | \cellcolor[HTML]bcf4bf AGN |
| ZTF18abjjkeo | \cellcolor[HTML] bcecf4 | \cellcolor[HTML]bcf4bf | \cellcolor[HTML] bcecf4 | \cellcolor[HTML]bcf4bf | \cellcolor[HTML] bcecf4 | - | - | \cellcolor[HTML] bcecf4 | \cellcolor[HTML] bcecf4 | HeII | \cellcolor[HTML]bcecf4 TDE |
| \cellcolor[HTML] bcecf4 | \cellcolor[HTML]bcf4bf | \cellcolor[HTML]bcf4bf | \cellcolor[HTML]bcf4bf | \cellcolor[HTML] bcf4bf | \cellcolor[HTML] bcecf4 | \cellcolor[HTML]bcf4bf 3 | \cellcolor[HTML]bcf4bf | \cellcolor[HTML] bcecf4 | FeII | \cellcolor[HTML]bcf4bf AGN | |
| \cellcolor[HTML] bcecf4 | \cellcolor[HTML]bcf4bf | \cellcolor[HTML]bcf4bf | \cellcolor[HTML]bcf4bf | \cellcolor[HTML]bcecf4 | \cellcolor[HTML] bcecf4 | \cellcolor[HTML]bcf4bf | \cellcolor[HTML] bcecf4 | \cellcolor[HTML]bcecf4 | HeII+FeII | \cellcolor[HTML]bcecf4 TDE | |
| \cellcolor[HTML] bcecf4 | \cellcolor[HTML]bcf4bf | \cellcolor[HTML]bcf4bf | \cellcolor[HTML]bcf4bf | \cellcolor[HTML] bcecf4 | \cellcolor[HTML] bcecf4 | \cellcolor[HTML]bcf4bf 2 | \cellcolor[HTML] bcecf4 | \cellcolor[HTML]bcf4bf | HeII+NIII | \cellcolor[HTML]bcf4bf AGN | |
| ZTF18aajupnt | \cellcolor[HTML] bcecf4 | \cellcolor[HTML]bcf4bf | \cellcolor[HTML] bcecf4 | \cellcolor[HTML]bcf4bf | \cellcolor[HTML] bcf4bf | \cellcolor[HTML] bcecf4 | \cellcolor[HTML]bcf4bf 3 | \cellcolor[HTML] bcecf4 | \cellcolor[HTML] bcecf4 | HeII | \cellcolor[HTML]bcf4bf AGN |
a. We select the less conservative color cut presented in Stern et al. (2012).
b. The single low level detection of ZTF19aailpwl occurred only once throughout the follow-up campaign and was not enough to take a reliable spectral measurement.
c. The host of PS16dtm displayed X-rays only prior to and following the fading of, but not for the duration of, the transient.
4.4 Physical Interpretation of the Transient Flares
In the following section we consolidate all that is known about the relevant properties of each object in the sample, and compare them with the related transients in NLSy1s in the literature, to explore each of the following scenarios: A PS16dtm-like TDE in a NLSy1, A Sharov-21-like microlensing event, a CSS100217-like SN in a NLSy1, and a binary SMBH scenario.
4.4.1 Association of the Transients with AGN
There is evidence that all sources in the sample are associated with AGN rather than distinct explosive events occurring in a normal galaxy. Although these outbursts may not necessarily be the result of an intrinsic enhancement in AGN accretion activity, transients with fast-rise/slow-decay (such as those in this sample, along with slow-rise/fast-decay, and symmetric light curve shapes) were well-represented in a sample of 51 AGN flares discovered in CRTS (Graham et al., 2017).
Rakshit et al. (2017) spectroscopically classified the SDSS spectrum of the host galaxy of ZTF19aailpwl as harboring an AGN NLSy1 years prior to the onset of the smoothly flaring transient reported here.
As evident in Figure 9, the strengths of the Balmer lines in the transient spectra are most consistent with that of a NLSy1. Ne V 3426, when observable, is typically associated with AGN, and is present in the spectra of these sources. Strong He II profiles, although somewhat rare in association with normal stochastic AGN variability (Neustadt et al., 2020), have been observed before and interpreted as the signature of a sudden enhancement of accretion (e.g. Trakhtenbrot et al. 2019a; Frederick et al. 2019).
Persistent X-rays are a likely signature of accretion onto a SMBH rather than a SN. A strong soft X-ray excess is characteristic of NLSy1s. However, it is typically accompanied by a hard X-ray continuum component (not present in either X-ray detected transient in this sample), and not nearly as ultra-soft as the X-rays seen in ZTF19aaiqmgl (), which are slopes more frequently observed in the X-ray spectra of TDEs.
4.4.2 The SN Scenario
It is highly improbable that these flares are the result of normal SN explosions. We observe long-lived -band emission in ZTF19aatubsj, persistent UV emission in all transients in the sample, and strong transient X-ray detections in ZTF19abvgxrq and ZTF19aaiqmgl. There is also only a small likelihood of a SN in the host galaxy along the line of sight unassociated with the AGN. The strongest evidence against the normal supernova scenario is the persistence of the He II emission features days after the onset of the flare — such flash ionization signatures are only visible in supernova spectra at very early times (e.g. Khazov et al. 2016; Bruch et al. 2020).
At least one of these transients (ZTF19aatubsj) shares a number of properties with CSS100217, which displayed soft X-rays and was interpreted as a SN IIn explosion in an AGN disk. The SN interpretation of CSS100217 was largely based on light curve energetics, which are similar to those of this sample. The color change, and the peak magnitude of are very similar in particular between CSS100217 and ZTF19aatubsj. Type IIn supernovae can exhibit strong Fe II lines in late spectra, such as ZTF19aatubsj did.
However, in contrast, the light curve evolution differs in that CSS100217 fades at least twice as quickly as ZTF19aatubsj. Also, the Fe II complex of CSS100217 was always visible throughout the flare, and Drake et al. (2011) observed a broad 3000 km s-1 component in H which got broader with time in subsequent follow-up spectra of CSS100217. Strong P Cygni profiles are observed in the optical spectra of SN, and from such profiles we would expect an absence of absorption on the blue end of the Balmer line profiles, rather than emission as in the spectra of ZTF19aaiqmgl and ZTF19aatubsj. Therefore, based on this evidence we rule out the SN Type IIn scenario.
4.4.3 The TDE Scenario
The Hills mass is the mass for which the tidal Roche radius is equivalent to the gravitational Schwarzschild radius of the black hole, beyond which a star (that would otherwise be tidally pulled apart) is instead left intact as it passes the event horizon (Hills, 1975). This maximum mass to tidally disrupt a solar-type star just outside the event horizon is . Therefore a SMBH mass significantly above this limit would likely rule out a TDE. Of the supermassive black hole masses derived for the host galaxies, only that of ZTF19aailpwl is inconsistent with a TDE scenario, (although we note that it is consistent within the typical uncertainty for such mass measurements). The range of absolute magnitudes of the flares in this sample ( mag) also tend to be intrinsically brighter at peak than all but one of the ZTF TDEs ( mag) reported in van Velzen et al. (2020a), AT2018iih ( mag).
Similar to TDEs PS16dtm and AT2018fyk, ZTF19aatubsj showed two distinct plateau stages on month-long timescales after fading, with some slight fading in between. Color evolution is rare but not unheard of for TDEs, and the cooling ZTF19aatubsj shows post-peak is slow, with the transient still detected in the UV at late times as would be expected for a TDE. Optical rebrightening following the intial flare has been interpreted as the result of late time disk formation in a number of TDEs (e.g. Wevers et al. 2019; van Velzen et al. 2019). However, rebrightening with high amplitudes returning nearly to pre-flare levels such as that seen in ZTF19abvgxrq and ZTF19aaiqmgl has neither been observed111111Except in the case of the periodicity of ASASSN 14ko, which was interpreted as a possible repeating partial TDE (Payne et al., 2020). nor predicted (e.g. Chan et al. 2019, 2020) from a TDE. In these cases with rebrightening, a TDE is strongly ruled out.
ZTF19aaiqmgl and ZTF19aatubsj, like AT2018fyk, only showed Fe II at certain times during the flare. ZTF19aaiqmgl only displayed Fe II during its first peak, and in ZTF19aatubsj, the Fe II complex got more visible as the transient faded. ZTF19aatubsj is the only transient in the sample with a lack of He II features in its spectra. Within the van Velzen et al. (2020b) spectral classification scheme for optical TDEs, ZTF19aatubsj would be a H-only TDE, with the Fe II complex attributed to the NLSy1 host. It is important to note that the transients with blue horn features in H, ZTF19aaiqmgl and ZTF19aatubsj, may be signatures of wind ejecta with a velocity distinct from the AGN.
Enhanced N III lines such as that seen in the NLSy1-HeII+NIII spectroscopic class (ZTF19abvgxrq, ZTF19aailpwl, and ZTF19aaiqmgl) are a prediction of TDEs in AGN when compared to the host spectrum (Kochanek, 2016; Liu et al., 2018b; Gallegos-Garcia et al., 2018). Unfortunately, a pre-flare spectrum was only available to test this for ZTF19aailpwl (Figure 6).
Many properties of the hosts do not align with what we expect from AGN. The WISE colors, for example, span a broad range of mag (Table 3). The IR flare associated with ZTF19aaiqmgl could be interpreted as a dust echo, similar to those seen in a number of TDEs (van Velzen et al., 2016). A host-subtracted SED fit to the Swift photometry of ZTF19aaiqmgl gives a blackbody temperature consistent with that of known TDEs, K.
The X-ray variability of TDEs can vary erratically during a flare (e.g. Wevers et al. 2019; van Velzen et al. 2020b). Although soft X-ray excesses with are characteristic of NLSy1s, ZTF19aaiqmgl displays an X-ray power law index much higher than typically seen in NLSy1s, and more characteristic of the extremely soft X-ray spectra observed in TDEs.
Based on the combination of properties shown in Table3, we conclude that two of the flares, ZTF18abjjkeo and ZTF19aatubsj, are better explained as TDEs than AGN flares, although the interpretation is not clear-cut. However, if we assume that their spectra are a combination of the host NLSy1 galaxy and the transient line emission from the TDE, then given their spectral classes given here of NLSy1-FeII and NLSy1-HeII, respectively, then the TDE spectra themselves, in these NLSy1 galaxies, would have to be of the TDE subclasses of TDE-H (H only lines) and TDE-He (He II only lines), respectively, in order to match the observed spectra.
4.4.4 The Extreme AGN Variability Scenario
Graham et al. (2017) presented a sample of quasars displaying extreme variability in CRTS. Some had similar profiles and amplitudes (rising by 22.5 mag) but longer timescales (500-1000 days) compared to the flares presented here, For example, J002748-055559 rose by nearly 2 mag compared to the steady level it maintained for several years prior.
The optical spectra of the transients in the sample presented here belonging to the “NLSy1-HeII+NIII” spectroscopic class, as well as the UV brightness of the sample, are consistent with the properties of the observational class of flares with Bowen fluorescence established in Trakhtenbrot et al. (2019b). However, all of the transients presented here have faster fading timescales than AT2017bgt. Trakhtenbrot et al. (2019b) stated that the fade timescale of AT2017bgt was longer than expected for a TDE. However, we note that at least one TDE in the van Velzen et al. (2020b) sample (that also displayed Bowen fluorescence features) was observed to fade over nearly 15 months,
4.4.5 The Gravitational Microlensing Scenario
Flares due to microlensing are expected to be observable in difference imaging surveys with the combined baseline of iPTF and ZTF. The rise portions of the light curve shapes of all the transients measured in Section 3.1.1 being well-fit by quadratics is consistent with a lensing event, however, all but ZTF18abjjkeo have a longer decay with respect to the initial rise. Microlensing by multiple foreground sources can give rise to a symmetric (with respect to the fade) double peak with a dip in the middle of the optical light curve such as that seen in ZTF19abvgxrq (Hawkins, 1998, 2004; Schmidt & Wambsganss, 2010). The cuspy shape of the first peak is also characteristic of microlensing light curves. ZTF19aaiqmgl also showed a second peak in its light curve, but the first peak was a lot more rapid and luminous than the second. To test this scenario in ZTF18abjjkeo would require continuing to observe for an additional flare.
The microlensing scenario, however, would not account for the strong transient Bowen fluorescence features that appear only at late times in ZTF19aaiqmgl, and only at early times in ZTF19abvgxrq (Figure 11). Meusinger et al. (2010) explained a similar event as a background quasar with a UV flare in J004457+4123, also known as Sharov 21, being microlensed by a foreground star in M31.
Microlensing is characteristically achromatic, and therefore would be ruled out by the clear evidence for color change observed in ZTF19aatubsj.
4.4.6 The SMBH Binary Scenario
Variability on the timescales of years due to a binary SMBHB system would require a subparsec separation (e.g. Graham et al. 2015). In such a system, two SMBHs induce tidal torques carving out a cavity in the circumbinary accretion disk, and may be surrounded by their own minidisks at sufficient separations. The interaction of accretion streams with the cavity could cause an outburst on the approximate timescales seen in this sample, which is dependent on the properties of the system. This phenomenon is seen in simulations of SMBH binaries (e.g. Ryan & MacFadyen 2017; Gold 2019).
We see evidence of offset narrow Balmer emission lines in the spectra of ZTF19aatubsj and ZTF19aaiqmgl, which may indicate a significant separate physical component, although it is unclear what is contributing to those blueshifted velocities.
5 Conclusions
We report five nuclear flaring events associated with NLSy1s, all serendipitously121212As the Trakhtenbrot et al. (2019a) observational class was established midway through the ZTF survey, we had not been systematically filtering such events when the population became apparent in the nuclear transients alert stream search. discovered in ZTF. We measured their photometric characteristics (such as light curve shape, color, and rise to peak luminosity, finding a correlation between rise time and absolute magnitude), and spectroscopic properties. We then established groupings of the objects in the sample based on analyses of the months-long follow-up campaigns of these objects. Based on observed groupings of the sample, we propose the following naming scheme of spectroscopic classes of such transients for use in future optical surveys: “NLSy1-HeII”, “NLSy1-HeII+NIII”, and “NLSy1-FeII”. We ruled out the possibility that these are Type IIn supernovae occurring in NLSy1 systems. Despite the heterogeneity of the sample’s properties, two of the flares presented in this work have multiwavelength characteristics which could be consistent with TDEs in NLSy1s (ZTF19aatubsj and ZTF18abjjkeo), with spectral classes of NLSy1-FeII and NLSy1-HeII, respectively. This is a high TDE rate relative to quiescent galaxies, which are more abundant than NLSy1s. The prevalence of TDE candidates in the NLSy1 AGN class could be a natural result of their hosting smaller black holes compared to typical broad-line AGN, and therefore satisfying the Hills mass criterion for an observable TDE. However, without pre-event spectra and X-ray imaging to isolate the contribution of the putative TDE to the composite NLSy1+TDE emission, flaring due to extreme AGN variability cannot be definitively ruled out. For two in the sample (ZTF19abvgxrq and ZTF19aaiqmgl), we can rule out the simple TDE scenario from rebrightening in their light curves, and we determine that they, along with ZTF19aailpwl (which had a pre-flare NLSy1 spectral classification and a black hole mass estimate too large to host a canonical TDE), are likely outbursts related to enhanced accretion in excess of typical AGN variability, and with spectral features we classify as “NLSy1-HeII+NIII”, and members of the Trakhtenbrot et al. (2019a) class of AGN flares.
Given this sample, together with the growing number of interesting rapid optical transients associated with NLSy1s we reviewed in the literature, we posed the question of why such environments are observed to preferentially host these outbursts. Given the relative fraction of NLSy1s found with respect to other AGN classes in spectroscopic surveys such as SDSS (15%; e.g. Zhou et al. 2006; Rakshit et al. 2017), there is likely an underlying factor enhancing this rate. We suggest four different possible explanations for this enhancement:
-
1.
A selection bias due to shorter timescales for lower mass BH systems (like NLSy1s), which are therefore more likely to be captured within the baseline of wide field optical surveys,
-
2.
A systematic disregard of smooth flares in broad line AGN during transient searches, or
-
3.
A true intrinsic rate enhancement due to instabilities causing rapid changes in the observable environments or accretion efficiencies of these systems.
Follow-up strategies of optical transients in AGN that are similarly ambiguous at early times may stand to benefit from the framework we offer here. We hope this classification scheme will guide real-time predictions for potential future behavior of large amplitude flares in NLSy1s, which are clearly an interesting population for future study. The next step will be to perform a systematic study of the variability of NLSy1s detected in ZTF, to assess the completeness and rate of this sample of transients with smoothly flaring light curves, and compare to a sample of broad-line AGN. Expanding on the small number of unusual transients associated with NLSy1s not only sheds light on the parameter space in which they reside, but also provides the framework for a decision tree for understanding such outbursts when they are inevitably captured at higher rates in upcoming wide field surveys. This will be imperative to establish in advance of larger and deeper surveys such as ZTF Phase II and the Vera C. Rubin Observatory (formerly known as LSST; Ivezić et al. 2019), to which the timescales of these flares are well-suited. Continued multiwavelength monitoring of the entire sample will be important to determine the host properties for those with sparse data prior to the transient, and for understanding the evolution and nature of these flares.
References
- Abolfathi et al. (2018) Abolfathi, B., Aguado, D. S., Aguilar, G., et al. 2018, ApJS, 235, 42, doi: 10.3847/1538-4365/aa9e8a
- Ai et al. (2010) Ai, Y. L., Yuan, W., Zhou, H. Y., et al. 2010, ApJ, 716, L31, doi: 10.1088/2041-8205/716/1/L31
- Arcavi et al. (2019) Arcavi, I., Trakhtenbrot, B., & Hiramatsu, D. 2019, Transient Name Server AstroNote, 4, 1
- Assef et al. (2013) Assef, R. J., Stern, D., Kochanek, C. S., et al. 2013, ApJ, 772, 26, doi: 10.1088/0004-637X/772/1/26
- Baldi et al. (2016) Baldi, R. D., Capetti, A., Robinson, A., Laor, A., & Behar, E. 2016, MNRAS, 458, L69, doi: 10.1093/mnrasl/slw019
- Barth et al. (2013) Barth, A. J., Pancoast, A., Bennert, V. N., et al. 2013, ApJ, 769, 128, doi: 10.1088/0004-637X/769/2/128
- Bellm et al. (2019a) Bellm, E. C., Kulkarni, S. R., Graham, M. J., et al. 2019a, PASP, 131, 018002, doi: 10.1088/1538-3873/aaecbe
- Bellm et al. (2019b) Bellm, E. C., Kulkarni, S. R., Barlow, T., et al. 2019b, Publications of the Astronomical Society of the Pacific, 131, 068003, doi: 10.1088/1538-3873/ab0c2a
- Bianchi et al. (2017) Bianchi, L., Shiao, B., & Thilker, D. 2017, ApJS, 230, 24, doi: 10.3847/1538-4365/aa7053
- Blagorodnova et al. (2018) Blagorodnova, N., Neill, J. D., Walters, R., et al. 2018, PASP, 130, 035003, doi: 10.1088/1538-3873/aaa53f
- Blagorodnova et al. (2019) Blagorodnova, N., Cenko, S. B., Kulkarni, S. R., et al. 2019, ApJ, 873, 92, doi: 10.3847/1538-4357/ab04b0
- Blanchard et al. (2017) Blanchard, P. K., Nicholl, M., Berger, E., et al. 2017, ApJ, 843, 106, doi: 10.3847/1538-4357/aa77f7
- Boller et al. (1996) Boller, T., Brandt, W. N., & Fink, H. 1996, A&A, 305, 53
- Bruch et al. (2020) Bruch, R. J., Gal-Yam, A., Schulze, S., et al. 2020, arXiv e-prints, arXiv:2008.09986. https://arxiv.org/abs/2008.09986
- Cappelluti et al. (2011) Cappelluti, N., Predehl, P., Böhringer, H., et al. 2011, Memorie della Societa Astronomica Italiana Supplementi, 17, 159. https://arxiv.org/abs/1004.5219
- Chambers et al. (2016) Chambers, K. C., Magnier, E. A., Metcalfe, N., et al. 2016, arXiv e-prints, arXiv:1612.05560. https://arxiv.org/abs/1612.05560
- Chan et al. (2020) Chan, C.-H., Piran, T., & Krolik, J. H. 2020, arXiv e-prints, arXiv:2004.06234. https://arxiv.org/abs/2004.06234
- Chan et al. (2019) Chan, C.-H., Piran, T., Krolik, J. H., & Saban, D. 2019, ApJ, 881, 113, doi: 10.3847/1538-4357/ab2b40
- Chen et al. (2017) Chen, P. S., Liu, J. Y., & Shan, H. G. 2017, New A, 54, 30, doi: 10.1016/j.newast.2017.01.005
- Decarli et al. (2008) Decarli, R., Labita, M., Treves, A., & Falomo, R. 2008, MNRAS, 387, 1237, doi: 10.1111/j.1365-2966.2008.13320.x
- Drake et al. (2009) Drake, A. J., Djorgovski, S. G., Mahabal, A., et al. 2009, ApJ, 696, 870, doi: 10.1088/0004-637X/696/1/870
- Drake et al. (2011) —. 2011, ApJ, 735, 106, doi: 10.1088/0004-637X/735/2/106
- Forster & Halpern (1996) Forster, K., & Halpern, J. P. 1996, ApJ, 468, 565, doi: 10.1086/177715
- Frederick et al. (2018) Frederick, S., Kara, E., Reynolds, C., Pinto, C., & Fabian, A. 2018, ApJ, 867, 67, doi: 10.3847/1538-4357/aae306
- Frederick et al. (2019) Frederick, S., Gezari, S., Graham, M. J., et al. 2019, ApJ, 883, 31, doi: 10.3847/1538-4357/ab3a38
- Gallegos-Garcia et al. (2018) Gallegos-Garcia, M., Law-Smith, J., & Ramirez-Ruiz, E. 2018, ApJ, 857, 109, doi: 10.3847/1538-4357/aab5b8
- Gallo (2006) Gallo, L. C. 2006, MNRAS, 368, 479, doi: 10.1111/j.1365-2966.2006.10137.x
- Gehrels et al. (2004) Gehrels, N., Chincarini, G., Giommi, P., et al. 2004, ApJ, 611, 1005, doi: 10.1086/422091
- Gezari et al. (2019) Gezari, S., van Velzen, S., Perley, D., et al. 2019, The Astronomer’s Telegram, 13127, 1
- Gezari et al. (2012) Gezari, S., Chornock, R., Rest, A., et al. 2012, Nature, 485, 217, doi: 10.1038/nature10990
- Gold (2019) Gold. 2019, Galaxies, 7, 63, doi: 10.3390/galaxies7020063
- Graham et al. (2017) Graham, M. J., Djorgovski, S. G., Drake, A. J., et al. 2017, MNRAS, 470, 4112, doi: 10.1093/mnras/stx1456
- Graham et al. (2015) Graham, M. J., Djorgovski, S. G., Stern, D., et al. 2015, MNRAS, 453, 1562, doi: 10.1093/mnras/stv1726
- Graham et al. (2019) Graham, M. J., Kulkarni, S. R., Bellm, E. C., et al. 2019, Publications of the Astronomical Society of the Pacific, 131, 078001, doi: 10.1088/1538-3873/ab006c
- Graham et al. (2020) Graham, M. J., Ross, N. P., Stern, D., et al. 2020, MNRAS, 491, 4925, doi: 10.1093/mnras/stz3244
- Gromadzki et al. (2019) Gromadzki, M., Hamanowicz, A., Wyrzykowski, L., et al. 2019, A&A, 622, L2, doi: 10.1051/0004-6361/201833682
- Grupe et al. (2010) Grupe, D., Komossa, S., Leighly, K. M., & Page, K. L. 2010, ApJS, 187, 64, doi: 10.1088/0067-0049/187/1/64
- Guainazzi et al. (1998) Guainazzi, M., Nicastro, F., Fiore, F., et al. 1998, MNRAS, 301, L1, doi: 10.1046/j.1365-8711.1998.02089.x
- Hawkins (1998) Hawkins, M. R. S. 1998, A&A, 340, L23. https://arxiv.org/abs/astro-ph/9810337
- Hawkins (2004) —. 2004, Baltic Astronomy, 13, 642
- Hills (1975) Hills, J. G. 1975, Nature, 254, 295, doi: 10.1038/254295a0
- Ivezić et al. (2019) Ivezić, Ž., Kahn, S. M., Tyson, J. A., et al. 2019, ApJ, 873, 111, doi: 10.3847/1538-4357/ab042c
- Jayasinghe et al. (2019) Jayasinghe, T., Stanek, K. Z., Kochanek, C. S., et al. 2019, MNRAS, 485, 961, doi: 10.1093/mnras/stz444
- Kara et al. (2019) Kara, E., Pasham, D., Gendreau, K., & Arzoumanian, Z. 2019, The Astronomer’s Telegram, 13132, 1
- Kasliwal et al. (2019) Kasliwal, M. M., Cannella, C., Bagdasaryan, A., et al. 2019, PASP, 131, 038003, doi: 10.1088/1538-3873/aafbc2
- Khazov et al. (2016) Khazov, D., Yaron, O., Gal-Yam, A., et al. 2016, ApJ, 818, 3, doi: 10.3847/0004-637X/818/1/3
- Kiewe et al. (2012) Kiewe, M., Gal-Yam, A., Arcavi, I., et al. 2012, ApJ, 744, 10, doi: 10.1088/0004-637X/744/1/10
- Klimek et al. (2004) Klimek, E. S., Gaskell, C. M., & Hedrick, C. H. 2004, ApJ, 609, 69, doi: 10.1086/420809
- Kochanek (2016) Kochanek, C. S. 2016, MNRAS, 458, 127, doi: 10.1093/mnras/stw267
- LaMassa et al. (2015) LaMassa, S. M., Cales, S., Moran, E. C., et al. 2015, ApJ, 800, 144, doi: 10.1088/0004-637X/800/2/144
- Lawrence et al. (2012) Lawrence, A., Gezari, S., Elvis, M., et al. 2012, EPJ Web of Conferences, 39, doi: 10.1051/epjconf/20123903002
- Liu et al. (2018a) Liu, H.-Y., Yuan, W., Dong, X.-B., Zhou, H., & Liu, W.-J. 2018a, ApJS, 235, 40, doi: 10.3847/1538-4365/aab88e
- Liu et al. (2018b) Liu, X., Dittmann, A., Shen, Y., & Jiang, L. 2018b, ApJ, 859, 8, doi: 10.3847/1538-4357/aabb04
- Liu et al. (2020) Liu, Z., Li, D., Liu, H.-Y., et al. 2020, ApJ, 894, 93, doi: 10.3847/1538-4357/ab880f
- Lunnan et al. (2019) Lunnan, R., Yan, L., Perley, D. A., et al. 2019, arXiv e-prints, arXiv:1910.02968. https://arxiv.org/abs/1910.02968
- MacLeod et al. (2016) MacLeod, C. L., Ross, N. P., Lawrence, A., et al. 2016, MNRAS, 457, 389, doi: 10.1093/mnras/stv2997
- Malyali et al. (2020) Malyali, A., Rau, A., Arcodia, R., et al. 2020, The Astronomer’s Telegram, 13712, 1
- Marconi et al. (2008) Marconi, A., Axon, D. J., Maiolino, R., et al. 2008, ApJ, 678, 693, doi: 10.1086/529360
- Masci et al. (2019) Masci, F. J., Laher, R. R., Rusholme, B., et al. 2019, PASP, 131, 018003, doi: 10.1088/1538-3873/aae8ac
- Mathur et al. (2019) Mathur, S., Auchettl, K., Kochanek, C. S., et al. 2019, The Astronomer’s Telegram, 13213, 1
- Mathur et al. (2001) Mathur, S., Kuraszkiewicz, J., & Czerny, B. 2001, New A, 6, 321, doi: 10.1016/S1384-1076(01)00058-6
- McLure & Dunlop (2002) McLure, R. J., & Dunlop, J. S. 2002, MNRAS, 331, 795, doi: 10.1046/j.1365-8711.2002.05236.x
- Merloni et al. (2015) Merloni, A., Dwelly, T., Salvato, M., et al. 2015, MNRAS, 452, 69, doi: 10.1093/mnras/stv1095
- Meusinger et al. (2010) Meusinger, H., Henze, M., Birkle, K., et al. 2010, A&A, 512, A1, doi: 10.1051/0004-6361/200913526
- Miller et al. (2000) Miller, H. R., Ferrara, E. C., McFarland, J. P., et al. 2000, New A Rev., 44, 539, doi: 10.1016/S1387-6473(00)00094-4
- Miller et al. (2019) Miller, J. M., Zoghbi, A., Reynolds, M., et al. 2019, The Astronomer’s Telegram, 13163, 1
- Molthagen et al. (1998) Molthagen, K., Bade, N., & Wendker, H. J. 1998, A&A, 331, 925
- Moriya et al. (2018) Moriya, T. J., Sorokina, E. I., & Chevalier, R. A. 2018, Space Sci. Rev., 214, 59, doi: 10.1007/s11214-018-0493-6
- Neustadt et al. (2020) Neustadt, J. M. M., Holoien, T. W. S., Kochanek, C. S., et al. 2020, MNRAS, 494, 2538, doi: 10.1093/mnras/staa859
- Nikołajuk et al. (2009) Nikołajuk, M., Czerny, B., & Gurynowicz, P. 2009, MNRAS, 394, 2141, doi: 10.1111/j.1365-2966.2009.14478.x
- Nordin et al. (2019) Nordin, J., Brinnel, V., van Santen, J., et al. 2019, A&A, 631, A147, doi: 10.1051/0004-6361/201935634
- Pasham et al. (2020) Pasham, D., Gendreau, K., Arzoumanian, Z., et al. 2020, The Astronomer’s Telegram, 14036, 1
- Patterson et al. (2019) Patterson, M. T., Bellm, E. C., Rusholme, B., et al. 2019, PASP, 131, 018001, doi: 10.1088/1538-3873/aae904
- Payne et al. (2020) Payne, A. V., Shappee, B. J., Hinkle, J. T., et al. 2020, arXiv e-prints, arXiv:2009.03321. https://arxiv.org/abs/2009.03321
- Pogge (2000) Pogge, R. W. 2000, New A Rev., 44, 381, doi: 10.1016/S1387-6473(00)00065-8
- Pounds et al. (1995) Pounds, K. A., Done, C., & Osborne, J. P. 1995, MNRAS, 277, L5, doi: 10.1093/mnras/277.1.L5
- Rafter et al. (2013) Rafter, S. E., Kaspi, S., Chelouche, D., et al. 2013, ApJ, 773, 24, doi: 10.1088/0004-637X/773/1/24
- Rakshit et al. (2017) Rakshit, S., Stalin, C. S., Chand, H., & Zhang, X.-G. 2017, The Astrophysical Journal Supplement Series, 229, 39, doi: 10.3847/1538-4365/aa6971
- Rigault et al. (2019) Rigault, M., Neill, J. D., Blagorodnova, N., et al. 2019, A&A, 627, A115, doi: 10.1051/0004-6361/201935344
- Ross et al. (2018) Ross, N. P., Ford, K. E. S., Graham, M., et al. 2018, MNRAS, 480, 4468, doi: 10.1093/mnras/sty2002
- Ruan et al. (2016) Ruan, J. J., Anderson, S. F., Cales, S. L., et al. 2016, ApJ, 826, 188, doi: 10.3847/0004-637X/826/2/188
- Runnoe et al. (2016) Runnoe, J. C., Cales, S., Ruan, J. J., et al. 2016, MNRAS, 455, 1691, doi: 10.1093/mnras/stv2385
- Ryan & MacFadyen (2017) Ryan, G., & MacFadyen, A. 2017, ApJ, 835, 199, doi: 10.3847/1538-4357/835/2/199
- Saxton et al. (2018) Saxton, C. J., Perets, H. B., & Baskin, A. 2018, MNRAS, 474, 3307, doi: 10.1093/mnras/stx2928
- Schmidt & Wambsganss (2010) Schmidt, R. W., & Wambsganss, J. 2010, General Relativity and Gravitation, 42, 2127, doi: 10.1007/s10714-010-0956-x
- Shen et al. (2011) Shen, Y., Richards, G. T., Strauss, M. A., et al. 2011, ApJS, 194, 45, doi: 10.1088/0067-0049/194/2/45
- Smartt et al. (2019) Smartt, S. J., Smith, K. W., McBrien, O., et al. 2019, Transient Name Server AstroNote, 33, 1
- Sollerman et al. (2019) Sollerman, J., Taddia, F., Arcavi, I., et al. 2019, A&A, 621, A30, doi: 10.1051/0004-6361/201833689
- Sollerman et al. (2020) Sollerman, J., Fransson, C., Barbarino, C., et al. 2020, arXiv e-prints, arXiv:2009.04154. https://arxiv.org/abs/2009.04154
- Soumagnac & Ofek (2018) Soumagnac, M. T., & Ofek, E. O. 2018, PASP, 130, 075002, doi: 10.1088/1538-3873/aac410
- Stein et al. (2020) Stein, R., van Velzen, S., Kowalski, M., et al. 2020, arXiv e-prints, arXiv:2005.05340. https://arxiv.org/abs/2005.05340
- Stern et al. (2012) Stern, D., Assef, R. J., Benford, D. J., et al. 2012, ApJ, 753, 30, doi: 10.1088/0004-637X/753/1/30
- Stern et al. (2018) Stern, D., McKernan, B., Graham, M. J., et al. 2018, ApJ, 864, 27, doi: 10.3847/1538-4357/aac726
- Tadhunter et al. (2017) Tadhunter, C., Spence, R., Rose, M., Mullaney, J., & Crowther, P. 2017, Nature Astronomy, 1, 0061, doi: 10.1038/s41550-017-0061
- Tananbaum et al. (1979) Tananbaum, H., Avni, Y., Branduardi, G., et al. 1979, ApJ, 234, L9, doi: 10.1086/183100
- Terlevich et al. (1992) Terlevich, R., Tenorio-Tagle, G., Franco, J., & Melnick, J. 1992, MNRAS, 255, 713, doi: 10.1093/mnras/255.4.713
- Trakhtenbrot et al. (2020) Trakhtenbrot, B., Arcavi, I., Ricci, C., & Burke, J. 2020, Transient Name Server AstroNote, 105, 1
- Trakhtenbrot et al. (2019a) Trakhtenbrot, B., Arcavi, I., Ricci, C., et al. 2019a, Nature Astronomy, 3, 242, doi: 10.1038/s41550-018-0661-3
- Trakhtenbrot et al. (2019b) Trakhtenbrot, B., Arcavi, I., MacLeod, C. L., et al. 2019b, arXiv e-prints, arXiv:1903.11084. https://arxiv.org/abs/1903.11084
- Uttley et al. (1999) Uttley, P., McHardy, I. M., Papadakis, I. E., Guainazzi, M., & Fruscione, A. 1999, MNRAS, 307, L6, doi: 10.1046/j.1365-8711.1999.02801.x
- van Velzen et al. (2020a) van Velzen, S., Holoien, T. W. S., Onori, F., Hung, T., & Arcavi, I. 2020a, arXiv e-prints, arXiv:2008.05461. https://arxiv.org/abs/2008.05461
- van Velzen et al. (2016) van Velzen, S., Mendez, A. J., Krolik, J. H., & Gorjian, V. 2016, ApJ, 829, 19, doi: 10.3847/0004-637X/829/1/19
- van Velzen et al. (2019) van Velzen, S., Gezari, S., Cenko, S. B., et al. 2019, ApJ, 872, 198, doi: 10.3847/1538-4357/aafe0c
- van Velzen et al. (2020b) van Velzen, S., Gezari, S., Hammerstein, E., et al. 2020b, arXiv e-prints, arXiv:2001.01409. https://arxiv.org/abs/2001.01409
- Wang et al. (1996) Wang, T., Brinkmann, W., & Bergeron, J. 1996, A&A, 309, 81
- Wevers et al. (2019) Wevers, T., Pasham, D. R., van Velzen, S., et al. 2019, MNRAS, 488, 4816, doi: 10.1093/mnras/stz1976
- Xu et al. (2012) Xu, D., Komossa, S., Zhou, H., et al. 2012, AJ, 143, 83, doi: 10.1088/0004-6256/143/4/83
- Yan et al. (2019) Yan, L., Wang, T., Jiang, N., et al. 2019, ApJ, 874, 44, doi: 10.3847/1538-4357/ab074b
- Yan et al. (2020) Yan, L., Perley, D., Schulze, S., et al. 2020, arXiv e-prints, arXiv:2006.13758. https://arxiv.org/abs/2006.13758
- Zhou et al. (2006) Zhou, H., Wang, T., Yuan, W., et al. 2006, ApJS, 166, 128, doi: 10.1086/504869
The light curves in Figure 10 are from the second IPAC data release of ZTF forced photometry. Figure 11 shows the region of interest around He II, H+[O III], and the Fe II complex for all follow-up spectra taken of the sample.