[https://www.acsac.org/2020/submissions/papers/artifacts/]artifacts˙evaluated˙reusable˙v1˙1
SAIBERSOC: Synthetic Attack Injection to Benchmark and Evaluate the Performance of Security Operation Centers
Abstract.
In this paper we introduce SAIBERSOC, a tool and methodology enabling security researchers and operators to evaluate the performance of deployed and operational Security Operation Centers (SOCs) (or any other security monitoring infrastructure). The methodology relies on the MITRE ATT&CK Framework to define a procedure to generate and automatically inject synthetic attacks in an operational SOC to evaluate any output metric of interest (e.g., detection accuracy, time-to-investigation, etc.). To evaluate the effectiveness of the proposed methodology, we devise an experiment with students playing the role of SOC analysts. The experiment relies on a real SOC infrastructure and assigns students to either a BADSOC or a GOODSOC experimental condition. Our results show that the proposed methodology is effective in identifying variations in SOC performance caused by (minimal) changes in SOC configuration. We release the SAIBERSOC tool implementation as free and open source software.
1. Introduction
The growing importance of effective security monitoring solutions calls for appropriate measures of their effectiveness. The operation of Security Operation Centers (SOCs) is the recommended best practice to which large and medium-size enterprises rely for the detection, notification, and ultimately response to cybersecurity incidents (Kokulu et al., 2019; Muniz et al., 2015). Yet, the average time for detecting an attack ranges between several weeks to years (Verizon Enterprise Solutions, 2018). In a recent study, Kokulu et al. (Kokulu et al., 2019) interviewed security analysts and mangers, who explicitly identify the issue of measuring SOC performance as one of the main obstacles towards effective detection and response operations.
The problem of measuring security (performance) is a long-standing and difficult one (Herley and van Oorschot, 2017).
Measuring the performance of SOCs is no exception. Whereas numerous performance metrics exist (e.g., number of detected incidents, time to detection, time to response, etc.) (Shah et al., 2018b), it is still unclear how to obtain reliable and reproducible measures over those metrics. As incoming attacks are, by definition, unknown, a ground truth on which to base the measurements cannot be easily defined; on the other hand, performing measurements in in-vitro settings limits the representativeness of those measurements in real-world settings (Shah et al., 2018a; Kokulu et al., 2019).
However, the problem of measuring the performance of infrastructures and systems dedicated to the detection of rare events of unknown magnitude is not new. For example, the LIGO (Laser Interferometer Gravitational-Wave Observatory) infrastructure has been built with the goal of detecting perturbations in the spacetime continuum caused by ‘rippling effects’ of large-scale events, such as the collapse of a binary blackhole system. Despite the completely different settings and event generation processes, the challenges faced by the LIGO interferometer and SOCs are quite similar: both must detect unknown, unpredictable, and arbitrarily ‘small’ manifestations of an event, and both must know whether the detection procedure is accurate while operating in the absence of a ground-truth on the events that ought be detected.
This paper presents SAIBERSOC, a practical and deployable solution for SOC performance evaluation based on the same working principle as the LIGO infrastructure (Abadie et al., 2010): to generate and automatically inject ‘events’ (in our case, cyber-attacks) into the detection infrastructure at random instants in time, with the purpose of evaluating, in a controlled fashion, the performance of the detection system. The SAIBERSOC methodology and tool can be employed by researchers and security operatives alike to evaluate the impact of various factors on SOC performance, such as analyst training, experience , and skill composition, or the relative change in effectiveness of the deployed analysis and visualization tools as the SOC configuration and processes change.
SAIBERSOC automatically generates the injected attacks relying on the MITRE ATT&CK Framework(The MITRE Corporation, [n.d.]) and is structured over four components providing automated methods for attack definition, generation, injection, and analysis. The SAIBERSOC tool is publicly available as free and open source software (see subsection 6.1).
To evaluate the effectiveness of the method at the core of SAIBERSOC, we design and run an experiment employing students enrolled in a security course of a medium-sized technical university in Europe. The experiment relies on a real SOC infrastructure (normally monitoring network events at the M&CS department of the university) where students operate as SOC analysts. In particular, we measure detection accuracy in terms of both attack identification and investigation, injecting two attacks based on the Mirai (Antonakakis et al., 2017) and Exim (Common Vulnerabilities and Exposures (CVE) Database, 2018) scenarios over two SOC configurations (BADSOC and GOODSOC). Our evaluation shows that the SAIBERSOC methodology correctly identifies and can quantify the relative change in detection accuracy across SOC configurations and, importantly, does not ‘overshoot’ or reveal differences where there should be none.
This paper develops as follows: Section 2 provides a background on SOC operations and discusses relevant literature. Section 3 describes the proposed methodology and section 4 the experimental validation strategy. Experimental results follow in section 5. Section 6 discusses our results and presents the SAIBERSOC software implementation in detail. Finally, section 7 concludes the paper.
2. Background and Related Work
2.1. Attack frameworks
Defensive operations against increasingly sophisticated attacks require a deep understanding of how adversaries conduct offensive operations, how threats unfold and how security breaches escalate into major incidents. The MITRE PRE-ATT&CK(Corporation, [n.d.]), MITRE ATT&CK (The MITRE Corporation, [n.d.]), and Cyber Kill Chain(Lockheed Martin Corporation, [n.d.]) frameworks aim at building a knowledge base of adversary TTPs (Tactics, Techniques, and Procedures) from real-world observations, grouping them in a taxonomy of attack stages to describe the anatomy of any attack. The extensive and detailed enumeration of the attack techniques provided by the frameworks and stages can be, roughly, grouped in four phases: Reconnaissance, Exploitation, Delivery and Control (Table 1). Reconnaissance groups data gathering operations performed by the adversary, ranging from subject information for the development of social engineering attacks, to probing the network surface of the infrastructure to derive paths of compromise. During Exploitation, the attacker evaluates the measured attack surface (vulnerabilities, misconfigured software, phishing opportunities) and creates or acquires the attacks (vulnerability exploits, phishing artefacts, malware, …) to perform information leak, lateral movement (e.g., inside the organization), command execution, and/or privilege escalation. Delivery covers the vectors adopted from the adversary to drop malicious software that will act as a foothold for further actions. This includes spear phishing and supply chain compromise. Control includes the techniques adopted by the adversary to control the system and reliably execute commands on it, compromising system integrity, confidentiality and availability. This can be achieved via remote management interfaces, custom software and web services.
Overview of the four phases ‘Reconnaissance’, ‘Exploitation’, ‘Delivery’, and ‘Control’ Phase Description Reconnaissance Techniques to research, identify and select targets using active or passive reconnaissance. Exploitation Techniques employed by attackers to gain initial control over (vulnerable) target systems. Delivery Techniques resulting in the transmission of the weaponized object to the targeted environment. Control Techniques used by attackers to communicate with controlled systems in a target network.
2.2. Security monitoring operations
Tools and procedure to support security analysts in incident response and network monitoring (such as Network Intrusion Detection Systems (NIDS) and Security Information and Event Management (SIEM)) are at the core of modern security monitoring in operational settings. Security Operation Centers (SOCs) are the center of monitoring operations in medium or large organizations, either internally or outsourced to service providers (Muniz et al., 2015; Kokulu et al., 2019).
SOCs are organized hierarchically in (generally three) tiers (Muniz et al., 2015), where analysts with different skills and expertise monitor the network activity and take action against a threat. Tier 1 is the first frontier where alerts are investigated by analysts, identifying possible threats among the non-significant ones and prioritizing them. Identified threats are escalated to Tier 2, where more qualified analysts with forensics and incident response skills correlate the information with threat intelligence to identify threat actors. Tier 2 is in charge to determine a strategy for containment, remediation and recovery. If the threat targets business critical operations, Tier 3 analysts identify and develop tailored responses to the identified threats and attack patterns.
In general, incident investigation can be split in two phases (Muniz et al., 2015): Attack identification, where Tier 1 analysts evaluate incoming alerts to identify possible attacks; Attack investigation, where Tier 1 and Tier 2 analysts investigate the identified attack over its phases (ref. Table 1) to, for example, identify victims, attack timing, payloads, and propagation. Once these two phases are complete, the attack is reported and responded to, depending on the service level agreement at which the SOC operates.
The large amount of alerts and potential security events detected in a SOCs make it impossible, operationally to ‘investigate everything’ (Shah et al., 2018b): the more relevant are the alerts generated by a SOC (e.g., through accurate use-cases), the fewer ‘false positives’ a (Tier 1) analyst will have to investigate before passing the baton on to higher tiers (i.e., Tier 2 and 3).
However, measuring how SOC operations respond to changes in the SOC configuration (e.g., a refined use-case, a different alert investigation process, new rulesets, etc.) remains an open and critical challenge (Kokulu et al., 2019), in terms of analyst competences as well as for metric definition and measurement (Shah et al., 2018b, a; Zimmerman, 2014; Ganesan et al., 2017).
2.3. SOC performance evaluation
Albeit attempts have been made in trying to tackle these problems, the scientific literature proposing methods to measure SOC performance is still limited. Effectiveness of a SOC depends on both the qualities of the tools adopted, their configurations and capabilities, and on skills of the personnel. For what concerns the correlation between human capabilities and a SOC’s performance, a few studies have been made(Sundaramurthy et al., 2016, 2014). In (Sundaramurthy et al., 2014), Sundaramurthy et al., they trained three students to work as SOC analysts and embedded them in three different SOCs. While working as operational components, they were required to produce reports on their observations and meet with an anthropologist involved in the research. By comparing reports and interviews, is was possible to draw conclusions on the aspects that may be more promising to the effectiveness of a SOC and which not, in terms of its architecture, experience of analysts, nature and degree of their interactions, workflow for incident reports and the quality of work itself for the employee. Kokulu et al. (Kokulu et al., 2019) investigate through interviews to both SOC analysts and SOC managers about technical and non-technical issues of a SOC; from their interviews emerge how often SOCs fail to provide substantial support against specific types of attacks, overloading analysts with low-quality threat intelligence, long reports and logs, and more. Albeit evidences are supported by interviews, the authors point out that metrics to measure security quantitatively and qualitatively are rudimentary (Kokulu et al., 2019). Jacobs et al. (Jacobs, 2014) propose a method to systematically and quantitatively evaluate SOC’s maturity by identifying a set of capabilities that a SOC embodies, i.e. log analysis, event correlation, incident management, threat identification and reporting, scoring each of them (Jacobs et al., 2013) (Jacobs, 2014). The SOC aspects analyzed derive from a number of industrial security management and control frameworks, including ISO 27000 series (ISO, 2013) and SANS Critical Controls and each of them is scored with respect to their maturity; however, the score attribution is left as an expert-driven task, rather than a data-driven measurement. A simulation-optimization approach is proposed by Shah et al. (Shah et al., 2018a), where they identified some of the causes that negatively affect the throughput of a SOC in terms of efficiency. They propose the Time to Analyze Alert (TTA) metric to evaluate the efficiency of a SOC by measuring the time that goes from the alert generation to its analysis. By monitoring SOC’s TTA, Shah et al. are able to generate advice for the SOC Manager, suggesting live corrective actions towards a desired benchmark. In subsequent work Shah et al.(Shah et al., 2018b) also model the problem as a simulation-optimization problem and evaluated it from data derived from a simulated SOC, to obtain a set of metrics that allow the optimization of some of a SOC capabilities; however, a procedure to test the resulting SOC performance in real-world scenarios remains to be identified and tested.
Research gap. Whereas current research has focused mostly on the identification of metrics (Shah et al., 2018b) and procedures (Jacobs, 2014; Shah et al., 2018a, b) to evaluate SOC performance, an empirical method capable of capturing the complexity of a SOC operation (including alert configuration, analyst capabilities, etc.) has yet to be proposed and validated (Kokulu et al., 2019).
3. The SAIBERSOC solution
To address this gap, we propose SAIBERSOC, a method and solution to perform systematic SOC performance evaluations through automated attack injection. Our solution is composed of four Architectural Components (AC-{1..4}) constituting of a library of (attack) traces (AC-1), and components to generate (AC-2), inject (AC-3), and report (AC-4) the synthetic attacks.
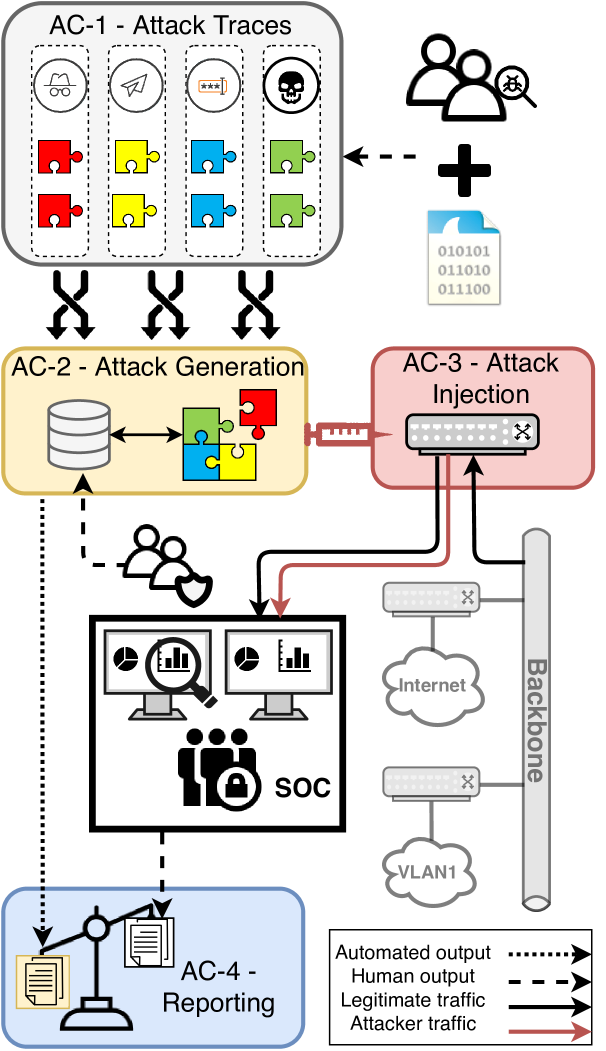
The platform uses (network) traces characterizing the ‘building blocks’ of an attack (AC-1), and (re-)combines them to generate new attacks (AC-2). The generated attacks are then injected into the network (AC-3). The SOC analysts perform and report on the investigation results, which can be checked (AC-4) against the known ground-truth (derived from the attacks generated in AC-2).
[Schematic overview of how the four components interact in relation to the Security Operations Center.]Component ‘AC-1 Attack Traces’ is a library of network traffic captures maintained by experts. In component ‘AC-2 Attack Generation’ the network traces get merged. Experts monitor and supervise rules for merging network traces to ensure that the output is a realistic attack. The output of this component is the assembled attack ready to be replayed on the network, as well as a ground-truth that describes the assembled attack. In phase ‘AC-3 Attack Injection’ the assembled attack is injected somewhere into a network monitored by the Security Operations Center. The Security Operations Center, unable to distinguish injected attack simulation traffic from regular network traffic, will investigate and report on the injected attack. In component ‘AC-4 Reporting’ the report generated by an analyst in the Security Operations Center is compared to the automatically generated ground truth from ‘AC-2 Attack Generation’.
SAIBERSOC can be used to inject attacks into a SOC during operation, or alternatively in a ‘virtual’ SOC testing environment where all network traffic is replaced by pre-recorded background traffic. Once the attack has been detected, the SOC analysts perform the investigation following their normal procedure. The type of injected attack as well as its timing, targets and sources, and velocity are unknown to the SOC analysts. Finally, the analyst’s attack report is automatically
evaluated against the ground truth obtained from the attack assembly phase. A more detailed description of the SAIBERSOC architecture can be found in subsection 3.2, we present our software implementation in subsection 6.1.
3.1. Solution requirements
To guide the development of the proposed solution, we pose a list of requirements that a real-world SOC performance evaluation framework should fulfill. A summary of the identified requirements is provided in Table 2.
[Mapping between requirements ‘R’ and architectural components ‘AC’ that must meet the respective requirement.]Architectural components ‘AC-1’, ‘AC-2’, and ‘AC-4’ must fulfill requirement ‘R-1 Independence’ (the proposed solution should be independent of the specific SOC implementation and monitored environment). Architectural components ‘AC-1’ and ‘AC-2’ must fulfill requirement ‘R-2 Versatility’ (the framework must work with all types of attack scenarios in scope of the SOC, regardless of their complexity). Architectural components ‘AC-2’ and ‘AC-3’ must fulfill requirement ‘R-3 Realism’ (the attack injection must be seamlessly integrated to the operative environment of the analyst. This includes IP addresses, local software configurations, and network setups). Architectural components ‘AC-2’ and ‘AC-4’ must fulfill requirement ‘R-4 Tracability’ (the framework must be able to link all SOC reactions i.e., a report to the initial stimulus or attack that caused it.). R-ID Requirement Description AC-1 AC-2 AC-3 AC-4 R-1 Independence The proposed solution should be independent of the specific SOC implementation and monitored environment. ✓ ✓ ✓ R-2 Versatility The framework must work with all types of attack scenarios in scope of the SOC, regardless of their complexity. ✓ ✓ R-3 Realism The attack injection must be seamlessly integrated to the operative environment of the analyst. This includes IP addresses, local software configurations, and network setups. ✓ ✓ R-4 Traceability The framework must be able to link all SOC reactions (i.e., a report) to the initial stimulus or attack that caused it. ✓ ✓
Independence (R-1) To measure and compare SOC performance, the framework must apply to all SOCs, regardless of how they are implemented. Further, the results must be reproducible, regardless of who uses the framework. Those are fundamental requirements for any measure or assessment (Pfleeger and Cunningham, 2010). Therefore, a solution must be able to work with various SOC configurations and implementations.
Versatility (R-2) To be able to create meaningful measures covering the whole scope of the SOC, all aspects of a potential attack must be covered. Thus, a metric should cover the complete value-space to assure meaningful results reflecting real-world performance (Kokulu et al., 2019). Because attackers continuously adapt their behavior, a solution must be capable to simulate past, current, as well as future attacks in realistic ways to be able to measure real-world security.
Realism (R-3) Real-world security is influenced by numerous factors, sometimes in unpredictable ways. For example, wrong presumptions about context or human behavior in unforeseen situations leads to alleged security measures and therefore a false sense of security(Chiasson and van Oorschot, 2015; Adams and Blandford, 2005). This can be avoided by assessing real-world performance, i.e., a setup that is as close as possible) to reality. In case of a SOC this means measuring a real SOC (including software and configuration), realistic work environments, and realistic attacks. It is therefore imperative that the evaluation is performed under real or realistic operational conditions (e.g., the analysts do not know the attacks in advance, and the injected attacks are realistic).
Traceability (R-4) The framework must be able to link SOC reactions i.e., reports, to the attacks that caused those reactions in the SOC. Only if both input and output are known, a meaningful evaluation of the SOC performance can be made by comparing the expected output to the realized output.
3.2. The SAIBERSOC solution architecture
Figure 1 provides a schematic depiction of the architecture behind the proposed SAIBERSOC solution. Table 2 reports the mapping of the architectural components to the identified requirements. A running example of implementation of the proposed workflow is reported in Table 8 in the appendix and discussed below.
3.2.1. Attack Traces (AC-1)
All attack simulations or scenarios deployed in SAIBERSOC are constructed by combining multiple pre-defined attack traces. An attack trace consists of a set of network packets (e.g., stored in a pcap file) that reproduces the network traffic generated by an attack during a specific attack phase. These traces can be extended to non-network events (e.g., syslog activity to reproduce events at the host level). To structure traces in attack phases, we rely on the ATT&CK Framework(The MITRE Corporation, [n.d.]) to create and store a library of different attack traces reflecting different phases of ongoing attacks (see Table 1).
The MITRE CALDERA(Miller et al., 2018) and Atomic Red Team(Red Canary, [n.d.]) already maintain some form of an attack-database with attacker actions mapped to the ATT&CK Framework(The MITRE Corporation, [n.d.]).
Impl. example:
with reference to the example reported in Table 8, AC-1 generates a set of traces characterizing events in each phase of the ATT&CK framework; for example, portscan(src_ip, dst_ip) will reproduce network traffic (to be parameterized with src_ip, dst_ip associated to the Reconnaissance phase of the MITRE ATT&CK framework (ref. Table 1). Similarly, expl_cve() will reproduce traces corresponding to the exploitation of a known vulnerability (e.g., as derived from an exploit on ExploitDB (OffSec Services Limited, [n.d.]).
3.2.2. Attack Generation (AC-2)
Multiple attack traces are combined to generate fully-fledged attack simulations. Attacks are composed following the ATT&CK framework(The MITRE Corporation, [n.d.]) (i.e., reconnaissance happens before exploit delivery, which happens before command and control communication, which happens before data exfiltration).
The CALDERA framework is already capable of automatically generating meaningful attacks from attack traces(Miller et al., 2018).
In this step, the generic attack traces are matched to the specific environment monitored by the SOC (e.g., IP ranges, exploits vs vulnerable systems, etc.). This process can be automated by relying on asset information available to any SOC during normal operation.
The result of this phase is a ready-to-inject attack simulation.
The ‘ground-truth’ of the simulation (e.g., attacker’s IP addresses(es)) can be extracted from the parameterized attack traces composing the attack. Once re-parameterized (i.e., victim IP addresses matching the range of a monitored network and system functionality), attack scenarios can be reused the SOC or organization’s network.
Impl. example:
with reference to Table 8, a sequence of (attack) traces is selected and parameterized. In this example, the IP of the attacker and the receiving victim system(s) are identified (src_ip,dst_ip), as well as the exploited vulnerability (cve), and protocols used for the command and control (proto). The parametrized attack traces are then composed following the MITRE ATT&CK framework phases; the parameters of the attack are used to generate the ground truth against which the analysts’ reports will be checked in AC-4.
3.2.3. Attack Injection (AC-3)
Attack simulations retrieved from AC-2 are injected in the network traffic monitored by the SOC. This can be either executed on the live infrastructure, or on a virtual ‘shadow network’ separate from the operative environment. In the latter setting, the entire (virtual) network traffic is recorded and later forwarded to the Network Intrusion Detection sensors employed by the SOC. The attack simulation can be merged seamlessly into (real-world) traffic streams either on a SOC sensor or on network infrastructure devices (i.e., network switches or routers). To make simulations as realistic as possible, (optional) background traffic that was previously recorded on site can be mixed with the attack simulation. Attack simulations can be injected, recorded, and replayed at any point in time (i.e., record network traffic from virtual environment instead of passing to the SOC immediately). The SOC will then raise the respective events and alerts as if the injected traffic was real traffic to (or from) the monitored infrastructure.
Impl. example:
In the example in Table 8 traffic is recorded and replayed into a SOC sensor as scheduled by executing the parametrized traces (e.g., exploit_cve(cve,src_ip,dst_ip)) (i.e., 12pm). The attack injection raises corresponding SOC alerts, then evaluated by the analyst during incident identification and investigation.
3.2.4. Reporting (AC-4)
The attack reports produced by SOC analysts in response to the attack simulation are matched against the ground truth (obtained from AC-2) in AC-4. Because the exact details of the simulated attacks are known in advance, report(s) that mention specific details unique to the injected attack can be identified automatically. Using simple string matching and the knowledge-base of the SIEM, it is possible to check whether the final SOC report details the incident events and sources correctly.
Impl. example:
A SOC analyst investigated the generated SOC alerts and reported the incident through a standardized template (e.g., src_ip, cve, …). Comparing the analyst report with the ground truth may indicate that the current SOC configuration lacks detection capabilities (e.g., undetected exploitation), or that raised alerts systematically misdirect the analyst (e.g., due to poorly defined threats or use cases).
4. Experimental validation
Before presenting the SAIBERSOC tool implementing the described architecture and solution, we validate the methodology behind it by testing it experimentally. To do so, we devise an experiment involving MSc students attending the ’Security in Organizations’ course of a medium-sized European Technical University and an operative SOC infrastructure deployed at the Department level.
Goal of the experiment: to evaluate whether the proposed solution is capable of detecting (small) differences in SOC performance.
Experimental subjects worked in groups of two and took the role of Tier 1 security analysts to investigate (injected) attacks. Subjects were randomly assigned to the experimental treatment (consisting in a small tweak in the SOC configuration) and asked to report the results of their analysis by filling in a report template.
4.1. Experimental infrastructure
The experiment is based on a real SOC used for research and education operating at the Mathematics and Computer Science department of the university. The SOC is operated over open-source technology and based on Security Onion(Security Onion Solutions, LLC, [n.d.]) and Elastic Stack(Elasticsearch B.V., [n.d.]) for event correlation and analysis. During regular operation the SOC monitors real incoming and outgoing network traffic in the department. The chosen network sensors (NIDS) are Suricata((OISF), [n.d.]) for security monitoring, and Bro/Zeek(Paxson, 1999) for network flow logs. The SOC is currently limited to the monitoring of network traffic and is operated with the involvement and cooperation of the security team of the university.
4.2. Experimental subjects
Subjects were recruited from a security in organization MSc course held at the university operating the SOC. The course is mandatory for all students graduating in the security track of the MSc program in Computer Science and open to students from others tracks (security=14; computer science=56; other=64; tot=124). Students were asked to form groups of two to participate in the experiment and were randomly assigned to the respective treatment groups (next subsection). The final size of the experiment pool is n=63; the term ‘experiment subject’ in the remainder of the paper will refer to the student groups and not to the single students.
4.3. Experimental variables
Independent variable
To reproduce realistic SOC configurations we setup two analysis environments, namely GOODSOC and BADSOC. To test the effectiveness of the proposed solution, we introduce only a small change between the two configurations. To maintain the change realistic, we (1) define it around the university environment in which the SOC operates, and (2) base it only on the (de-)activation of a set of predefined rules that do not match the use-cases of the university. 111This setup has been checked against a set of use-cases provided by the university for SOC operation. Namely, as the university is an open environment, default rulesets triggering alerts related to violation of generic policies such as use of TOR or p2p are out of the scope of the SOC. We therefore define the following two experimental conditions:
BADSOC: baseline SOC configuration consisting of the default set of rules defined by the detection software (Suricata); GOODSOC: baseline SOC configuration minus alerts related to policy violation events.
In the BADSOC configuration 19731 out of 27125 present Suricata ((OISF), [n.d.]) rules were active by default. By deactivating 2753 rules (14%), 16978 active rules remain). The disabled rules222All rules prefixed with either ‘ET POLICY’, ‘ET INFO’, ‘ET CHAT’, ‘GPL CHAT’, ‘ET TOR’, or ‘SURICATA’ were disabled (see ‘better-soc.sh’ in the artifact repository). inform about policy violations (including the use of chat/instant messaging software and usage of the TOR network(The Tor Project, Inc., [n.d.])).
Outcome variables
In output of the experiment we evaluate the accuracy of the assessments made by the experiment subjects. We collect analyst output through a survey compiled by all subjects at the end of the experiment. To evaluate the subject’s output under different experimental conditions, we consider the following variables: (1) the total number of reports submitted by each group: these may be related to the real injected attacks, or to other suspicious events detected by the subjects; (2) the number of submitted reports dealing with one of the simulated attacks; (3) the correctness of the submitted reports when compared against the ground truth.
4.4. Expected outcome and evaluation criteria
If the proposed solution is effective in detecting changes in SOC performance triggered by (small) changes in the SOC configuration, we would expect that GOODSOC (i.e., the configuration producing fewer alerts not related to the university’s use cases), lead to more accurate reports when compared to BADSOC. Reflecting normal SOC operation procedures (Muniz et al., 2015), we split our evaluation over the analysis phases of Attack identification and Attack investigation.
Outcome expectation. As the modification between BADSOC and GOODSOC should only reduce the number of false alerts displayed to the analyst, leaving alerts relevant to an attack unaffected, we expect the SAIBERSOC method to highlight that:
(1) GOODSOC outperforms BADSOC for the attack identification phase;
(2) no significant difference between GOODSOC and BADSOC emerges for the attack investigation phase.
To evaluate the accuracy of the Attack identification, we evaluate the number of correct entries reported by the subjects in relation to: IP(s) of the attacker, IP(s) of the victims. To evaluate the accuracy of Attack investigation, we evaluate reported information on the reconnaissance, exploitation, and delivery and control activities (ref. Table 1). As we are interested in testing the effectiveness of the proposed solution, we are not concerned with quantifying whether our GOODSOC configuration is significantly better than our BADSOC configuration; differently, we are interested in evaluating whether the (albeit small) change in the GOODSOC configuration can be spotted by the proposed experimental procedure in terms of a difference in performance. To evaluate these differences, we employ a mix of non-parametric statistical tests including Fisher’s Exact Test (for differences in counts across conditions), and Wilcoxon rank-sum tests (for differences in outcome distributions). The significance level is set at .
4.5. Experiment Preparation
This section details the experiment setup and preparation for the scenario injection, and the attack reporting.
Attack traces. We use the previously identified attack phases in Table 1 for our proof-of-concept implementation, namely Reconnaissance, Exploitation, and Delivery and Control phases. For each of these phases we collect or reconstruct the respective network traces from public resources. For the Reconnaissance phase we collect data using nmap(Lyon, [n.d.]) scans against selected targets; in the Exploitation phase we rely on PoC exploits and brute-force attacks available on public resources, such as ExploitDB(OffSec Services Limited, [n.d.]) and Metasploit(Rapid7, Inc., [n.d.]). Delivery and Control include the download of malicious software from both ExploitDB and suspect IP addresses, and communication with IPs known to be involved in botnet C2C infrastructures.
Attack generation. Using the previously identified attack traces, we build two different attack scenarios; these attacks are built by assembling the previous network captures created and provided with consistency among individual actions by editing the IP addresses involved. Resulting attacks reproduce the modus operandi implemented by two real-world attacks (namely, Mirai and Exim).
Scenario 1: Mirai. This scenario is inspired by the Mirai botnet(Antonakakis et al., 2017). The attacker gains access by successfully guessing SSH credentials. In the end of the scenario, the victim scans the internal network. As this scenario employs blacklisted IP addresses and domain names related to the Mirai botnet, it raises multiple (high priority) alerts in the SOC.
Scenario 2: Exim. The second scenario is based on a remote code execution vulnerability in an Exim 4 SMTP mail server (Common Vulnerabilities and Exposures (CVE) Database, 2018). This scenario raises exactly one (high priority) alert in our SOC.
Table 3 provides a comparison of the two scenarios across the attack phases defined by MITRE ATT&CK framework, and which phases can be detected by our SOC configuration. Note that the scenarios are unaffected by the GOODSOC or BADSOC configurations, as the GOODSOC configuration only removes ’policy violation’ rulesets that are not triggered by either scenario. Due to the higher number of alerts related to the Mirai attack than for Exim, we consider the latter to be a more advanced scenario than the former.
![[Uncaptioned image]](/html/2010.08453/assets/x2.png) |
Attack injection. The IP address of the attacker was rewritten to match the IP address defined in the scenarios. The attacks were injected in pre-recorded network traffic arriving at the SOC during working hours. While we cannot guarantee the background traffic to be attack-free, we analyzed the most significant alerts observed in the traffic to ensure that generated alerts not related to the injected attacks are not symptomatic of known attacks. We found no evidence of ongoing attacks in the pre-recorded network traffic.
Attack report. Due to infrastructural limitations, we collect reports using an online survey. 333A SOC would normally rely on an integrated case management system for incident reporting; this was not available in the employed SOC setup. Each group could report up to five444The limit of five activities was chosen after piloting. A discussion of implications on result validity is provided in section 4.8. suspicious activities detected during the experiment. Table 4 provides an overview of the questions. The first two questions asked for the attacker and victim IP addresses; as multiple entities can be associated to a role for an attack, we allow to insert more than a single IP address. Further, multiple-choice questions address reconnaissance, vulnerability exploitation, the delivery and control phase of the attack. For each of the selected answers it is required to specify the IP address involved with the selected action. Lastly subjects could report additional free-text comments. The full survey is available in the Appendix. To evaluate whether a report is a response to one of the injected attack simulations, we compare the reported IP addresses to the ground-truth from the scenario definition. If the attacker and victim IP addresses of a scenario were both mentioned in the respective field, we mark the report to be a response to one of the corresponding scenarios.
Asking for the attacker and victim IP addresses allows to frame the reported scenario, i.e., identify whether the report is in response to one of the injected scenarios or not. Questions about the reconnaissance phase, the exploitation phase, and the delivery and control phases allow to identify whether the respective phase was correctly identified by the SOC analyst. Lastly space for comments allows analysts to provide further information. Analysis param Info provided for result evaluation Attacker IP Framing of the reported scenario Victim IP Framing of the reported scenario Reconnaissance Detection of reconnaissance actions Exploitation Detection of exploitation actions Delivery & C&C Detection of delivery & C&C Comments Space for further information
Technical setup. We deployed two instances of the SOC environment and setup each accordingly to the GOODSOC and BADSOC configurations (ref. subsection 4.3). Each VM is powered by a machine with Intel(R) Xeon(R) Bronze 3104 CPU @ 1.70GHz with 12 cores and 64GB of RAM. During the experiment the two SOC servers’ sensors were isolated from the University’s network. Students accessed their respective analysis environments from the classroom on their own PCs.
4.6. Experiment Pilot
Prior to execution we ran a set of pilots to refine the infrastructure and test the devised experimental procedures. A pilot phase was conducted to evaluate the survey procedure (incl. question phrasing) employed for the reporting phase. Further, the pilots were used to assess whether the difficulty of the assignment and the pre-experiment training sessions were a good match with students’ skills. To this aim, we piloted the whole experiment four times, pooling for volunteers from students with a similar background to our subjects (e.g., enrolled in other security courses at the time, or PhD students in Computer Science).
4.7. Experimental Execution
Student autonomously created groups of two and each group was assigned randomly to the BADSOC (n=31) or GOODSOC (n=32) experimental conditions. Students were given half a bonus point valid for the final exam for attending the experiment and if they managed to correctly identify (at least one) attacker in the injected attacks.
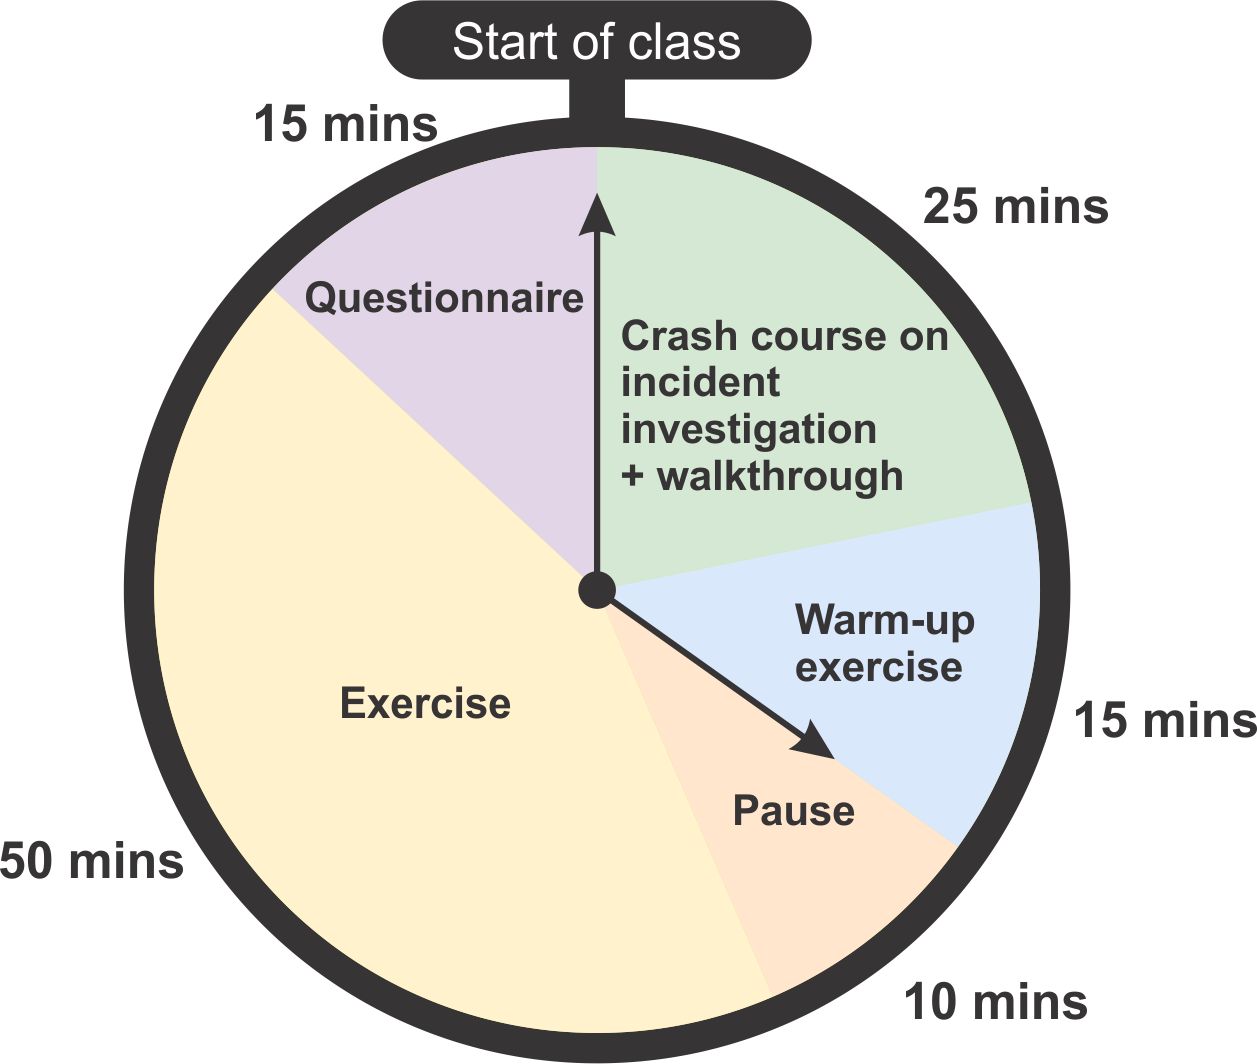
[A timeline describing the individual phases of the experiment session and their duration.]The experiment session lasted 115 minutes. First: 25 minutes crash course on incident investigation and a (SOC) walk-trough. Then: 15 minutes warm-up exercise. Then: 10 minutes break. Then: 50 minutes exercise (main experiment). Then: 15 minutes questionnaire.
The experiment session started with an introduction and training session lasting approximately 30 minutes. After introducing the assignment, we ran a 15 minutes warm-up exercise where students had to identify a simple scenario with small network traffic to familiarize with the interface. The warm-up exercise was run on the BADSOC configuration for all groups.555The warm-up exercise, albeit simpler and shorter than the actual exercise, follows the same structure as the subsequently injected attacks. The experiment was run after the warm-up phase and lasted 50 minutes. Subjects were told that at least one attack would be injected but were unaware of attack type and timing. At the end of the experiment, traffic injection was terminated, and the survey used for report collection was made available. Students were asked to submit their reports within 15 minutes but retained access to SOC and questionnaire until all submissions were collected. Figure 2 provides a visual representation of the experiment timeline.
4.8. Ethical and experimental considerations
The background noise traffic was captured from the SOC operating at the M&CS department of the host university under the ethical and organizational approval of the university. The traffic raw data was not accessible to the students during the experiment (i.e., they could only see the alerts generated based on the original traffic). The experiment was integrated in the practical educational activities run by the university and performed following guidelines approved by the university for exercises in classroom settings.
Experimental limitations. (a) Construct validity. We implicitly assume that students who report the correct IP addresses for both attacker and victim detected the attack and started analyzing it. Using automated checking it is impossible for us to determine whether a group actually understood what happened. (b) External validity. Students do not have the same experience and training that SOC analysts do and the training during the introduction section cannot make up for that. In real settings, the experiment should be replicated against multiple analysts and using a portfolio of attacks, as opposed to only one or two attack scenarios, to obtain ample validity across experimental conditions. (c) Internal validity. Students were told in advance that there would be at least one attack, creating an expectation to find something. Further, by allowing students to submit up to five incidents and not penalizing ‘false positive’ reporting, our experiment may inflate the number of reports per group. As this limit is the same across all groups and treatments, we do not expect any effect on the likelihood that groups report the ‘real’ injected incidents (i.e. our main experimental outcome).
5. Experimental Results
Whereas students could submit up to five reports, we expected exactly two reports detecting the injected attack scenarios Mirai and Exim respectively. Table 5 reports the correct answers related to the Mirai and Exim scenarios.
We expect reports in response to the Mirai attack to mention 199.19.215.23 as attacker IP address, 131.155.68.116 as victim IP address, ’port scan‘ as reconnaissance action, ‘weak credentials’ as vulnerability or exploit used, and ‘data exfiltration’ and ‘HTTP requests’ as activities observed in the Delivery and Command and Control phase of the attack. In response to the Exim attack we expect reports to mention 31.220.56.38 as attacker IP address, 131.155.71.27 as victim IP address, ’port scan‘ as reconnaissance action, ‘remote code execution’ as vulnerability or exploit used, and ‘data exfiltration’ and ‘HTTP requests’ as activities observed in the Delivery and Command and Control phase of the attack. Analysis param Mirai Exim Attacker IP 199.19.215.23 31.220.56.38 Victim IP 131.155.68.116 131.155.71.27 Reconnaissance port scan port scan Exploit/Vuln. weak credentials remote code exec. Delivery/C&C data exfiltration HTTP requests data exfiltration HTTP requests
5.1. Attack identification
We received 63 submissions (one per group) reporting a total of 162 incidents. Figure 3
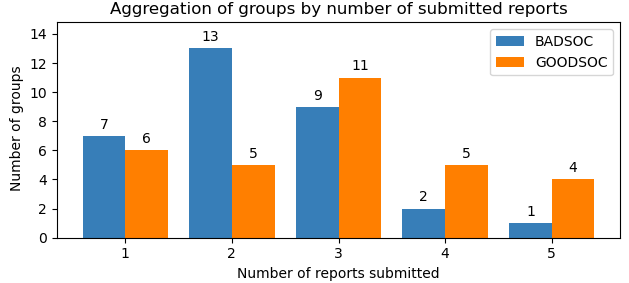
Participants were allowed to submit up to five potential attacks. In the BADSOC condition, 7 groups submitted one report, 13 groups submitted two reports, 9 groups submitted three reports, 2 groups submitted four reports, and 1 group submitted five reports. In the GOODSOC condition, 6 groups subitted one report, 5 groups ubsmitted two reports, 11 groups submitted three reports, 5 groups submitted four reports, and 4 groups submitted five reports.
reports overall submission rates for all groups in the BADSOC () and GOODSOC () configurations. Overall, the 32 groups working on BADSOC submitted 73 reports, the 31 groups on GOODSOC submitted 89 reports in total. A Wilcoxon Rank-Sum test results in BADSOC producing significantly less reports than GOODSOC (). This suggests that groups assigned to the GOODSOC condition were able to reconstruct more ‘suspicious’ activities than groups assigned to BADSOC, despite the events related to these activities being available to both treatment groups.
Overall, of BADSOC reports (19/73) and of GOODSOC reports (29/89) detailed the injected attack scenarios (i.e., the majority of reports were not about the injected attacks). As groups could report up to five incidents, this is unsurprising. To evaluate reporting in more detail, Figure 4
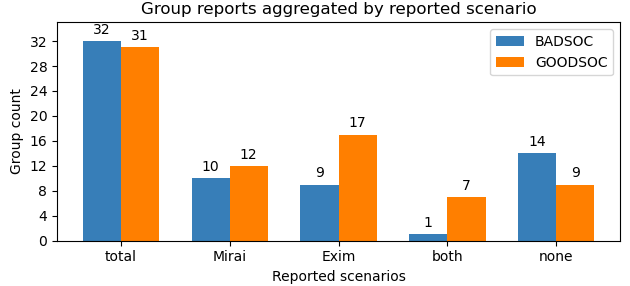
Column ‘both’ represents the number of groups that reported both scenarios (Mirai and Exim), while ‘none’ represents the number of groups that did not report any of the scenarios.
In total, 32 groups operated in the BADSOC configuration, 31 groups in the GOODSOC condition. In BADSOC 14 (out of 32) groups did not report any attack, 10 reported the Mirai and 9 the Exim attack. Out of the 18 groups that found at least one attack, one reported both attacks. In GOODSOC 9 (out of 31) groups did not report any attack, 12 reported the Mirai and 17 the Exim attack. Out of the 22 groups that found at least one attack, 7 reported both attacks.
shows the distribution of reports on the injected scenarios. Overall, 57% of groups in BADSOC and 71% of groups in GOODSOC reported at least one of the injected attacks. Whereas no noticeable difference against Mirai reporting rates can be observed (), GOODSOC groups were approximately three times more likely to report the Exim attack () than the BADSOC groups, and approximately eight times more likely to report both attacks () overall. However, if one considers only groups that reported at least one of the attacks, the difference between GOODSOC and BADSOC decreases and becomes borderline significant (, ); this may suggest that, under our treatment conditions, groups that perform well and detect at least one attack are more likely to find both irrespective of the SOC configuration. Similarly, BADSOC groups seem overall more likely () than GOODSOC to not report either of the attack scenarios, albeit the difference is not significant ().
These findings provide an initial indication that the proposed solution can be effectively employed to evaluate (relative) SOC performance across SOC configurations (e.g., before and after a major configuration change in a deployed SOC).
5.2. Attack investigation
We now provide a breakdown over the reconnaissance, exploitation, and delivery & control attack phases across the two injected attack scenarios. Results are reported in Table 6.
![[Uncaptioned image]](/html/2010.08453/assets/x3.png) |
Reconnaissance.
For both injected attacks, ‘port scan’ was the correct answer, when asked for the observed reconnaissance activity in the questionnaire (see Table 5). For the Mirai attack, the correct answer was given by 70% (7/10) groups operating on BADSOC and 75% (9/12) groups operating on GOODSOC configuration (). The ratio of reports mentioning the portscan for the Exim attack is, overall, lower than for Mirai, albeit no significant difference emerges (): In BADSOC 11.1% (1/9) correct answers, in GOODSOC 23.5% (4/17). In conclusion, GOODSOC did not perform significantly better than BADSOC with in the detection of the portscan in none of the scenarios.
Exploitation.
For exploitation activity, Table 6 shows that barely half of the groups selected the correct answer ‘weak credentials’ when asked to report the exploitation vector abused by the attacker in the Mirai attack, i.e. 50% (5/10) in BADSOC and 41.7% (5/12) in GOODSOC. For the Exim attack, Table 6 shows that 88.9% (8/9) of the groups in BADSOC that reported the Exim attack also reported the correct vulnerability ‘remote code execution’ abused by the attacker to gain foothold on the victim. In GOODSOC, 82.4% (14/17) answered correctly. On neither of the two injected attacks GOODSOC performed better than groups working with the BADSOC (Mirai: , Exim: ). In fact, BADSOC performed slightly better than GOODSOC in identifying the correct exploitation vector (Mirai: , Exim: ). Putting the differences between BADSOC and GOODSOC aside, all groups were more likely to identify the correct exploitation actions in Exim (85%, or 22/26) than in the Mirai scenario (45%, or 10/22).
Delivery & Control.
We expected groups to select two correct answers in a multiple-choice question about the delivery and control activities observed in context of an attack. The answers ‘data exfiltration’ and ‘HTTP requests’ are considered correct for both simulated attacks (see Table 5). Of the groups who reported on the Mirai attack, 66.6% (8/12) using GOODSOC and 60% (6/10) of the groups using BADSOC reported at least one of the two activities (). Looking at the Exim attack, 22% (2/9) of the groups reporting the attack on BADSOC and 18% (3/17) on GOODSOC also mentioned one correct delivery/control activity (). No group submitted both correct answers, regardless of their condition or reported attack. Again, there are no significant differences in performance between BADSOC and GOODSOC.
In the Mirai scenario option ‘HTTP requests’ was likely to be selected roughly four times more often () by groups operating GOODSOC. In the BADSOC configuration 30% (3/10) selected it, in GOODSOC 67% (8/12). Only three groups, all using BADSOC, chose the correct answer ‘data exfiltration’ when reporting the Mirai attack. For the Exim attack, most groups, 56% (5/9) in BADSOC and 71% (12/17) in GOODSOC wrongly chose ‘none of them’.
6. Discussion of results and presentation of the SAIBERSOC tool
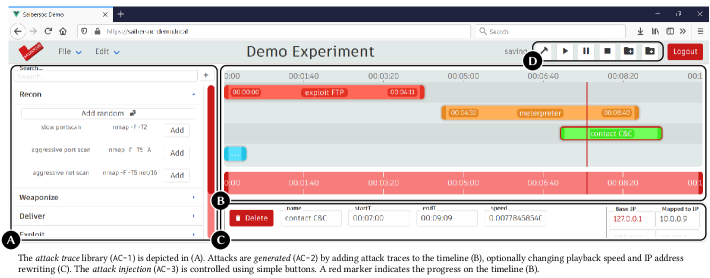
[A screenshot of the SAIBERSOC user interface.]SAIBERSOC allows to generate attacks based on attack traces and inject them into the network. The picture shows three different views: the attack-trace library, the view to generate a new experiment, and lastly a timeline view of an assembled attack that can be injected at a later point in time.
The presented results indicate that the SAIBERSOC methodology is capable of highlighting the modifications introduced between SOC configurations. In our experiment, the GOODSOC configuration significantly increases the chances of a correct attack identification; however, the BADSOC vs GOODSOC conditions do not significantly affect the chances of correctly investigating the attack across its phases, indicating that the change in configuration leaves attack investigation capabilities unaffected.
Overall, in our example application the SAIBERSOC method indicates that the GOODSOC configuration is preferable to the BADSOC configuration as it significantly increases (up to threefold) the likelihood of identification of incidents. In particular, if GOODSOC and BADSOC were alternative environments tested in a SOC environment, using the SAIBERSOC solution the SOC manager of that infrastructure could conclude that analysts working with the GOODSOC configuration were more likely to find one or both of the attacks: analysts on GOODSOC were three times more likely to find the (slightly harder to identify) Exim attack () than analysts on BADSOC. The method results indicate that analysts in the BADSOC configuration are either overwhelmed by the number of alerts to investigate or require more time analyzing individual events and therefore had no time to analyze the second scenario. However, analysts working with GOODSOC produced more false-positive reports, i.e., reports not in response to one of the injected attacks. This may indicate that analysts working on GOODSOC either spent less time per analysis and thus could write more reports in the same time, or that they are generally more likely to report false-positives. 666This effect may be caused by our experiment design; students had the expectation to find at least one attack and were rewarded on finding at least one of the injected attacks, which may lead to over-reporting. By contrast, no significant differences between BADSOC and GOODSOC can be observed in the attack investigation phase. This provides additional information on the SOC performance related to which aspects of an incident investigations are (positively or negatively) affected by the different configurations under test. The ability to quantify these effects experimentally allows both researchers and practitioners in making informed decisions on technological and process-level solutions for security monitoring application.
Implications for research. The SAIBERSOC method can be used to evaluate the effect on security analysis of virtually any live analysis setting (such as a SOC or other security monitoring or analysis environments), either technical, procedural, or human. For example, SAIBERSOC can be employed to evaluate the impact of factors such as the analysts’ experience, skill composition, and training, or the effect of analysis and visualization tools by comparing the performance of two SOC configurations with a known set of selected differences. Similarly, the proposed method can be employed to evaluate multiple performance variables, including timing (e.g., total time for alert investigation) and throughput measures (Shah et al., 2018a)), and how these vary across different phases of the attack. The extensibility of the proposed method further opens the door to the investigation of more complex effects, such as the relation between attack types and analyst skills/expertise (Allodi et al., 2020), which are still under-researched in the scientific literature. The SAIBERSOC implementation presented further down in this section provides a practical tool to deploy experiments based on the propose method in live or laboratory environments.
Implications for practice. The SAIBERSOC methodology (and tool) is fully flexible in terms of attack procedure, traces, and outcome variables, and can be implemented in operational SOCs to evaluate the relative performance of their configuration over the desired metrics. This includes both technical (e.g., rulesets, use-cases, alert correlation rules) and human-level (e.g., analysis processes, analyst expertise, flat vs. hierarchical reporting structures) aspects of SOC operation, both of central importance for effective incident detection and reporting (Kokulu et al., 2019; Muniz et al., 2015). Examples of concrete use-cases are comparison of SOC performance before and after changes in SOC configuration, or continuous monitoring of SOC performance. Further, the proposed solution can be integrated in analyst training procedures, or as part of a selection procedure for security professional roles.
6.1. SAIBERSOC tool implementation
To operationalize the SAIBERSOC methodology, after its validation, we developed the SAIBERSOC tool as an open source software solution. SAIBERSOC implements all four architectural components outlined in subsection 3.2. It is deployed with a web-based front-end (depicted in Figure 5) interacting with a backend. A comprehensive API enables scripted access to all backend functionalities.
Functionalities and User Interface. Figure 5 shows the deployed web interface and how architectural components (see subsection 3.2) AC-1…AC-3 are implemented in the web interface; report evaluation (AC-4) is not yet accessible through the frontend. On the left side of the screen, UX element provides access to the attack trace library (AC-1) showing previously uploaded network traffic recordings. A user can manually add traces onto a timeline in the center of the screen. Convenience features allow to search a specific attack trace in the library or select a random one. From the timeline , the offset and playback speed can be adjusted for each attack trace individually. In the lower section of the screen, provides additional configuration options for the selected attack trace. Here, IP addresses and whole IP address ranges can be rewritten to create a realistic attack scenario for the monitoring environment. Buttons , in the upper right area, provide functionalities to load and save experiments/attacks and to start, stop, or schedule their injections (AC-3). During attack injection (AC-3), state and progress is visualized on the timeline using a vertical red line as progress indicator. The tool is capable of automatically extracting a ground-truth based on the metadata from the attack trace library (AC-1) and the optional IP address rewrites in AC-2. A SOC report, allegorized by a csv file, can be checked against the ground-truth derived from the attack traces (AC-4).
Tool implementation and API. The SAIBERSOC web application is implemented in Python. The (HTTP) API is based on Flask(Ronacher, [n.d.]) and the Flask-RESTX framework(Flask-RESTX, [n.d.]). The web-frontend is built on top of the API using vue.js(You, [n.d.]).
Attack Traces (AC-1): The attack trace library consists of attack traces in form of pcap network traffic recordings linked to metadata stored in an internal database. Attack Generation (AC-2): Internally, SAIBERSOC uses a list of blocks to specify an attack. Each block consists of an attack trace (taken from the attack trace library) and additional information specifying time offset, playback speed, and IP address rewriting. Once an attack is fully sketched out, scapy(Biondi, [n.d.]) is used to assemble a single intermediate attack pcap. Attack Injection (AC-3): SAIBERSOC invokes tcpreplay(tcpreplay, [n.d.]) to inject the ‘intermediate attack pcap’ on a network interface. Optionally, background noise can be replayed together with the attack. Reporting (AC-4): The reporting module extracts and combines the IP address rewriting from AC-2 and attack trace metadata from AC-1 as ground-truth. It then compares selected columns from an uploaded csv file against the extracted ground truth.
Publication, Development, and Licensing The development of SAIBERSOC was supported by a team of BSc students as part of their final graduation project. The SAIBERSOC tool is released under Mozilla Public License (MPL 2.0). Source code, extensive documentation, and supplementary materials are available from the artifact repository at https://gitlab.tue.nl/saibersoc/acsac2020-artifacts.
7. Conclusion
In this paper, we proposed a methodology based on attack injection to systematically measure SOC performance across SOC configurations, analyst expertise, and for any output metric (e.g., accuracy, time-to-report, …). We verified the proposed methodology by conducting an experiment in which 124 students assumed the role of a SOC analysts. Our results show that the proposed methodology is capable of systematically measuring SOC performance and attributing it to differences in configuration, where some is to be expected. Our solution is general and can be implemented in any SOC. In addition, we developed the SAIBERSOC tool to help replicate the experiments and facilitate SOC exercises.
Acknowledgements.
This work is supported by the DEFRAUDIfy project (grant no. ITEA191010) funded by the ITEA3 program by Rijksdienst voor Ondernemend Nederland and the DEPICT project (grant no. 628.001.032) by Nederlandse Organisatie voor Wetenschappelijk Onderzoek.References
- (1)
- Abadie et al. (2010) J. Abadie, B. P. Abbott, R. Abbott, T. Accadia, F. Acernese, R. Adhikari, P. Ajith, B. Allen, G. Allen, E. Amador Ceron, R. S. Amin, S. B. Anderson, W. G. Anderson, F. Antonucci, M. A. Arain, et al. 2010. All-sky search for gravitational-wave bursts in the first joint LIGO-GEO-Virgo run. Phys. Rev. D 81 (May 2010), 102001. Issue 10. https://doi.org/10.1103/PhysRevD.81.102001
- Adams and Blandford (2005) Anne Adams and Ann Blandford. 2005. Bridging the gap between organizational and user perspectives of security in the clinical domain. International Journal of Human-Computer Studies 63, 1-2 (2005), 175–202. https://doi.org/10.1016/j.ijhcs.2005.04.022
- Allodi et al. (2020) Luca Allodi, Marco Cremonini, Fabio Massacci, and Woohyun Shim. 2020. Measuring the accuracy of software vulnerability assessments: experiments with students and professionals. Empirical Software Engineering 25, 2 (2020), 1063–1094. https://doi.org/10.1007/s10664-019-09797-4
- Antonakakis et al. (2017) Manos Antonakakis, Tim April, Michael Bailey, Matt Bernhard, Elie Bursztein, Jaime Cochran, Zakir Durumeric, J. Alex Halderman, Luca Invernizzi, Michalis Kallitsis, Deepak Kumar, Chaz Lever, Zane Ma, Joshua Mason, Damian Menscher, Chad Seaman, Nick Sullivan, Kurt Thomas, and Yi Zhou. 2017. Understanding the Mirai Botnet. In 26th USENIX Security Symposium (USENIX Security 17). USENIX Association, Vancouver, BC, USA, 1093–1110. Retrieved 2020-06-13 from https://www.usenix.org/conference/usenixsecurity17/technical-sessions/presentation/antonakakis
- Biondi ([n.d.]) Philippe Biondi. [n.d.]. scapy. Retrieved 2020-06-13 from https://scapy.net/
- Chiasson and van Oorschot (2015) Sonia Chiasson and P. C. van Oorschot. 2015. Quantifying the security advantage of password expiration policies. Designs, Codes and Cryptography 77, 2 (2015), 401–408. https://doi.org/10.1007/s10623-015-0071-9
- Common Vulnerabilities and Exposures (CVE) Database (2018) Common Vulnerabilities and Exposures (CVE) Database 2018. CVE-2018-6789. Available from MITRE, CVE-ID CVE-2018-6789. Retrieved 2020-06-13 from https://cve.mitre.org/cgi-bin/cvename.cgi?name=CVE-2018-6789
- Corporation ([n.d.]) The MITRE Corporation. [n.d.]. MITRE PRE-ATT&CK Introduction. Retrieved 2020-06-13 from https://attack.mitre.org/resources/pre-introduction/
- Elasticsearch B.V. ([n.d.]) Elasticsearch B.V. [n.d.]. The Elastic Stack. Retrieved 2020-06-13 from https://www.elastic.co/elastic-stack (Elasticseach and Kibana).
- Flask-RESTX ([n.d.]) Flask-RESTX [n.d.]. Flask-RESTX. Retrieved 2020-06-13 from https://github.com/python-restx/flask-restx
- Ganesan et al. (2017) Rajesh Ganesan, Sushil Jajodia, and Hasan Cam. 2017. Optimal scheduling of cybersecurity analysts for minimizing risk. ACM Transactions on Intelligent Systems and Technology (TIST) 8, 4 (2017), 1–32. https://doi.org/10.1145/2914795
- Herley and van Oorschot (2017) Cormac Herley and Paul C. van Oorschot. 2017. SoK: Science, Security and the Elusive Goal of Security as a Scientific Pursuit. In 2017 IEEE Symposium on Security and Privacy, SP 2017, San Jose, CA, USA, May 22-26, 2017. IEEE Computer Society, 99–120. https://doi.org/10.1109/SP.2017.38
- ISO (2013) ISO. 2013. Information technology — Security techniques — Information security management systems — Requirements. ISO/IEC 27001:2013. International Organization for Standardization, Geneva, Switzerland.
- Jacobs et al. (2013) Pierre Jacobs, Alapan Arnab, and Barry Irwin. 2013. Classification of Security Operation Centers. In 2013 Information Security for South Africa, Johannesburg, South Africa, August 14-16, 2013 (2013-08). IEEE, 1–7. https://doi.org/10.1109/ISSA.2013.6641054
- Jacobs (2014) Pierre Conrad Jacobs. 2014. Towards a Framework for Building Security Operation Centers. Master Thesis. Rhodes University. Retrieved 2020-06-13 from https://research.ict.ru.ac.za/SNRG/Theses/Jacobs%202014%20Msc.pdf
- Kokulu et al. (2019) Faris Bugra Kokulu, Ananta Soneji, Tiffany Bao, Yan Shoshitaishvili, Ziming Zhao, Adam Doupé, and Gail-Joon Ahn. 2019. Matched and Mismatched SOCs: A Qualitative Study on Security Operations Center Issues. In Proceedings of the 2019 ACM SIGSAC Conference on Computer and Communications Security, CCS 2019, London, UK, November 11-15, 2019. ACM, 1955–1970. https://doi.org/10.1145/3319535.3354239
- Lockheed Martin Corporation ([n.d.]) Lockheed Martin Corporation. [n.d.]. The Cyber Kill Chain. Retrieved 2020-06-13 from https://www.lockheedmartin.com/en-us/capabilities/cyber/cyber-kill-chain.html
- Lyon ([n.d.]) Gordon ‘Fyodor’ Lyon. [n.d.]. Nmap Security Scanner. Retrieved 2020-06-13 from https://nmap.org/
- Miller et al. (2018) Doug Miller, Ron Alford, Andy Applebaum, Henry Foster, Caleb Little, and Blake E. Strom. 2018. Automated Adversary Emulation: A Case for Planning and Acting with Unknowns. Retrieved 2020-06-13 from https://www.mitre.org/publications/technical-papers/automated-adversary-emulation-a-case-for-planning-and-acting-with
- Muniz et al. (2015) Joseph Muniz, Gary McIntyre, and Nadhem AlFardan. 2015. Security Operations Center: Building, Operating, and Maintaining Your SOC. Cisco Press, Hoboken, NJ, USA.
- OffSec Services Limited ([n.d.]) OffSec Services Limited. [n.d.]. Offensive Security’s Exploit Database. Retrieved 2020-06-13 from https://www.exploit-db.com/
- (OISF) ([n.d.]) Open Security Foundation (OISF). [n.d.]. Suricata. Retrieved 2020-06-13 from https://suricata-ids.org/
- Paxson (1999) Vern Paxson. 1999. Bro: a System for Detecting Network Intruders in Real-Time. Computer Networks 31, 23-24 (1999), 2435–2463. https://doi.org/10.1016/S1389-1286(99)00112-7 Zeek – An Open Source Network Security Monitoring Tool, (formerly known as bro), retrieved 2020-06-13 from https://zeek.org.
- Pfleeger and Cunningham (2010) Shari Pfleeger and Robert Cunningham. 2010. Why measuring security is hard. IEEE Security & Privacy 8, 4 (2010), 46–54. https://doi.org/10.1109/MSP.2010.60
- Rapid7, Inc. ([n.d.]) Rapid7, Inc. [n.d.]. Metasploit – The world’s most used penetration testing framework. Retrieved 2020-06-13 from https://www.metasploit.com/
- Red Canary ([n.d.]) Red Canary. [n.d.]. Atomic Red Team. Retrieved 2020-06-13 from https://atomicredteam.io/
- Ronacher ([n.d.]) Armin Ronacher. [n.d.]. Flask. Retrieved 2020-06-13 from https://palletsprojects.com/p/flask/
- Security Onion Solutions, LLC ([n.d.]) Security Onion Solutions, LLC. [n.d.]. Security Onion. Retrieved 2020-06-13 from https://securityonion.net/
- Shah et al. (2018a) Ankit Shah, Rajesh Ganesan, Sushil Jajodia, and Hasan Cam. 2018a. A methodology to measure and monitor level of operational effectiveness of a CSOC. International Journal of Information Security 17, 2 (2018), 121–134. https://doi.org/10.1007/s10207-017-0365-1
- Shah et al. (2018b) Ankit Shah, Rajesh Ganesan, Sushil Jajodia, and Hasan Cam. 2018b. Understanding Tradeoffs Between Throughput, Quality, and Cost of Alert Analysis in a CSOC. IEEE Transactions on Information Forensics and Security 14, 5 (2018), 1155–1170. https://doi.org/10.1109/TIFS.2018.2871744
- Sundaramurthy et al. (2014) Sathya Chandran Sundaramurthy, Jacob Case, Tony Truong, Loai Zomlot, and Marcel Hoffmann. 2014. A Tale of Three Security Operation Centers. In Proceedings of the 2014 ACM Workshop on Security Information Workers, SIW ’14, Scottsdale, Arizona, USA, November 7, 2014. ACM, 43–50. https://doi.org/10.1145/2663887.2663904
- Sundaramurthy et al. (2016) Sathya Chandran Sundaramurthy, John McHugh, Xinming Ou, Michael Wesch, Alexandru G. Bardas, and S. Raj Rajagopalan. 2016. Turning Contradictions into Innovations or: How We Learned to Stop Whining and Improve Security Operations. In Twelfth Symposium on Usable Privacy and Security, SOUPS 2016, Denver, CO, USA, June 22-24, 2016. USENIX Association, 237–251. Retrieved 2020-06-13 from https://www.usenix.org/conference/soups2016/technical-sessions/presentation/sundaramurthy
- tcpreplay ([n.d.]) tcpreplay [n.d.]. tcpreplay. Retrieved 2020-06-13 from https://tcpreplay.appneta.com/
- The MITRE Corporation ([n.d.]) The MITRE Corporation. [n.d.]. MITRE ATT&CK. Retrieved 2020-06-13 from https://attack.mitre.org/
- The Tor Project, Inc. ([n.d.]) The Tor Project, Inc. [n.d.]. Tor. Retrieved 2020-06-13 from https://www.torproject.org/
- Verizon Enterprise Solutions (2018) Verizon Enterprise Solutions. 2018. 2018 Data Breach Investigation Report. Technical Report 11th edition. Verizon. Retrieved 2020-06-13 from https://enterprise.verizon.com/resources/reports/DBIR_2018_Report.pdf
- You ([n.d.]) Evan You. [n.d.]. vue.js. Retrieved 2020-06-13 from https://vuejs.org/
- Zimmerman (2014) Carson Zimmerman. 2014. Ten strategies of a world-class cybersecurity operations center. The MITRE Corporation.
Appendix
| R-ID | AC-1 | AC-2 | AC-3 | AC-4 |
|---|---|---|---|---|
| R-1 | Attack traces are independent of the monitored environment. | The attack generation allows for the matching of the traces to the environment. | The reporting and comparison relies on the ground truth for the generated scenario. | |
| R-2 | The attack traces identify all MITRE ATT&CK ‘building blocks’. | The generated attack can suit any final environment and attack scenario. | ||
| R-3 | Attacks can be mapped to the target environment using asset information always available at the SOC. | The injection happens in the real network flow monitored by the SOC. | ||
| R-4 | The tailoring of the attack generation guarantees the existence of a ground-truth for the examination. | The analyst report can be automatically checked against the attack parameters (AC-2). |
![[Uncaptioned image]](/html/2010.08453/assets/x5.png) |
Data Collection and Analysis
Evaluation for possible typos
In an exploratory data analysis, we observed that some groups reported IP addresses that are very similar to the ones we expected to see as attacker or victim IP address in one of the two scenarios. Based on the difference between the IP addresses in the report and the ground-truth, we conclude that it is very likely that those are typos or copy-paste errors.
In other cases, groups did not make the right selections in the multiple-choice part of the questionnaire, but later mentioned correct details in the additional comment section of the report. For example, group 78 did not indicate that they observed ‘http requests’ through the multiple-choice selection but wrote ‘[…] this malware made a HTTP request […]’ in the additional comments.
To ensure automatic and reproducible processing of the results, we decided to only consider IP addresses that are perfect matches and solely rely on the multiple-choice selection.
Submissions violating the enforced format
Some groups managed to submit reports that violate the constraints enforced through the questionnaire. This mostly includes submissions that ticked more or less checkboxes than we allowed. Group 80 was able to select three options where the questionnaire was supposed to allow no more than two selections. We kept those submissions as they do not interfere with our way of data analysis.
Double-submission
One group submitted twice, i.e. we collected 64 submissions for 63 groups. While both submissions are similar, they are not identical. We decided to merge the submissions. The reports in response to one of the injected attack scenarios are merged by selecting the best parts of both submissions. We further decided to keep the submission time and duration of their first submission.
(Not) Accepting ‘lateral movement’ in Mirai
We initially did not plan to accept ‘lateral movement’ as a correct answer in Mirai scenario. In the Mirai scenario, the victim eventually mirrors the attacker’s behavior and starts scanning the local network for vulnerable hosts. While the scenario ended before and therefore does not cover lateral movement, the network scan can be interpreted as a first step of lateral movement. We decided to not accept ‘lateral movement’ as a correct answer for the Mirai scenario.
In total 40.0% groups (4/10) in BADSOC and 41.7% groups (5/12) in GOODSOC selected ‘lateral movement’ (either alone or in combination with ‘http requests’).
Questionnaire
Based on the choice on question 9, questions 3–8 can be repeated up to four additional times (i.e., a total of five reports can be submitted). The decision to limit the number of reports per submission was induced by limitations of the survey tool used to collect the results.
-
(1)
Insert your student ID Multiple short text fields for multiple student IDs. Answers are considered personal data.
-
(2)
Which was your SOC name? Binary choice between BADSOC and GOODSOC (names changed).
-
(3)
Insert the IP address(es) of the attacker, one per line. If no IP address is known, write ‘NA’. Multi-line text field.
-
(4)
Insert the IP address(es) of the attacker, one per line. If no IP address is known, write ‘NA’. Multi-line text field.
-
(5)
Did you observe any of the following reconnaissance activities? Multiple choice single selection only: ‘Username enumeration’, ‘Port scan’, ‘SIP scan’, ‘Web application vulnerability scan’, ‘None of them’, ‘Other (small text field to specify)’.
-
(6)
Which vulnerability did the attacker exploit? Multiple choice, multiple selections possible: ‘SQL injection’, ‘Weak credential’, ‘DNS remote command execution’, ‘Poor web server configuration’, ‘Remote coded execution’, ‘None of them’, ‘Other (small text field to specify)’.
-
(7)
Which of the following actions did you observe? (check at most 2 boxes). For each option selected insert IP address of the receiver of such activities (i.e. HTTP requests -¿ web server’s IP; enumerating SMB shares -¿ SMB server’s IP;. Multiple choice, at least one, at most two answers can be selected. Except of ‘No action observed’, all answers have a small text field to further specify an IP address: ‘Data exfiltration’, ‘Enumerating SMB shares’, ‘HTTP requests’, ‘Denial of Service attack’, ‘Web server path traversal’, ‘NTP amplification’, ‘Network lateral movement’, ‘No action observed’.
-
(8)
Anything else to report about this attack? Multi-line text field.
-
(9)
Do you want to report another attack? Binary yes/no selector. Subjects could submit up to five reports (questions 3 – 8), selecting ‘yes’ would allow them to continue, selecting ‘no’ would allow them to submit their results.
-
(10)
Did you had fun? Rating-scale 1 (really boring) – 5 (it was great)
-
(11)
Do you think the introduction was enough to do the exercise? Rating-scale 1 (not at all) – 5 (definitely enough)
-
(12)
Do you think we should do again this next year? Binary yes/no selection.
-
(13)
Did you find anything particularly challenging during the investigation process? Multi-line text field.
-
(14)
Write here any other suggestions you might have in mind. Multi-line text field.