Automated Reasoning and Detection of Specious Configuration
in Large Systems with Symbolic Execution
Abstract
Misconfiguration is a major cause of system failures. Prior solutions focus on detecting invalid settings that are introduced by user mistakes. But another type of misconfiguration that continues to haunt production services is specious configuration—settings that are valid but lead to unexpectedly poor performance in production. Such misconfigurations are subtle, so even careful administrators may fail to foresee them.
We propose a tool called Violet to detect such misconfiguration. We realize the crux of specious configuration is that it causes some slow code path to be executed, but the bad performance effect cannot always be triggered. Violet thus takes a novel approach that uses selective symbolic execution to systematically reason about the performance effect of configuration parameters, their combination effect, and the relationship with input. Violet outputs a performance impact model for the automatic detection of poor configuration settings. We applied Violet on four large systems. To evaluate the effectiveness of Violet, we collect 17 real-world specious configuration cases. Violet detects 15 of them. Violet also identifies 9 unknown specious configurations.
1 Introduction
Software is increasingly customizable. A mature program typically exposes hundreds of parameters for users to control scheduling, caching, etc. With such high customizability, it is difficult to properly configure a system today, even for trained administrators. Indeed, numerous studies and real-world failures have repeatedly shown that misconfiguration is a major cause of production system failures [32, 42, 59, 44].
The severity of the misconfiguration problem has motivated solutions to detect [60, 62, 34], test [36, 56], diagnose [51, 49, 53, 21, 19] and fix [47, 52, 38] misconfiguration. While these efforts help reduce misconfiguration, the problem remains vexing [5, 2, 3, 18, 9, 10, 6, 31, 8, 7, 1, 17]. They focus on catching invalid settings introduced due to user mistakes. But another type of misconfiguration that haunts production systems, yet not well addressed, is valid but poor configuration. For simplicity, we call them specious configuration.
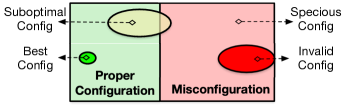
Specious configuration has a broad scope. In this paper, we focus on—and use the term to refer to—valid settings that lead to extremely poor performance, which is a common manifestation in production incidents. This scope of focus is different from suboptimal configuration (Figure 1). The latter happens when a setting does not yield the best performance, but the performance is still acceptable. This scope is also complementary to efforts on automated configuration performance tuning [50, 63, 61, 33] to search for the best setting.
Take a real-world specious configuration that caused a service outage as an example. An engineer changed the request tracing code from a hard-coded policy (always tracing) to be configurable with a tracing rate parameter. This rate parameter was initially set to 0.0. To retain the same tracing behavior as before, he decided to change the parameter to 1.0. Based on his understanding, this change will turn on the tracing for all message requests that come from internal users. But unfortunately, there was a subtle caveat in the code that caused the actual effect to be turning on tracing for all requests from all users, which quickly overloaded all web servers as well as the backend databases, leading to a catastrophic service outage. Interestingly, before rolling out this specious configuration to production, the change in fact went through a canary phase on a small-scale testing cluster, which unfortunately did not manifest dramatic failure symptoms.
Empirical evidence suggests that specious configuration like the above is prevalent. Yin et al. [59] shows that misconfiguration in the form of legal parameters has similar or higher percentage than illegal parameters. Facebook reports [48] that more than half of the misconfiguration in their high-impact incidents during a three-month period are subtle, “valid” configurations. A recent study [50] on performance configurations in distributed systems makes a similar finding.
To reduce specious-configuration-induced incidents, we need to proactively detect it before production. But what makes detecting specious configuration subtle is that the parameter value is not a unconditionally poor choice. Rather, it is only problematic under certain settings of some other parameters, input, and/or environment. Currently, administrators either informally estimate the impact based on their experience, or experimentally measure it by black-box testing of the program with configuration. However, neither of them are sufficient to reliably capture the pitfalls.
Through analyzing real-world cases (Section 2), we realize that the crux of specious configuration lies in the fact that some slow code paths in the program or library get executed; but this effect can be only triggered with certain input, other configurations, and environment. Therefore, we argue that analytical approaches are needed to reason about the configuration settings’ performance implications under a variety of conditions. We propose a novel analytical tool called Violet that uses symbolic execution [37, 24] to analyze the performance effect of configuration at the code level.
The basic idea of Violet is to systematically explore the system code paths with symbolic configuration and input, identify the constraints that decide whether a path gets executed or not, and analytically compare different execution paths that are explored. Violet derives a configuration performance impact model as its analysis output. A Violet checker leverages this model to contiguously catch specious configuration in the field. Making this basic idea work for large system software faces several challenges, including the intricate dependency among different parameters, the efficiency of symbolic execution for performance analysis, complex input structure, and path explosion problems. Violet leverages program analysis and selective symbolic execution [26] to address these challenges.
We implement a prototype of the Violet toolchain, with its core tracer as plugins on S2E platform [26], the static analyzer on LLVM [39], and the trace analyzer and checker as standalone tools. We successfully apply Violet on four large systems, MySQL, PostgreSQL, Apache and Squid. Violet derives performance impact models for 471 parameters. To evaluate the effectiveness of Violet, we collect 17 real-world specious configuration cases. Violet detects 15 cases. In addition, Violet exposes 9 unknown specious configuration, 7 of which are confirmed by developers.
In summary, this paper makes the following contributions:
-
•
An analytical approach to detect specious configuration using symbolic execution and program analysis.
-
•
Design and implementation of an end-to-end toolchain Violet, and scaling it to work on large system software.
-
•
Evaluation of Violet on real-world specious configuration.
The source code of Violet is publicly available available at:
https://github.com/OrderLab/violet
2 Background and Motivation
In this Section, we show a few cases of real-world specious configuration from MySQL to motivate the problem and make the discussion concrete. We analyze how specious configuration affects system performance at the source code level. We choose MySQL because it is representative as a large system with numerous (more than 300) parameters, many of which can be misconfigured by users and lead to bad performance.
2.1 Definition
A program expects the settings of its configuration parameters to obey certain rules, e.g., the path exists, the min heap size does not exceed the max size. Invalid configurations violate those rules and usually trigger assertions or errors.
We define specious configuration to be valid settings that cause the software to experience bad performance when deployed to production. Admittedly, bad performance is a qualitative criterion. We, like prior work, focus on those less controversial issues that cause severe performance degradation. Ultimately, only users can judge whether the performance slowdown is sub-optimal but tolerable or it is intolerable.
Specious configuration has two classes. One is purely about performance, e.g., buffer size, number of threads. Another class is settings that change the software functionality but the changes also have performance impact. Both classes are important and occur in real-world systems. For the latter class, users might want the enabled functionality and are willing to pay for the performance cost. Thus, whether the setting is specious or not depends on users’ preferences. Our solution addresses both forms. Its focus is to analyze and explain the quantitative performance impact of different settings, so that users can make better functionality-performance trade-offs.
2.2 Case Studies
autocommit parameter controls the transaction commit behavior in MySQL. If autocommit is enabled, each SQL statement forms a single transaction, so MySQL will automatically perform a commit. If autocommit is disabled, transactions need to be explicitly committed with COMMIT statements. While autocommit offers convenience (no explicit commit required) and durability benefits, it also has a performance penalty since every single query will be run in a transaction. For some users, this performance implication may not be immediately apparent (especially since it is enabled by default). Even if users are aware of the performance trade-off, they might not know the degree of performance loss, only to realize the degradation is too much after deploying it to production. Indeed, there have been user-reported issues due to this setting [59, 15, 13], and the recommended fix is to disable autocommit, and manually batch and commit multiple queries in one transaction.
To quantify the performance impact, we use sysbench [16] to measure MySQL throughput with autocommit configuration set to be ON and OFF. The size of the database is 10 tables and 10K records per table. We run both a normal workload that consists of 70% read, 20% write and 10% other operations, and an insert-intensive workload. Figure 2 shows the result. We can see that in the normal workload (Figure 2(a)), the performance difference between ON and OFF are small. But in insertion-intensive workload (Figure 2(b)), enabling autocommit causes dramatically worse (6) performance.
Figure 3 shows the code relevant to autocommit. We can see that autocommit setting determines whether function trx_commit_complete() will be invoked. In this function, another parameter flush_at_trx_commit111Its full name in MySQL is innodb_flush_log_at_trx_commit. We abbreviate it and some other parameter names in this paper for readability. further determines which path gets executed. When that parameter is set to 1, compared to 2, an additional fil_flush operation will be incurred, which has a complex logic but essentially will flush the table writes cached by the OS to disk through fsync system call. The cost of fsync is the major contributor to the bad performance of autocommit mode; if flush_at_trx_commit is 2 or 0, the performance impact of autocommit mode will be much smaller. In addition, the function in which autocommit is used—write_row()—is called when handling write type queries but not select type queries. Therefore, the performance hit only affects insertion/update-intensive workloads.
query_cache_wlock_invalidate controls the validation of the query cache in MySQL. Normally, when one client acquires a WRITE lock on a MyISAM table, other clients are not blocked from issuing statements that read from the table if the query results are present in the query cache. The effect of setting this parameter to 1 is that upon acquisition of a WRITE lock for a table, MySQL invalidates the query cache that refers to the locked table, which has a performance implication.
As Figure 4 shows, enabling this parameter leads to the free_query operation (➊). Different from the autocommit case, this operation itself is not costly. But for other clients that attempt to access the table, they cannot use the associated query cache (➋), forcing them to open the table and wait (➌) while the write lock is held. Therefore, the effect is additional synchronization that decreases the system concurrency, which in turn can severely hurt the overall system query throughput.
Similar to autocommit, the performance effect depends on the execution environment and workloads. Specifically, the bad performance is only manifestable on the combination of MyISAM tables, LOCK TABLES statements and other clients doing select type queries on the locked table.
innodb_log_buffer_size determines the size of the buffer for uncommitted transactions. The default value (8M) is usually fine. But as soon as MySQL has transactions with large blob/text fields, the buffer can fill up very quickly and incur performance hit. As shown in Figure 5, the parameter setting has two possible performance impacts: (1) if the length of a new log is larger than half of the buf_size, the system will extend the buffer first by calling log_buffer_extend, which in normal cases mainly involves memory allocation. But if other threads are also extending the buffer, additional synchronization overhead is incurred. If the buffer has pending writes, they will be flushed to disk first; (2) if the buf_size is smaller than the free size plus the length of new log, MySQL will trigger a costly synchronous buffer flush operation.
2.3 Code Patterns
Based on the above and other cases we analyze, we summarize four common patterns on how a specious configuration affects the performance of a system at the source code level:
-
1.
The parameter causes some expensive operation like the fsync system call to be executed.
-
2.
The parameter incurs additional synchronization that itself is not expensive but decreases system concurrency.
-
3.
The parameter directs the execution flow towards a slow path, e.g., not using cached result.
-
4.
The parameter triggers frequent crossings of some threshold that leads to costly operations.
The general characteristic among them is that specious configuration controls a system’s execution flows—different values cause the program or its libraries to execute different code paths. However, the performance impact is context-dependent, because of the complex interplay with other parameters, input, and environment. A specious configuration is bad when its value and other relevant factors together direct the system to execute a path that is significantly slower than others.
2.4 Approaches to Detect Specious Config
Detecting specious configuration is difficult. Operators often rely on expert experience or user manuals, which are neither reliable nor comprehensive.
A more rigorous practice is to test the system together with configuration and quantitatively measure the end-to-end performance like throughput. However, if the testing does not have the appropriate input or related parameters, the performance issue will not be discovered. Also, because the testing is carried out in a black-box fashion, the approach is experimental. The results are tightly tied to the testing environment, which may not represent the production environment. For example, in the real-world incident described in Section 1, that specious configuration was tested, and the result showed a slight increase of logging traffic to a dependent database. But this increase was deemed small, so it passed the testing.
We argue that while the experimental approach is indispensable, it alone is insufficient to catch specious configuration. We advocate developing analytical approaches for reasoning configurations’ performance effect from the system code. The outcome from an analytical approach includes not only a conclusion, but also answers to questions “how the parameter affects what operations get executed?”, “what kind of input will perform poorly/fine?”, and “does the effect depend on other parameters?”. In addition, the analysis should enable extrapolation to different contexts, so users can project the outcome with respect to specific workload or environment.
A potential analytical approach is static analysis. Indeed, the code patterns summarized in Section 2.3 can be leveraged to detect potential specious configuration. However, mapping them at concrete code construct level requires substantial domain knowledge. Also, the performance effect involves many complex factors that are difficult to be deduced by pure static analysis.
The observations in Section 2.3 lead us to realize that the crux is some slow path being conditionally executed. Thus, we can transform the problem of detecting specious configuration to the problem of finding slow execution flow plus deducing the triggering conditions of the slow execution.
3 Overview of Violet
We propose an analytical approach for detecting specious configuration, and design a tool called Violet. Violet aims to comprehensively reason about the performance effect of system configurations: (1) explore the system without being limited by particular input; (2) analyze the performance effect without being too tied to the execution environment.
Our insight is that the subtle performance effect of a specious parameter is usually reflected in different code paths getting executed, depending on conditions involving the parameter, input and other parameters, and these paths have significant relative performance differences. Based on this insight, Violet uses symbolic execution with assistance of static analysis to thoroughly explore the influence of configuration parameters on program execution paths, identify the conditions leading to each execution, and compare the performance costs along different paths. After these analyses, Violet derives a configuration performance impact model that describes the relationship between the performance effect and related conditions. In this Section, we give an overview of Violet (Figure 6). We describe the design of Violet in Section 4.
3.1 Symbolic Execution to Analyze Performance Effect of Configurations
Background. Symbolic execution [37, 24] is a popular technique that systematically explores a program. Different from testing that exercises a single path of the program with concrete input, symbolic execution explores multiple paths of the program with symbolic input and memorizes the path constraints during its exploration. When a path of interest (e.g., with abort()) is encountered, the execution engine generates an input that satisfies the constraint, which can be used as a test case. Compared to random testing, symbolic execution systematically explores possible program paths while avoiding redundancy. Consider this snippet:
Testing may blindly test the program many times with different values of n, e.g.,
1, 10, 20, etc., but they all exercise the same path without triggering
the call to bar(). In comparison, if we use symbolic execution:
we can explore the two paths of foo
by deriving only two concrete values of n to satisfy the path constraints.
Basic Idea. Configuration is essentially one type of external input to a program. The basic idea of Violet is simple—make the parameters of a system symbolic, measure the cost along each execution path explored, and comparatively analyze the costs. The path constraints that the symbolic execution engine memorizes characterize the conditions about whether and when a parameter setting is potentially poor. Take Figure 3 as an example. Violet makes variable autocommit symbolic. Function write_row will fork at line 2. The first path goes into the if branch, with a constraint autocommit == 1. When trx_commit_complete is called in the first path, it encounters another parameter flush_at_trx_commit, which is also made symbolic. Two additional paths are forked within that function. While exploring these paths, Violet records a set of performance cost metrics.
Since the subtle performance effect of specious configuration is often only triggered under specific input, besides configuration parameters, Violet can also make the input symbolic. For the example in Figure 3, the input will determine whether the write_row function will be called or not. Only insert type queries will invoke write_row. This input constraint will be recorded so the analysis later can identify what class of input can trigger the specious configuration.
3.2 Violet Workflow
Figure 6 shows the workflow of Violet. The input to Violet is system code. We require source code to identify the program variables corresponding to configuration parameters. In addition, as we discuss later (Section 4.3), Violet uses static analysis to assist the discovery of dependent parameters. To symbolically execute the target system, we leverage a state-of-the-art symbolic execution platform S2E [26] and insert hooks to S2E APIs in the system code to make parameters and input symbolic. We design the Violet execution tracer as S2E plugins to analyze the performance during state exploration and write the results to a trace. The Violet trace analyzer conducts comparative cost analysis, differential critical path analysis, etc. The outcome is a configuration performance impact model that describes the relationship among configuration constraints, cost, critical path, and input predicate.
Violet further provides a checker to deploy with the software at user sites. The checker consumes the constructed configuration impact model to continuously detect whether a user-site configuration file or update can potentially lead to poor performance. Upon the detection of potential specious configuration, the Violet checker reports not only the absolute performance result, but also the logical cost and critical path to explain the danger. The checker also outputs a validation test case based on the input predict that provides hints to users about what input can expose the potential performance issue.
4 The Design of Violet
In this Section, we describe the Violet design (Figure 6). We need to address several design challenges. First, configurations have intricate dependencies among themselves and with the input, but making all of them symbolic easily leads to state space explosion. Second, conducting performance analysis in symbolic execution is demanding due to lack of explicit assertion point, mixed costs, overhead, etc. Third, deriving performance model from code requires balance between being generalizable (not too tailored to specific input or environment) and being realistic (reflects costs in real executions).
4.1 Make Config Variable Symbolic
The starting point for Violet is to make parameters symbolic.
A naïve way is to
make the entire configuration file a symbolic blob. While this approach is transparent
to the target program, it easily leads to path explosion even at the program
initialization stage.
An improvement could be only making the configuration value string symbolic during parsing.
e.g.,
But the execution would still spend significant time in the parsing (atoi).
Also the parameter value range will be limited by the string size.
We should identify the program variables that store configuration parameters and directly make these variables symbolic. Prior works [56, 55] observe that the mature software typically uses uniform interfaces such as an array of struct to store parameters. Thus they annotate these interfaces to extract variable mappings in static analysis. For Violet, we need to additionally identify the parameter type and value constraints defined by the program (e.g., ) to restrict the symbolic value. This is because we are only interested in exploring the performance effect of valid values.
Since typically all the config variables are readily accessible after some point during initialization, we take a simple but accurate approach: insert a hook function directly in the source code right after the parsing function and programmatically enumerates these variables and make them symbolic using their type and other info. In this hook function, we read an external environment variable VIO_SYM_CONFIGS to decide which target parameter(s) to make symbolic.
Take MySQL as an example. Its configuration parameters are represented by a number of Sys_var_* data structures in the code, depending on the parameter’s type. We add a make_symbolic API to these data structures, which uses the type, name, value range information to call the Violet library to make the backing store symbolic. Figure 7 shows an example of the added hook API. Then after MySQL finishes parsing its configurations, we iterate through all configuration variables (Figure 8), which are stored in a global linked list called all_sys_vars. If the parameter is in the target set, we invoke its new make_symbolic API.
4.2 Make Related Config Symbolic
The performance effect of a parameter usually depends on the values of other parameters. Thus, if we only make one parameter symbolic while leaving other parameters concrete, we will only explore incomplete execution paths and potentially miss some problematic combination that leads to bad performance. A straightforward solution is to make all parameters symbolic. Since symbolic execution only forks if a symbolic value is used branch conditions, this approach seems to be feasible. However, the problem with this approach is that most combinations of configuration parameters are unrelated but will be explored during symbolic execution.
Figure 9 illustrates the problem. Suppose we are interested in the performance effect of opty. If we simply make all parameters (optx, opty, optz) symbolic in hope of exploring the combination effect, there will be at least 6 execution paths being explored. But opty is unrelated to optx and optz. The performance impact of opty is only determined by the cost of its branches. For large programs, the target parameter could be used deep in the code. Including unrelated parameters in the symbolic set can cause the symbolic execution to waste significant time or get stuck before reaching the interesting code place to explore the target parameter. The analysis result can also cause confusions. For example, it might suggest only when optx>100 && optz==FILE && opty is true will there be a performance issue and miss detecting specious configuration when opty is true but optx <= 100 or optz != FILE.
Therefore, instead of making all parameters symbolic at once, we carefully choose the set of parameters to symbolically execute together. In particular, related parameters are usually control dependent on each other. We discover the parameter control dependency with methods described in the following Section.
4.3 Discover Control Dependent Configs
Violet statically analyzes the control dependency relationship of parameters to determine a reduced symbolic parameter set. The static analysis result can significantly help mitigate the path exploration problem during symbolic execution phase.
For a target parameter , Violet identifies two kinds of related parameters to put in its symbolic set. The enabler parameters are those that is control dependent on. The influenced parameters are those that are control dependent on . Figure 10 shows an example. For target parameter autocommit, it is used in decide_logging_format and write_row, it has an enabler parameter binlog_format, which decides if autocommit will be activated. autocommit itself influences the performance effect of parameter flush_at_trx_commit. Thus, for autocommit, the set of related parameters to make symbolic together is .
Informally, program element is control dependent on element if whether ’s executed depends on a test at . More formally, control dependency is captured by postdominator relationship in program Control Flow Graph (CFG). Node in the CFG postdominates node if every path from to the exit node contains . is control dependent on if there is a path such that postdominates all and does not postdominate . We use postdominator as a building block for our analysis. But our notion of control dependency is broader than the classic definition. For example, in the following code snippet (1)
, the classic definition does not regard a and d as being control-dependent (c and d are, and the a and d in (2) are). But for us, all the four parameters are control dependent.
Our analysis is divided into two steps (Algorithm 1). The first step computes the enabler parameters. Algorithm 2 lists the core logic for this step. Violet builds a call graph of the program. For target parameter , it locates the usage points of and extracts the call chains starting from the entry function to the function that encloses a usage point. If any caller in the call chain uses some other parameter , we check if the callsite in that eventually reaches is control dependent on the usage point of parameter in . If so, is added to the enabler parameter set of . Violet identifies enabler parameters within through intra-procedural control dependency.
In the second step, Violet calculates the influenced parameters from
the computed enabler parameter sets of all parameters. The
related config set is a union of the influenced set and enabler set (Algorithm 1).
We also capture control dependency that involves simple data flow.
For example,
any parameter that is control dependent on the regular variable m_cache_is_disabled
or return value of is_disabled() is also considered to be related
to parameter query_cache_type.
The static analysis result can be inaccurate due to imprecision in the pointer analysis, call graph, infeasible path problem, etc. Our general principle is to be conservative and over-approximate the set of related parameters for a target parameter. During symbolic execution, having a few false control dependent parameters does not greatly affect the performance or analysis conclusion and they can manifest through the symbolic execution log if they do cause serious issues.
4.4 Execute Software Symbolically
After the target software is instrumented with the symbolic execution hooks, Violet symbolically executes the software with a concrete configuration file. The hook function reads the VIO_SYM_CONFIGS environment variable and makes symbolic the program variables corresponding to the specified parameter. In addition, the function parses the control dependency analysis (Section 4.3) result file and makes variables in the related parameter set symbolic as well. Other parameters’ program variables get the concrete values from the configuration file. Besides parameters, Violet can also make program input symbolic to explore its influence on the configuration’s performance impact. This is done through either symbolic arguments (sym-args) or identifying the input program variables and inserting make_symbolic calls in the code.
4.5 Profile Execution Paths
To measure the symbolic parameters’ performance effect, Violet implements a tracer on top of the symbolic execution engine, specifically as a set of plugins on the S2E platform.
Measure Function Call Latency. We measure function call latency by capturing the call and return signals emitted by S2E during symbolic execution. To calculate the latency, a straightforward way is to maintain a stack of call record and pops the top element upon receiving a return signal. This algorithm assumes that the call/return signals are paired and the callee’s return signal comes before the caller’s. But we observe this assumption does not always hold under S2E. We use a safer method based on return addresses to calculate latency. In particular, the Violet tracer records the EIP register value, return address, and timestamp on each call and return signal. The records are stored in two lists. Later, the tracer matches call record list with return record list based on return address fields (Figure 11). The latency for a matched function call is the return record’s timestamp minus the call record’s timestamp. The total latency of each state (execution path) can be obtained from the latency of the root function call.
For multi-threaded programs, function calls from different threads can get mixed up. To address this issue, the Violet tracer stores the current thread id in each profile record and partitions the call and return lists by thread id.
Re-Construct Call Paths. The tracer records the function call profile to break down total latency and to enable differential critical path analysis (§4.6). To get the call chain relationship, instead of costly stack frame walk, the tracer uses a simple method with little overhead that just assigns each call record a unique incrementing cid. Later, the tracer reconstructs the call chain by iterating through all call records in order. If (1) call record A’s cid is larger than call record B’s cid, (2) the return address of A is larger than B’s EIP (the start address of that function), and (3) the difference of the two addresses is smallest among all other pairs (i.e., B’s start address is closest to the return address in A), then we assign A’s parentId to be B’s cid and update the current distance.
Measure Logical Costs. Besides absolute latency, we also measure a set of logical cost metrics by a similar method of capturing low-level signals from S2E. In particular, for each execution path, we measure the number of instructions, the number of system calls, the number of file I/O calls, the amount of I/O traffic, the number of synchronization operations, network calls, etc. These logical costs are useful to surface performance issues other than just long latency. They are also crucial for enabling extrapolation of the result to different settings. For example, if the Violet tracer finds out one execution path has a much higher number of write syscalls compared to other paths whereas their latencies are similar. This could be an artifact of the test server having a powerful hard disk or a large buffer cache. But the software might perform poorly in a different environment.
| Configuration Constraint | Cost | Workload Predicate |
|---|---|---|
| autocommit!=0 && flush_log_at_trx_commit==1 | , {log_write_buffil_flush}, 17K syscalls, 100 I/O insts, | sql_command==INSERT |
| autocommit!=0 && flush_log_at_trx_commit==2 | , {log_write_buf}, 16.9K syscalls | sql_command==INSERT |
| autocommit!=0 && flush_log_at_trx_commit!=1 && flush_log_at_trx_commit!=2 | , {}, 16.9K syscall | sql_command==INSERT |
| autocommit==0 | , {trx_mark_sql_stat_end}, 16.8K syscalls | sql_command==SELECT|| |
The Violet tracer maintains a separate performance profile for each execution path (state) so we can compare the performance effect of different paths. We also need to record the path constraints to identify the parameter combination and the class of input that leads to the execution path. The tracer records the final path constraint when an execution path terminates or it exceeds some user-specified cost threshold.
4.6 Analyze State Traces
Once the symbolic execution finishes, the Violet trace analyzer parses the performance traces. It then builds a cost table. Each row represents a state (path) that was explored in symbolic execution. The analyzer does a pair-wise comparison of performance in different rows. If the performance difference ratio exceeds a threshold (default 100%), the analyzer marks that state suspicious. The analyzer compares not only the absolute latency metric but also the collected logical metrics. Even if the latency difference does not exceed the threshold but some logical metric does, the analyzer still marks the state.
Not all pair comparisons are equally meaningful when the symbolic execution explored multiple symbolic variables. To elaborate, assume our target parameter is autocommit, which has a related parameter flush_log. Since both are made symbolic, one state could represent constraint autocommit==0 && flush_log==1 and another state could represent constraint autocommit==1 && flush_log==2. In this case, comparing the costs of these two states is not very meaningful.
The analyzer tries to compare state pairs that are most “similar” first. Determining the similarity of two paths can be challenging. We use a simple approach: in one state’s constraints formula, for each constraint involving a related parameter, if it also appears in the other state’s formula, the similarity count is incremented by one. This method is imprecise as it merely checks the appearances, not constraint equivalence. For our use cases, the inaccuracies are generally acceptable. Besides, the analyzer can compare all pairs first, surface the bad state-pairs, and then we can decide the meaningfulness of the suspicious pairs.
For each pair that has a significant performance difference, the analyzer computes the differential critical path. It first finds the longest common subsequence of the call chain records in the two states. Then it creates a diff trace that stores the common records with performance metrics subtracted, as well as the records that only appear in the slower state. The analyzer finally locates the call record (excluding entry) with the largest differential cost and constructs the critical call path based on the cid and parentId of the call records.
When Violet makes the input symbolic, the path constraints in each state will contain constraints about the input. The analyzer separates the input related constraints as input predicate. This is useful to tell what class of input can expose the potential performance issue for the combination of parameter values that satisfies the configuration constraint in a state. The final output from the Violet analyzer is the configuration performance impact model that consists of the raw cost table (Table 1) with configuration constraints, cost metrics, and input predicate for each state, the state pairs that have significant performance difference, and the differential critical paths.
4.7 Continuous Specious Config Checker
Violet provides a standalone checker tool to detect specious configuration. It leverages the configuration performance impact model from the analyzer and validates a concrete user configuration file. The checker tool supports three modes:
-
1.
Some config update introduces performance regression.
-
2.
Some default parameter is poor for users’ specific setup.
-
3.
Code upgrade or workload change make old setting poor.
For scenario 1, the checker references the cost table and locates the state(s) that have configuration constraints satisfying the updated parameter’ old value and the parameter’s new value. If the state pair has significant performance difference, the checker alerts the operators and generates a test case based on the input predicate for operators to confirm the performance regression. For scenario 2, the checker validates if the state that the default value lies in appears in some poor state-pair. If so, it means this default value potentially performs significantly worse than another value. For scenario 3, if the system code changes, Violet rebuilds the cost impact table. The checker then identifies if some state in the new table performs much worse compared to the old cost table. If workload changes, the checker validates if cost table rows that previously satisfy the input predicate perform worse compared to rows that satisfy the input predicate now.
5 Scaling Violet to Large Software
In this section, we describe the challenges and our solutions for scaling Violet to large software.
5.1 Choice of Symbolic Execution Engine
We initially build Violet on the KLEE [24] symbolic execution engine because it is widely used and convenient to experiment with. However, while KLEE works well on moderate-sized programs, it cannot handle large programs like MySQL. KLEE models the environment (POSIX runtime and libc) with simplified implementation. Large programs use many libc or system calls that are unimplemented or implemented partially/incorrectly, e.g., fcntl, pread, and socket. KLEE also does not support symbolic execution of multi-threaded programs. We spent several months patching KLEE to fix the environment model and add multi-threading support. When we were finally able to run MySQL with KLEE, it took 40 minutes to just pass initialization even without symbolic data.
We thus decided to switch to the S2E platform [26]. S2E uses the real environment within an entire stack (OS kernel and libraries). Executing large software thus would encounter almost no compatibility issues. In addition, S2E uses QEMU and dynamic binary translation to execute a target program. For instructions that access symbolic data, they are interpreted by the embedded KLEE engine; but instructions that access concrete data are directly executed on host CPU. Overall, while S2E’s choice of using real environment in symbolic execution in general means slower analysis compared to using simplified models like KLEE, executing concrete instructions on host CPU offsets that slowness and achieves significant speed-up. After migrating Violet to S2E and with some minor adjustments, we can start MySQL server within one minute.
5.2 Handle Complex Input Structure
Since specious configuration is often only triggered by certain input, Violet makes input symbolic besides configuration. For small programs, the input type is typically simple, e.g., an integer, a string, which is easy to be made symbolic. But large programs’ input can be complex structure like SQL queries. If we make the input variable symbolic, the program will be stuck in the input parsing code for a long time and the majority of the input generated is invalid. For example, we make input variable char *packet (32 bytes) in MySQL symbolic and execute it in S2E for 1 hour, which generates several hundred test cases, but none of which is a legal SQL query. Even after adding some additional constraints, the result is similar.
This problem is not unique to our problem domain. Compiler testing [57] or fuzzing [11] also faces this challenge of how to generate valid input to programs like C compiler or DBMS. We address this problem through a similar practice by introducing workload templates. Instead of having the parser figure out a valid structure, we pre-define a set of input templates that have valid structures. Then we parameterize the templates so that they are not fixed, e.g., the query type, insertion value, the number of queries, etc. In this way, we can make the workload template parameters symbolic.
5.3 Reduce Profiling Overhead
Profiling large programs can incur substantial overhead. We build Violet tracer using low-level signals emitted by S2E rather than intrusive instrumentation. Nevertheless, symbolic execution is demanding for performance analysis as the program runs much slower compared to native execution. Fortunately, Violet cares about the relative performance between different paths. We can still identify specious configuration if the relative differences roughly match the native execution, which we find is true for most cases. Violet conducts differential analyses to capture performance anomalies. We describe three additional optimizations in Violet tracer.
First, the Violet tracer controls the start and end of its function profiler. This is because if we enable the function profiler at the very beginning, it can be overwhelmed by lots of irrelevant function calls. We add APIs in the tracer and will start the tracer when the target system finishes initialization and stop the tracer when the system enters the shutdown phase.
Second, the tracer avoids guest memory accesses and on-the-fly calculation. Accessing memory in an execution state goes through the emulated MMU in QEMU. Violet tracer only accesses and stores key information (most from registers) about the call/return signals. It defers the record matching, call chain and latency calculation to path termination.
Third, Violet will disable state switching during latency tracking if necessary. Since the function profiler calculates the execution time by subtracting the return signal timestamp from call signal timestamp, if S2E switches to execute another state in between, the recorded latency will include the state switching cost. This in general does not cause serious problems because the costs occur in all states and roughly cancels out with our differential analysis. But in rare cases, the switching costs can distort the results. When this happens, Violet will force S2E to disable state switching.
5.4 Path Explosion and Complex Constraints
A common problem with symbolic execution is path explosion, especially when the symbolic value is used in library or system calls. In addition, some library calls with symbolic data yield complex constraints that make the symbolic execution engine spend a long time in solving the constraints.
Violet leverages a core feature in S2E, selective symbolic execution [26], to address this problem. Selective symbolic execution allows transition between concrete and symbolic execution when crossing some execution boundary, e.g., a system call. Violet uses the Strictly-Consistent Unit-Level Execution consistency model, which silently concretizes the symbolic value before entering the boundary and adds the concretized constraint to the symbolic value after exiting the boundary. This consistency model sacrifices completeness but it would not invalid the analysis result. To improve completeness, we add some relaxation rules in Violet without causing functionality errors: 1) if the library call does not add side effect, such as strlen/strcmp, we make the return value symbolic and remove the concretized constraint; 2) if the library call has side effect but does not hurt the functionality, such as printf, we directly remove the concretized constraint.
One issue we encounter with the S2E silent concretization is that its concretize API will only concretize the symbolic variable. The symbolic variable can taint other variables (make them symbolic) when it is assigned to these variables, but these tainted variables are not concretized during silent concretization. Having these tainted variables remain symbolic can add substantial overhead. We thus add a new API in S2E, concretizeAll, that concretizes not only the given symbolic variable but also its tainted variables. We implement this API by recording in each write operation a mapping from the symbolic expression to the target address in the memory object. Later when concretizeAll is called, we will look up the memory objects to find addresses that contain the same symbolic expression and also concretize them.
6 Implementation
We implement the major Violet components in C/C++. The Violet checker is implemented in Python. The Violet tracer is written as S2E plugins and leverages S2E’s existing LinuxMonitor plugin and FunctionMonitor plugin to capture low-level signals. The Violet static analyzer is built on top of LLVM framework [39]. The Violet trace analyzer is implemented as a standalone tool.
In function profiling, for efficiency, the tracer captures the addresses instead of names of invoked functions. This means the analyzer needs to resolve the addresses to names. The problem is that the virtual address of the target program can change in each run. We address this issue by modifying the ELF loader of the S2E Linux kernel to expose the load_bias. Then the tracer will record the offset from the load_bias. The analyzer can then use the offsets to resolve the names.
7 Evaluation
We evaluate Violet to answer several key questions:
-
•
How effective is Violet in detecting specious configuration?
-
•
Can Violet expose unknown specious configuration?
-
•
How useful is Violet’s checker to the user?
-
•
What is the performance of Violet?
| Software | Desc. | Arch. | Version | SLOC |
Configs |
Hook |
|---|---|---|---|---|---|---|
| MySQL | Database | Multi-thd | 5.5.59 | 1.2M | 330 | 197 |
| Postgres | Database | Multi-proc | 11.0 | 843K | 294 | 165 |
| Apache | Web server | Multi-proc-thd | 2.4.38 | 199K | 172 | 158 |
| Squid | Proxy server | Multi-thd | 4.1 | 178K | 327 | 96 |
| Id. | Application | Configuration Name | Data Type | Description |
|---|---|---|---|---|
| c1 | MySQL | autocommit | Boolean | Determine whether all changes take effect immediately |
| c2 | MySQL | query_cache_wlock_invalidate | Boolean | Disable the query cache when after WRITE lock statement |
| c3 | MySQL | general_log | Boolean | Enable MySQL general log query |
| c4 | MySQL | query_cache_type | Enumeration | Method used for controlling the query cache type |
| c5 | MySQL | sync_binlog | Integer | Controls how often the MySQL server synchronizes binary log to disk |
| c6 | MySQL | innodb_log_buffer_size | Integer | Set the size of the buffer for transactions that have not been committed yet |
| c7 | PostgreSQL | wal_sync_method | Enumeration | Method used for forcing WAL updates out to disk |
| c8 | PostgreSQL | archive_mode | Enumeration | Force the server to swtich to a new WAL periodically and archive old WAL segments |
| c9 | PostgreSQL | max_wal_size | Integer | Maximum number of log file segments between automatic WAL checkpoints |
| c10 | PostgreSQL | checkpoint_completion_target | Float | Set a fraction of total time between checkpoints interval |
| c11 | PostgreSQL | bgwriter_lru_multiplier | Float | Set estimate of the number of buffers for the next background writing |
| c12 | Apache | HostNamelookup | Enumeration | Enables DNS lookups to log the host names of clients sending requests |
| c13 | Apache | Deny/Domain | Enum/String | Restrict access to the server based on hostname, IP address, or env variables |
| c14 | Apache | MaxKeepAliveRequests | Integer | Limits the number of requests allowed per connection |
| c15 | Apache | KeepAliveTimeOut | Integer | Seconds Apache will wait for a subsequent request before closing the connection |
| c16 | Squid | cache | String | Requests denied by this directive will not be stored in the cache |
| c17 | Squid | Buffered_logs | Integer | Whether to write access_log records ASAP or accumulate them in larger chunks |
The experiments are conducted on servers with Dual Processor of Intel Xeon E5-2630 (2.20GHz, 10 cores), 64 GB memory, 1 TB HDD running a Ubuntu 16.04. Since S2E engine runs in QEMU, we create a guest image of Debian 9.2.1 x86_64 with 4 GB memory for all the Violet tests.
7.1 Target Systems
We evaluate Violet on four popular and large (up to 1.2M SLOC) open-source software (Table 2): MySQL, PostgreSQL, Apache, and Squid. Violet can successfully analyze large multi-threaded programs (MySQL and Squid) as well as multi-process (PostgreSQL, Apache) programs.
The manual effort to use Violet on a target system is small, mainly required in two steps: (1) add configuration hooks (Section 4.1); (2) supply input templates (Section 5.2). The other steps in the workflow are automated.
Table 2 shows SLOC of the core hooks we add to the four systems. The hook size varies across systems. MySQL hooks are largest in size mainly because the system defines many (22) configuration types (Sys_var_*) so we need to add hook (about 7 SLOC) to each type. But the overall effort for different systems is consistently small. The changes are typically contained in a few places with other codes untouched. In addition, most software rarely modifies the configuration data structure design, so the effort can carry through versions.
For (2), users typically already have some workload profiles. The effort needed is to parameterize and organize them into our format. In our experience with the four evaluated software, this process is straightforward and can be done in a few hours.
7.2 Detecting Known Specious Config
To evaluate the effectiveness of Violet we collect 17 real-world specious configuration cases from the four systems. Table 3 lists the case descriptions. We collect them from ServerFault [14], dba [4], blog posts [12], and prior work [19].
For each case, Violet analyzes the related parameters and makes the config set and workload parameters symbolic and symbolically executes the system. Each test produces a trace. The Violet trace analyzer checks if any state performs significantly worse than other states. A case is detected when Violet explores at least one poor state in its trace and the poor states enclose the problematic parameter value(s).
| Id. |
Detect |
Explored States | Poor States |
Related
|
Cost Metrics | Analysis Time | Max Diff |
|---|---|---|---|---|---|---|---|
| c1 | ✓ | 88 | 17 | 4 | Latency | 14.5 | |
| c2 | ✓ | 24 | 3 | 1 | Lat.&Sync. | 15.7 | |
| c3 | ✓ | 224 | 88 | 5 | I/O | 2.0 | |
| c4 | ✓ | 787 | 100 | 2 | Latency | 11.7 | |
| c5 | ✓ | 494 | 44 | 3 | Latency | 29.9 | |
| c6 | ✓ | 891 | 12 | 5 | I/O | 3.0 | |
| c7 | ✓ | 89 | 7 | 2 | Lat.&I/O | 4.3 | |
| c8 | ✓ | 195 | 8 | 3 | Latency | 1.8 | |
| c9 | ✓ | 110 | 2 | 3 | Lat.&I/O | 3.5 | |
| c10 | ✓ | 231 | 13 | 7 | Latency | 2.4 | |
| c11 | ✓ | 61 | 9 | 2 | Latency | 8.6 | |
| c12 | ✓ | 34 | 4 | 2 | Latency | 3.8 | |
| c13 | ✓ | 50 | 5 | 3 | Latency | 8.9 | |
| c14 | ✗ | 112 | 0 | 2 | Latency | 0.6 | |
| c15 | ✗ | 23 | 0 | 3 | Latency | 0.2 | |
| c16 | ✓ | 81 | 1 | 0 | Latency | 4.3 | |
| c17 | ✓ | 3 | 1 | 0 | I/O | 2.0 |
In total, Violet detects 15 of the 17 cases. Table 4 shows the detailed result. For each case, Table 4 lists the total states Violet explored, poor states, related configs, and maximum cost metric differences. The explored states include forks from related configurations and the symbolic workload parameters. In most cases, the specious configuration requires specific related settings to expose the issue. The high success rate of Violet comes from its in-vivo multi-path profiling, dependency analysis, and differential performance analysis.
Another aspect to interpret the high success rate is that the 17 cases we collect admittedly have a selection bias—all cases cause severe performance impact. This is reflected in the max diff column of the cases Violet detects. If a misconfiguration only introduces mild performance issue, Violet may miss it due to the noises in symbolic execution. However, Violet’s goal is to exactly target specious configuration that has severe performance impact, rather than suboptimal configurations.
Violet misses two Apache cases, c14 and c15. Triggering them requires enabling the HTTP KeepAlive feature in the workload. In our Apache workload templates, this feature is not part of the workload parameters and is disabled by default.
We describe two representative cases. MySQL c1 is the running example in the paper. Violet identifies four related parameters like flush_at_trx_commit that together affect the performance. Violet explores 88 states in total, 4 of which are identified as poor. The configuration constraints of the four poor states describe the combination conditions for the 5 parameters to incur significant cost.
In c6, innodb_log_buffer_size controls the size of the log buffer. Violet identifies that the innodb_flush_method, autocommit, flush_at_trx_commit and two other parameters are related. Interestingly, in this case, Violet determines the latency metric difference is not significant, but the I/O logical cost metric is. Specifically, Violet explores almost 100 different queries, and finds that in states with queries involving large row changes and a relatively small buffer size, the I/O metric—pwrite operations—is much larger than other states.
7.3 Comparison with Testing
We evaluate the 17 cases with testing as well. We use popular benchmark tools sysbench and ab. For each case, we set the target parameter and related parameters with concrete values from one of the poor states Violet discovers. We then enumerate the standard workloads in the benchmark to test the software with the configurations. The performance numbers produced by testing are absolute, which are difficult to judge. We use configurations from the good states and collect performance with them as a baseline. If the performance difference ratio exceeds 100% (the same threshold used by Violet), we consider the case detected. In total, testing detects 10 cases, with a median time of 25 minutes.
Violet is not meant to replace configuration performance testing. Given enough time and resources, exhaustive performance testing can in theory expose all cases. But in practice, users cannot afford exhaustive testing. Violet systematically explores program states while avoids the redundancy in exhaustive testing (Section 3.1). Even though in some cases, as shown in Table 4, the Violet analysis time is relatively long, Violet is exploring the performance effects thoroughly, including the combination effect with other parameters and input. Therefore, the performance impact models Violet derives are complete. Once the exploration is done, the outcome can be reused many times while testing needs to be done repeatedly.
Another challenge with testing is how to judge whether the absolute performance results of a configuration are good or not. Our experiment above assumes the existence of a good configuration, which users may not have. Violet, in comparison, conducts in-vivo, multi-path analysis, so it naturally has baselines to compare with. The analysis enables Violet to collect deeper logical metrics, which can reveal performance issues that end-to-end metrics may not find.
7.4 Exposing Unknown Specious Config
Besides detecting know specious configuration, we evaluate whether Violet can expose unknown specious configuration. We first apply Violet to derive performance models for all parameters if possible (Section 7.6). We then analyze the results for parameters not in the known case dataset (Section 7.2). We manually check (1) if some parameter’s default or suggested value is in a poor state; (2) if a poor state of a parameter contains related parameters that are undocumented. The manual inspection involves checking the Violet output, the descriptions in the official documentation and tuning guide, and running tests to confirm, which takes significant time. We only carefully inspect a subset of the results.
The four systems are very mature and maintain high-quality documentations, so it is not easy to find many errors in them. Indeed, a significant portion of the poor states we examined turns out to be already documented. But still we have identified 9 parameters that have potential bad performance effect and the documentation is incomplete or incorrect.
| Sys | Configuration | Performance Impact |
|---|---|---|
| Postgres | vacuum_cost | Default value is significantly worse |
| _delay | than low values for write workload. | |
| Postgres | archive_timeout | Small values cause performance penalties. |
| Postgres | random_page_cost | Values larger than 1.2 (default 4.0) cause bad perf on SSD for join queries. |
| Postgres | log_statement | Setting mod causes bad perf. for write workload when synchronous_commit is off. |
| Postgres | parallel_leader | Enabling it can cause select join query |
| _participation | to be slow if random_page_cost is high. | |
| MySQL | optimizer_search | Default value would cause bad performance |
| _depth | for join queries | |
| MySQL | concurrent_insert | Enable concurrent_insert would cause bad performance for read workload |
| Squid | ipcache_size | The default value is relatively small and may cause performance reduction |
| Squid | cache_log | Enable cache_log with higher debug_option would cause extra I/O |
Table 5 lists the cases. For example, our analysis of vacuum_cost_delay shows that a higher value can incur large cost for write-intensive workloads. But the default value is . For log_statement, Violet discovers multiple poor states. The official document does not mention its performance impact. Our analysis revels that setting it to mod causes performance issues for write workloads when synchronous_commit is off. Violet finds some unexpected parameter combination that leads to bad performance, e.g., parallel_leader_participation and random_page_cost.
We reported our findings to the developers. Seven reports are confirmed. Three lead to documentation or Wiki fixes. For some confirmed cases, developers do not fix them because they assume users should know the performance implications or such performance description should not be put in the reference manual (e.g., “There are a lot of interactions between settings, and mentioning all of them would be impossible”).
7.5 User Study on Violet Checker
To understand whether Violet checker can help users catch specious configuration, we conduct a controlled user study with 20 programmers (no authors are included). Fourteen of them are undergraduate students who have taken the database class. Six are graduate students. They all have decent experience with database and Unix tools. We further give a tutorial of the MySQL and PostgreSQL background, the descriptions of the common configuration parameters, and available benchmark tools they can use. We acknowledge that the representativeness of our study participants may not be perfect.
We use 6 target parameters from MySQL and PostgreSQL. For each parameter, we prepare two versions of configuration files. In one version (bad), the parameter is set with the poor value and the related parameters are also set appropriately that would cause bad performance impact under a workload. In another version (good), we set the target parameter to a good value, or we change the related parameter values, or we tell users the production workloads are limited to certain types (e.g., read-intensive). So in total, we have 12 cases.
Each participant is given 6 configuration files. They need to make a judgment regarding whether the configuration file would cause potential performance issue. Since a configuration file contains many parameters, we explicitly tell users the set of parameters they can focus on, which disadvantages Violet because users in practice do not have this luxury.
The participants are randomly assigned into two groups: group A (w/ Violet checker help) and group B (w/o checker help). Users in group B can run any tools to help them make the decision. We also tell group A users that they do not have to trust the checker output and are free to run other tools.
Figure 14 shows the accuracy of user study result for each group. Overall, programmers w/o Violet checker’s help have 30% misjudgment rate while programmers with Violet checker’s help only have 5% misjudging rate. Figure 14 shows the time for making a judgment. On average, participants took 20.7% less time (9.6 minutes versus 12.1 minutes) to make a judgment when they were provided with Violet checker.
7.6 Coverage of Analyzed Configs
| MySQL | PostgreSQL | Apache | Squid | Total |
| 169 (51.2%) | 210 (71.4%) | 51 (29.6%) | 176 (53.3%) | 606 (53.9%) |
We conduct a coverage test of Violet by applying Violet on the four software and try to derive performance models for as many parameters as possible. We manually filter the parameters that are not related to performance based on the parameter description (e.g., listen_addresses). Table 6 shows the result. Violet successfully derives models for a total of 606 parameters. The average ratio of analyzed parameters over the total number of parameters for software is 53.9%. The average number of states explored in these generated models is 23. Apache and Squid have a relatively small number of parameters analyzed. This is because the configuration program variables in the two systems are set via complex function pointers and spread in different modules, which make it challenging to write hooks to enumerate all of them (Section 4.1). For parameters that Violet did not generate impact models, one reason is that they are used in code for special environment. Another reason is that the data type of some parameter is too complex (e.g., timezone) to make symbolic.
7.7 Accuracy of Violet Profiling
| parA | parB | parC | parD | ||||||||||
|---|---|---|---|---|---|---|---|---|---|---|---|---|---|
| =0 | =1 | =0 | =1 | =0 | =1 | =2 | =0 | =1 | =2 | ||||
| Violet | 12.0 | 23.0 | 9.81 | 10.19 | 9.05 | 10.92 | 10.74 | 4.68 | 4.77 | 5.27 | |||
| S2E | 10.8 | 21.0 | 7.67 | 8.94 | 6.24 | 7.77 | 7.92 | 3.57 | 3.91 | 4.59 | |||
| Native | 0.7 | 1.2 | 0.55 | 0.77 | 0.45 | 0.63 | 0.67 | 0.07 | 0.07 | 0.08 | |||
Since symbolic execution can introduce significant overhead, it seems that the latency traced by the symbolic engine cannot be very accurate. However, we observe that while the absolute latency under symbolic execution is indeed much larger than native execution, the comparative results between different paths are usually similar. We add a micro-benchmark experiment to test the latency measurement from Violet, vanilla S2E and native mode. Table 7 shows the result from four representative parameters. Take parA as an example. The latency results from Violet and S2E are much later than native result. But the ration of setting 1 to setting 0 is similar: 1.92 for Violet, 1.94 for S2E, and 1.71 for native execution.
7.8 False Positives
The Violet differential performance analysis in general can absorb the performance noises in symbolic execution. But we observe some false positives in the Violet performance analysis output. For example, S2E somehow has a delay in emitting the return signal of some system call functions like gettimeofday, which causes Violet to record inaccurate latency. These false positives are relatively easy to suppress by discounting the cost of the noisy instructions.
We manually inspect the performance models of 10 random parameters that Violet analyzes in the coverage experiment. We check the accuracy of the reported bad states by verifying them with sysbench. The false positive rate is 6.4%.
7.9 Performance
We measure the Violet analysis time for the 471 parameters in the coverage experiment (Section 7.6). Figure 14 shows the result in boxplots. The median analysis times are (MySQL), (PostgreSQL), (Apache), and (Squid). On average, the log analyzer time is 68s. As explained in Section 7.3, even though for some parameters the analysis time is relatively long, the benefit is that Violet derives a thorough performance model for different settings of the target parameter and the combined effect with other parameters and input. The outcome can be re-used many times by the Violet checker. With the performance models, the checker time is fast. On average the checking only takes 15.7 seconds.
7.10 Sensitivity Analysis
Violet uses a differential threshold (default 100%) to detect the suspicious state from the trace log (Section 4.6). We evaluate the sensitivity of this threshold. We measure how many poor state pairs Violet reports when analyzing a parameter under threshold . Then for each poor state pair Violet reports, we run benchmarks on the native machine to check whether it is false positive (performance difference is ).
Figure 15 shows the result for six representative parameters. We can see that if the threshold is set to a relatively lower value, the number of detected specious configuration can dramatically increase, but at cost of higher false positives.
8 Limitations
Violet has several limitations that we plan to address in future work. First, Violet explores the configuration under normal conditions. Some specious configuration may be only used in error handling. Exploring their effect requires specific faults. One solution is to combine symbolic execution with fault injection. Another potential solution is to use under-constrained symbolic execution [45]. Second, our handling of floating point type parameters is imperfect due to limited support in existing symbolic execution engines. We currently explores float parameters by choosing from a set of concrete floating-point values in the valid value range. Third, we use concrete (the host) hardware in the symbolic execution, which may not capture specious configuration that is only visible in specific hardware. We rely on logical cost metrics to surface such issues. Lastly, Violet does not work on distributed systems.
9 Related Work
Misconfiguration detection and diagnosis. A wide body of work has been done to detect and troubleshoot misconfiguration [51, 53, 49, 30, 47, 27, 30, 22, 20, 60, 21, 62]. For example, ConfAid [21] uses dynamic taint tracking to locate configuration errors that lead to failures; Strider [51] and PeerPressure [49] take statistical approaches to identify misconfiguration; EnCore [62] enhances statistical learning with environment information to detect misconfiguration.
These solutions mainly target illegal configuration and have limited effects on specious configuration. X-ray [19] targets performance-related misconfiguration. Our work is inspired by X-ray and is complementary to it. X-ray is a diagnosis tool and uses deterministic record and replay of a specific program execution. Violet focuses on detecting specious configuration beforehand. Violet uses symbolic execution to explore the performance effect in multiple execution paths. Violet is more suitable for performance tuning/bug finding, whereas X-ray is better at diagnosing misconfiguration that has occurred.
LearnConf [40] is recently proposed to detect performance misconfiguration using static analysis. LearnConf summarizes common code patterns of performance misconfiguration and uses simple formulas to approximate the performance effect, e.g., linear relationship. It uses static analysis to identify these patterns and derive parameters to the formulas. The solution is simpler compared to Violet. But its completeness is limited because obtaining comprehensive code patterns is hard. Moreover, the performance effect is often quite complex, which cannot be accurately captured by simple formulas. Static analysis also suffers from well-known inaccuracies for large software. Violet explores a configuration’s influence in the code without requiring or being limited by common patterns; it analyzes the performance effect by executing the code. Additionally, Violet explores the performance impact of input and a large set of related configurations together.
Performance tuning of configuration. There is a wealth of literature on automatic performance tuning, e.g., [50, 61, 33, 58, 54, 43, 63]. They work basically by devising an approximate function between configuration values and the performance metrics measured through testing. While tunable parameters are common specious configuration, performance tuning and detecting specious configuration are two directions. The former searches for settings that yield the best performance, while the latter identifies settings that lead to extremely poor performance. Violet takes an analytical approach to derive configuration performance impact model from the code, instead of exhaustive testing. The result from our in-vivo, multi-path analysis is also less susceptible to noises and enables extrapolation to different contexts.
System resilience to misconfiguration. ConfErr [36] uses a human error model to inject misconfiguration. SPEX [56] uses static analysis to extract configuration constraints and generates misconfiguration by violating these constraints. The injected misconfigurations are illegal values that can trigger explicit errors like crash. Specious configuration typically does not cause explicit errors.
Configuration languages. Better configuration languages can help avoid misconfiguration. Several works make such efforts [28, 41, 23, 29, 25, 46, 34]. PRESTO [29] proposes a template language to generate device-native configuration. ConfValley [34], proposes a declarative validation language for generic software configuration. These new designs do not prevent specious configuration from being introduced.
Symbolic execution in performance analysis. Symbolic execution [37, 24] is typically used for finding functional bugs. S2E [26] is the first to explore performance analysis in symbolic execution as one use case to demonstrate the generality of its platform. The Violet tracer leverages the advances made by S2E, particularly its low-level signals, to build our custom profiling methods (Section 4.5). Our tracer also addresses several unique challenges to reduce the performance analysis overhead (Section 5.3). Bolt [35] extracts performance contracts of Network Function code with symbolic execution. Violet targets general-purpose software and analyzes performance effect of system configuration.
10 Conclusion
Specious configuration is a common and challenging problem for production systems. We propose an analytical approach to tackle this problem and present a toolchain called Violet. Violet uses symbolic execution and program analysis to systematically reason about the performance effect of configuration from code. The derived configuration performance impact model can be used for subsequent detections of specious configuration. We successfully apply Violet on four large system software and detect 15 out of 17 real-world specious configuration cases. Violet exposes 9 unknown specious configuration, 7 of which are confirmed by developers.
Acknowledgments
We would like to thank our shepherd, Jason Flinn, and the anonymous OSDI reviewers for their thoughtful comments. We appreciate the discussion and suggestions from Xi Wang. We thank Varun Radhakrishnan and Justin Shafer for their contributions to the Violet tool and study cases. We thank our user-study participants and the open-source developers who responded to our requests. We also thank the S2E authors, especially Vitaly Chipounov for maintaining the S2E platform and answering our questions. We thank Chunqiang Tang for the prior collaboration that provided early motivation for this work. This work is supported by the NSF CRII grant CNS-1755737 and partly by NSF grant CNS-1910133.
References
- [1] Amazon AWS S3 outage for several hours on February 28th, 2017. https://aws.amazon.com/message/41926.
- [2] Amazon EC2 and RDS service disruption on April 21st, 2011. http://aws.amazon.com/message/65648.
- [3] AWS service outage on October 22nd, 2012. https://aws.amazon.com/message/680342.
- [4] Database administrators. https://dba.stackexchange.com.
- [5] Facebook global outage for 2.5 hours on September 23rd, 2010. https://www.facebook.com/notes/facebook-engineering/more-details-on-todays-outage/431441338919.
- [6] Google API infrastructure outage on April 30th, 2013. http://googledevelopers.blogspot.com/2013/05/google-api-infrastructure-outage_3.html.
- [7] Google compute engine incident #16007. https://status.cloud.google.com/incident/compute/16007?post-mortem.
- [8] Google service outage on January 24th, 2014. http://googleblog.blogspot.com/2014/01/todays-outage-for-several-google.html.
- [9] Microsoft Azure storage disruption in US south on December 28th, 2012. http://blogs.msdn.com/b/windowsazure/archive/2013/01/16/details-of-the-december-28th-2012-windows-azure-storage-disruption-in-us-south.aspx.
- [10] Microsoft Azure storage disruption on February 22nd, 2013. http://blogs.msdn.com/b/windowsazure/archive/2013/03/01/details-of-the-february-22nd-2013-windows-azure-storage-disruption.aspx.
- [11] Oss-fuzz: Continuous fuzzing for open source software. https://github.com/google/oss-fuzz.
- [12] Percona blogs. https://www.percona.com/blog.
- [13] RDS MySQL insights: Top query "commit". https://serverfault.com/questions/1029595/rds-mysql-insights-top-query-commit.
- [14] Serverfault. https://serverfault.com.
- [15] Slow InnoDB insert/update. https://www.serveradminblog.com/2014/01/slow-innodb-insertupdate/.
- [16] Sysbench. https://github.com/akopytov/sysbench.
- [17] Cisco loses customer data in Meraki cloud muckup due to misconfiguration. https://www.theregister.co.uk/2017/08/06/cisco_meraki_data_loss, Aug 6th, 2017.
- [18] Amazon. AWS service outage on December 24th, 2012. http://aws.amazon.com/message/680587.
- [19] M. Attariyan, M. Chow, and J. Flinn. X-ray: Automating root-cause diagnosis of performance anomalies in production software. In Proceedings of the 10th USENIX Conference on Operating Systems Design and Implementation, OSDI’12, pages 307–320, 2012.
- [20] M. Attariyan and J. Flinn. Using causality to diagnose configuration bugs. In Proceedings of the 2008 USENIX Annual Technical Conference, ATC’08, pages 281–286, 2008.
- [21] M. Attariyan and J. Flinn. Automating configuration troubleshooting with dynamic information flow analysis. In Proceedings of the 9th USENIX Conference on Operating Systems Design and Implementation, OSDI’10, pages 1–11, 2010.
- [22] L. Bauer, S. Garriss, and M. K. Reiter. Detecting and resolving policy misconfigurations in access-control systems. In Proceedings of the 13th ACM Symposium on Access Control Models and Technologies, SACMAT ’08, pages 185–194, 2008.
- [23] R. Beckett, R. Mahajan, T. Millstein, J. Padhye, and D. Walker. Don’t mind the gap: Bridging network-wide objectives and device-level configurations. In Proceedings of the 2016 ACM SIGCOMM Conference, SIGCOMM ’16, pages 328–341, Florianopolis, Brazil, 2016.
- [24] C. Cadar, D. Dunbar, and D. Engler. KLEE: Unassisted and automatic generation of high-coverage tests for complex systems programs. In Proceedings of the 8th USENIX Conference on Operating Systems Design and Implementation, OSDI’08, pages 209–224, San Diego, California, 2008.
- [25] X. Chen, Y. Mao, Z. M. Mao, and J. Van der Merwe. Declarative configuration management for complex and dynamic networks. In Proceedings of the 6th International Conference, Co-NEXT ’10, pages 6:1–6:12, 2010.
- [26] V. Chipounov, V. Kuznetsov, and G. Candea. S2e: A platform for in-vivo multi-path analysis of software systems. In Proceedings of the Sixteenth International Conference on Architectural Support for Programming Languages and Operating Systems, ASPLOS XVI, pages 265–278, Newport Beach, California, USA, 2011.
- [27] T. Das, R. Bhagwan, and P. Naldurg. Baaz: A system for detecting access control misconfigurations. In Proceedings of the 19th USENIX Conference on Security, USENIX Security’10, pages 11–11, 2010.
- [28] J. DeTreville. Making system configuration more declarative. In Proceedings of the 10th Conference on Hot Topics in Operating Systems, HOTOS’05, pages 11–11, 2005.
- [29] W. Enck, P. McDaniel, S. Sen, P. Sebos, S. Spoerel, A. Greenberg, S. Rao, and W. Aiello. Configuration management at massive scale: System design and experience. In Proceedings of the 2007 USENIX Annual Technical Conference, ATC’07, pages 6:1–6:14, 2007.
- [30] N. Feamster and H. Balakrishnan. Detecting BGP configuration faults with static analysis. In Proceedings of the 2nd Conference on Symposium on Networked Systems Design & Implementation, NSDI’05, pages 43–56, 2005.
- [31] Google. Twilio billing incident post-mortem: Breakdown, analysis and root cause. https://www.twilio.com/blog/2013/07/billing-incident-post-mortem-breakdown-analysis-and-root-cause.html.
- [32] J. Gray. Why do computers stop and what can be done about it? In Proc. Symposium on Reliability in Distributed Software and Database Systems, pages 3–12, 1986.
- [33] H. Herodotou, H. Lim, G. Luo, N. Borisov, L. Dong, F. B. Cetin, and S. Babu. Starfish: A self-tuning system for big data analytics. In In CIDR, pages 261–272, 2011.
- [34] P. Huang, W. J. Bolosky, A. Singh, and Y. Zhou. ConfValley: A systematic configuration validation framework for cloud services. In Proceedings of the Tenth European Conference on Computer Systems, EuroSys ’15, pages 19:1–19:16, Bordeaux, France, 2015.
- [35] R. Iyer, L. Pedrosa, A. Zaostrovnykh, S. Pirelli, K. Argyraki, and G. Candea. Performance contracts for software network functions. In Proceedings of the 16th USENIX Conference on Networked Systems Design and Implementation, NSDI’19, page 517–530, Boston, MA, USA, 2019.
- [36] L. Keller, P. Upadhyaya, and G. Candea. ConfErr: A tool for assessing resilience to human configuration errors. In Proceedings of the 38th International Conference on Dependable Systems and Networks, DSN’08, pages 157–166, 2008.
- [37] J. C. King. Symbolic execution and program testing. Commun. ACM, 19(7):385–394, July 1976.
- [38] N. Kushman and D. Katabi. Enabling configuration-independent automation by non-expert users. In Proceedings of the 9th USENIX Conference on Operating Systems Design and Implementation, OSDI’10, pages 1–10, 2010.
- [39] C. Lattner and V. Adve. LLVM: A compilation framework for lifelong program analysis & transformation. In Proceedings of the 2004 International Symposium on Code Generation and Optimization, CGO ’04, pages 75–, Palo Alto, California, 2004.
- [40] C. Li, S. Wang, H. Hoffmann, and S. Lu. Statically inferring performance properties of software configurations. In Proceedings of the Fifteenth European Conference on Computer Systems, EuroSys ’20, Heraklion, Greece, 2020.
- [41] B. T. Loo, J. M. Hellerstein, I. Stoica, and R. Ramakrishnan. Declarative routing: Extensible routing with declarative queries. In Proceedings of the 2005 Conference on Applications, Technologies, Architectures, and Protocols for Computer Communications, SIGCOMM ’05, pages 289–300, 2005.
- [42] D. Oppenheimer, A. Ganapathi, and D. A. Patterson. Why do Internet services fail, and what can be done about it? In Proceedings of the 4th Conference on USENIX Symposium on Internet Technologies and Systems (USITS), Seattle, WA, Mar. 2003.
- [43] T. Osogami and T. Itoko. Finding probably better system configurations quickly. In Proceedings of the Joint International Conference on Measurement and Modeling of Computer Systems, SIGMETRICS ’06/Performance ’06, pages 264–275, Saint Malo, France, 2006.
- [44] A. Rabkin and R. Katz. How Hadoop clusters break. IEEE Softw., 30(4):88–94, July 2013.
- [45] D. A. Ramos and D. Engler. Under-constrained symbolic execution: Correctness checking for real code. In Proceedings of the 24th USENIX Conference on Security Symposium, SEC’15, page 49–64, Washington, D.C., 2015.
- [46] A. Schüpbach, A. Baumann, T. Roscoe, and S. Peter. A declarative language approach to device configuration. In Proceedings of the 6th International Conference on Architectural Support for Programming Languages and Operating Systems, ASPLOS’11. ACM, March 2011.
- [47] Y.-Y. Su, M. Attariyan, and J. Flinn. AutoBash: Improving configuration management with operating system causality analysis. In Proceedings of Twenty-first ACM SIGOPS Symposium on Operating Systems Principles, SOSP ’07, pages 237–250, 2007.
- [48] C. Tang, T. Kooburat, P. Venkatachalam, A. Chander, Z. Wen, A. Narayanan, P. Dowell, and R. Karl. Holistic configuration management at facebook. In Proceedings of the 25th Symposium on Operating Systems Principles, SOSP ’15, pages 328–343, Monterey, California, 2015.
- [49] H. J. Wang, J. C. Platt, Y. Chen, R. Zhang, and Y.-M. Wang. Automatic misconfiguration troubleshooting with PeerPressure. In Proceedings of the 6th Conference on Symposium on Opearting Systems Design & Implementation, OSDI’04, pages 17–17, 2004.
- [50] S. Wang, C. Li, H. Hoffmann, S. Lu, W. Sentosa, and A. I. Kistijantoro. Understanding and auto-adjusting performance-sensitive configurations. In Proceedings of the Twenty-Third International Conference on Architectural Support for Programming Languages and Operating Systems, ASPLOS ’18, page 154–168, Williamsburg, VA, USA, 2018.
- [51] Y.-M. Wang, C. Verbowski, J. Dunagan, Y. Chen, H. J. Wang, C. Yuan, and Z. Zhang. Strider: A black-box, state-based approach to change and configuration management and support. In Proceedings of the 17th USENIX Conference on System Administration, LISA ’03, pages 159–172, 2003.
- [52] X. Wei, S. Shen, R. Chen, and H. Chen. Replication-driven live reconfiguration for fast distributed transaction processing. In 2017 USENIX Annual Technical Conference (USENIX ATC 17), ATC 17, pages 335–347. USENIX Association, July 2017.
- [53] A. Whitaker, R. S. Cox, and S. D. Gribble. Configuration debugging as search: Finding the needle in the haystack. In Proceedings of the 6th Conference on Symposium on Opearting Systems Design & Implementation, OSDI’04, pages 6–6, 2004.
- [54] B. Xi, Z. Liu, M. Raghavachari, C. H. Xia, and L. Zhang. A smart hill-climbing algorithm for application server configuration. In Proceedings of the 13th International Conference on World Wide Web, WWW ’04, pages 287–296, New York, NY, USA, 2004.
- [55] T. Xu, X. Jin, P. Huang, Y. Zhou, S. Lu, L. Jin, and S. Pasupathy. Early detection of configuration errors to reduce failure damage. In Proceedings of the The 12th USENIX Symposium on Operating Systems Design and Implementation, OSDI ’16, November 2016.
- [56] T. Xu, J. Zhang, P. Huang, J. Zheng, T. Sheng, D. Yuan, Y. Zhou, and S. Pasupathy. Do not blame users for misconfigurations. In Proceedings of the Twenty-Fourth ACM Symposium on Operating Systems Principles, SOSP ’13, pages 244–259, 2013.
- [57] X. Yang, Y. Chen, E. Eide, and J. Regehr. Finding and understanding bugs in C compilers. In Proceedings of the 32nd ACM SIGPLAN Conference on Programming Language Design and Implementation, PLDI ’11, page 283–294, San Jose, California, USA, 2011.
- [58] T. Ye and S. Kalyanaraman. A recursive random search algorithm for large-scale network parameter configuration. In Proceedings of the 2003 ACM SIGMETRICS International Conference on Measurement and Modeling of Computer Systems, SIGMETRICS ’03, pages 196–205, San Diego, CA, USA, 2003.
- [59] Z. Yin, X. Ma, J. Zheng, Y. Zhou, L. N. Bairavasundaram, and S. Pasupathy. An empirical study on configuration errors in commercial and open source systems. In Proceedings of the Twenty-Third ACM Symposium on Operating Systems Principles, SOSP ’11, pages 159–172, 2011.
- [60] D. Yuan, Y. Xie, R. Panigrahy, J. Yang, C. Verbowski, and A. Kumar. Context-based online configuration-error detection. In Proceedings of the 2011 USENIX Conference on USENIX Annual Technical Conference, ATC’11, pages 28–28, 2011.
- [61] J. Zhang, Y. Liu, K. Zhou, G. Li, Z. Xiao, B. Cheng, J. Xing, Y. Wang, T. Cheng, L. Liu, and et al. An end-to-end automatic cloud database tuning system using deep reinforcement learning. In Proceedings of the 2019 International Conference on Management of Data, SIGMOD ’19, page 415–432, Amsterdam, Netherlands, 2019.
- [62] J. Zhang, L. Renganarayana, X. Zhang, N. Ge, V. Bala, T. Xu, and Y. Zhou. EnCore: Exploiting system environment and correlation information for misconfiguration detection. In Proceedings of the 19th International Conference on Architectural Support for Programming Languages and Operating Systems, ASPLOS ’14, pages 687–700, 2014.
- [63] Y. Zhu, J. Liu, M. Guo, Y. Bao, W. Ma, Z. Liu, K. Song, and Y. Yang. BestConfig: Tapping the performance potential of systems via automatic configuration tuning. In Proceedings of the 2017 Symposium on Cloud Computing, SoCC ’17, page 338–350, Santa Clara, California, 2017.