Freezing of molecular rotation in a paramagnetic crystal studied by 31P NMR
Abstract
We present a detailed 31P nuclear magnetic resonance (NMR) study of the molecular rotation in the compound [Cu(pz)2(2-HOpy)2](PF6)2, where pz = C4H4N2 and 2-HOpy = C5H4NHO. Here, a freezing of the PF6 rotation modes is revealed by several steplike increases of the temperature-dependent second spectral moment, with accompanying broad peaks of the longitudinal and transverse nuclear spin-relaxation rates. An analysis based on the Bloembergen-Purcell-Pound (BPP) theory quantifies the related activation energies as = 250 and 1400 K. Further, the anisotropy of the second spectral moment of the 31P absorption line was calculated for the rigid lattice, as well as in the presence of several sets of PF6 reorientation modes, and is in excellent agreement with the experimental data. Whereas the anisotropy of the frequency shift and enhancement of nuclear spin-relaxation rates is driven by the molecular rotation with respect to the dipole fields stemming from the Cu ions, the second spectral moment is determined by the intramolecular interaction of nuclear 19F and 31P moments in the presence of the distinct rotation modes.
pacs:
—I Introduction
The mechanism of enhanced nuclear spin relaxation, caused by thermally activated local field fluctuations at the nuclear Larmor frequency, was first introduced in 1947 [1] and elucidated in more details [2] by Bloembergen, Purcell, and Pound (BPP). Since then, the BPP mechanism of enhanced nuclear spin relaxation was observed in numerous material classes, such as cuprates [3, 4, 5, 6], iron-based superconductors [7, 8], spin glasses [9], low-dimensional quantum magnets [10, 11, 12], molecular magnets [13], organic conductors [14, 15], fullerene-based superconductors [16, 17], materials for lithium-ion batteries [18, 19, 20], nanostructured systems [21], and several others [22, 23, 24, 25, 26]. Despite the diverse physical origins of the local field fluctuations in these materials, the BPP formalism provides an adequate phenomenological description of the increased nuclear spin relaxation.
As a prominent example of the related phenomenology, the coexistence and interplay of unconventional superconductivity and low-dimensional magnetism is one of the most extensively investigated topics in the research of strongly correlated electron systems. In the iron-based and high- cuprate superconductors, low-energy spin dynamics are proposed as a key ingredient for the manifestation of superconductivity. Until now, it is an unresolved issue under which conditions these spin fluctuations may be constructive or rather detrimental to the formation of Cooper pairs [7]. In the case of glassy spin freezing, manifested as a peak of the nuclear spin-lattice relaxation rate, the behavior of the local field fluctuations can be understood as a slowing down of the characteristic electronic spin-fluctuation frequency with a Lorentzian spectral density of the fluctuations at the Larmor frequency [7, 8, 3, 4, 5, 6]. The fluctuation rate , describing a thermally activated process with a distribution of activation energies , indicates, e.g., glassy spin dynamics of unresolved nature in the cuprates [3, 4, 5, 6].
Low-dimensional quantum spin systems are model materials for the study of magnetic correlations that are also present in unconventional superconductors. In these materials, the spin-spin exchange coupling is often given by superexchange interactions. In molecular-based materials, there is a manifold of possibilities for the occurrence of thermally activated molecular motions [10]. These structural fluctuations may also affect the absolute values of the superexchange energies, as they relate to structural parameters of the exchange pathways. Therefore, a detailed knowledge of the molecular fluctuation parameters is of great interest and may represent an important input for density functional theory (DFT) calculations of the exchange constants and structural parameters.
A recent nuclear magnetic resonance (NMR) study of ultrafast molecular rotation in metal-organic frameworks proposes molecular-based compounds as promising candidates for the realization of smart materials and artificial molecular machines. Here, the utilization of molecular dynamics may lead to a tuning of the thermal, dielectric, or optical properties [26].
In view of this very rich phenomenology of BPP-type local field fluctuations, and despite of several decades of research, there is a strong need for model materials that allow for a well-defined investigation of spin relaxation caused by the presence of BPP-type field fluctuations. In particular, the study of rotation modes in single-crystalline materials allows us to probe the anisotropy of spectral properties and to perform a detailed analysis of the local field contributions at the nuclear sites.
In the present work, we investigate molecular motions in a paramagnetic single crystal of the recently synthesized molecular-based compound CuPOF [27] by a comprehensive NMR study of both the static and dynamic local field properties, including analysis by the BPP formalism as well as calculations of the spectral properties.
II Experimental
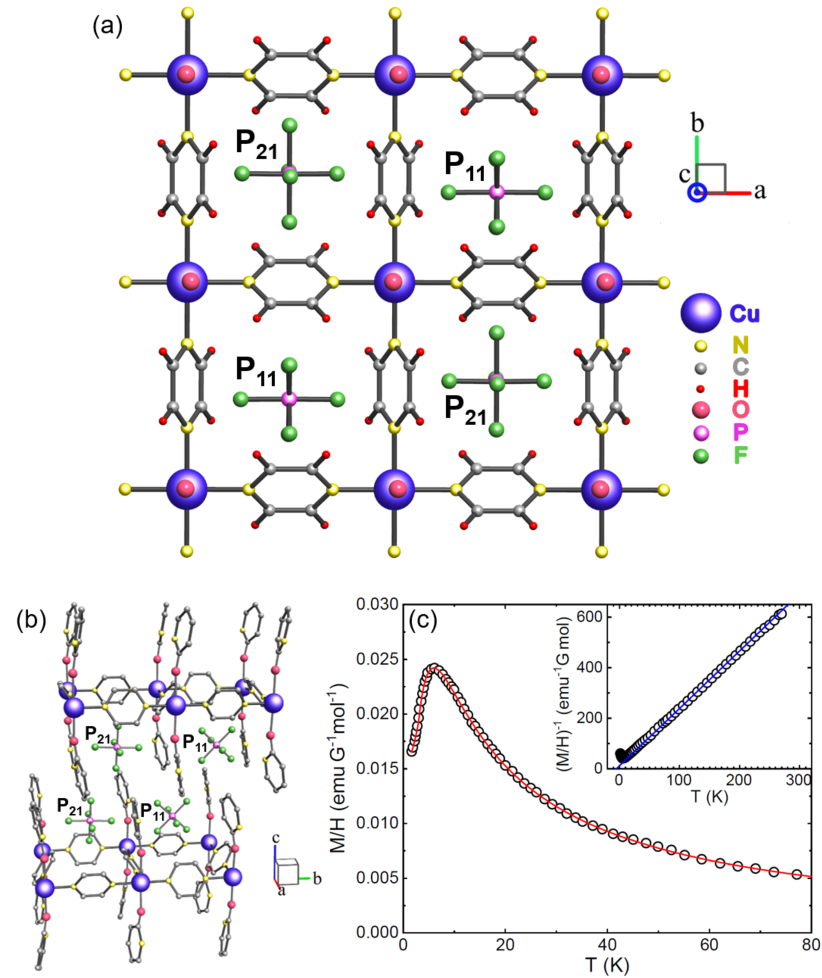
Single-crystalline samples of the molecular-based compound [Cu(pz)2(2-HOpy)2](PF6)2 (CuPOF) were grown from solution [27]. Spin moments with , hosted by the Cu2+ ions, are coupled by a molecular matrix of pyrazine molecules [pz = C4H4N2] to form quasi-two-dimensional (2D) layers with a square-lattice motif along the plane [Fig. 1(a)], with a nearest-neighbor intralayer exchange of K and an interlayer exchange of about 1 mK [27]. The Cu-pyrazine planes are separated by 2-pyridone molecules [2-HOpy = C5H4NHO] along the crystallographic axis, bridged to the Cu2+ ions via oxygen. These molecules not only repel the molecular planes from each other, but also cause a shift of adjacent layers by about half of an in-plane lattice period along the crystallographic axis, see Fig. 1(b). The PF6 anions are located in-between the layers, thus contributing to the interlayer repulsion, as well as to the effective distribution of charge density in the molecular structure.
The 31P NMR investigations of a plate-like single-crystalline sample of CuPOF, with dimensions of mm3 and a weight of about 12 mg, were performed at temperatures between 6 and 260 K, with applied magnetic fields between 2 and 7 T . In the investigated temperature range, the correlations of the electronic moments in CuPOF can be treated as paramagnetic in good approximation. Figure 1(c) shows the temperature dependence of the static susceptibility of a powder sample [27]. Above around 40 K, the data are well described by a Curie-Weiss law with a Curie constant of 0.440(5) emuG-1mol-1K and a Curie-Weiss temperature K, indicating a small antiferromagnetic interaction, as revealed by the temperature dependence of the inverse static susceptibility in the inset of Fig. 1(c). Towards low temperatures, the development of the short-range correlations of the electronic moments yields a broad maximum at around 6.8 K, compare Fig. 1(c). This behavior was modeled with the susceptibility of a two-dimensional quantum Heisenberg antiferromagnet (2D QHAF) model with a nearest-neighbor intralayer interaction of K, see Ref. [27]. The best of the modeling process is denoted by the red line in Fig. 1(c).
The spectra and the nuclear spin-spin relaxation time were recorded with a Hahn spin-echo pulse sequence with a typical pulse duration of 2.5 s, an output power of 30 W, and waiting time of s (for the spectra) between the NMR radio-frequency pulses. The experimental relaxation data of the nuclear magnetization component at selected temperatures are presented in the Supplemental Material (SM) [28], see Fig. S3(a). The nuclear spin-lattice relaxation time was recorded by using an inversion-recovery method. The experimental relaxation data of the nuclear magnetization component were modeled as , see Fig. S1 in the SM [28], where is a stretching exponent. We find that the stretching exponent is essentially temperature independent in the investigated temperature range, with experimental values close to unity, see Fig. S2(b) in the SM [28], indicating a uniform spin-lattice relaxation rate of the 31P nuclear ensemble. For the temperature-dependent NMR measurements, the magnetic field was applied parallel to the crystallographic axis, i.e., perpendicular to the molecular layers. 31P magic-angle spinning (MAS) NMR spectroscopy was performed on a polycrystalline CuPOF sample at an external field of 4.7 T with a 31P resonance frequency of 80.985 MHz and a sample spinning speed of 30 kHz.
III Results and discussion
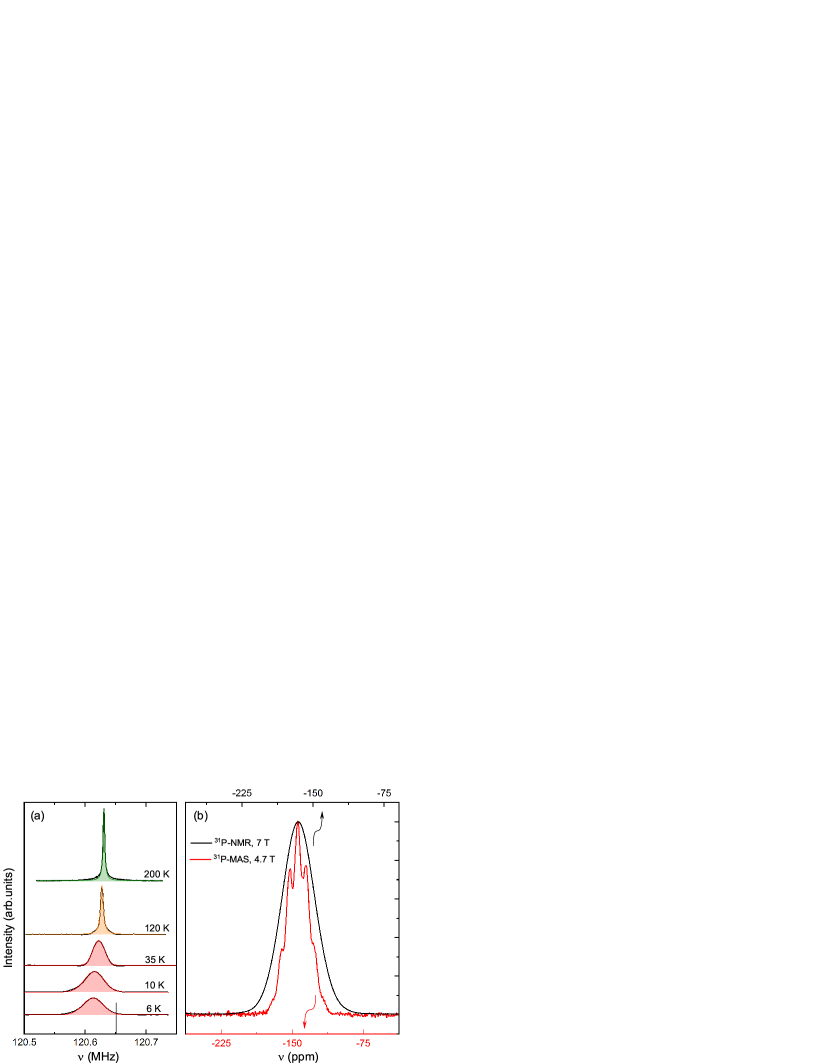
Figure 2(a) shows representative 31P-NMR spectra at selected temperatures between 6 and 200 K. Since 31P has a nuclear angular momentum of , only one transition ( to ) is observed. Figure 2(b) shows a comparison of the conventional spin-echo 31P-NMR spectrum and that recorded by the MAS technique at about 200 K. Due to the cancellation of local dipole fields, by spinning the sample with a frequency of 30 kHz at the magic-angle orientation, the MAS spectrum is revealed as resolved with 7 lines, separated by a scalar spin-spin coupling of Hz between the 19F and 31P nuclei [27]. The chemical shift of -143.2 ppm at 4.7 T and are in a good agreement with previously reported values for compounds containing PF6 molecules [29, 30, 31]. The relative intensities of the septet are given by the binomial coefficients [32]. On the other hand, due to nuclear dipole-dipole broadening, the standard NMR spectrum is not resolved. The small asymmetry of the NMR spectrum is attributed to the existence of two structurally slightly nonequivalent 31P sites, see Figs. 1(a) and 1(b). The absolute values of the MAS and NMR frequency shift differ by 22 ppm. This is attributed to a residual dipolar contribution to the NMR shift at 200 K, which is absent in the MAS spectrum.
The full width at half maximum (FWHM) of the NMR spectrum at 200 K is less than 5 kHz (41 ppm at 7 T), indicating a high homogeneity of the single-crystalline CuPOF sample. As shown in Fig. 2(a), the linewidth increases significantly upon cooling. Since the 31P-NMR spectrum is slightly asymmetric, the second spectral moment , the square root of which is proportional to the FWHM, is used to characterize the spectral width. The th spectral moment is defined as , where the resonance curve is described by a normalized function with a maximum at the frequency [33]. The temperature dependence of the 31P second spectral moment is shown in Fig. 3(a). Instead of a simple Curie-type behavior, i.e., a monotonic increase of toward low temperatures [34], which would denote a continuously growing width of the magnetic dipole-field distribution stemming from the Cu2+ moments, the temperature dependence of the linewidth shows several steplike increases. At temperatures below about 60 K, the 31P-NMR spectrum resembles a Gaussian lineshape, as exemplified by the red shaded areas in Fig. 2(a). With increasing temperatures, the spectral lineshape gradually changes, and a purely Lorentzian form is observed above around 145 K, compare the green shaded area in Fig. 2(a). At intermediate temperatures, between about 60 and 145 K, the 31P-NMR spectrum can be described by a superposition of Lorentzian and Gaussian functions, displayed as the orange shaded area in Fig. 2(a). Furthermore, the temperature-dependent spin-spin and spin-lattice relaxation rates, and , display several broad maxima, compare Figs. 3(b) and 3(c). The increases of coincide with temperature regimes for which the steplike changes of the linewidth are found, whereas the related maxima of are observed at higher temperatures. The broad maxima of the temperature-dependent and rates, as well as the steplike behavior of the linewidth, are ascribed to a motional narrowing process, as described further below.
III.1 Nuclear relaxation and BPP phenomenology
According to the BPP model [1, 2], a time-dependent local magnetic field , stemming from either nuclear or electronic moments, with a characteristic fluctuation frequency close to that of the nuclear Larmor frequency , represents a mechanism of nuclear spin-lattice relaxation:
| (1) |
Here, is the nuclear gyromagnetic ratio, and is the perpendicular component of with a mean-square amplitude of . In the case of liquids, where the effect was first observed, is a correlation time associated with local Brownian motion, whereas in gases, is the average time between molecular collisions. Gutowsky and Pake showed that the same approach can be applied to the study of atomic motion in solids, by treating as an average time between jumps from one atomic site to another [35]. Typically, the temperature dependence of the correlation time can be described as a thermally activated process:
| (2) |
with the activation energy and the infinite-temperature correlation time .
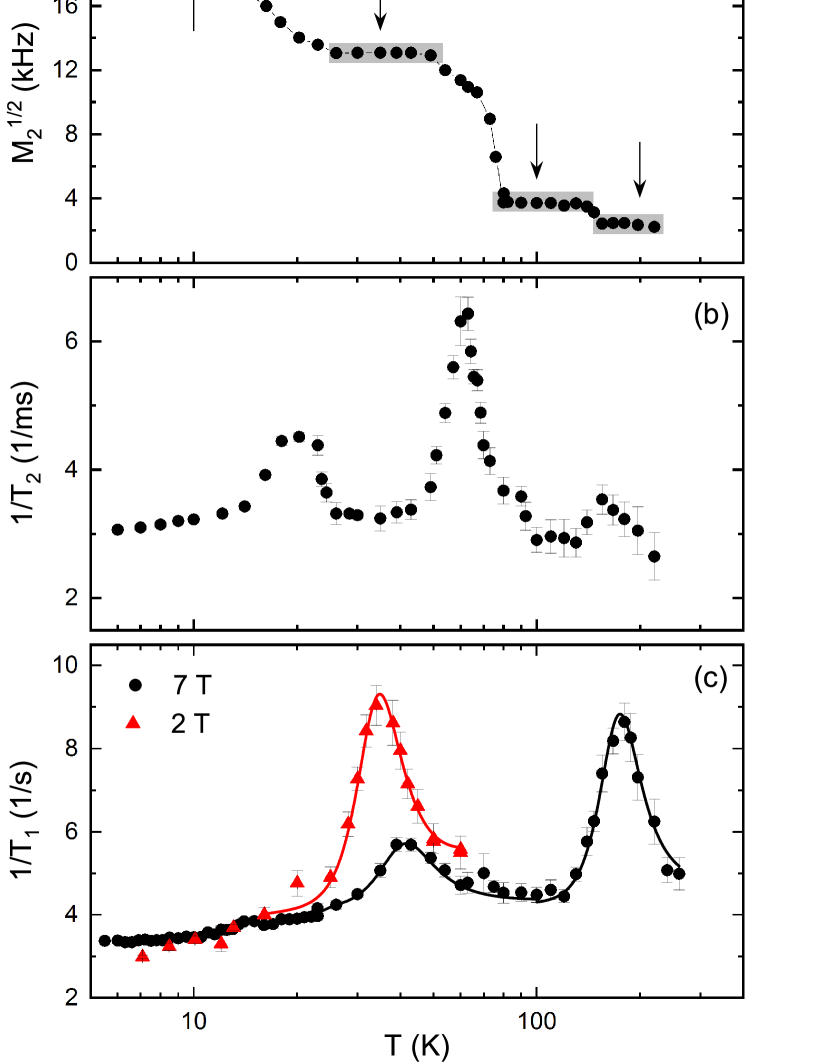
In most experiments, with only a few exceptions [35, 23, 24, 25], only one broad maximum of the spin-lattice relaxation rate is observed, eventually accompanied by a steplike change of the temperature-dependent second moment. However, in the present case of CuPOF, each peak and related constant regime of the temperature-dependent second moment can be attributed to a different set of characteristic rotational modes of the PF6 molecules. The temperature-dependent data at 7 T was modeled using Eqs. (1) and (2) as well as a weak linear contribution. For the two distinguishable maxima of , two separate sets of BPP parameters were used, compare Fig. 3(c). The perpendicular component of the local fluctuating field is determined as mT for the low-temperature peak, while for the high-temperature peak, we find mT. Since these values are very similar, we conclude that both processes are related to motional modes of the same physical object. The activation energies and related correlation times are K and ps for the low-temperature process, and K and ps for the high-temperature one, respectively. Both the activation energies and the correlation times are in the parameter range observed for other compounds with a BPP-type enhancement of by thermally activated reorientation modes [24, 37, 36].
In order to further test the validity of the BBP model in the present case, additional measurements were performed at 2 T. According to the BBP theory, a decrease of the magnetic field and the corresponding NMR frequency leads to an increase of the peak amplitude and a temperature downshift of the peak position. The parameters , , and of the molecular rotation remain unchanged by the variation of the field amplitude. These predictions are fully compatible with our experimental results. The BPP modeling of the data at 2 T gives mT, ps, and K.
The change of molecular reorientation modes also yields three broad maxima of at around 20, 60, and 150 K, coinciding with the temperature regimes of the steplike growth of the second moment, compare Figs. 3(a) and 3(b). In general, the relaxation can be caused by several mechanisms, such as nuclear spin-spin coupling (direct or indirect), or by slow longitudinal local field fluctuations. Whereas the first mechanism may yield complex transverse relaxation depending on the details of the internuclear interactions [38], the latter mechanism, commonly referred to as the Redfield contribution, usually leads to a solely exponential decay with a time constant coupled to the spin-lattice relaxation. For the whole investigated temperature range, we find the spin-echo decay to be purely exponential, modulated by a weak oscillatory component, stemming from the spin-spin coupling between the 31P and 19F nuclei. This oscillatory component yields a frequency of about 790(70) Hz, which is in good agreement with Hz, determined by the MAS-NMR spectroscopy, see Fig. 2(b). The observed exponential decay is in contrast to, e.g., a more complex temperature evolution of the 13C spin-echo decay, reported for molecular reorientations in the fullerene-based superconductor K3C60 [16].
Considering the purely exponential transverse relaxation in CuPOF, but also that quantitatively clearly exceeds at most temperatures in the parameter regime of our study, the main mechanism of the relaxation is, most likely, not given by the internuclear interaction within the PF6 molecules, but is rather due to longitudinal local field fluctuations, originating from the dipolar fields of the Cu2+ electronic moments. A comprehensive quantitative description of the relaxation process in CuPOF is, however, beyond the scope of the present work.
In the rather complex molecular-based structure of CuPOF, there are several candidates for yielding molecular reorientation modes, namely the pyrazine molecules, the 2-pyridone molecules, and the PF6 anions. The pyrazine molecules are bridging the Cu2+ ions, constituting a superexchange pathway for the electronic moments, so that a rotational motion about the axis that links nearest copper neighbors might influence the related Heisenberg exchange coupling [27]. However, both the pyrazine as well as the 2-pyridon molecules may be expected to yield only one characteristic set of rotational modes, as they are correspondingly chemically bound to the layered structure.
Since the PF6 molecules are not bound to any other part of the molecular structure, they have the highest degree of freedom, which makes them the most likely candidates to yield complex motional modes. There are a few NMR studies of the rotational motions of the PF6 anions in alkali hexafluorophosphates to compare with [23, 24, 37].
III.2 Anisotropy of the spectral moments

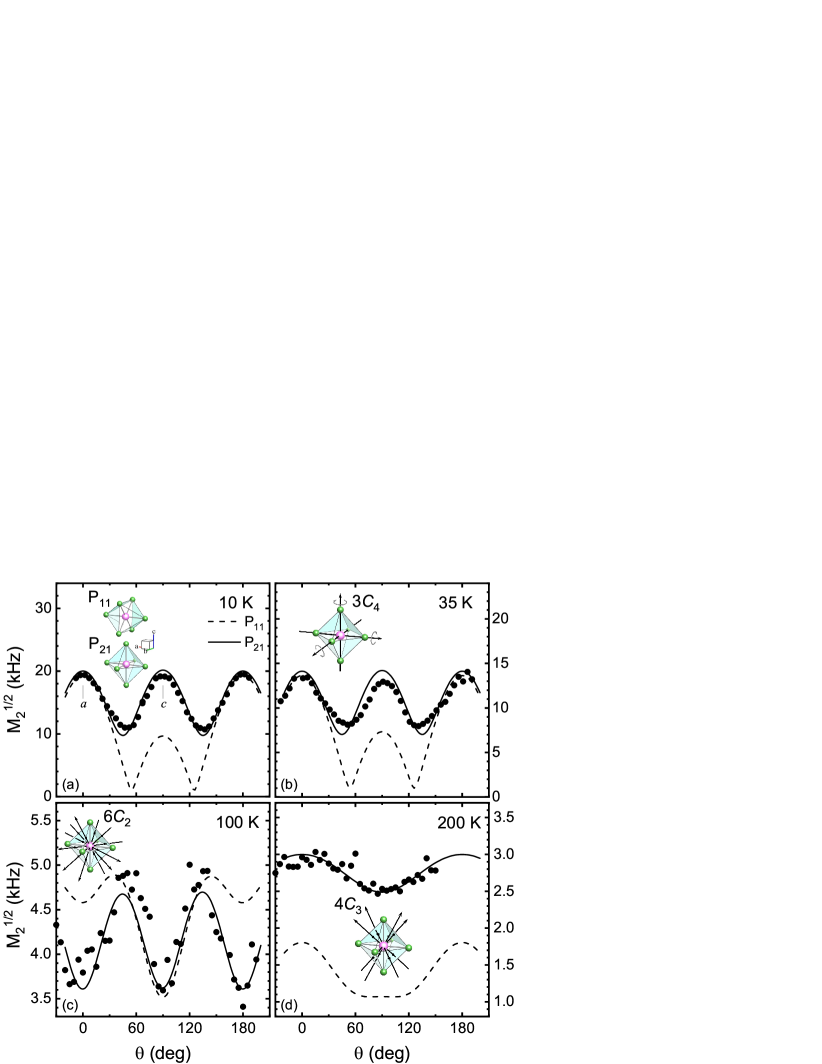
In order to obtain further quantitative understanding of the rotation of the PF6 molecules and the related motional narrowing of the NMR spectra, measurements of the angular-dependent 31P resonance shift were performed at 10, 35, 100, and 200 K, selecting characteristic regions of the stepwise temperature dependence of , see Fig. 3(a). Numerical estimates of the anisotropic NMR shift for the two structurally slightly non-equivalent 31P sites were performed by a summation of the dipole fields from the localized Cu2+ electronic moments in a volume of (100 Å)3. The results of these calculations are in very good agreement with the experimental data, see Fig. 4, and reveal that the full magnetic moment is, in fact, localized at the Cu2+ sites. The isotropic chemical-shift contribution is determined as -168 ppm.
At all temperatures, the anisotropy of the frequency shift is much smaller than the spectroscopic linewidth. Furthermore, by lowering the temperature from one step of to another, the periodicity of the anisotropy changes, see Fig. 5. In contrast, a -periodicity of the frequency shift is observed at all temperatures. The anisotropy amplitude scales with the magnetic dipole-field distribution stemming from the Cu2+ moments. These findings strongly suggest that the formation of the first () and the second () spectral moments are determined by different physical mechanisms.
For a further quantitative analysis of the experimental data, we calculated the second spectral moment. According to the Van Vleck theory of the nuclear-resonance linewidth in a rigid lattice [39], the second moment of the resonance absorption of the nuclear species with angular momentum and gyromagnetic ratio can be written as
| (3) | |||
where is the angle between the position vector of the magnetic moments and and the magnetic field, and is the scalar coupling between unlike spins. The first term of Eq. (3) represents the broadening by like nuclear moments, whereas the second term of Eq. (3) accounts for all other magnetic moments The line broadening caused by different types of spin systems, and is additive, and the broadening by like spins is times more efficient than by unlike spins.
Since electronic magnetic moments are about 1000 times larger than nuclear magnetic moments (depending on the isotope), we first consider the line broadening due to dipole fields stemming from the Cu2+ ions. Our calculations of the anisotropic dipole broadening using the second term of Eq.(3) gives magnitudes of 46-156 kHz, where 46 kHz results for an external magnetic field perpendicular to the planes. The calculated values significantly exceed the experimentally determined second moment, e.g., kHz at 10 K for the out-of-plane orientation. The reason for this discrepancy is found by considering the exchange interactions between the Cu2+ moments, contributing strongly to the fourth spectral moment, which leads to a narrowing of the absorption line [39]. The effective linewidth can be estimated as , where is the calculated second moment of the electronic copper moments, is the experimentally observed width and is the exchange frequency [40]. In the case of CuPOF, Hz is estimated from the known Heisenberg exchange value of K [27]. Thus, the effective second moment contribution of the copper ions for an out-of-plane orientation of the external magnetic field is only about Hz. In consequence, whereas the Cu2+ moments mainly determine the first spectral moment of the 31P absorption line, they yield no significant contribution to the second moment due to the exchange narrowing.
Since the second moment is inversely proportional to the sixth order of the distance between the interacting magnetic moments, the nuclear intramolecular broadening of PF6 is examined as the next possible mechanism of the 31P line broadening. As mentioned, there are two structurally non-equivalent PF6 molecules in the structure, see Figs. 1(a) and 1(b), giving rise to different second-moment anisotropies for the corresponding sites P11 and P21. Using the second term of Eq. (3), where Hz, as determined by the MAS NMR experiments [see Fig. 2(b)], the calculated anisotropy for the P21 site agrees very well with the experimental data, compare Fig. 5(a). Due to almost identical first-moment anisotropies of the sites P11 and P21, see Fig. 4, the broader P21 spectrum determines the experimentally observed anisotropy of the second moment.
The second-moment contribution from the dipolar broadening by the 13C, 14N, 15N, 63Cu, and 65Cu nuclei, as well as the intermolecular broadening by the 31P and 19F nuclei, was evaluated by the second term of Eq. (3). The total calculated contribution yields only Hz, and is neglected in the following.
| Calculation | Experimental | |||||
|---|---|---|---|---|---|---|
| Rotational mode | T | |||||
| (kHz) | (K) | (kHz) | (mT) | (K) | (ps) | |
| None, rigid lattice | 20.16 | 10 | 19.14 | |||
| 3C4 | 14.21 | 35 | 12.95 | 1.1 | 250 | 20 |
| 6C2 | 3.62 | 100 | 3.59 | - | - | - |
| 4C3 | 2.49 | 200 | 2.53 | 1.8 | 1400 | 3 |
All of the above calculations are performed for a rigid lattice, i.e., under the assumption that the lengths and orientations of the vectors describing the relative positions of the magnetic moments are time independent. A different situation appears for liquids and gases, as well as for atomic diffusion in solids. In these cases, due to the rapid relative motion of magnetic moments, the resulting local fields at the nuclear sites fluctuate in time, and only their average value is observed experimentally. This mechanism is known as motional narrowing, and can be observed under the condition that the average is taken over a time period which is long in comparison to the characteristic time scale of the fluctuations. The criterion for motional narrowing is , where is the second moment in the rigid lattice, described by Eq. (3), and is the correlation time characterizing the rate of the local field fluctuations. In the present case of CuPOF, this criterion is satisfied, since is of the order of a few ps, whereas is of the order of a few ten kHz, see Table 1.
Since the second moment of the 31P resonance is mainly determined by the interaction with the six neighboring 19F nuclei of the same PF6 molecule, it is reasonable to consider that the motional narrowing is related to reorientation modes of the PF6 molecule itself. These molecules form almost perfect octahedral structures, the simplest and foremost motion of which are rotations around well-defined symmetry axes. The rotation about the twofold, threefold, and fourfold (Cn, , 3, 4) symmetry axes narrows the 31P line. In order to account for the molecular rotation, the angular-dependent coefficient in Eq. (3) needs to be replaced by its average over all possible angles [33]. According to the theorem for spherical harmonics,
| (4) |
where and are the angles between the symmetry-axis direction vector and or the externally applied magnetic field, respectively. The angular dependence of the 31P-NMR second moment of the P11 and P21 sites was calculated in the presence of PF6 molecular reorientations around the symmetry axes , , and , using Eqs. (3) and (4). The angular dependences for each rotational PF6 motion are compared to the experimental values of at 35 K (), 100 K (), and 200 K (), as shown in Figs. 5(b)-5(d). An excellent agreement between the calculations for the phosphorous site P21 and the experimental data is observed. For the given rotation in the plane, the different crystallographic orientations of the PF6 molecules of the sites P11 and P21, as depicted in the inset of Fig. 5(a), result in quantitative differences of the calculated second moment anisotropies for the respective sites, depending on the symmetry axes of the given molecular rotation mode. Note that the calculations of do not include any free parameter.
As the only small deviation, at 100 K, the experimentally determined mostly follows the calculations for the P21 site, although a broader line is expected for the P11 site. Nevertheless, the excellent overall agreement between the experimental and calculated second moment allows assignment of the PF6 molecular reorientation modes to the respective temperature regimes of constant . The motional modes in the different temperature regimes can be described as depicted by the insets in Figs. 5(b)-5(d). At all temperatures, the same type of the PF6 molecular orientations for both inequivalent PF6 molecules, yielding the P11 and P21 sites, are expected.
III.3 Temperature-dependent evolution of the PF6 molecular reorientations
At temperatures above 155 K, all PF6 molecules are rotating around the four threefold symmetry axes , which pass through the centers of the octahedron surfaces. These molecular reorientations yield a constant linewidth of the 31P-NMR spectrum with kHz for the out-of-plane field orientation. With decreasing temperature, these molecular reorientation modes are continuously freezing out, as is manifested by the broad high-temperature maximum of the 31P spin-lattice relaxation rate, see Fig. 3(c). By lowering the temperature below 155 K, a steplike increase of the linewidth occurs with a concomitant broad maximum of [Figs. 3(a) and 3(b)]. At temperatures between about 130 and 80 K, the molecular reorientation takes place with respect to the six twofold symmetry axes , which pass through the centers of the octahedron edges. This type of PF6 molecular rotations manifests as a plateau of the temperature-dependent linewidth with of about 3.6 kHz for . Although these motional modes are freezing out with further decrease of temperature, no distinct maximum of the 31P spin-lattice relaxation rate, associated with a slowing of this specific molecular reorientation, is observed. The absence of this peak could either be caused by a significant and abrupt change of the molecular reorientation frequency, or by a cancellation of the local field fluctuations due to the anisotropy of the geometrical form factors, the anisotropy and magnitude of which determine the sensitivity of the spin-lattice relaxation to the local field dynamics. By lowering the temperature below about 80 K, a further stepwise increase of the linewidth is observed and accompanied by an enhancement of the 31P spin-spin relaxation rate. A broad maximum of occurs at 60 K, whereas below around 50 K, another plateau of and is reached, which is associated with rotations of the PF6 molecules around the three fourfold symmetry axes , which coincide with the space diagonals of the octahedron. The freezing of these molecular motions yields another BPP peak in the 31P spin-lattice relaxation rate, see Fig. 3(c). Below about 26 K, an increase of the linewidth is observed, accompanied by a broad maximum of the 31P spin-spin relaxation. Finally, at around 10 K, all PF6 reorientation modes are frozen out and the rigid-lattice condition is reached. A molecule with several equivalent orientations with respect to the symmetry axis, separated by energy barriers, may flip between these orientations with a given frequency. In case of more than two such equivalent orientations of the molecule, the calculation of the second moment gives the same result for an averaging over a discrete number of possible orientations or for a classical description of the rotation, i.e., averaging over a continuous set of orientations [33]. A summary of all experimental and calculated characteristic parameters is presented in Table 1.
IV Conclusions
In summary, we used a combined approach by probing static and dynamic local-magnetic-field properties by means of NMR spectroscopy, as well as molecular-motion models, in order to investigate the freezing of molecular rotation modes in a paramagnetic crystal CuPOF. By analyzing the temperature-dependent relaxation rates, the activation energies K and K, with the corresponding correlation times ps and ps of the molecular reorientations, were determined. The angular-dependent frequency shift and second moment, compared with our calculations, reveal the origin of the low-frequency local field fluctuations. The excellent agreement between the calculations and experimental data allows for a well-defined investigation and identification of the temperature-dependent evolution of the PF6 molecular rotation modes. Perspectively, the knowledge of the microscopic environment of the Cu2+ ions and its variation with temperature can be used as an important input for detailed DFT calculations of the electronic properties in CuPOF. The presented approach can be used for a broad range of similar molecular-based compounds with localized magnetic moments, and, thus, opens new possibilities for the exploration of molecular rotational modes in paramagnetic single crystals.
Acknowledgements.
We appreciate helpful discussions with Prof. Mark Turnbull. We acknowledge support from the Deutsche Forschungsgemeinschaft (DFG) through the SFB 1143, the GRK 1621, and the Würzburg-Dresden Cluster of Excellence on Complexity and Topology in Quantum Matter– (EXC 2147, Project No. 390858490), as well as the support of the HLD at HZDR, a member of the European Magnetic Field Laboratory (EMFL). Z.T.Z. was supported by the National Natural Science Foundation of China (Grant No. 11304321) and by the International Postdoctoral Exchange Fellowship Program 2013 (Grant No. 20130025). I.H. and R. S. were supported by the European Regional Development Fund (Grant No. TK134), and by the Estonian Research Council (PRG4, IUT23-7).References
- [1] N. Bloembergen, E. M. Purcell, and R. V. Pound, Nature 160, 475 (1947).
- [2] N. Bloembergen, E. M. Purcell, and R. V. Pound, Phys. Rev. 73, 679 (1948).
- [3] B. J. Suh, P. C. Hammel, M. Hücker, B. Büchner, U. Ammerahl, and A. Revcolevschi, Phys. Rev. B 61, R9265 (2000).
- [4] N. J. Curro, P. C. Hammel, B. J. Suh, M. Hücker, B. Büchner, U. Ammerahl, and A. Revcolevschi, Phys. Rev. Lett. 85, 642 (2000).
- [5] V. F. Mitrović, M.-H. Julien, C. de Vaulx, M. Horvatić, C. Berthier, T. Suzuki, and K. Yamada, Phys. Rev. B 78, 014504 (2008).
- [6] S.-H. Baek, Y. Utz, M. Hücker, G. D. Gu, B. Büchner, and H.-J. Grafe, Phys. Rev. B 92, 155144 (2015).
- [7] F. Hammerath, U. Gräfe, T. Kühne, H. Kühne, P. L. Kuhns, A. P. Reyes, G. Lang, S. Wurmehl, B. Büchner, P. Carretta, and H.-J. Grafe, Phys. Rev. B 88, 104503 (2013).
- [8] M. Moroni, S. Sanna, G. Lamura, T. Shiroka, R. De Renzi, R. Kappenberger, M. A. Afrassa, S. Wurmehl, A. U. B. Wolter, B. Büchner, and P. Carretta, Phys. Rev. B 94, 054508 (2016).
- [9] X. Zong, A. Niazi, F. Borsa, X. Ma, and D. C. Johnston, Phys. Rev. B 76, 054452 (2007).
- [10] A. U. B. Wolter, P. Wzietek, D. Jérome S. Süllow, F. J. Litterst, R. Feyerherm, and H.-H. Klauss, J. Magn. Magn. Mater. 290-291, 302 (2005).
- [11] F. Raffa, M. Mali, J. Roos, D. Brinkmann, M. Matsumura, and K. Conder, Phys. Rev. B 58, 2724 (1998).
- [12] T. Imai, E. A. Nytko, B. M. Bartlett, M. P. Shores, and D. G. Nocera, Phys. Rev. Lett. 100, 077203 (2008).
- [13] F. Borsa, NMR in magnetic single molecule magnets. In: NMR-MRI, SR and Mössbauer Spectroscopies in Molecular Magnets, edited by P. Carretta, A. Lascialfari (Springer, Milano, 2007).
- [14] F. Creuzet, T. Takahashi, D. Jérome, J. M. Fabre, J. Phys. Lett. 43, 755 (1982).
- [15] M. Takigawa, G. Saito, J. Phys. Soc. Jpn. 55, 1233 (1986).
- [16] Y. Yoshinari, H. Alloul, G. Kriza, and K. Holczer, Phys. Rev. Lett. 71, 2413 (1993).
- [17] Y. Yoshinari, H. Alloul, V. Brouet, G. Kriza, K. Holczer, and L. Forro, Phys. Rev. B 54, 6155 (1996).
- [18] A. Kuhn, S. Narayanan, L. Spencer, G. Goward, V. Thangadurai, and M. Wilkening, Phys. Rev. B 83, 094302 (2011).
- [19] M. Wilkening, W. Iwaniak, J. Heine, V. Epp, A. Kleinert, M. Behrens, G. Nuspl, W. Bensch, and P. Heitjans, Phys. Chem. Chem. Phys. 9, 6199 (2007).
- [20] A. Kuhn, M. Kunze, P. Sreeraj, H. -D. Wiemhöfer, V. Thangadurai, M. Wilkening, and P. Heitjans, Solid State Nucl. Magn. Reson. 42, 2 (2012).
- [21] G. Majer, E. Stanik, and S. Orimo, J. Alloys Compd. 356-357, 617 (2003).
- [22] M. N. Ramanuja, K. P. Ramesh, and J. Ramakrishna, Mol. Phys. 104, 3213 (2006).
- [23] G. R. Miller, and H. S. Gutowsky, J. Chem. Phys. 39, 1983 (1963).
- [24] S. Albert, H. S. Gutowsky, and J. A. Ripmeester, J. Chem. Phys. 56, 2844 (1972).
- [25] H. Winter, E. Dormann, M. Bertault, and L. Toupet, Phys. Rev. B 46, 8057 (1992).
- [26] C. S. Vogelsberg, F. J. Uribe-Romo, A. S. Lipton, S. Yang, K. N. Houk, S. Brown, and M. A. Garcia-Garibay, Proc. Natl. Acad. Sci. USA 114, 13613 (2017).
- [27] D. Opherden, N. Nizar, K. Richardson, J. C. Monroe, M. M. Turnbull, M. Polson, S. Vela, W. J. A. Blackmore, P. A. Goddard, J. Singleton, E. S. Choi, F. Xiao, R. C. Williams, T. Lancaster, F. L. Pratt, S. J. Blundell, Y. Skourski, M. Uhlarz, A. N. Ponomaryov, S. A. Zvyagin, J. Wosnitza, M. Baenitz, I. Heinmaa, R. Stern, H. Kühne, and C. P. Landee, Phys. Rev. B 102, 064431 (2020).
- [28] See Supplemental Material for the experimental nuclear relaxation curves, as well as for the temperature dependence of the related stretching exponent.
- [29] E. R. Andrew, M. Firth, A. Jasinski, and P.J. Randall, Phys. Lett. A 31, 446 (1970).
- [30] E. L. Muetterties, and W. D. Phillips, J. Am. Chem. Soc. 81, 1084 (1959).
- [31] E. C. Alyea, J. and Malito, and J. H. Nelson, Inorg. Chem. 26, 4294 (1987).
- [32] H. S. Gutowsky, and D. W. McCall, Phys. Rev. 82, 748 (1951).
- [33] A. Abragam, The Principles of Nuclear Magnetism (Oxford University Press, London, 1961).
- [34] Z. T. Zhang, D. Dmytriieva, S. Molatta, J. Wosnitza, Yutian Wang, M. Helm, Shengqiang Zhou, and H. Kühne, Phys. Rev. B 95, 085203 (2017).
- [35] H. S. Gutowsky, and G. E. Pake, J. Chem. Phys. 18, 162 (1950).
- [36] J. A. Ripmeester, and R. K. Boyd, J. Chem. Phys. 71, 5167 (1979).
- [37] H. S. Gutowsky, and S. Albert, J. Chem. Phys. 58, 5446 (1973).
- [38] C. H. Pennington, D. J. Durand, C. P. Slichter, J. P. Rice, E. D. Bukowski, and D. M. Ginsberg, Phys. Rev. B 39, 274 (1989).
- [39] J. H. Van Vleck, Phys. Rev. 74, 1168 (1948).
- [40] N. Bloembergen, Physica 16, 95 (1950).
V Supplemental Material
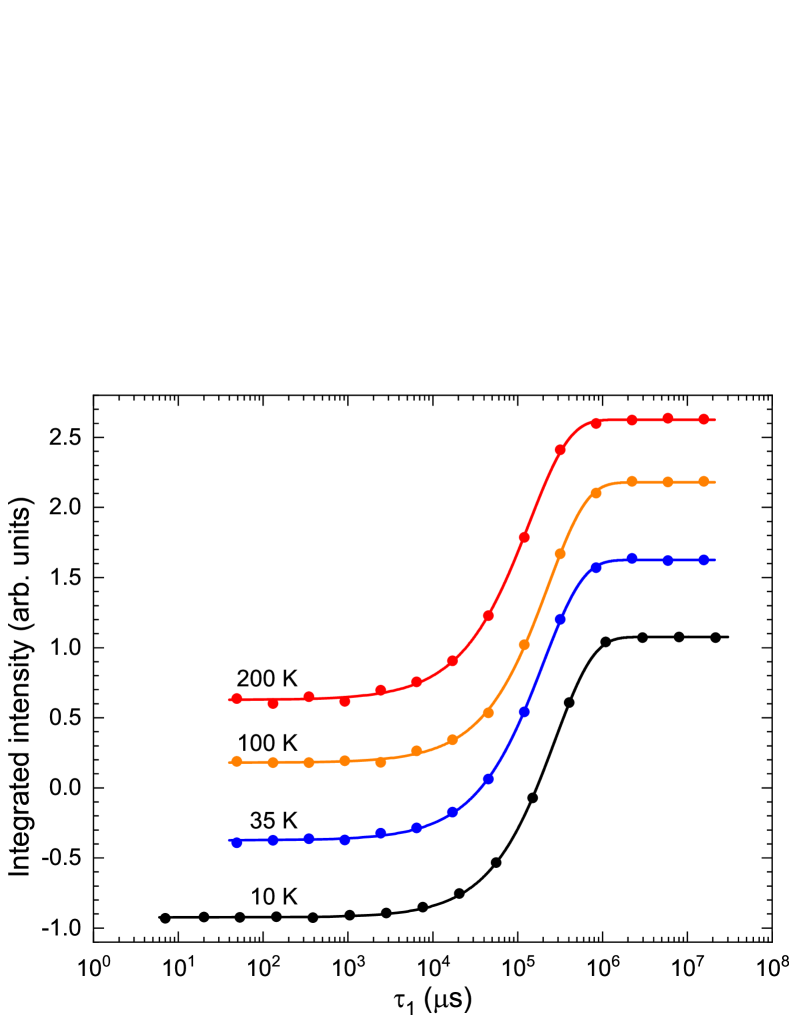
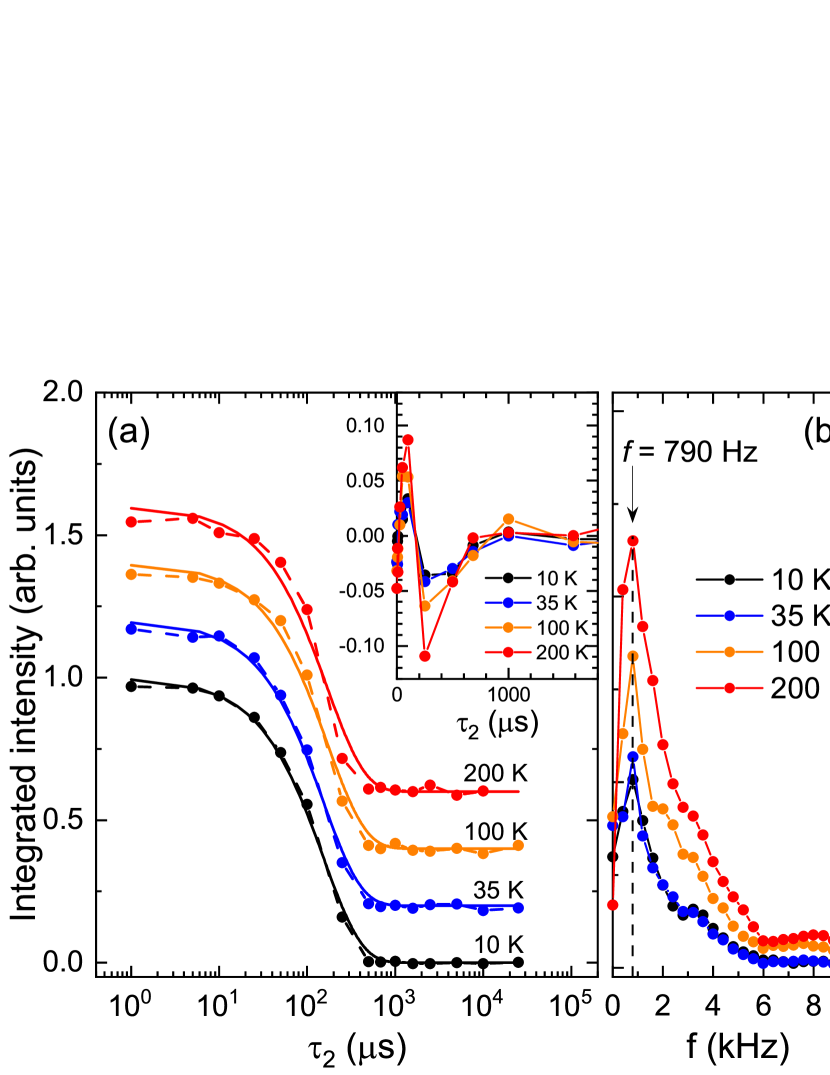
The nuclear spin-lattice relaxation time . The nuclear spin-lattice relaxation time was recorded by using an inversion-recovery method. The experimental relaxation data of the nuclear magnetization component recorded at 10, 35, 100, and 200 K are presented in Fig. S1. The experimental relaxation data of the nuclear magnetization component were modeled as
| (S1) |
where is a stretching exponent. The temperature dependence of the stretching exponent at 7 T is shown in Fig. S2(b). We find that the stretching exponent is essentially temperature independent in the investigated temperature range, with experimental values close to unity, indicating a uniform spin-lattice relaxation rate of the 31P nuclear ensemble.
The nuclear spin-spin relaxation time . The nuclear spin-spin relaxation time was recorded with a Hahn spin-echo pulse sequence with a typical pulse duration of 2.5 s and an output power of 30 W. Typical relaxation curves recorded at 10, 35, 100, and 200 K are shown in Fig. S3(a).

The exponential relaxation is modulated by a weak oscillatory component, stemming from the indirect spin-spin coupling between 31P and 19F nuclei. The deviations of the experimental data from a single-exponential decay of the form
| (S2) |
is presented in the inset of Fig. S3(a). The oscillatory component yields a frequency of about 790(70) Hz, see the fast Fourier transforms (FFT) of the oscillatory components at 10, 35, 100, and 200 K in Fig. S3(b). The frequency of the oscillatory component is in good agreement with Hz, determined by the MAS-NMR spectroscopy, see Fig. 2(b) in the main text.