Highly polarised microstructure from the repeating FRB 20180916B
Abstract
Fast radio bursts (FRBs) are bright, coherent, short-duration radio transients of as-yet unknown extragalactic origin. FRBs exhibit a wide variety of spectral, temporal and polarimetric properties, which can unveil clues into their emission physics and propagation effects in the local medium. Here we present the high-time-resolution (down to 1 s) polarimetric properties of four 1.7-GHz bursts from the repeating FRB 20180916B, which were detected in voltage data during observations with the European VLBI Network (EVN). We observe a range of emission timescales spanning three orders of magnitude, with the shortest component width reaching 3–4 s (below which we are limited by scattering). This is the shortest timescale measured in any FRB, to date. We demonstrate that all four bursts are highly linearly polarised (), show no evidence for significant circular polarisation (%), and exhibit a constant polarisation position angle (PPA) during and between bursts. On short timescales ( s), however, there appear to be subtle (few degree) PPA variations across the burst profiles. These observational results are most naturally explained in an FRB model where the emission is magnetospheric in origin, as opposed to models where the emission originates at larger distances in a relativistic shock.
1 Introduction
Many FRBs1, 2 show complex burst morphology and, to date, both repeaters and apparent non-repeaters have shown temporal structure, ‘sub-bursts’, as short as 20–30 s 3, 4, 5. Probing even shorter, , timescales is a powerful way to constrain emission models because of the limits that such temporal structures place on the instantaneous size of the emitting region: corresponds to 300 m, though special relativistic effects cause the light-travel size to be much smaller than the actual size.
Voltage data allow access to such timescales, but several practical challenges remain: e.g., scattering due to multi-path propagation can limit the effective time resolution (especially at low radio frequencies); the signal-to-noise (S/N) on short timescales may be too low; there may be limitations on the precision with which the dispersion measure (DM) can be determined, such that it is impossible to ensure that the DM smearing is less than the time resolution; and, if the bursts are composed of a forest of closely spaced (sub-) sub-bursts, then confusion may limit our ability to identify individual structures. For example, in the case of FRB 20181112A 5, the effective time resolution is limited by scattering, despite having voltage data.
Ultra-high-time-resolution studies are even more powerful if they include full polarisation information. In general, FRBs show a wide variety of polarimetric properties. FRBs have been observed to exhibit linear polarisation fractions from 0 to 100 (e.g. 6, 4, 7, 8). Some FRBs show significant circular polarisation9, though most so far show very little10, 7. Some sources show a flat PPA across the burst profile 4, 11, 8, whereas others show a PPA variation 6, 12.
The polarisation properties of FRB 20121102A, the first discovered repeating FRB 13, 14, were measured at – GHz with Arecibo4 and the Green Bank Telescope (GBT) 15. FRB 20121102A bursts are approximately 100 linearly polarised, and show no sign of circular polarisation. There is evidence of a linear polarisation decrease towards lower frequencies but whether this is intrinsic or reflects a propagation effect is currently unclear (Plavin et al., in prep.). Additionally, for FRB 20121102A, the PPA is flat across the burst duration, and the absolute value of PPA is approximately equal between bursts 4. The rotation measure (RM) of FRB 20121102A was found to be very large (10), and highly variable (variation of approximately 10 over months), implying an extreme and dynamic local magneto-ionic environment 4, 16.
FRB 20190711A has recently been shown to repeat 8, 17. As with FRB 20121102A, the bursts show high fractional linear polarisation (approximately 80–100%), no significant circular polarisation, and a flat PPA across the burst profile. The RM of FRB 20190711A was found to be , four orders of magnitude smaller than in the case of FRB 20121102A.
Luo et al. 12 report the discovery of repeat bursts from FRB 20180301A, with the Five-hundred-meter Aperture Spherical radio Telescope (FAST), and present the polarisation properties of bursts from this source at 1.25 GHz. Similar to other repeating FRBs, these bursts show no evidence of circular polarisation. However, contrary to the properties of previously studied repeaters, the linear polarisation fractions are measured to be lower (approximately –), and some bursts show a swing in the PPA across the burst profile. The RM measured for this source varies from to between bursts.
The only other repeating FRB with published polarisation information from multiple bursts is FRB 20180916B 11, 18. The RM measured for FRB 20180916B (about ) is three orders of magnitude smaller than what is seen for FRB 20121102A 11. CHIME/FRB Collaboration et al. 11 discuss the capture of CHIME/FRB voltage data during one burst from FRB 20180916B in the frequency range –. With this data, measurements of the polarisation fractions and RM were first possible. This burst exhibits approximately 100% linear polarisation, and shows no evidence for circular polarisation. The PPA appears to be flat over the burst duration. The polarimetric properties of four bursts from FRB 20180916B, detected at – using GBT, are consistent with the original discovery 18 (approximately 100% linear, flat PPA, comparable RM) — supporting the idea that repeating FRBs have consistent polarisation properties between bursts from the same source (over a range of radio frequencies), and that the phenomenology is similar for repeating FRB sources in general. The polarisation properties of FRB 20180916B, measured with LOFAR from – MHz, are similar to those at higher frequencies, but also show significant depolarisation down to lowest observed frequencies19. This is likely the result of scattering, though investigation into whether this is due to Faraday conversion20, 21 is underway19.
FRB 20180916B’s polarimetric properties have not previously been investigated at radio frequencies GHz, where most FRB 20121102A studies have been conducted, and previous studies have been limited by the temporal resolution of the data. It is unclear if the polarimetric properties seen from FRB 20180916B at – MHz persist at higher radio frequencies, and the shortest temporal structure reported to date is 22. Also, at higher frequencies, measurements of the PPA are less affected by RM variations, and thus easier to study.
Here we present an analysis of four 1.7-GHz FRB 20180916B bursts whose spectro-temporal properties were previously presented 22. In the present work, we provide a higher-time-resolution, full polarimetric analysis of this sample. Throughout this paper we use the nomenclature B for the bursts, following Marcote et al. 22. Additionally, we introduce the nomenclature B4-sb for the three clear sub-bursts in burst B4. In §2 we describe the data, in §3 we present the high-time-resolution and polarimetry results, and thereafter discuss the consequences for our understanding of repeating FRBs in §4.
2 The data
The data were acquired as part of an EVN campaign on 2019 June 19 (experiment code: EM135C) at a central radio frequency of GHz. Using SFXC 23, we created two data products. Firstly, we converted the voltage data from the -m Effelsberg telescope into full-polarisation (circular basis) filterbank data with time and frequency resolutions of and , respectively. Secondly, we produced full-polarisation filterbank data with time and frequency resolutions of and , respectively. In this process, the data were coherently dedispersed to a dispersion measure (DM) of , which is the best-fit DM that maximises S/N for burst B4 at 16 s time resolution 22. Using PSRCHIVE 24, we created archive files containing each burst from the filterbank files at the native time and frequency resolution. The archive files are incoherently dedispersed to a refined DM using the 1 s data (see Methods). We manually mask frequency channels that are contaminated by radio frequency interference (RFI), and artefacts at the sub-band edges.
3 Results
3.1 High time resolution
In our previous spectral and temporal characterisation of these bursts 22, we found that B3 and B4 show several sub-bursts with widths ranging from – s. Here we probe order-of-magnitude shorter timescales by studying the burst temporal properties at even higher time resolution.
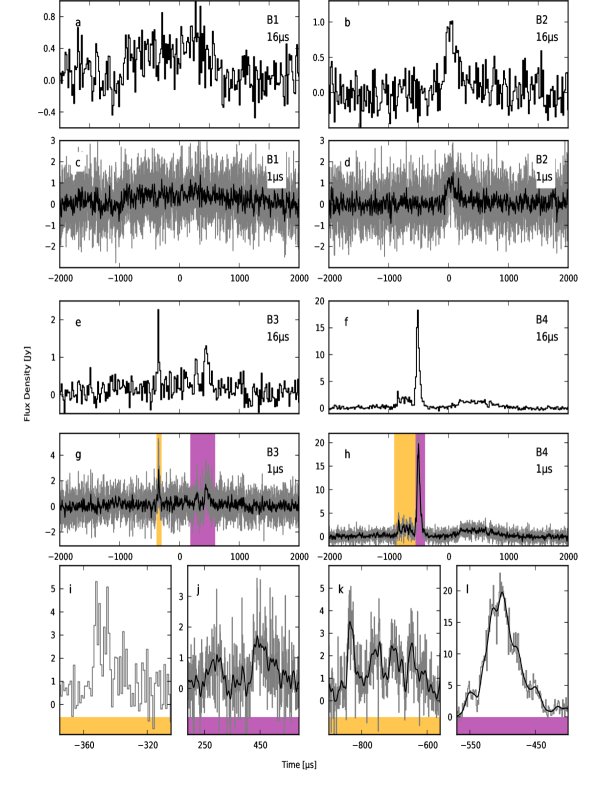
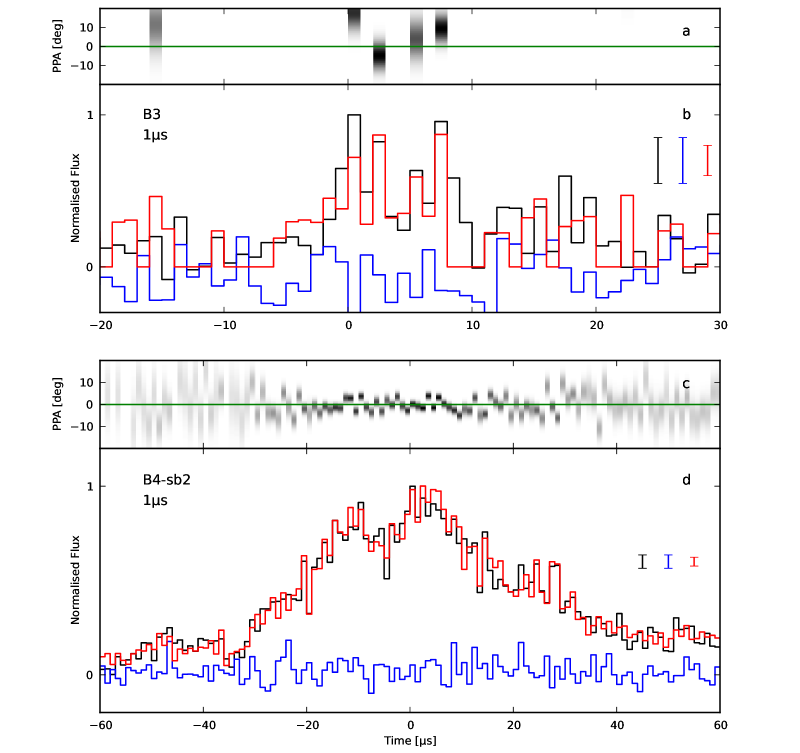
In Figure 1, we present the four FRB 20180916B burst profiles at both s and s resolution. In the case of bursts B1 and B2, the increase in time resolution does not reveal any shorter-timescale structure, and the burst widths are consistent with the widths measured previously22 (1.86 0.13 ms and 0.24 0.02 ms for B1 and B2, respectively). Bursts B3 and B4 show clear structure in the 16 s resolution data. By increasing the time resolution to 1 s, we see clear 10–20 s structure in burst B4 (panel k, Figure 1), and the bright component of B4 does not appear to be a simple Gaussian envelope; instead, it exhibits 10–20 s fluctuations on top of the broader envelope (panel l, Figure 1). B3 exhibits 50–100 s components (panel j, Figure 1), and even a component that is only a few s wide (panel i, Figure 1). We note that the two 3–4 s components shown in panel i, Figure 1, are detected across our 128 MHz band. The 3–4 s shots of emission are consistent with the estimated Galactic scattering time (2.7 s) 22 for FRB 20180916B.
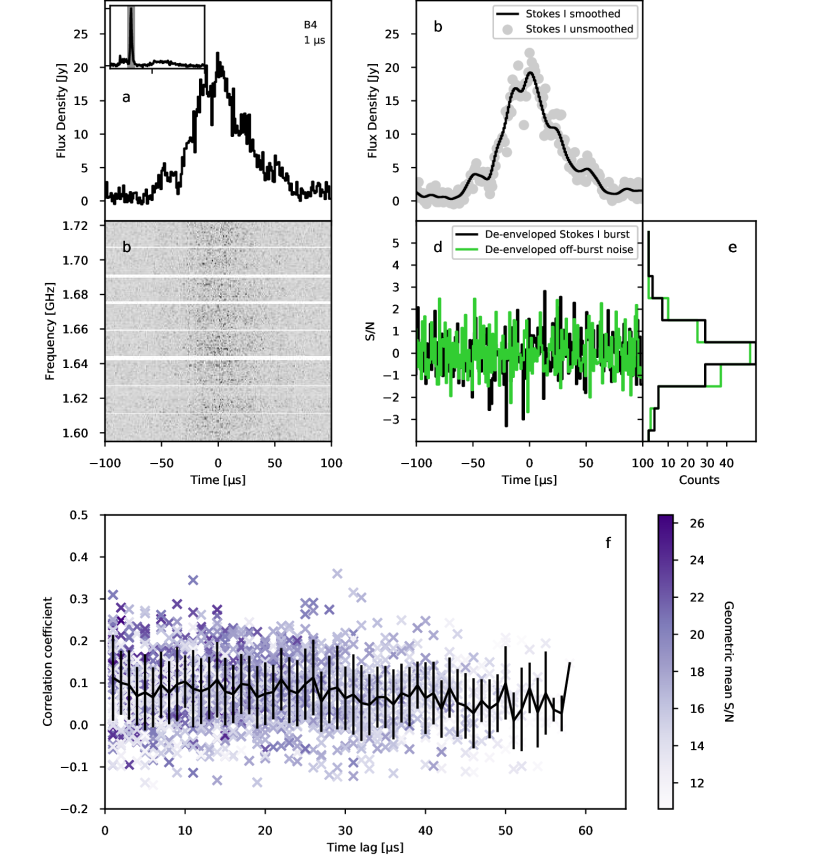
In addition to the 10–20 s structure in the profile of B4-sb2 (panel l, Figure 1), there also appear to be narrower spikes on top of the burst envelope. We fit the burst envelope and remove it from the data, in order to test the statistical significance of any outliers (see Methods). We find no significant outliers in this burst, implying that the narrow features are consistent with amplitude-modulated noise (Figure 2). This is further supported by our measurement of a S/N-weighted correlation coefficient 0.2 (panel f; Figure 2), where we would expect a correlation coefficient of 1/3 if each time bin is perfectly correlated25 (and the scattering time is greater than the separation of the bursts). Due to the large scatter, we cannot distinguish between a constant or slightly decreasing correlation coefficient as a function of lag. Thus, based on the data in hand, we can rule out that burst B4 is comprised of a few well-separated bright (sub) s shots of emission.
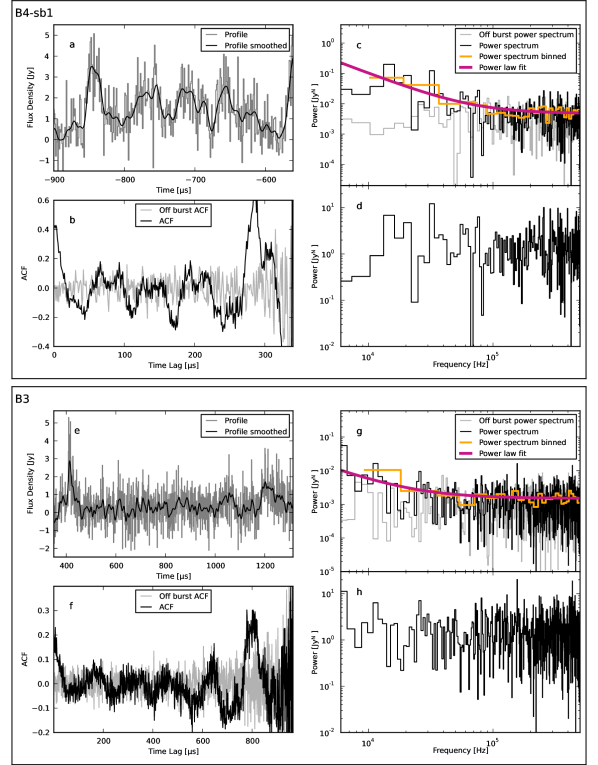
By eye, B4-sb1 (panel k, Figure 1) appears to fluctuate quasi-periodically. There are other examples of FRBs showing this diffraction-pattern-like temporal behaviour26, which potentially can be explained by self-modulation breaking the burst into ‘pancakes’ 27, or by plasma lensing 28. To test this, we computed the autocorrelation function (ACF; using Equation 1 in Marcote et al. 22, but here considering time lag instead of frequency lag), and the power spectrum (Extended Data Figure 1). For details of the power spectrum modelling and statistics, see Methods. We find no statistically significant evidence for quasi-periodic emission in the power spectrum of B4-sb1 or B3. We conclude that bursts B4-sb1 and B3 are consistent with red noise, with a power-law index of 1.58 0.02 and 1.38 0.01, respectively. Typically, magnetar X-ray bursts show steeper red noise spectra29 ( 2–5).
3.2 Polarimetry
As described in Methods, the polarimetric data were calibrated using a test pulsar (PSR B211146).
For the highest-S/N burst in our sample, B4, we measure the RM to be rad m-2 (see Methods), where the large fractional error arises due to covariances between the Q-U fit parameters and the instrumental delay between the two polarisation channels, which is not independently constrained. We find the RM to be consistent with the previously measured RM values for FRB 20180916B 11, 18.
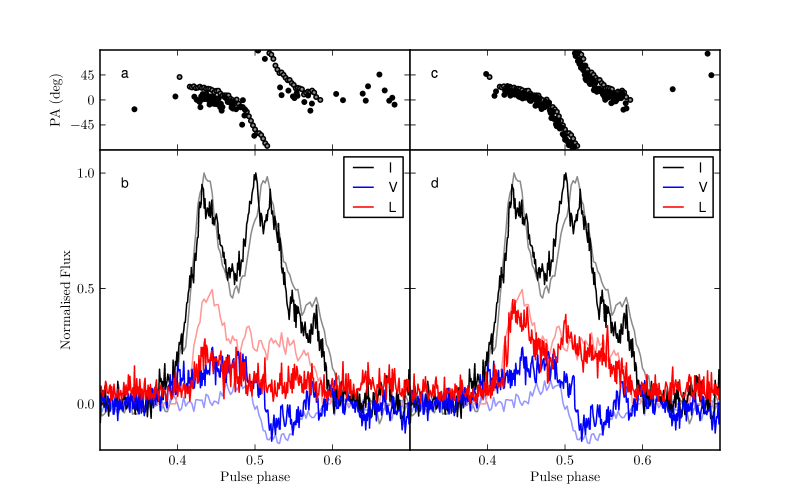
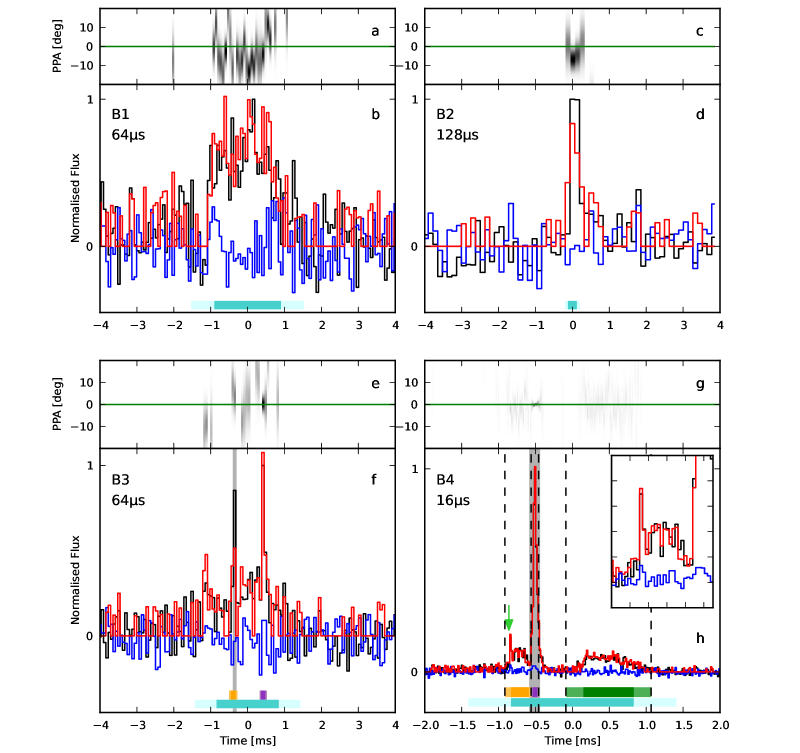
In Figure 3, we show the Faraday-derotated profiles for the four FRB 20180916B bursts. We use the rmfit-determined RM for B4 (see Methods) to correct all four bursts, since B4 has the highest S/N, and we assume the RM does not change between bursts separated by approximately 4. We plot the unbiased linear polarisation, , profile in red, following Everett & Weisberg 30, where
| (1) |
where , and is the standard deviation in the off-burst Stokes I data.
The PPA, corrected for parallactic angle variations (see Methods), is shown in the top panel of each sub-figure in Figure 3. We performed a least-squares fit of a horizontal line to the PPA of the four bursts together, weighted by their - errors. We note that for all of the PPA fits, we consider only additive noise in the determination of the variance. The weighted -statistic for this global fit is , with degrees of freedom. We have shifted the absolute value of the PPA by this best-fit value, . We note that, due to imperfect calibration, this value is not the absolute PPA and should not be used for comparison with bursts from other studies of FRB 20180916B. We performed individual least-square fits for each burst, the results of which are reported in Extended Data Table 2. For the above fits, we only included PPAs within the Gaussian-fit 2- temporal width region (illustrated by the light cyan bars shown in Figure 3) that also satisfied . We find that the PPAs of the four bursts are consistent with being constant across the burst duration. We do, however, see a hint of PPA variation between burst components (which is most evident in B1 and B3).
We find that all four bursts are highly linearly polarised (), and show no evidence for circular polarisation (; Extended Data Table 2). Additionally, the PPA of each burst is consistent with being flat across the burst duration, with the absolute PPA within approximately 7∘ between bursts. The second spike in the B3 profile (indicated by an orange bar in Figure 3) appears to have a lower linear polarisation fraction than the rest of the burst. We see that the observed linear polarisation fraction increases when viewed in the higher-time-resolution 1 s data (Figure 4). As we have shown in §3.1, this component is actually only a few s wide (Figure 1). Therefore, the low polarisation fraction in the lower-time-resolution 16 s data can be attributed to the fact that this component is not resolved. This highlights another importance of studying the burst properties at high time resolution.
In addition, we show the PPA and polarisation profile of B4-sb2 at 1 s resolution in the lower sub-figure of Figure 4. At this resolution, there are small (approximately a few degrees) variations in the PPA across this bright burst component. To test the significance of these variations, we performed a weighted least-squares fit of a flat PPA to the 1 s resolution PPAs across the bright burst component of B4. The measured reduced- of this fit is 3.7, compared with a reduced-1 for the 16 s resolution data. We conclude that the variations are significant.
4 Discussion
Neutron stars are prodigious generators of short-duration radio bursts, including canonical radio pulsar emission 31, giant pulses 32, 33, and radio pulses from magnetars 34. The Crab pulsar shows a variety of emission features at different radio frequencies 35, each with their own characteristic spectro-tempo-polarimetric properties 36. Hessels et al. 26 commented on the very similar phenomenology seen when comparing FRB 20121102A with the high-frequency interpulses (HFIPs) produced by the Crab pulsar. Like FRB 20121102A and FRB 20180916B, the Crab pulsar HFIPs typically show high (approximately 80–90%) linear polarisation, weak (approximately 10–20%) or undetectable circular polarisation, and non-varying PPA within and between bursts 36. Since HFIPs are observed to be highly polarised, this implies that the emission region is spatially localised 36 (as opposed to coming from an extended region from the neutron star surface to the light cylinder, which would ultimately lead to depolarisation37). Additionally, the flat PPAs between HFIPs suggest that the magnetic field direction is stable during each observational epoch. There have been examples of HFIPs, however, that deviate from this trend, either showing significant circular polarisation, weaker linear polarisation and/or a significant PPA variation across the burst profile 36.
Comparing phenomenology with the Crab pulsar is tempting, but ignores the fact that FRB 20121102A, FRB 20180916B and other repeaters produce bursts that are orders of magnitude longer duration and higher luminosity. Indeed, Lyutikov 38 argue that the established extragalactic distances of FRBs preclude rotational energy and support magnetic energy as the fundamental power source for the bursts. Many FRB theories have invoked a magnetar as the central engine (see Platts et al. 39 for a catalogue of FRB theories). The recent discovery of an exceptionally bright (kJy–MJy) millisecond-duration radio burst from the Galactic magnetar SGR 1935+2154 has added compelling evidence for such a scenario 40, 41. In fact, SGR 1935+2154 has been observed to produce sporadic radio bursts spanning more than 7 orders-of-magnitude in fluence 42, though it is unclear whether these all arise from the same physical mechanism.
Magnetar FRB models come in a variety of flavours. First, there is debate about whether the radio burst emission originates within or close to the magnetosphere (e.g. 43), or whether it is generated in a relativistic shock produced by an explosive energy release from the central engine (e.g. 44). Secondly, one can consider whether the magnetar is acting in isolation, or whether its activity is stimulated by an external plasma stream (e.g. 45).
As with pulsars, the polarimetric properties of magnetar radio bursts show diversity 46, 47. Nonetheless, very high (%) linear polarisation fractions are common 48, though not ubiquitous 46, 42.
The high linear polarisation observed for FRB 20180916B is expected in both magnetospheric magnetar models 49 and synchrotron maser shock models (e.g. 44). The magnetospheric model described in Lu et al. 49 additionally predicts small variations of the PPA between bursts from a repeating FRB, with the burst-to-burst variability following the rotation period of the magnetar. Relativistic shock models, where the FRB emission originates much farther from the magnetar, naturally predict constant PPA within and between bursts (e.g. 44). However, small variations can be additionally explained by invoking clumpiness in the medium into which the shock front propagates, or could alternatively come from the maser emission itself (although at this time, it is unclear how large an effect this will have on the PPA).
In this work, we have observed the shortest-timescale structure seen in any FRB to date ( s), and we see that there is a range of timescales from a few s to a few ms. In the literature, there are bursts detected from FRB 20180916B with total envelope widths of up to 6 ms (at 300–800 MHz)11, 18 (there are larger burst widths reported at 110–188 MHz 19, but at these low frequencies scattering dominates). It should be noted that there appears to be a frequency dependence on burst width, therefore comparison of temporal structure across different frequencies should be done with caution. The observed shortest timescales of a few s, and range of timescales have implications for magnetar progenitor FRB models. Assuming a magnetar progenitor, temporal fluctuations strongly constrain where the emission originates (i.e. within the magnetosphere or well outside the magnetosphere). The ratio of fluctuations to total burst duration, in our case, is approximately 4 s / 2 ms 0.002 1, which is most naturally explained invoking emission originating within the magnetosphere 50. The short-timescale structure observed in FRB 20180916B implies that the emission region is on the order of 1 km. In the case of FRB emission originating from a relativistic shock at a large distance from the magnetar, this would imply a very small area of the total shock front dominating. Nonetheless, the temporal fluctuations could be explained by invoking clumpiness in the medium where the shock front propagates or, potentially, propagation effects.
Additionally, we find that the bright component of B4 (B4-sb2) at 1 s resolution exhibits fluctuations of s. We conclude that this sub-burst is not comprised of a few well-separated bright (sub) s shots of emission, but it is possible that the envelope is made up of many closely spaced (sub) s shots of comparable amplitude. This has been predicted in models of magnetospheric burst emission, in order to explain the observed flux densities 51.
The consistent PPA between bursts from FRB 20180916B has direct implications regarding the precessing neutron star models52, 53 created to explain the 16.35 day periodicity 54. During precession, the line-of-sight inevitably sweeps across a much larger angular area on the neutron star surface compared to a non-precessing case. Therefore, the model not only expects PPA variation as a function of the rotational phase, it also expects PPA variation as a function of precession phase. We observe only a very small PPA variation between the bursts, which strongly suggests that the emission angle is greatly tilted from the direction of the magnetic pole in this scenario. Precession is thus disfavoured given that we require a very specific geometry to explain the constant PPA between bursts (which is also observed in the case of FRB 20121102A 4).
Based on the observed offset from the nearest star forming regions in the host galaxy, Tendulkar et al. 55 discuss a model in which FRB 20180916B is a neutron star in an interacting high-mass X-ray binary system. In this scenario, the neutron star magnetosphere is ‘combed’ by the ionised wind of the stellar companion56, and creates a magnetic tail as well as a clear funnel where FRBs can be seen. Low-frequency detections of FRB 20180916B indicate that the line-of-sight to the neutron star must still be relatively clean19. Our results from microsecond polarimetry of FRB 20180916B are consistent with the bursts being produced near the neutron star in a magnetic tail. Nonetheless, it also remains possible that FRB 20180916B’s observed periodic activity is due to rotation50; this case can also accommodate the results we present here.
There is, arguably, a characteristic observational picture emerging for repeating FRBs (for a detailed comparison of FRB 20180916B with other FRBs, see Methods). Specifically, repeaters exhibit the downward drifting, so-called ‘sad-trombone’ effect26, 11, and show narrowband burst envelopes57, 58. On average, repeating FRBs exhibit longer-duration burst profiles 11. Additionally, the repeaters FRB 20121102A, FRB 20180916B and FRB 20190711A show remarkably consistent and characteristic polarimetric properties (highly linearly polarised, no evidence of circular polarisation, and constant PPA during and between bursts). In contrast, when including apparent non-repeaters, the global landscape of FRB polarimetric properties is diverse 7, 8. As with pulsars, FRBs exhibit a wide range of polarisation fractions and PPA variations. Repeating FRBs appear to live in a very diverse set of host galaxies and local environments 59, 22, 60, implying that these characteristic properties are exclusive to the emission mechanism, as opposed to effects from the local medium. In this work, we have supported this characteristic observational picture of repeating FRBs with our polarisation measurements of FRB 20180916B at 1.7 GHz. We also suggest that the dynamic range of temporal structure of 2 ms/4 s 500 could be another characteristic to add to this overall description of repeating FRBs.
The results presented here highlight the importance of high-time-resolution polarimetric studies of FRBs. With lower time resolution data, narrow temporal components and subtle variations in the PPA are averaged out. It is possible that previous flat PPA measurements from FRB 20121102A and FRB 20180916B are a result of this. We encourage future observations of FRBs with s time resolution and full polarisation information. We also encourage searches for quasi-periodic oscillations in individual high-S/N FRBs, like the analysis conducted in this work. Studying FRBs in such fine detail is crucial for understanding their emission physics.
Methods
Refined DM
We refine the burst DM using the PSRCHIVE tool pdmp to search for the DM that maxmises S/N of burst B4 (the brightest in our sample) in the 1 s resolution data. The DM is found to be , which is greater than the value the data is coherently dedispersed to. In case the burst is comprised of bright s shots of emission, we additionally search for the DM that maximises the peak in the profile structure (using the metric of maximising (max-min) of the time series). This was found to be , consistent with the pdmp-determined value. We thereafter incoherently dedispersed all the s data to the pdmp-determined value (). This slight shift in DM does not result is significant intra-channel temporal smearing.
Short timescale structure in B4-sb2
To test whether the single-time-bin spikes that appear in B4-sb2 (panel l, Figure 1) are physical or consistent with amplitude-modulated noise 61, 62, we remove the envelope of the burst from the data. To do this we use a Blackman window function, with a smoothing window of 19 bins, to create a model of the envelope of the burst (shown in panel c of Figure 2). This model is then divided out of the data, leaving the residuals shown in panel d of Figure 2, with off-burst noise also shown for comparison. We find no statistical outliers in this burst, implying that the narrow features are consistent with amplitude-modulated noise.
Power spectra modelling and statistics
The power spectrum (in log space; see Extended Data Figure 1) was fit with a power law of the form
| (2) |
where is the amplitude, is the power law slope, and is a white noise component, using the Bayesian analogue of a maximum likelihood estimation, as implemented in the Stingray modelling interface 63. There are many astrophysical phenomena whose lightcurve is observed to have a power law component in the Fourier domain, often referred to as ‘red noise’ (e.g. gamma-ray bursts; 64, active galactic nuclei; 65, magnetars; 29). We perform a goodness-of-fit test by simulating 100 fake power spectra from the best fit, and performing the same Bayesian maximum likelihood fit. The measured p-value is then the fraction of the simulations with a maximum likelihood lower than the likelihood of our fit. The results of this analysis are shown in Extended Data Table 1. There are apparent oscillations in the ACF, consistent with the fluctuations seen in the profile. The power spectrum shows a power law slope, consistent with red noise. To test the statistical significance of any features in the power spectrum on top of the red noise slope, we use two metrics (for a detailed explanation, see Huppenkothen et al. 29). First, to search for any significant narrow features in the power spectrum, we compute the residuals as a function of frequency, ,
| (3) |
where is the power spectrum, and is the best fit noise component. Using the Markov chain Monte Carlo (MCMC) package emcee 66 to generate 100 simulated residuals, we generate the distribution of max(), and determine the probability that the observed peak value, max(), is consistent with noise. We find no statistically significant outliers using this statistic. The second method we use is more sensitive to lower amplitude, wider features in the power spectrum, which are often referred to as quasi-periodic oscillations (QPOs) and are observed in a number of astrophysical phenomena (e.g., accreting low-mass X-ray binaries67, black hole binaries68 and magnetar X-ray flares69). This second method is a model comparison method. In addition to the red noise fit described above, we fit a function with a Lorentzian describing the QPO summed with a red noise power law (as defined above). We calculate the likelihood ratio, and calibrate this likelihood ratio using MCMC simulations of the simpler model (in our case, the power law model; see Protassov et al. 70 for details). This analysis returns the posterior predictive p-value quoted in Extended Data Table 1, i.e. for both B4-sb1 and B3 we cannot rule out the simpler model of a red noise power law slope. For all of the Bayesian fits described we give conservative prior distributions: flat distribution for the power law slope , flat distribution for the amplitude , normal distribution for the white noise component , and a flat distribution for the Lorentzian parameters. Since we see fluctuations of approximately 60 s in the ACF of B4-sb1, we use this as the inital guess for the centroid frequency of the Lorentzian.
The bright envelope of burst B4-sb2 dominates in both the ACF and power spectrum, and so any features associated with quasi-periodic oscillation are difficult to detect. One way to bypass this issue would be to remove the envelope (divide out a smooth model of the burst envelope), but this can introduce features in the power spectrum which are not physical 29. We therefore only perform this analysis on burst B3 and B4-sb1, which do not have a prominent envelope that would dominate the results. The results are shown in Extended Data Figure 1 and Extended Data Table 1.
Polarimetric calibration and RM measurement
We did not perform an independent polarisation calibrator scan to use for polarimetric calibration. Instead, we use the test pulsar observation of PSR B211146 to determine the calibration solutions to apply to our target data. A similar polarimetric calibration technique was used for radio bursts detected from SGR 19352154 using voltage data with the VLBI backend of the Westerbork single-dish telescope RT1 42.
We assume that any leakage between the two polarisation hands only affects Stokes V (defined as V = LL RR using the PSR/IEEE convention 71). We also assume that the delay between the two polarisation hands only significantly affects Stokes Q and U. The calibration we apply ignores second-order effects. We performed a brute force search for the RM that maximises the linear polarisation fraction using the PSRCHIVE tool rmfit. With rmfit we select a range of RMs to search, in a number of trial steps. The delay between the polarisation hands approximately manifests as an offset from the true RM of the source, assuming the delay is frequency-independent. For this reason, we select a larger range of RMs than what would be motivated by the known measured RM of FRB 20180916B ()11, and we search from 5000 to 5000 in 500 equally spaced steps.
For PSR B211146, we measure an RM of , which is units from the true RM of PSR B211146 () 72. This approximately translates to a delay of 5.5. We use the rmfit-RM to Faraday correct the pulsar data, and we reproduce the polarimetric properties and PPA of PSR B211146 within 8% of published properties 73. Extended Data Figure 2 illustrates the calibration we applied. We note that we had on PSR B211146, which has a rotational period of approximately 1 74, so it is likely that our observed average profile did not completely stabilise to the published average profile, which is based on the sum of many more individual pulses. As such, the aforementioned 8% deviation should be treated as an upper limit on the inaccuracy of the polarimetric calibration.
We assume there are no significant changes to the calibration required between the test pulsar scan and the detected FRB 20180916B bursts ( 1 between the PSR B211146 scan and burst B1). Bursts B1 and B4 have a sufficient S/N to determine an RM using rmfit (S/N values determined in Marcote et al. 22 are quoted in Extended Data Table 2). B1 and B4 are separated in time by 4 and we note their measured rmfit-RMs differ by approximately units (1–2% of the measured value). Thus we conclude that the bursts have consistent RMs. The measured rmfit-RM for B4 is , which when combined with the offset due to a delay between the polarisation hands ( units, measured using the PSR B211146 data) gives a true RM of . We note that we have not removed the delay between polarisation hands from the data before running rmfit, and thus the error quoted is lower than the true error as it does not reflect uncertainties associated with the covariance between RM and delay. This is tackled in the following steps using a Q-U fit.
To better determine the burst RM and associated errors, we perform a joint least squares fit of Stokes Q and U spectra (as a function of frequency, ), using the following equations:
| (4) |
| (5) |
where is the speed of light, and the free parameters , the linear polarisation fraction, , the delay between polarisation hands, and , where is the absolute angle of the polarisation on the sky (referenced to infinite frequency), and is the phase difference between the polarisation hands. We perform the joint fit on Q/I and U/I spectra for PSR B211146 and for burst B4, where the delay, , is assumed to be the same for both the pulsar and target scans. We fix the known RM of PSR B21114672, . We measure , consistent with our prediction from the offset in RM from the true RM of PSR B211146 using rmfit. Additionally, we measure the RM of burst B4 to be , where the large fractional error arises due to covariances between the fit parameters (RM, and ) that could not be removed as we did not record independent information from a polarisation calibrator source. We find the RM to be consistent with the previously measured RM values for FRB 20180916B 11, 18.
To correct for parallactic angle, we rotate the linear polarisation vector by
| (6) |
where is the hour angle of the burst, is the latitude of Effelsberg, and is the declination of FRB 20180916B. The parallactic angle corrected PPA is shown in the top panel of each sub-figure in Figure 3. We plot the probability distribution of PPA per time bin, following Everett & Weisberg 30, and mask any bins where the unbiased linear S/N is below 3.
Is there a characteristic observational description of repeating FRBs?
Our high-time-resolution, polarimetric measurements of FRB 20180916B demonstrate remarkable phenomenological similarity to FRB 20121102A 4, 15. Both of these repeating FRBs show 20-30 s sub-bursts (in some high-S/N bursts, at least), approximately 100% linear polarisation, approximately 0% circular polarisation, and a constant PPA during the bursts. Moreover, between 16 bursts found in three observations spanning 25 days, Michilli et al. 4 report consistent PPAs throughout. Michilli et al. 4 fit for a variable RM per day, but a global PPA for all epochs. Gajjar et al. 15 quote different average PPAs between bursts, but this is potentially because they allow the RM to vary between bursts detected within approximately 1 hour. The covariance between RM and PPA makes it difficult to distinguish small variations in the former compared to the latter. Here we find that the PPA of FRB 20180916B is also remarkably similar between bursts, as shown in Figure 3 and Extended Data Table 2.
Comparing our 1.7-GHz measurements with the available MHz LOFAR 19, – MHz GBT 18 and – MHz CHIME/FRB 11 bursts, we find that the polarimetric properties are also persistent over at least four octaves in radio frequency. However, the lack of absolute PPA calibration prevents us from investigating whether the average PPA is both persistent in time and between radio frequencies. In the case of FRB 20121102A, it appears that the linear polarisation fraction decreases towards lower frequencies (Plavin et al., in prep.). It is, as yet, unclear whether that is due to an intrinsic change in the emission physics, or whether it reflects a propagation effect. The RM of FRB 20121102A is highly variable 4, 15, 16, and 23 orders of magnitude larger than FRB 20180916B. The association of FRB 20121102A with a persistent, compact radio source 59, 75 – whereas none is detected coincident with FRB 20180916B 22 – further demonstrates that their local environments are different, despite both being near to a star-forming region 76, 77, 22, 55.
Regardless of differences in host galaxy type and the local environment, however, the remarkable similarity of burst properties demonstrates that FRB 20121102A and FRB 20180916B have the same physical origin. This is further emphasised by the detection of periodicity in the burst activity rate of FRB 20180916B54 with 16 day, and the potential detection of a similar effect from FRB 20121102A78, 79 with 157 day.
To date, the only other repeating FRB that has polarisation information from more than one burst, and is localised to a host galaxy, is FRB 20190711A 8, 17. FRB 20190711A clearly shows the downward-drifting ‘sad trombone’ effect characteristic of repeating FRBs 26, 80. Also, the polarimetric properties of FRB 20190711A show a striking observational similarity; it is also highly linearly polarised, approximately 0% circularly polarised and has a constant PPA across the burst profiles. FRB 20190711A has been localised to a star-forming galaxy 81, 60, different from the hosts of FRB 20121102A (found in a faint starburst galaxy 59) and FRB 20180916B (localised to a massive quiescent galaxy 22).
Recently, Luo et al. 12 report the polarisation properties of bursts from the repeating FRB 20180301A. FRB 20180301A shares a number of properties with other well-studied repeating FRBs, including downward-drifting sub-bursts, narrowbandedness, and no evidence of circular polarisation. However, the approximately linear polarisation and flat PPA across burst profiles is not always observed in the case of FRB 20180301A 12.
The so-far non-repeating FRB 20181112A shows 4 sub-bursts spanning a total burst duration of 1.5 ms, with different apparent RMs and DMs between sub-bursts 5. Day et al. 8 also found similar effects in their sample of five FRBs. The apparent RM variations of approximately 10–20 rad m-2 seen in the ASKAP FRB sample are too subtle to probe for FRB 20180916B given the data we present here and the uncertainty on the delay calibration. We note, however, that (apparent) RM variations at this level are likely excluded based on previously published FRB 20180916B polarimetric results taken at MHz with LOFAR19, MHz using GBT18 and MHz using CHIME/FRB11 because they would lead to a lower polarisation fraction than observed.
Nonetheless, at the high-time-resolution afforded by these data, we detect subtle PPA variations of a few degrees between sub-bursts lasting s each. This is most visible for burst B1 (Figure 3). For the bright, 60 s dominant component of B4 (B4-sb2), where we have maximum S/N per unit time, there is the suggestion of PPA variations of a few degrees, when studying this component at time resolution (Figure 3). This could be interpreted as potential small PPA swings, or that this burst component is actually composed of many sub- components with PPAs that vary on the level of a few degrees, similar to what we see between the burst components.
FRB 20180916B shows some of the shortest-timescale temporal features seen in any FRB to date. For comparison, FRB 20121102A, FRB 20170827A and FRB 20181112A have shown 30 s substructures 4, 3, 5. In the case of FRB 20170827, the burst shows a single component of width s 3, and similarly, FRB 20121102A produced a single burst of width s 4. FRB 20181112A, also shows a single narrow component, but the results are limited by scattering at the 20 s level 5. In this work, we have demonstrated that not only does FRB 20180916B also exhibit short-duration components similar to what has been seen in other FRBs (e.g. the s spike in the inset on Figure 3), but, in fact, we observe temporal scales spanning three orders of magnitude, the shortest reaching only a few s.
Marcote et al. 22 estimated a Galactic scattering time of s at 1.7 GHz from the measurement of the scintillation bandwidth. Independently, Chawla et al. 18 place a constraint on the scattering timescale of FRB 20180916B of 1.7 ms at MHz, which, assuming a frequency scaling of , gives a scattering time at GHz of 3 s, consistent with Marcote et al. 22. The shortest timescale structure observed in this work is consistent with this scattering prediction. Our results rule out that burst B4 is composed of a few extremely bright sub-s shots of emission well-spaced in time, similar to what is observed in Crab giant pulses 32. If the s morphology that we observe in the profile of B4 are made up of sub-s shots of emission, they must be closely packed in time and of approximately equal amplitude.
Data availability
The data that support the plots and results in this study are available from https://doi.org/10.5281/zenodo.4350456, or from the corresponding author upon reasonable request.
Code availability
The code used to analyse the data and create the figures in this work can be found here: https://github.com/KenzieNimmo/Microsecond_Polarimetry_R3
References
- Petroff et al. 2019 Petroff, E., Hessels, J. W. T. & Lorimer, D. R. Fast radio bursts. Astron. & Astrophys. Rev. 27, 4 (2019).
- Cordes & Chatterjee 2019 Cordes, J. M. & Chatterjee, S. Fast Radio Bursts: An Extragalactic Enigma. Annu. Rev. Astron. Astrophys. 57, 417–465 (2019).
- Farah et al. 2018 Farah, W. et al. FRB microstructure revealed by the real-time detection of FRB170827. Mon. Not. R. Astron. Soc. 478, 1209–1217 (2018).
- Michilli et al. 2018 Michilli, D. et al. An extreme magneto-ionic environment associated with the fast radio burst source FRB 121102. Nature 553, 182–185 (2018).
- Cho et al. 2020 Cho, H. et al. Spectropolarimetric Analysis of FRB 181112 at Microsecond Resolution: Implications for Fast Radio Burst Emission Mechanism. Astrophys. J. Lett. 891, L38 (2020).
- Masui et al. 2015 Masui, K. et al. Dense magnetized plasma associated with a fast radio burst. Nature 528, 523–525 (2015).
- Caleb et al. 2018 Caleb, M. et al. The SUrvey for Pulsars and Extragalactic Radio Bursts - III. Polarization properties of FRBs 160102 and 151230. Mon. Not. R. Astron. Soc. 478, 2046–2055 (2018).
- Day et al. 2020 Day, C. K. et al. High time resolution and polarisation properties of ASKAP-localised fast radio bursts. Preprint at arXiv:2005.13162 (2020).
- Petroff et al. 2015 Petroff, E. et al. A real-time fast radio burst: polarization detection and multiwavelength follow-up. Mon. Not. R. Astron. Soc. 447, 246–255 (2015).
- Ravi et al. 2016 Ravi, V. et al. The magnetic field and turbulence of the cosmic web measured using a brilliant fast radio burst. Science 354, 1249–1252 (2016).
- CHIME/FRB Collaboration et al. 2019a CHIME/FRB Collaboration et al. CHIME/FRB Discovery of Eight New Repeating Fast Radio Burst Sources. Astrophys. J. Lett. 885, L24 (2019).
- Luo et al. 2020 Luo, R. et al. Diverse polarization angle swings from a repeating fast radio burst source. Nature 586, 693–696 (2020).
- Spitler et al. 2014 Spitler, L. G. et al. Fast Radio Burst Discovered in the Arecibo Pulsar ALFA Survey. Astrophys. J. 790, 101 (2014).
- Spitler et al. 2016 Spitler, L. G. et al. A repeating fast radio burst. Nature 531, 202–205 (2016).
- Gajjar et al. 2018 Gajjar, V. et al. Highest Frequency Detection of FRB 121102 at 4-8 GHz Using the Breakthrough Listen Digital Backend at the Green Bank Telescope. Astrophys. J. 863, 2 (2018).
- Hilmarsson et al. 2020 Hilmarsson, G. H. et al. Rotation Measure Evolution of the Repeating Fast Radio Burst Source FRB 121102. Preprint at arXiv:2009.12135 (2020).
- Kumar et al. 2020 Kumar, P. et al. Extremely band-limited repetition from a fast radio burst source. Preprint at arXiv:2009.01214 (2020).
- Chawla et al. 2020 Chawla, P. et al. Detection of Repeating FRB 180916.J0158+65 Down to Frequencies of 300 MHz. Astrophys. J. Lett. 896, L41 (2020).
- Pleunis et al. 2020 Pleunis, Z. et al. LOFAR Detection of 110-188 MHz Emission and Frequency-Dependent Activity from FRB 20180916B. Preprint at arXiv:2012.08372 (2020).
- Gruzinov & Levin 2019 Gruzinov, A. & Levin, Y. Conversion Measure of Faraday Rotation-Conversion with Application to Fast Radio Bursts. Astrophys. J. 876, 74 (2019).
- Vedantham & Ravi 2019 Vedantham, H. K. & Ravi, V. Faraday conversion and magneto-ionic variations in fast radio bursts. Mon. Not. R. Astron. Soc. 485, L78–L82 (2019).
- Marcote et al. 2020 Marcote, B. et al. A repeating fast radio burst source localized to a nearby spiral galaxy. Nature 577, 190–194 (2020).
- Keimpema et al. 2015 Keimpema, A. et al. The SFXC software correlator for very long baseline interferometry: algorithms and implementation. Experimental Astronomy 39, 259–279 (2015).
- van Straten et al. 2011 van Straten, W. et al. PSRCHIVE: Development Library for the Analysis of Pulsar Astronomical Data (2011).
- Cordes et al. 2004 Cordes, J. M., Bhat, N. D. R., Hankins, T. H., McLaughlin, M. A. & Kern, J. The Brightest Pulses in the Universe: Multifrequency Observations of the Crab Pulsar’s Giant Pulses. Astrophys. J. 612, 375–388 (2004).
- Hessels et al. 2019 Hessels, J. W. T. et al. FRB 121102 Bursts Show Complex Time-Frequency Structure. Astrophys. J. Lett. 876, L23 (2019).
- Sobacchi et al. 2021 Sobacchi, E., Lyubarsky, Y., Beloborodov, A. M. & Sironi, L. Self-modulation of fast radio bursts. Mon. Not. R. Astron. Soc. 500, 272–281 (2021).
- Cordes et al. 2017 Cordes, J. M. et al. Lensing of Fast Radio Bursts by Plasma Structures in Host Galaxies. Astrophys. J. 842, 35 (2017).
- Huppenkothen et al. 2013 Huppenkothen, D. et al. Quasi-periodic Oscillations and Broadband Variability in Short Magnetar Bursts. Astrophys. J. 768, 87 (2013).
- Everett & Weisberg 2001 Everett, J. E. & Weisberg, J. M. Emission Beam Geometry of Selected Pulsars Derived from Average Pulse Polarization Data. Astrophys. J. 553, 341–357 (2001).
- Lorimer & Kramer 2004 Lorimer, D. R. & Kramer, M. Handbook of Pulsar Astronomy volume 4. (2004).
- Hankins et al. 2003 Hankins, T. H., Kern, J. S., Weatherall, J. C. & Eilek, J. A. Nanosecond radio bursts from strong plasma turbulence in the Crab pulsar. Nature 422, 141–143 (2003).
- Hankins & Eilek 2007 Hankins, T. H. & Eilek, J. A. Radio Emission Signatures in the Crab Pulsar. Astrophys. J. 670, 693–701 (2007).
- Camilo et al. 2006 Camilo, F. et al. Transient pulsed radio emission from a magnetar. Nature 442, 892–895 (2006).
- Hankins et al. 2015 Hankins, T. H., Jones, G. & Eilek, J. A. The Crab Pulsar at Centimeter Wavelengths. I. Ensemble Characteristics. Astrophys. J. 802, 130 (2015).
- Hankins et al. 2016 Hankins, T. H., Eilek, J. A. & Jones, G. The Crab Pulsar at Centimeter Wavelengths. II. Single Pulses. Astrophys. J. 833, 47 (2016).
- Dyks et al. 2004 Dyks, J., Harding, A. K. & Rudak, B. Relativistic Effects and Polarization in Three High-Energy Pulsar Models. Astrophys. J. 606, 1125–1142 (2004).
- Lyutikov 2017 Lyutikov, M. Fast Radio Bursts’ Emission Mechanism: Implication from Localization. Astrophys. J. Lett. 838, L13 (2017).
- Platts et al. 2019 Platts, E. et al. A living theory catalogue for fast radio bursts. Phys. Rep. 821, 1–27 (2019).
- The CHIME/FRB Collaboration et al. 2020 The CHIME/FRB Collaboration et al. A bright millisecond-duration radio burst from a Galactic magnetar. Preprint at arXiv:2005.10324 (2020).
- Bochenek et al. 2020 Bochenek, C. D. et al. A fast radio burst associated with a Galactic magnetar. Preprint at arXiv:2005.10828 (2020).
- Kirsten et al. 2020 Kirsten, F. et al. Detection of two bright FRB-like radio bursts from magnetar SGR 1935+2154 during a multi-frequency monitoring campaign. Preprint at arXiv:2007.05101 (2020).
- Kumar et al. 2017 Kumar, P., Lu, W. & Bhattacharya, M. Fast radio burst source properties and curvature radiation model. Mon. Not. R. Astron. Soc. 468, 2726–2739 (2017).
- Metzger et al. 2019 Metzger, B. D., Margalit, B. & Sironi, L. Fast radio bursts as synchrotron maser emission from decelerating relativistic blast waves. Mon. Not. R. Astron. Soc. 485, 4091–4106 (2019).
- Zhang 2018 Zhang, B. FRB 121102: A Repeatedly Combed Neutron Star by a Nearby Low-luminosity Accreting Supermassive Black Hole. Astrophys. J. Lett. 854, L21 (2018).
- Kramer et al. 2007 Kramer, M., Stappers, B. W., Jessner, A., Lyne, A. G. & Jordan, C. A. Polarized radio emission from a magnetar. Mon. Not. R. Astron. Soc. 377, 107–119 (2007).
- Lower et al. 2020 Lower, M. E., Shannon, R. M., Johnston, S. & Bailes, M. Spectropolarimetric Properties of Swift J1818.0-1607: A 1.4 s Radio Magnetar. Astrophys. J. Lett. 896, L37 (2020).
- Kaspi & Beloborodov 2017 Kaspi, V. M. & Beloborodov, A. M. Magnetars. Annu. Rev. Astron. Astrophys. 55, 261–301 (2017).
- Lu et al. 2019 Lu, W., Kumar, P. & Narayan, R. Fast radio burst source properties from polarization measurements. Mon. Not. R. Astron. Soc. 483, 359–369 (2019).
- Beniamini et al. 2020 Beniamini, P., Wadiasingh, Z. & Metzger, B. D. Periodicity in recurrent fast radio bursts and the origin of ultralong period magnetars. Mon. Not. R. Astron. Soc. 496, 3390–3401 (2020).
- Cordes & Wasserman 2016 Cordes, J. M. & Wasserman, I. Supergiant pulses from extragalactic neutron stars. Mon. Not. R. Astron. Soc. 457, 232–257 (2016).
- Zanazzi & Lai 2020 Zanazzi, J. J. & Lai, D. Periodic Fast Radio Bursts with Neutron Star Free Precession. Astrophys. J. Lett. 892, L15 (2020).
- Levin et al. 2020 Levin, Y., Beloborodov, A. M. & Bransgrove, A. Precessing Flaring Magnetar as a Source of Repeating FRB 180916.J0158+65. Astrophys. J. Lett. 895, L30 (2020).
- CHIME/FRB Collaboration et al. 2020 CHIME/FRB Collaboration et al. Periodic activity from a fast radio burst source. Nature 582, 351–355 (2020).
- Tendulkar et al. 2020 Tendulkar, S. P. et al. The 60-pc Environment of FRB 20180916B. Preprint at arXiv:2011.03257 (2020).
- Ioka & Zhang 2020 Ioka, K. & Zhang, B. A Binary Comb Model for Periodic Fast Radio Bursts. Astrophys. J. Lett. 893, L26 (2020).
- Gourdji et al. 2019 Gourdji, K. et al. A Sample of Low-energy Bursts from FRB 121102. Astrophys. J. Lett. 877, L19 (2019).
- Pearlman et al. 2020 Pearlman, A. B. et al. Multiwavelength Radio Observations of Two Repeating Fast Radio Burst Sources: FRB 121102 and FRB 180916.J0158+65. Preprint at arXiv:2009.13559 (2020).
- Chatterjee et al. 2017 Chatterjee, S. et al. A direct localization of a fast radio burst and its host. Nature 541, 58–61 (2017).
- Heintz et al. 2020 Heintz, K. E. et al. Host Galaxy Properties and Offset Distributions of Fast Radio Bursts: Implications for their Progenitors. Preprint at arXiv:2009.10747 (2020).
- Rickett 1975 Rickett, B. J. Amplitude-modulated noise: an empirical model for the radio radiation received from pulsars. Astrophys. J. 197, 185–191 (1975).
- Cordes 1976 Cordes, J. M. Pulsar radiation as polarized shot noise. Astrophys. J. 210, 780–791 (1976).
- Huppenkothen et al. 2019 Huppenkothen, D. et al. Stingray: A Modern Python Library for Spectral Timing. Astrophys. J. 881, 39 (2019).
- Cenko et al. 2010 Cenko, S. B. et al. Unveiling the Origin of Grb 090709A: Lack of Periodicity in a Reddened Cosmological Long-Duration Gamma-Ray Burst. AJ 140, 224–234 (2010).
- McHardy et al. 2006 McHardy, I. M., Koerding, E., Knigge, C., Uttley, P. & Fender, R. P. Active galactic nuclei as scaled-up Galactic black holes. Nature 444, 730–732 (2006).
- Foreman-Mackey et al. 2013 Foreman-Mackey, D., Hogg, D. W., Lang, D. & Goodman, J. emcee: The MCMC Hammer. Publ. Astron. Soc. Pac. 125, 306 (2013).
- van der Klis 2006 van der Klis, M. Rapid X-ray Variability volume 39 39–112. (2006).
- Remillard et al. 2006 Remillard, R. A., McClintock, J. E., Orosz, J. A. & Levine, A. M. The X-Ray Outburst of H1743-322 in 2003: High-Frequency QPOs with a 3:2 Frequency Ratio. Astrophys. J. 637, 1002–1009 (2006).
- Israel et al. 2005 Israel, G. L. et al. The Discovery of Rapid X-Ray Oscillations in the Tail of the SGR 1806-20 Hyperflare. Astrophys. J. Lett. 628, L53–L56 (2005).
- Protassov et al. 2002 Protassov, R., van Dyk, D. A., Connors, A., Kashyap, V. L. & Siemiginowska, A. Statistics, Handle with Care: Detecting Multiple Model Components with the Likelihood Ratio Test. Astrophys. J. 571, 545–559 (2002).
- van Straten et al. 2010 van Straten, W., Manchester, R. N., Johnston, S. & Reynolds, J. E. PSRCHIVE and PSRFITS: Definition of the Stokes Parameters and Instrumental Basis Conventions. Pubs. Astron. Soc. Australia 27, 104–119 (2010).
- Force et al. 2015 Force, M. M., Demorest, P. & Rankin, J. M. Absolute polarization determinations of 33 pulsars using the Green Bank Telescope. Mon. Not. R. Astron. Soc. 453, 4485–4499 (2015).
- Gould & Lyne 1998 Gould, D. M. & Lyne, A. G. Multifrequency polarimetry of 300 radio pulsars. Mon. Not. R. Astron. Soc. 301, 235–260 (1998).
- Arzoumanian et al. 1994 Arzoumanian, Z., Nice, D. J., Taylor, J. H. & Thorsett, S. E. Timing Behavior of 96 Radio Pulsars. Astrophys. J. 422, 671 (1994).
- Marcote et al. 2017 Marcote, B. et al. The Repeating Fast Radio Burst FRB 121102 as Seen on Milliarcsecond Angular Scales. Astrophys. J. Lett. 834, L8 (2017).
- Tendulkar et al. 2017 Tendulkar, S. P. et al. The Host Galaxy and Redshift of the Repeating Fast Radio Burst FRB 121102. Astrophys. J. Lett. 834, L7 (2017).
- Bassa et al. 2017 Bassa, C. G. et al. FRB 121102 Is Coincident with a Star-forming Region in Its Host Galaxy. Astrophys. J. Lett. 843, L8 (2017).
- Rajwade et al. 2020 Rajwade, K. M. et al. Possible periodic activity in the repeating FRB 121102. Mon. Not. R. Astron. Soc. 495, 3551–3558 (2020).
- Cruces et al. 2020 Cruces, M. et al. Repeating behaviour of FRB 121102: periodicity, waiting times and energy distribution. Preprint at arXiv:2008.03461 (2020).
- CHIME/FRB Collaboration et al. 2019b CHIME/FRB Collaboration et al. A second source of repeating fast radio bursts. Nature 566, 235–238 (2019).
- Macquart et al. 2020 Macquart, J. P. et al. A census of baryons in the Universe from localized fast radio bursts. Nature 581, 391–395 (2020).
Additional information
Correspondence and requests for material should be addressed to K.N.
Acknowledgements
We thank Pawan Kumar, Brian Metzger, Lorenzo Sironi, Maxim Lyutikov, Michiel van der Klis and Phil Uttley for helpful discussions.
The European VLBI Network is a joint facility of independent European, African, Asian, and North American radio astronomy institutes. Scientific results from data presented in this publication are derived from the following EVN project code: EM135. This work was also based on simultaneous EVN and PSRIX data recording observations with the 100-m telescope of the MPIfR (Max-Planck-Institut für Radioastronomie) at Effelsberg, and we thank the local staff for this arrangement.
J.W.T.H. acknowledges funding from an NWO Vici grant (“AstroFlash”; VI.C.192.045). F.K. acknowledges support by the Swedish Research Council. B.M. acknowledges support from the Spanish Ministerio de Economía y Competitividad (MINECO) under grant AYA2016-76012-C3-1-P and from the Spanish Ministerio de Ciencia e Innovación under grants PID2019-105510GB-C31 and CEX2019-000918-M of ICCUB (Unidad de Excelencia “María de Maeztu” 2020-2023).
Author contributions
K.N. discovered the signals, led the data analysis, made the figures, and wrote the majority of the manuscript. J.W.T.H. guided the work and made important contributions to the writing and interpretation. A.K. performed pre-processing of the EVN voltage data. All other authors contributed significantly to aspects of the data acquisition, analysis strategy or interpretation.
Competing interests
The authors declare no competing interests.
Supplementary Information
| Burst | Power law slope () | Goodness of fit p-valuea | Posterior predictive p-valueb | Residual outlier p-valuec |
|---|---|---|---|---|
| B4-sb2 | 1.58 0.02 | 0.44 | 0.44 | 0.37 |
| B3 | 1.38 0.01 | 0.33 | 0.74 | 0.06 |
| aGoodness of fit of the power law red noise model descibed by Equation 2. | ||||
| bModel comparison of power law red noise model, versus a power law plus Lorentzian (to describe a quasi-periodic oscillation). See text for details. | ||||
| cp-value of the highest outlier in the residuals of the power spectrum divided by the best fit power law slope. | ||||
| Burst | MJDa | Fluence [Jy ms]a,b | S/N a | Lunbiased/I [%]c,d,e | V/I [%]d,e | PPA offset [deg]d | Degrees of freedom | |
| B1 | 58653.0961366466 | 0.72 | 9.87 | 112 14 | 1 12 | 2.96 | 49.7 | 25 |
| B2 | 58653.1112573504 | 0.20 | 9.61 | 88 20 | 4 20 | 5.85 | 0.91 | 2 |
| B3 | 58653.1465969404 | 0.62 | 9.78 | 99 14 | 15 14 | 0.30 | 25.55 | 14 |
| B4 | 58653.2785078914 | 2.53 | 65.42 | 103 4 | 5 4 | 0.02 | 92.83 | 81 |
| B4-sb2 (1 s) | - | - | - | - | - | 0.50 | 445.77 | 121 |
| aFor details on the determination of these values see Marcote et al. 22. | ||||||||
| bA conservative fractional error of is taken for the derived fluences. | ||||||||
| cRemoving the baseline can result in the condition not being satisified, | ||||||||
| which can lead to apparent linear polarisation fractions . | ||||||||
| dThe fractional polarisations and PPA values are measured over the Gaussian-fit 2- region of the burst profile, | ||||||||
| eThe quoted uncertainties are statistical - errors assuming the errors in the Stokes parameters are independent of each other, | ||||||||
| and the errors in the time bins are independent of each other. | ||||||||
| The uncertainties do not contain the calibration uncertainty nor do they encapsulate the effect of removing the baseline. | ||||||||