Polarimetric analysis of STEREO observations of sungrazing Kreutz comet C/2010 E6 (STEREO)
Abstract
Twin STEREO spacecraft pre-perihelion photometric and polarimetric observations of the sungrazing Kreutz comet C/2010 E6 (STEREO) in March 2010 at heliocentric distances were investigated using a newly-created set of analysis routines. The comet fully disintegrated during its perihelion passage. Prior to that, a broadening and an increase of the intensity peak with decreasing heliocentric distance was accompanied by a drop to zero polarisation at high phase angles (, STEREO-B) and the emergence of negative polarisation at low phase angles (, STEREO-A). Outside the near-comet region, the tail exhibited a steep slope of increasing polarisation with increasing cometocentric distance, with the slope becoming less prominent as the comet approached the Sun. The steep slope may be attributed to sublimation of refractory organic matrix and the processing of dust grains, or to presence of amorphous carbon. The change in slope with proximity to the Sun is likely caused by the gradual sublimation of all refractory material. The polarisation signatures observed at both sets of phase angles closer to the comet photocentre as the comet approached the Sun are best explained by fragmentation of the nucleus, exposing fresh Mg-rich silicate particles, followed by their gradual sublimation. The need for further studies of such comets, both observational and theoretical, is highlighted, as well as the benefit of the analysis routines created for this work.
keywords:
polarization – methods: observational – techniques: photometric – techniques: polarimetric – comets: individual: C/2010 E6 (STEREO)1 Introduction
Prior to the turn of the century, most comet observations were limited to the observable night sky, i.e. at significant solar elongations. This prevented observations of most near-Sun comets – which Jones et al. (2018) define as having a perihelion closer than Mercury’s perihelion distance; 0.307 AU or – in their near-Sun regime. The advent of spaceborne solar observatories changed our picture completely: the SOHO (Solar and Heliospheric Observatory, Domingo et al., 1995) spacecraft – and particularly its coronagraph instruments within the LASCO suite (Large Angle Spectrometric Coronagraph, Brueckner et al., 1995) – has at the time of this writing discovered over 4000 new comets111Featured article by S. Frazier for NASA Goddard Space Flight Center: https://www.nasa.gov/feature/goddard/2020/4000th-comet-discovered-by-esa-nasa-solar-observatory, most of them near-Sun comets. The near-Sun environment imposes new extreme conditions on comets via insolation, solar winds, tidal forces, and sublimative torques, all of which can cause disruption to the nucleus directly, and will affect the dust properties directly or indirectly. The sublimative torques, specifically, can rapidly spin-up the nucleus and cause nucleus disintegration at those distances (Jewitt, 1997). It is therefore not surprising that most near-Sun comets break up near perihelion.
While the composition of comet volatiles has been a focus of extensive observations and study over the decades – since spectroscopic observations of the coma and ion tail allow for the identification of the volatile species – the dust composition and structure have remained more elusive. The two space missions which collected cometary dust in-situ and analysed it were Stardust, which was a sample return mission (e.g. Brownlee et al., 2004), and Rosetta, where the samples were analysed locally, specifically with MIDAS and COSIMA instruments (e.g. Rotundi et al., 2015; Langevin et al., 2016). From them we have learned that the dust can be described by either compact or fluffy (highly porous) fractal aggregate particles, ranging in size from tens of micrometres to millimetres, all composed of smaller subunits (Mannel et al., 2016). Starting with missions to comet 1P/Halley Lawler & Brownlee (1992), we also learned that cometary dust is composed mostly of various silicate particles and an organic matrix component, though proportions vary between particles and, indeed, comets Engrand et al. (2016). Notably, the returned samples from comet 81P/Wild 2 taken by the Stardust spacecraft lacked a significant organic component (e.g. Brownlee et al., 2006; Ishii et al., 2008), but remote observations of the coma showed a distinct presence of organics Kissel et al. (2004). The lack of organics in the samples may be attributed to the high-speed collisions with the aerogel during the collection rather than being an intrinsic property of the comet Brownlee (2014). Alternatively, the collection of material may have occurred in an unrepresentative area of the coma of comet, as investigated by Zubko et al. (2012).
Since scattered light is polarised and the precise properties of polarisation depend on the properties of the scattering material – in this case, cometary dust – observation and analysis of polarised light can bring more constraints to our understanding of dust particle structure and composition (e.g. Bagnulo et al., 2006; Kiselev et al., 2015; Levasseur-Regourd et al., 2018; Halder & Ganesh, 2021). Most remote polarimetric observations of comets are concerned with measuring the variation of polarisation of the comet coma with phase angle or wavelength, from which the general polarimetric behaviour of comets has been determined (Kiselev et al., 2015), though occasionally change in polarisation along the tail is also considered (e.g. Hadamcik et al., 2010; Borisov et al., 2015; Hadamcik et al., 2016; Rosenbush et al., 2017; Ivanova et al., 2019). Theoretical modelling of cometary dust has been able to successfully model the observed cometary behaviour so far, with a mix of silicates and refractory organics (e.g. Kolokolova & Jockers, 1997; Kimura et al., 2006; Kolokolova, 2016; Kolokolova et al., 2018; Frattin et al., 2019; Zubko et al., 2020). The effects of the near-Sun environment on the polarimetric properties of cometary dust, however, have rarely been explored before, although more general treatments of expected or observed physical and photometric behaviour have been made (e.g. Sekanina, 2000a; Kimura et al., 2002; Sekanina & Chodas, 2012). In practice, most comet polarimetric analysis of comets to date has been determined for comets beyond the orbit of the Earth and observed from the Earth. Due to geometric considerations, this generally limits the maximum observable phase angle to . Near-Sun comets observed close to their perihelion do not suffer from this limitation, and can therefore provide us with glimpses into the high- region.
The results presented in this work show that polarimetry is a useful tool with which we can probe the effects of the near-Sun environment via the behaviour of refractory material in cometary dust. The results stem from STEREO observations of sungrazing Kreutz comet C/2010 E6 (STEREO). Sungrazers are a subset of near-Sun comets, with perihelion distance between and ( AU) (Jones et al., 2018). Comet C/2010 E6, as described in Section 2, is a typical member of the Kreutz family (Kreutz, 1888, 1891, 1901), the largest known family of comets, all members of which are sungrazers (Marsden, 1967, 1989, 2005; Battams & Knight, 2017). It was discovered in STEREO imagery a few days before its perihelion (Battams et al., 2010), from which it did not emerge, meaning it was likely (like most Kreutz comets) destroyed by the encounter. It was chosen for this study for its relative brightness, its typical orbital properties, and for its particularly clear photometric and polarimetric variability with changing heliocentric distance. Kreutz comets are observed primarily by the SOHO and STEREO spacecraft, all of which have some polarimetric capabilities. Their datasets are therefore a valuable reservoir of polarimetric observations of comets, and particularly for study of the effects of the near-Sun environment.
A new method for data analysis is introduced, inspired by Thompson (2015)’s analysis of pre-perihelion STEREO and SOHO spacecraft observations of comet C/2011 W3 (Lovejoy), and his later work on comet C/2012 S1 (ISON) (Thompson, 2020). The major difference between the approach to analysis in those works and here is that the spatial position of the comet is here determined from its orbital parameters, whereas Thompson (2015) uses simultaneous observations by both STEREO-A and B spacecraft (described in Sec. 2) to determine the comet’s position. The approach presented here allows for analysis of the comet even when only one spacecraft observes it, and it therefore has wider applicability. On one hand, this is very useful because it extends our window of observation: a longer time-series in the rapidly changing near-Sun environment helps draw more concrete conclusions, as exemplified in this work. On the other hand, since STEREO-B’s loss of contact on 1st October 2014222More information available here: https://stereo.nascom.nasa.gov/behind_status.shtml, only STEREO-A has been sending data back to Earth. All near-Sun comet observations since that date present a perfect application of the new method, being independent of simultaneous observations.
2 Observations
The comet discussed in this work was imaged by the twin STEREO (Solar Terrestrial Relations Observatory) spacecraft; A (Ahead) and B (Behind). Launched in October 2006, the spacecraft sit in heliocentric orbits just inside (STEREO-A) and outside (STEREO-B) the orbit of the Earth (Kaiser et al., 2008).
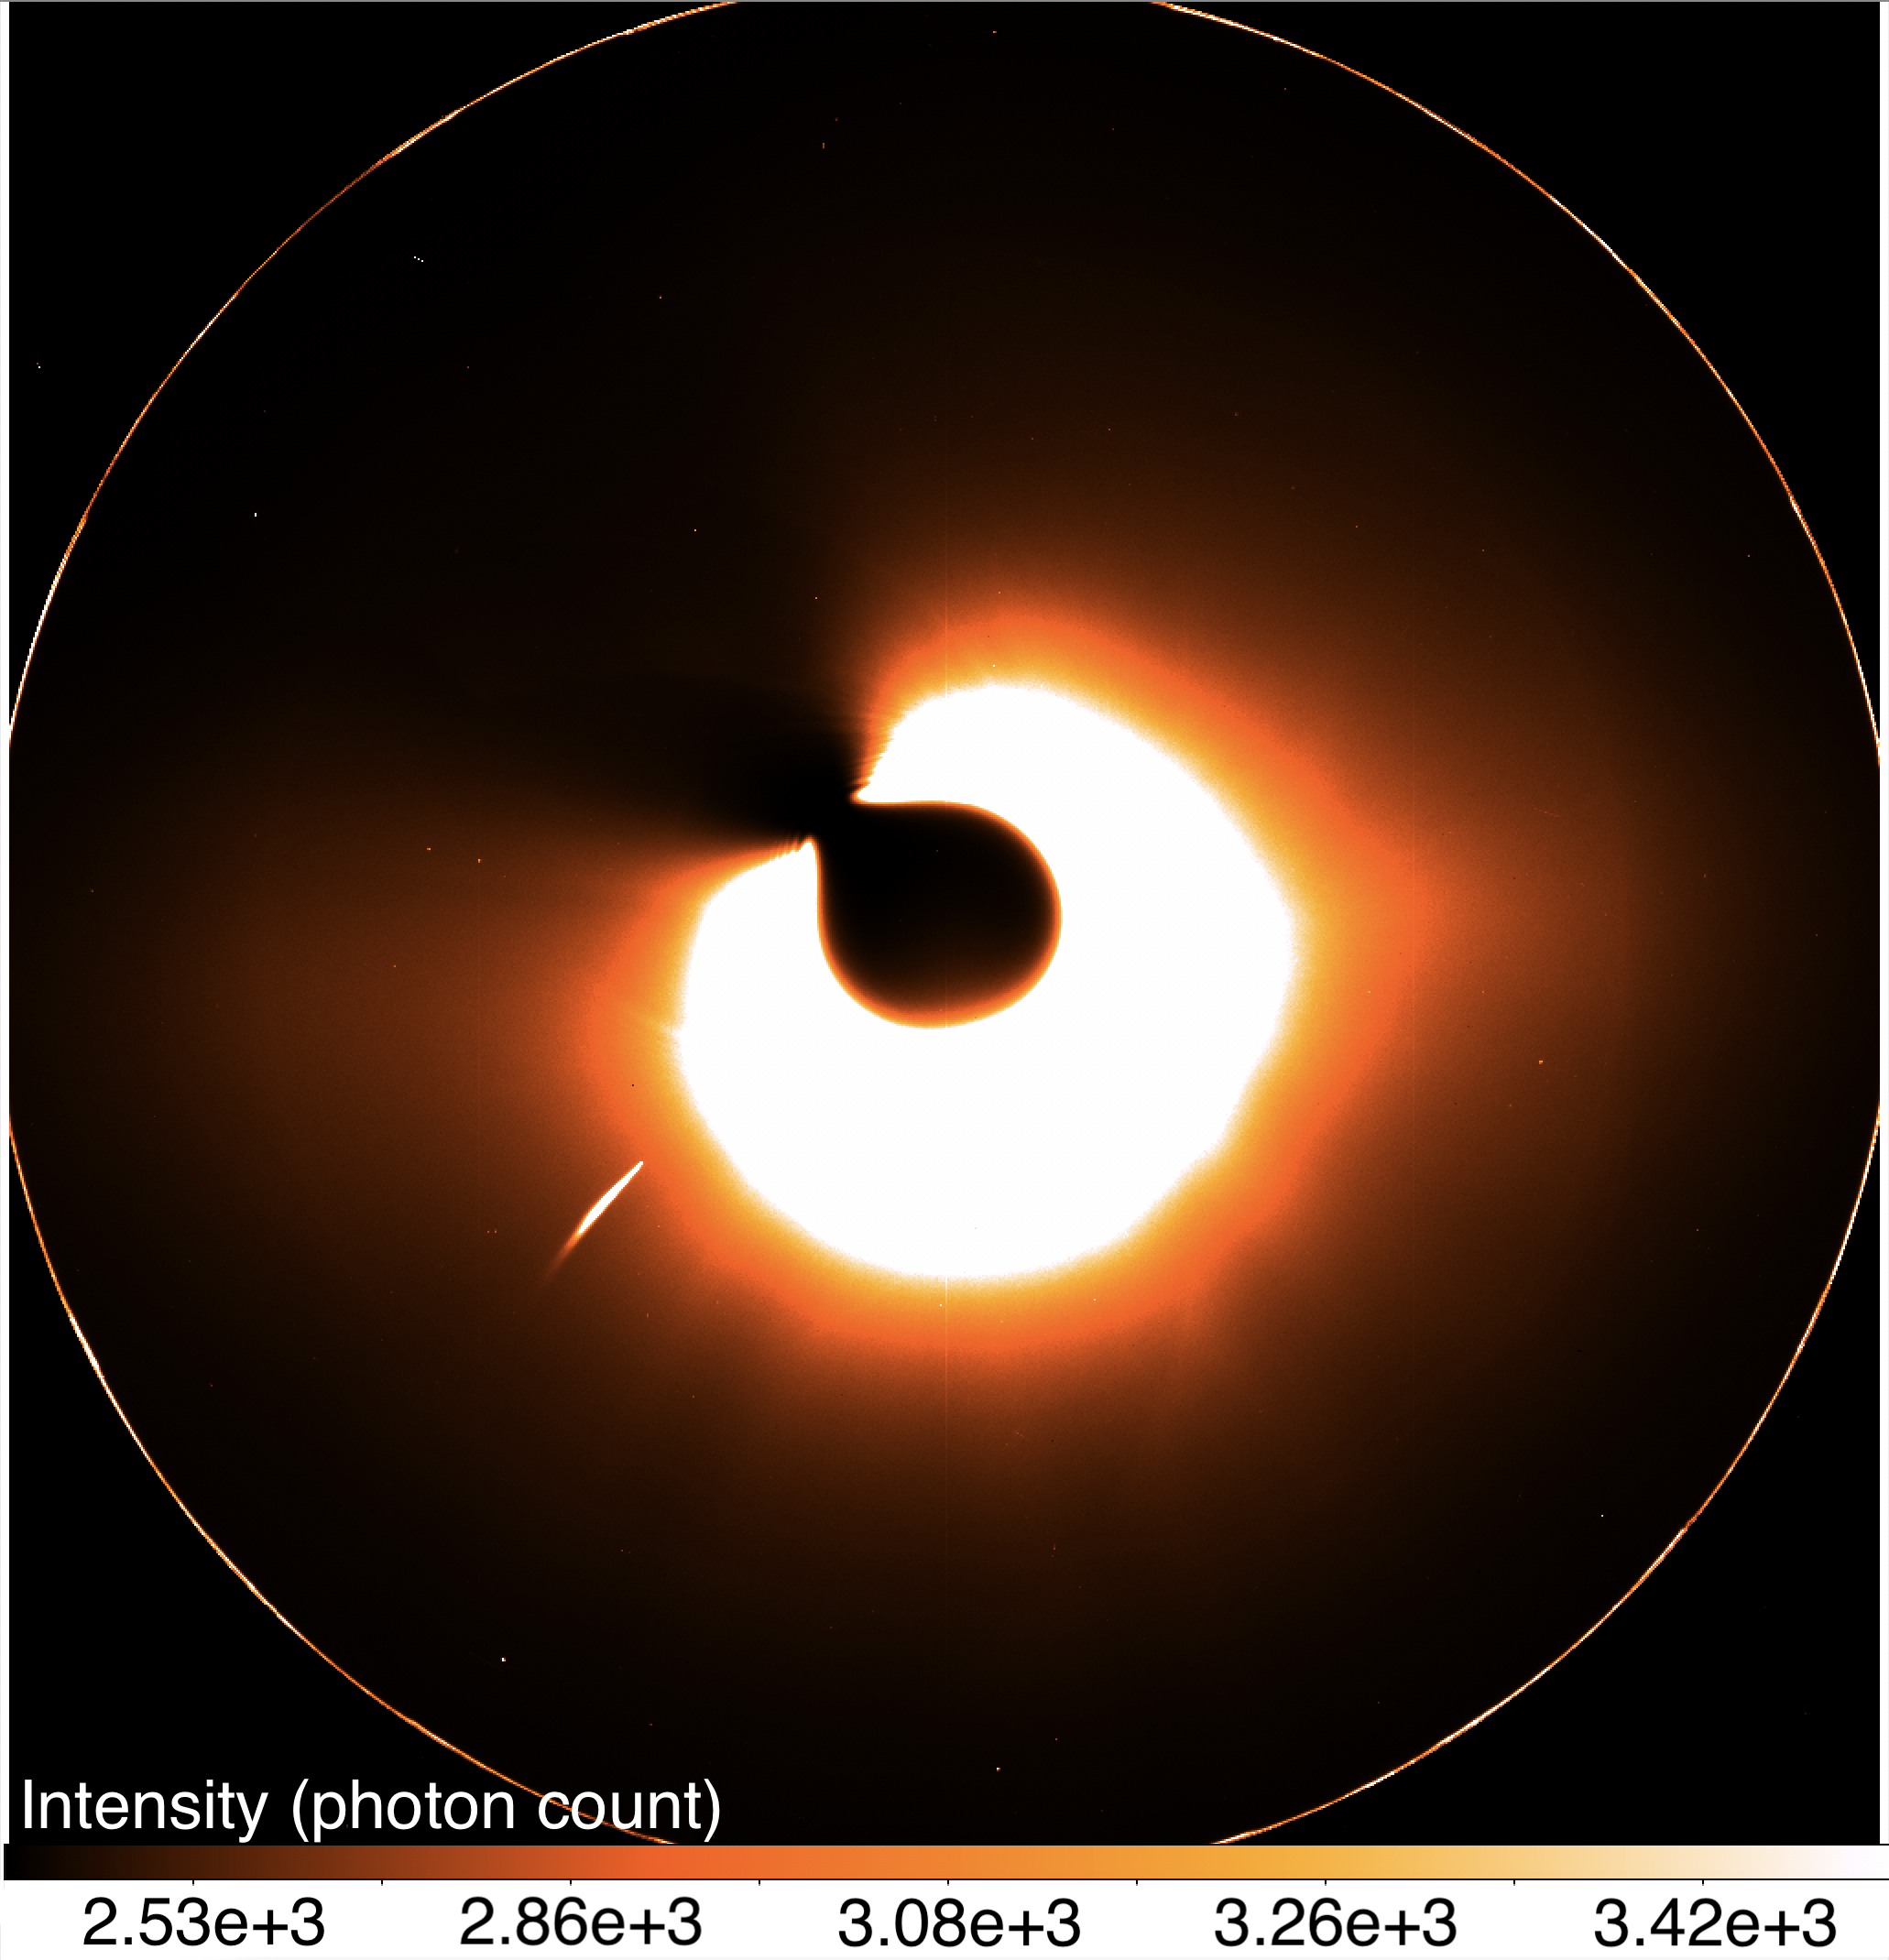
The equipment on the two spacecraft includes a set of coronagraphs in the SECCHI (Sun Earth Connection Coronal and Heliospheric Investigation) instrument suite (Howard et al., 2008; Bewsher et al., 2010). In this work only COR2 visible light (bandpass nm) coronagraph imagery is used. Its field of view, occulted in the centre, is between 2 and 15 solar radii at the Sun (), and its CCD size is 2048x2048 pixels, with resolution of 15 arcsec/pixel; see Figure 1. Like all coronagraphs, it suffers from some vignetting near the occulted region. Lack of different bandpass filters prevents a multi-wavelength analysis of the data.
Permanently in the light path of COR2 is a linear polariser which can be set at three rotation angles: , , and relative to a reference position. A sequence (triplet) of images using the three different polariser angles in quick succession is taken either twice (2006-2009) or once (2009-) per hour, with other observational procedures (generally using rotation angle of only) taking place the rest of the time. For observations discussed here, the polarimetric triplet imaging sequence was conducted hourly with images of the triplet taken in quick succession at , , and UT past the hour, with an average exposure time of 6 seconds. This procedure was identical for both spacecraft.
The comet observed and presented here is C/2010 E6 (STEREO). It belongs to the Kreutz family (or group) of sungrazing comets, meaning comets with perihelion distance below (Jones et al., 2018). Kreutz comets are the largest known family of comets, representing of SOHO comet observations (Battams & Knight, 2017). They share extreme orbital characteristics, namely high eccentricity, small perihelion distance, and high orbital inclination, though some variations within the group exists, leading to a common differentiation into two groups Marsden (1967, 2005); Sekanina & Chodas (2004). Due to highly elliptical trajectories and short observation windows, their eccentricity is often assumed to be .
The average size of a Kreutz comet is estimated at m, with the smallest observed members at m (Sekanina, 2003). They are thought to have originated from a single parent body which fragmented over the course of a few centuries or millenia, with the orbit moving closer to the Sun (Sekanina & Chodas, 2004, 2007). This may be a typical dynamical end-state of comets (Bailey et al., 1992). The orbital parameters of Kreutz comets overall and of comet C/2010 E6 – which had orbital parameters typical of its family – are presented in Table 1.
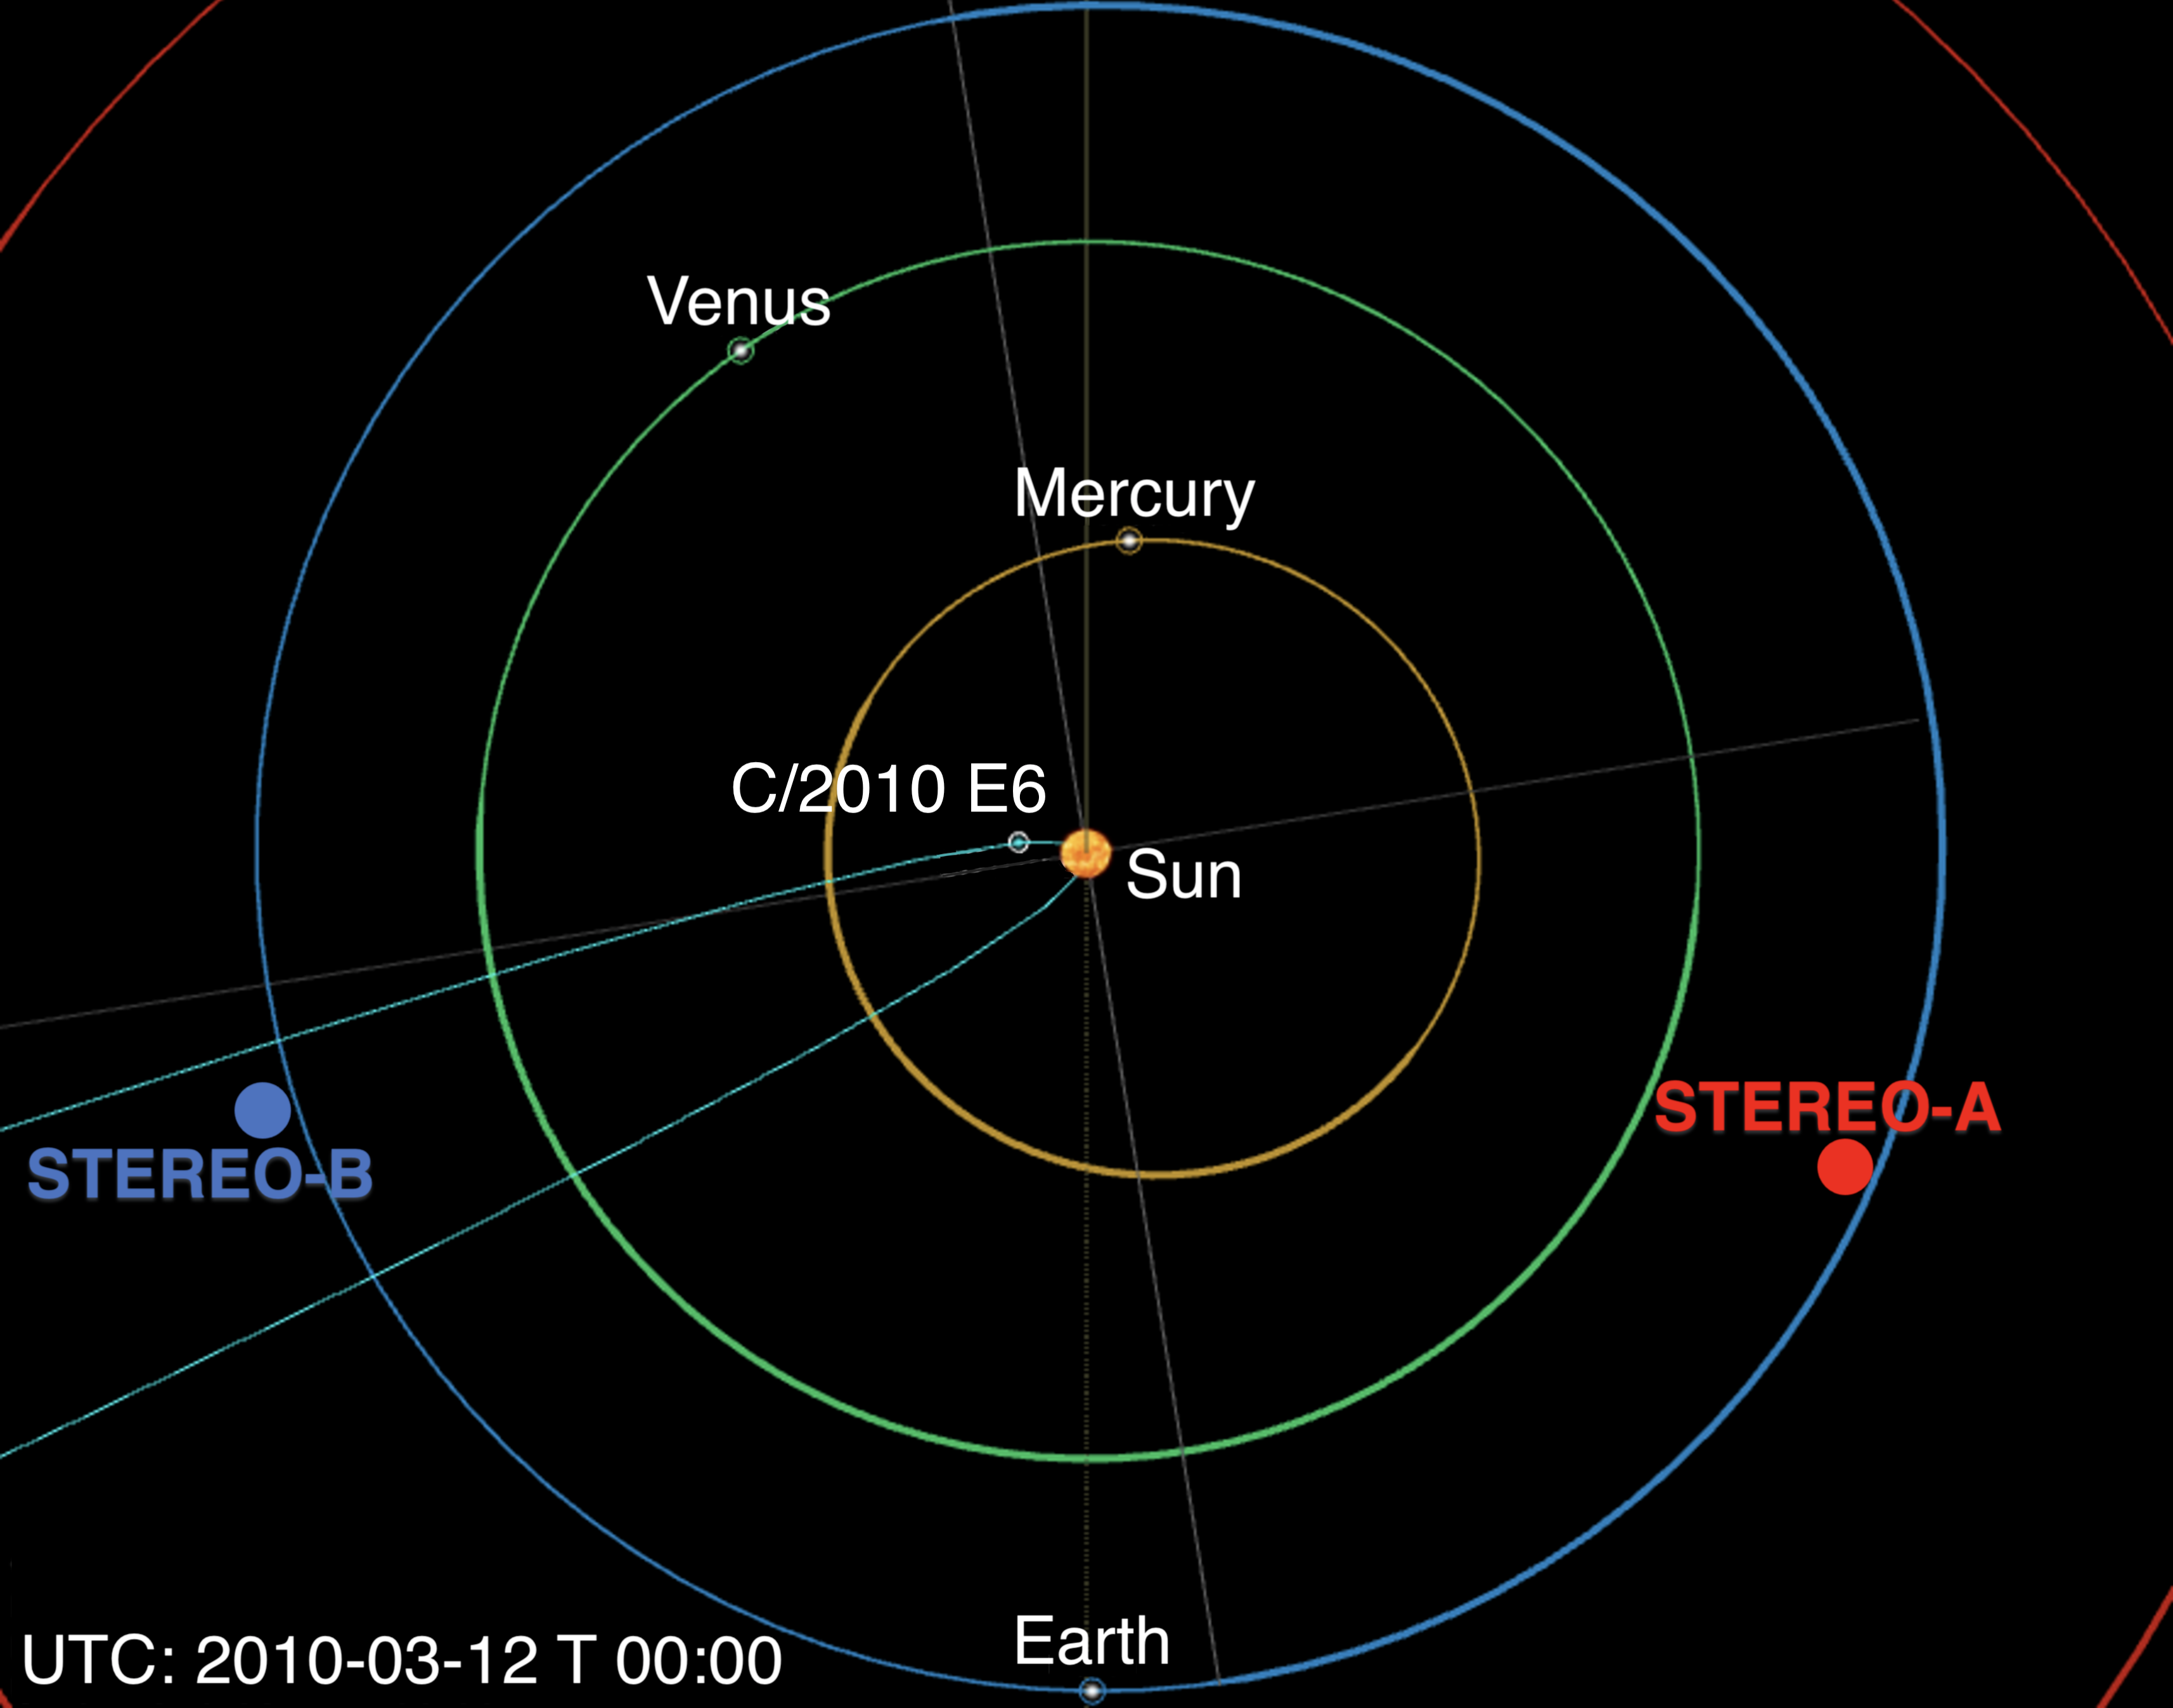
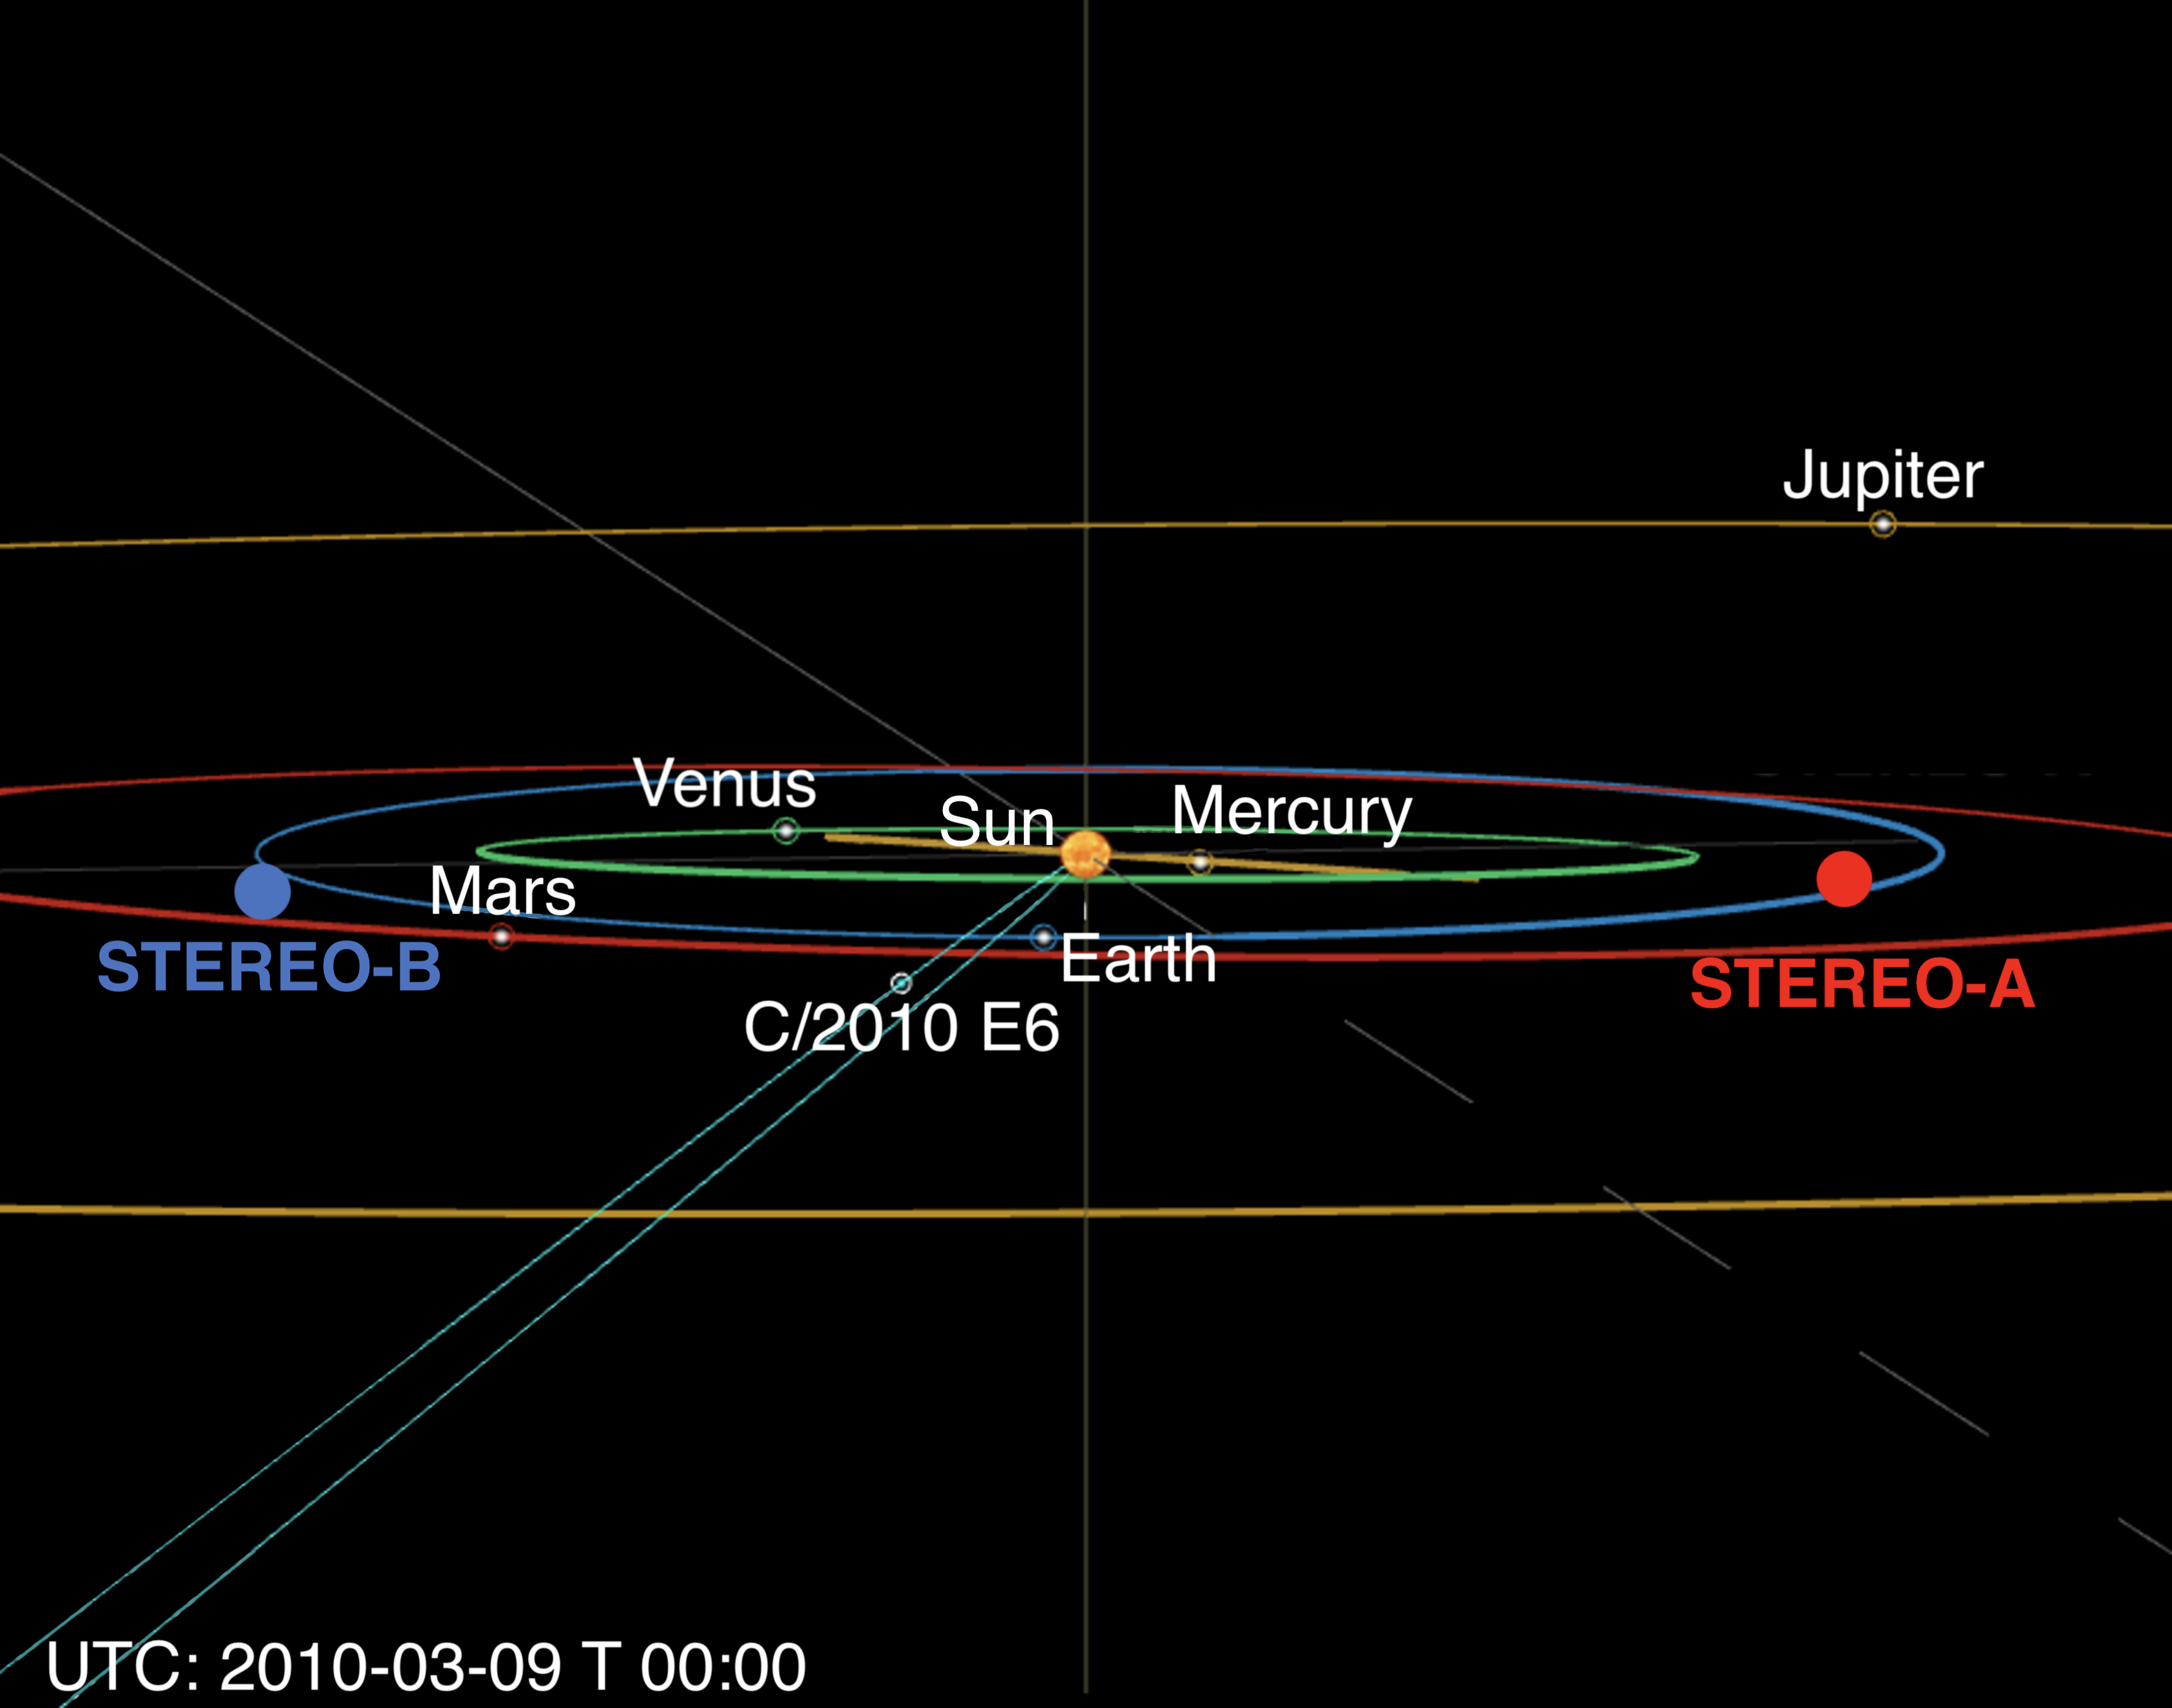
Virtually all Kreutz comets are observed only prior to perihelion and presumably fail to survive it due to their small size and small perihelion distance. The same is true for comet C/2010 E6. Extrapolating from the theory of Kreutz group formation, it is presumed that the comet fragmented from the parent near its previous perihelion, making this its only perihelion passage as a distinct object. Additionally, the comet has both a faint precursor, C/2010 E10 (SOHO) and a pair of faint successors – C/2010 E11 and E12 (SOHO) Ruan et al. (2010) – the three companion fragments are separated from the bright comet E6 by about a day on either side. Such observations have precedents: several near-Sun comets have been observed arriving in pairs or larger clusters within a few days of one another Knight et al. (2010). The main theory describing them posits that they are a result of non-tidal, secondary fragmentations occurring at large heliocentric distances (Sekanina, 2000a, 2002). It may be of interest to compare their photometric and polarimetric properties to that of comet E6 in the future, though it is possible they are not closely related, beyond simply belonging to Kreutz family. The orbit of the comet in the context of the inner Solar System from two different vantage points as well as the locations of the twin STEREO spacecraft at the time of these observations are presented in Figure 6.
Comet C/2010 E6 (STEREO) – discovered by STEREO – was seen in both STEREO-A and B SECCHI/COR2 fields of view, in the former from at 15:08 UT (heliocentric distance of nucleus ) to at 19:08 UT (), in the latter from at 23:08 UT () to at 21:08 UT (), which includes 18 hours of simultaneous observations with both spacecraft. As discussed in Section 4, the comet coma underwent significant brightening as it approached the Sun; from to at its peak, a near fifty-fold increase in brightness in 23 hours (from at 15:08 UT to at 14:08 UT). Due to the comet’s proximity to the Sun, the latter cannot be trivially assumed to act as a point source; the Sun subtends an angle of at the largest heliocentric distance of the nucleus observed in this work (, as above), and an angle of at the smallest observed heliocentric distance (). This effect is explored further in Sections 4 (Results) and 5 (Discussion).
The comet was also observed by the SOHO/LASCO C2 and C3 coronagraphs. SOHO/LASCO coronagraphs are arranged differently from STEREO/SECCHI ones. Most notably, unlike the latter, the former includes three distinct polarisers at three different rotation angles (, , and ) mounted on a filter wheel alongside a clear glass position (no polariser) and another filter (Brueckner et al., 1995). This means, firstly, that a polariser is not permanently in the light path, and a full set of polarimetric images is generally only taken once per day (C3) or times per day (C2). Secondly, the polariser of the C3 coronagraph has been out of commission for most of the SOHO mission lifetime, though workarounds using the clear glass image may be used to compensate for that (e.g. Grynko et al., 2004; Thompson, 2015). Thirdly, SOHO mission is in part a more prolific comet discoverer than STEREO due to the wider bandpasses on the coronagraphs which include the NaI doublet (Biesecker et al., 2002). That is strong in many near-Sun comets, making them brighter than in STEREO imagery. The inclusion of strong gas signatures in SOHO filters, however, may contaminate polarimetric signal from the cometary dust. Thompson (2015) has shown that these drawbacks make SOHO data much less useful for discussion of polarimetric properties. Comet C/2010 E6 passed very near the support for the occulter disk for the C3 coronagraph, making photometric data less reliable as well. SOHO data analysis of the comet is therefore not included in this work.
| Orbital parameter | Kreutz | C/2010 E6 |
|---|---|---|
| Orbital inclination [∘] | ||
| Longitude of the ascending node [∘] | ||
| Argument of perihelion [∘] | ||
| Eccentricity | ||
| Distance of Perihelion [AU] | ||
| Date of Perihelion Passage | ||
| Time of Perihelion Passage (UT) | 21:26 |
3 Data Reduction
The image analysis and data plotting were both conducted using a bespoke IDL (Interactive Data Language777IDL version 8.7, Harris Geospatial Solutions, Boulder, Colorado) package named composite (comet polarisation systematic integration-based analysis technique). It is a semi-automated series of routines fine-tuned for use with STEREO/SECCHI/COR2 polarised image triplet data. It was inspired by similar work on STEREO observations of comet C/2011 W3 (Lovejoy) (Thompson, 2015) and, more recently, comet C/2012 S1 (ISON) (Thompson, 2020).
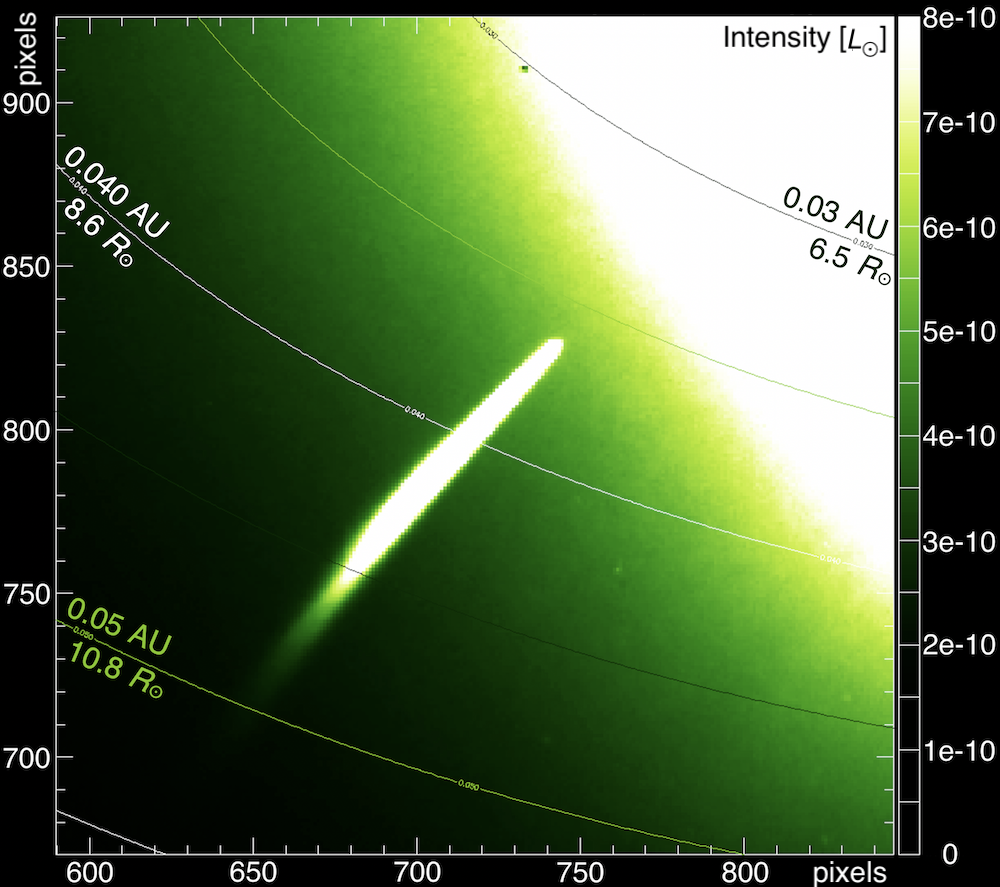
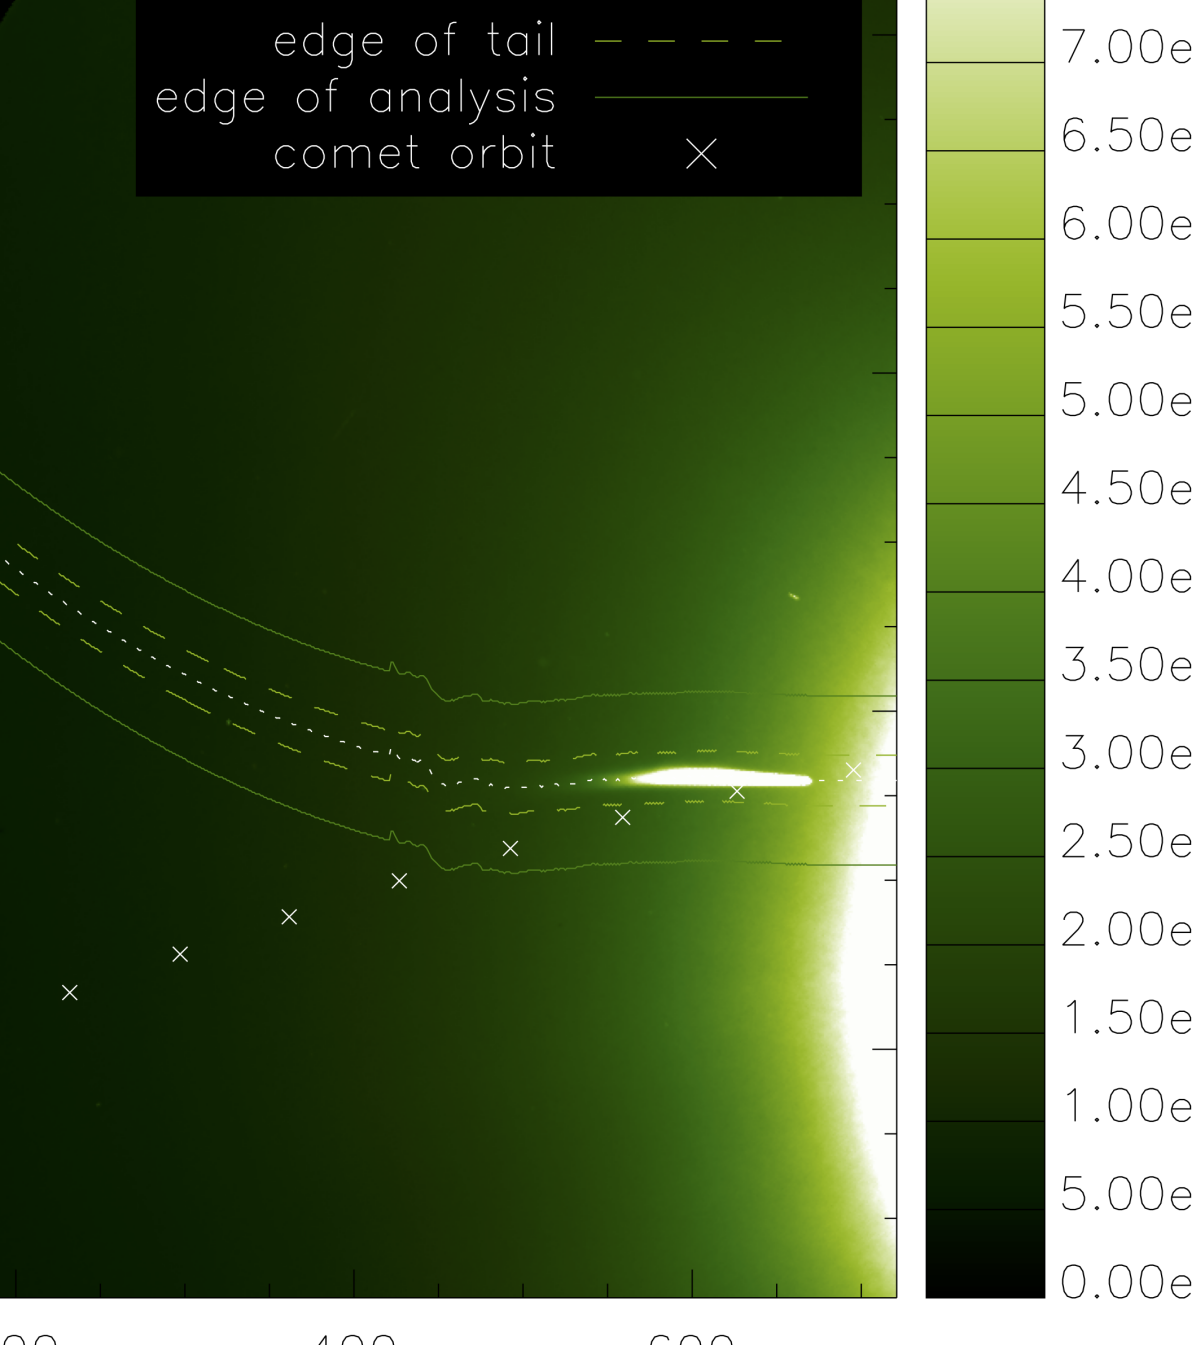
Initially the image triplets undergo standard pre-processing using the SECCHI_PREP routine from the SolarSoft library for IDL – a handful of other useful SolarSoft routines is utilised within composite as well (Eichstedt et al., 2008; Freeland & Handy, 1998). Orbital parameters for the comet from the relevant Minor Planet Center circular are utilised (Battams et al., 2010). Along with the positional and pointing information of the spacecraft, they are used to find the plane of the comet’s orbit, in which the dust tail is assumed to lie; all data points in the images are then mapped onto this plane. From this the distances between the comet (and points along the tail) and the Sun, the spacecraft, etc. can be determined, as well as all the relevant angles, including the phase angle between the Sun, the comet and its tail, and the spacecraft. Some of the extracted data is overplotted on the coronagraph imagery in Figure 3.
Then, for the full time interval in which the comet is seen in the coronagraph , the comet photocentre (the intensity peak in the coma region) is found interactively in the image triplets. The comet tail is then traced in each separate image using two different methods – the first using detailed tracing the local brightness peak, the second interpolating a smoother trace from the first – and a visual inspection of the tail tracing performed as a quality check. Without that quality check, background objects and image artefacts may dominate the tail tracing direction. Points beyond the distinguishable tail region will be dominated by them, and are discarded in the final step of data processing; e.g. it is clear in Figure 4 that traces more than px to the left of comet photocentre trace the background image rather than the – by then nonexistent – tail. The image is rotated so that the pixels along the tail form a near-horizontal line for easier creation of cross-sections. The successive transverse (vertical) cross-sections are found, starting ahead of the comet photocentre and progressing along the tail (or, if the tail is short, tracing the background signal) until the edge of the image.
Being traced along the comet tail, the cross-sections are centred on the intensity peak caused by the comet; see Figure 5 for an example. A central ‘tail region’ is reserved and a local cubic background fit determined for each cross-section, excluding the ‘tail region’. The limits of the ‘tail region’ and the cubic fit region depend on the brightness profile of the comet; the former may generally be 20-30 pixels (10-15px on each side of the peak) and the latter 60-100 pixels (30-50px on each side of the peak). They are determined based on the maximum width of the comet signal in the full imagery dataset: for comet C/2010 E6 they have been chosen as tail region of 20 pixels and cubic fit region of 60 pixels in STEREO-A data, and 30 pixels and 100 pixels, respectively, in STEREO-B data due to the differences in tail brightness stemming from different geometry of observations (see Fig. 6).
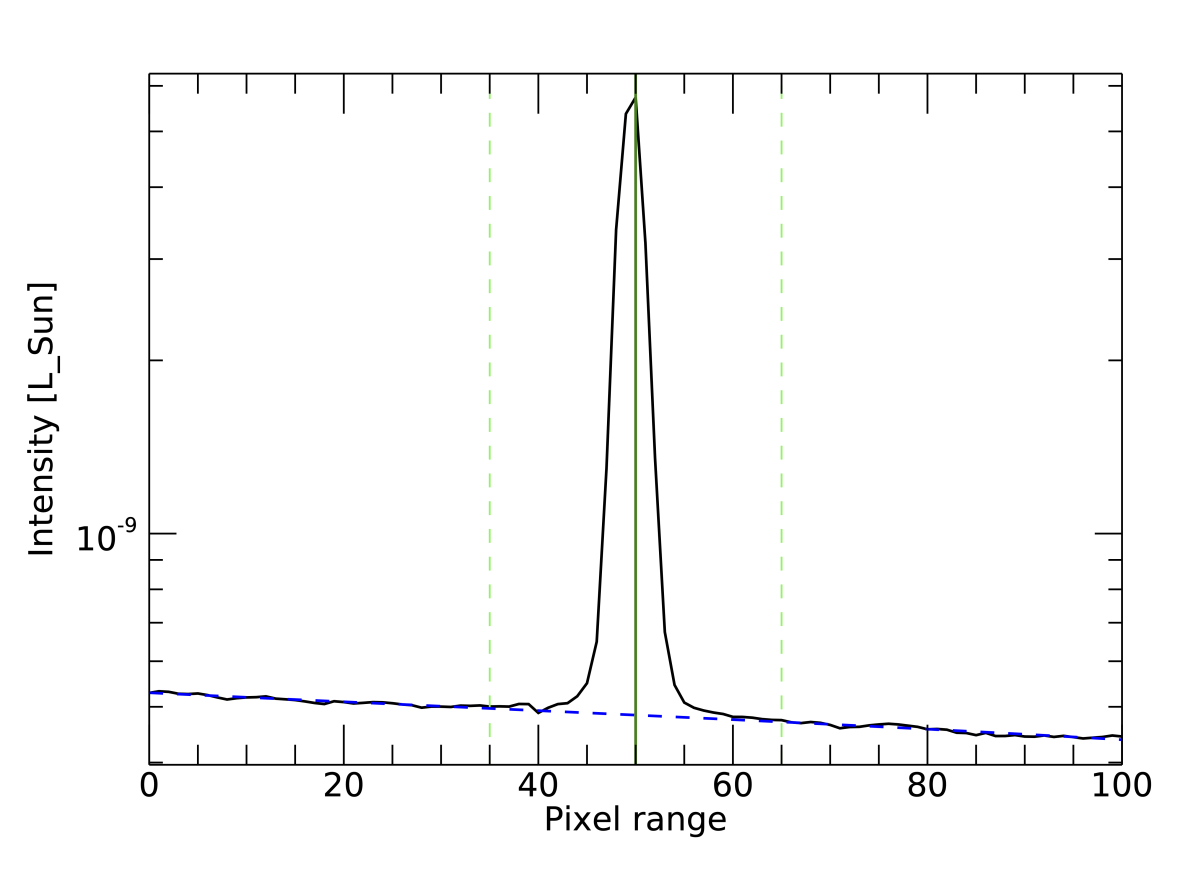
High quality background subtraction is challenging in the coronagraph imagery of the highly spatially and temporally variable near-Sun environment, and multiple background fitting options were considered. Using images taken within a few hours of the target image as reference is not suitable for this application, as the comet takes several hours to pass across the field of view. Due to the high orbital inclination of Kreutz group comets the curve of their dust tails – observed from the ecliptic plane – usually closely follows their orbit. Thus a ‘background’ image will itself likely include the comet overlapping the ‘foreground’ comet imagery, corrupting the results. Alternatively, an image prior to the comet’s appearance in the field of view may be used, but the variability of the near-Sun environment on the scale of hours is significant enough to make that option unreliable. A cubic fit is instead applied to each cross-section to remove the background (see Fig. 5), and the ‘tail region’ truncated (integrated) to a single step for each cross-section. This is done in order to boost the signal, since the image resolution is invariably too poor for tracing two-dimensional variability. The process is repeated for each longitudinal step of 1 pixel, and for each image in the triplet.
The three resulting polarised intensity vectors from the three orientations of the polariser in the image triplet – , , and (for the orientations of , , and , respectively) – are then coarsely aligned with each other based on the orbital information, with additional fine-tuning minimising the differences of the three curves. The movement of the comet in space in the 30 seconds between each image in the triplet has a negligible effect, however the comet can move by up to 2 pixels as the filter is rotated, likely due to optical effects. This prevents a simpler analysis method where the full coronagraph images could be analysed at once by simple stacking, without explicitly identifying and tracing the comet in the field of view. Due to the narrowness of the comet tail, the sharp transitions between the tail and the background, and relatively low spatial resolution of the imagery, such simplified stacking produces highly distorted results dominated by artefacts and is not utilised here. Furthermore, a correction value must be included to factor in geometric offset effects. It takes into account the position angle of the scattering plane with respect to a chosen reference point, as well as instrumental effects, in particular potential offsets of the polarisers from that reference point.
From here the Stokes parameters defining the intensity (Stokes ) and the degree of linear polarisation – reduced Stokes and ( and ) – can be calculated along the tail as follows, with :
| (1) |
| (2) |
| (3) |
The standard calculation of uncertainties assume that shot noise scales with the inverse of the signal-to-noise ratio, but the more pertinent measure of uncertainty is the degree of scatter in polarimetric plots. The uncertainties derived from the comet signal analysis are negligible for high signal-to-noise ratio, but slowly increase moving along the dimming comet tail, up to a few percent in polarisation at largest cometocentric distances. The uncertainties from aligning the images from the triplet are more difficult to quantify. They have been minimised by truncation (integration) of the tail cross-sections, increasing the signal-to-noise ratio, and by visual inspection of the alignments. The knock-on effects of potential misalignments will be the greatest in two regions: first at the photocentre of the comet, where small variations in the relative slopes of the polarised intensity curves can significantly affect the calculated polarisation, and second at large cometocentric distances, where low signal can cause large variations in absolute values of polarised intensity. Due to the relatively low resolution of observations, this effect cannot be fully avoided. The potential for errors inherent in the first section affecting the overall conclusions is discussed in Section 5. Since the calculated uncertainties are lower than the scatter of the data points, error bars are not included in the plots, with the degree of scattering better indicating the quality of the data.
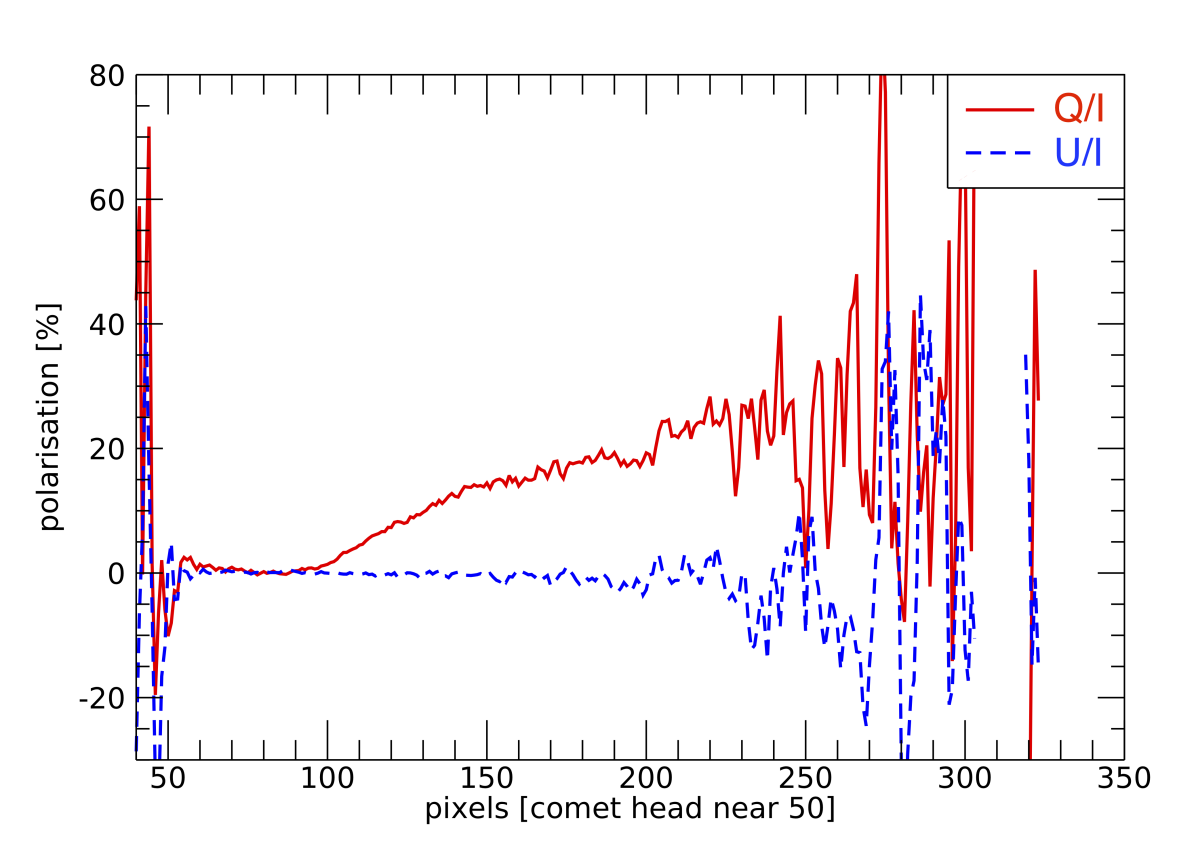
The upper cut-off point for the plots is the edge of the tail as determined by a combination of visual inspection of tail tracing and the degree of scatter of Stokes parameters, as well as scatter of the total degree of linear polarisation (where ). Comparing the scatter in Figure 6 to the tail tracing in Figure 4, we see the data beyond th pixel along the tail away from the comet photocentre (i.e. pixel values there and the -axis pixel values in Fig. 4) can be ignored, since the tail tracing method was derailed by either background signal or various artefacts as the signal-to-noise ratio along the comet tail deteriorated. Such data beyond the realistic observational limit of the comet tail is not used in any of the remaining analysis.
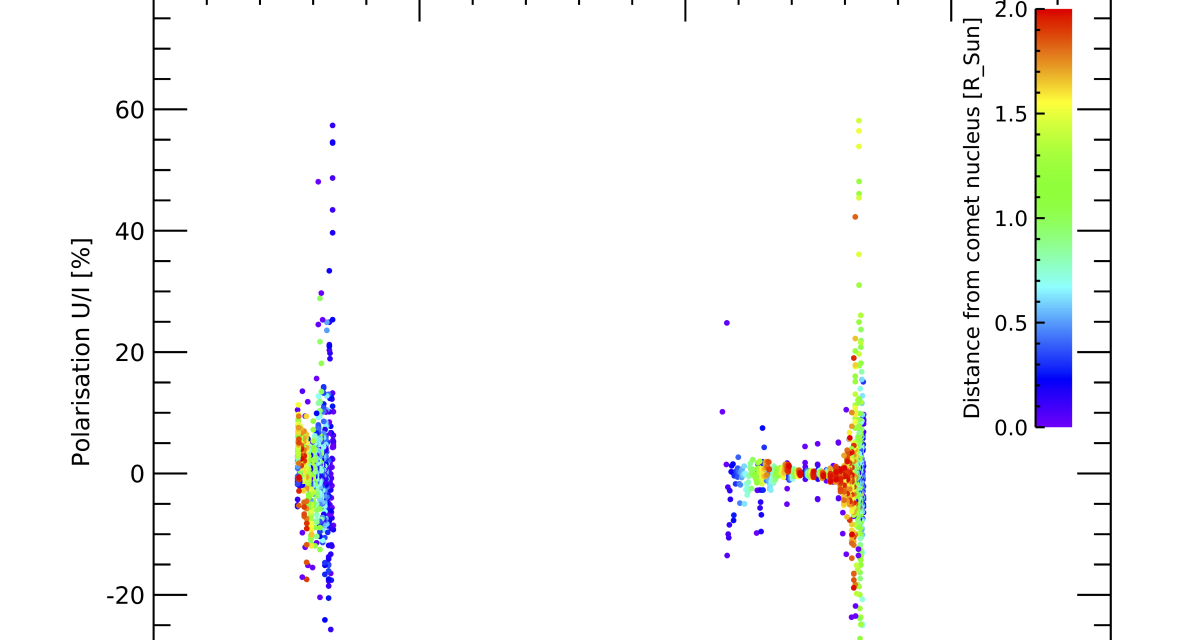
The large calculated range of polarisation at the comet photocentre, seen in the following section, should be highlighted here. Some of this apparent large range (particularly in STEREO-A data) is due to real variability along the near-nucleus tail, better seen in Figure 8, whereas the sparse data points with highly negative polarisation seen especially in STEREO-B data are artefacts of the polarisation calculations derived from low-resolution imagery, indicated in the previous section. The analysis procedure generally produces tail traces as smooth curves of related data points, which agrees with the theories of light scattering from evolving dust particles, and thus major deviations from those curves are likely to be artefacts. Figure 7.ii is included as a check for reliability of Fig. 7.i data: since should be zero: this is expected when the dust particles don’t have a preferred orientation in space, and has been consistently born out by polarimetric observations of cometary dust thus far. Significant deviations from that will show a reduction in quality of the data rather than a change in physical characteristics.
4 Results
4.1 Sun as an extended source
Before we discuss the observational results in full, the effect of the Sun as an extended source must be investigated. For the data closest to the Sun (at heliocentric distance of ), the Sun subtends an angle of in the sky. This has an effect not only on the processes affecting the comet – such as dissociation, ionisation, and sublimation, affected by the photon fluxes as well as the solar wind and local temperature (e.g. Jones et al., 2018) – but on geometric considerations like the phase angle and scattering plane of the incoming radiation.
The maximum variations in the phase angle and in the angle of the scattering plane from the expected (mean) value both equal half the angular size of the Sun in the sky and are perpendicular to one another. This varies from to (see Sec. 2). To consider the effects such a large spread of angles may have on the results of this investigation, a number of factors must be taken into account. Assuming the Sun is a perfect sphere – effects of oblateness are minimal when compared to the effect of non-negligible angular size – the sum of all light rays will average to the expected (mean) value of the phase angle, and to the scattering plane expected from a central point source. Thus the reported values of phase angle and polarisation remain valid as the mean value characterising the observing geometry. Additionally, the fact that light from near-mean angles comes from a larger area than light from near the edges (due to the nature of a sphere), in combination with limb darkening, means a greater proportion of incoming light will have mean or near-mean values rather than values from near the edges. These factors will likely diminish the effect of the non-negligible size of the Sun on the results.
We have analysed the potential effect of the spread of scattering planes of incoming light on the observed Stokes parameters. Light from a scattering plane e.g. from the mean one – used for calculations – will act as light polarised at a angle to the mean orientation. Due to symmetry, this angled light will, when arriving from both sides of the Sun, reinforce in Stokes calculations, but cancel out in Stokes calculations. This means the deviation cannot be traced using Stokes alone. Indeed, an investigation of Fig. 7.ii reveals no evidence of deviation: STEREO-B data (higher phase angles) shows an increase in spread of with increasing phase angle, which correlates with increasing heliocentric distance and therefore fainter signal and is actually anti-correlated with the angular size of the Sun.
Investigating the effect of Sun as an extended object on the observed Stokes , and of limb darkening in particular, we found that even at the closest heliocentric distances discussed in this work, the signal from the central regions will greatly dominate that from the limbs. For fully linearly polarised light, from the limbs would register as instead of , and the effect scales with polarisation (i.e. the signal from that angle will always be diminished by that factor), but when the effect is averaged over the limb-darkened surface of the Sun, the average signal is scaled only by a factor of compared to the true signal. The effect also rapidly diminishes with heliocentric distance: at , the factor is , and at it is . It should be noted that limb-darkening calculations were done using results at AU; closer to the Sun the limb regions will be even darker, so the factors calculated above are lower estimates, and the real effects are likely even less prominent. This source of error, then, is generally smaller than other sources of uncertainty in this analysis, and can be safely ignored. It is, however, systematic in nature, so it could be accounted for in the results if the need arose.
The effect of the Sun as an extended object on the phase angles of the light is more straightforward: if STEREO-A observations at the smallest heliocentric distance () were taken at the phase angle of , but the Sun subtends in the sky at that point, so the full range of phase angles of light reaching the coronagraph camera will be to . The lower end of that range sits firmly within the standard negative polarisation branch observed for comets, which might go some way towards explaining the negative polarisation seen in the data (e.g. Fig. 8). The higher end, however, sits firmly in the positive branch, so the two effects may cancel out, depending on the slope of the phase angle curve.
Furthermore, the same consideration must be applied here as for the scattering angle: off-centre contributions will have, proportionately, less of an effect than central ones. The inner tenth of the angle range contributes to the total intensity, while the outer tenth (both limbs combined) contributes only (using limb-darkening estimates at AU again, making the latter an upper limit). Scaling the deviation from the central phase angle with the relative amount of signal produced at those deviations, we find that the error for the phase angle may be quantitatively expressed as of the angular radius of the Sun. For the example of STEREO-A data from the previous paragraph, we thus have . This error, like the angular size of the Sun, rapidly diminishes with distance. Due to peculiar behaviour of comet C/2010 E6 (STEREO), it is unclear if this spread of phase angles has any significant effects on the observations.
Thus, the effect of the Sun as an extended light source on phase angle and polarisation cannot be easily ascertained from the data presented here. No significant effect is produced from the scattering angle variation, and the phase angle variation, while notable on its own, might not have a significant effect on the results unless the phase angle curve is not smoothly increasing or decreasing. This may be fruitful ground for future investigations, however. Ideally the same comet would be observed at the same phase angle twice or more: once when the comet is at some distance from the Sun, where it may be treated as a point source (e.g. at AU or above, where it subtends ), and once much closer to the Sun, with its angular size at several degrees. Then the difference in the polarisation signatures could begin to be attributed to the broadening of the phase angle signals in particular. Even then the effects of the near-Sun environment during the second observation would need to be taken into account first, so a near-Sun comet with known properties like 96P/Machholz might be a good candidate instead of a Kreutz comet. It is possible, though unlikely, that a comet has already been fortuitously observed in this manner: the STEREO and SOHO spacecraft tend to only observe comets when they are very close to the Sun, while most near-Sun comets have not been observed beyond AU, especially not with polarimetric equipment. Comet C/2012 S1 (ISON) might have been a good candidate, as the Hubble Space Telescope made polarimetric observations of it at AU, but the phase angle was (Hines et al., 2014) while the Sun-observing spacecraft only saw the comet at higher phase angles within their coronagraphs Thompson (2020). The Vera C. Rubin Observatory should significantly increase the number of comets discovered at distances beyond the range of solar observatories (see e.g. Silsbee & Tremaine, 2016), which will aid in future dedicated observing campaigns of comets. This, in turn, will make it easier to track comets’ polarimetric signatures through time, and increase the chances of observing a comet at the same phase angle twice or more in polarimetric mode, especially in conjunction with observatories like STEREO-A, i.e. far removed from the vantage point of the Earth.
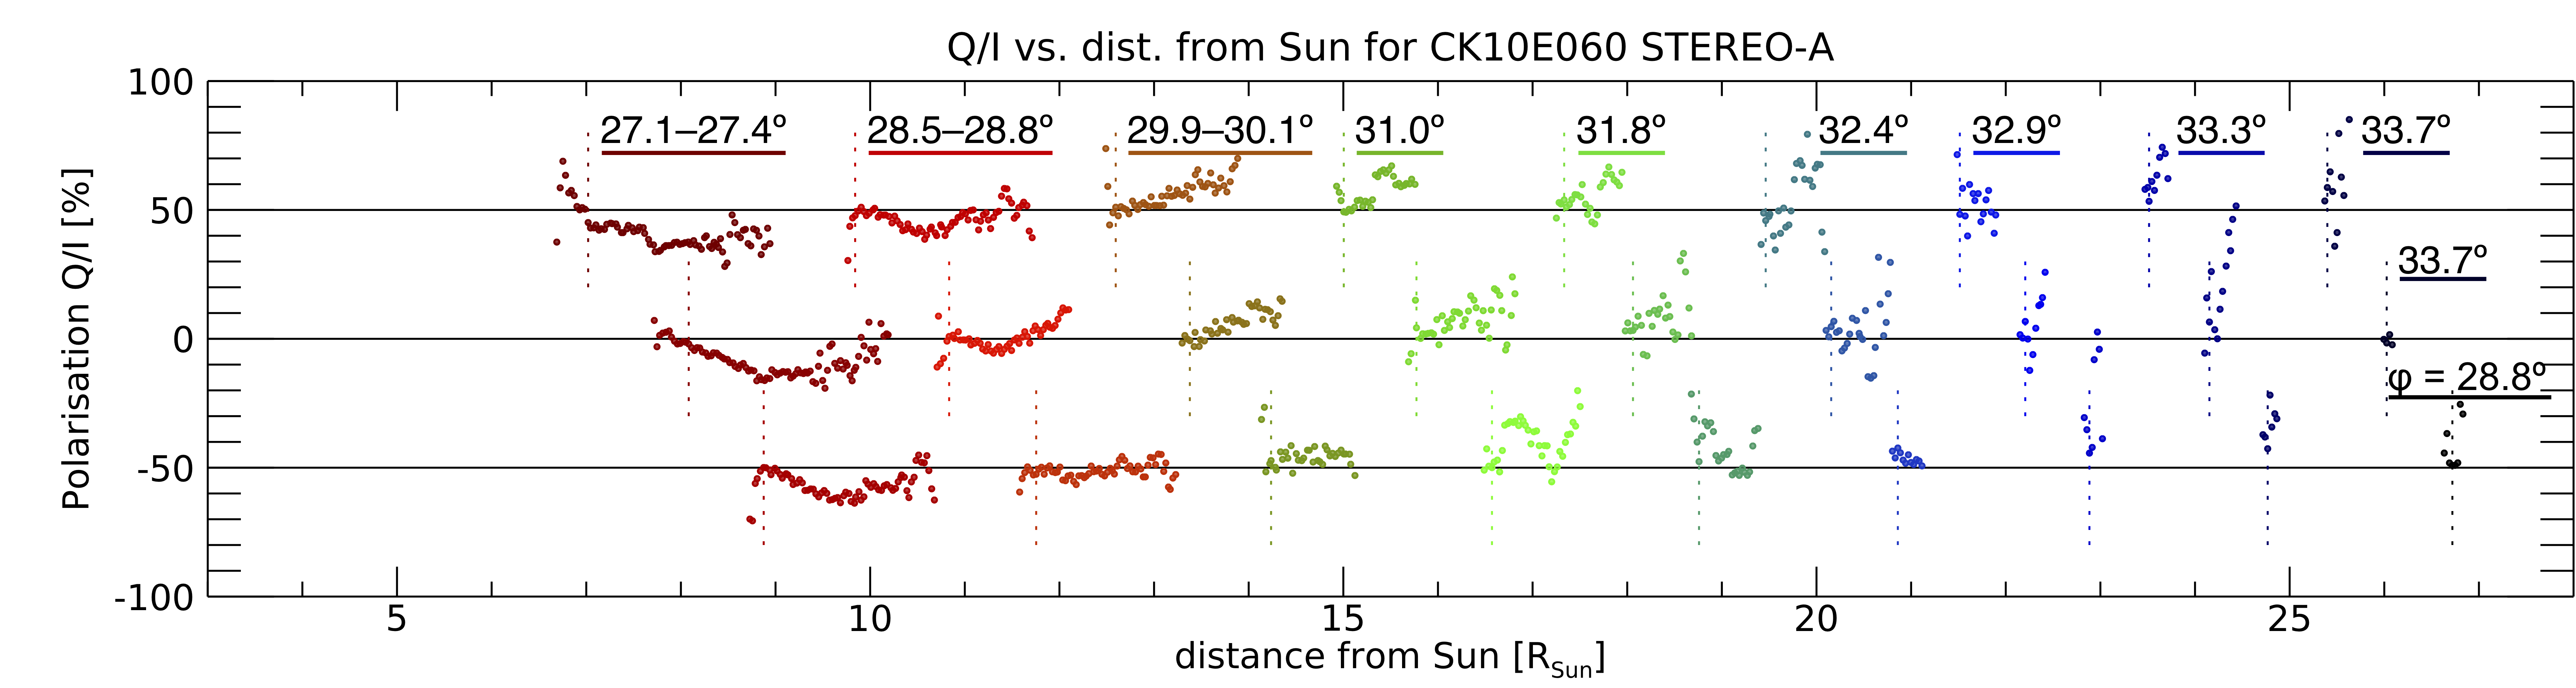
4.2 Phase Angle Curves
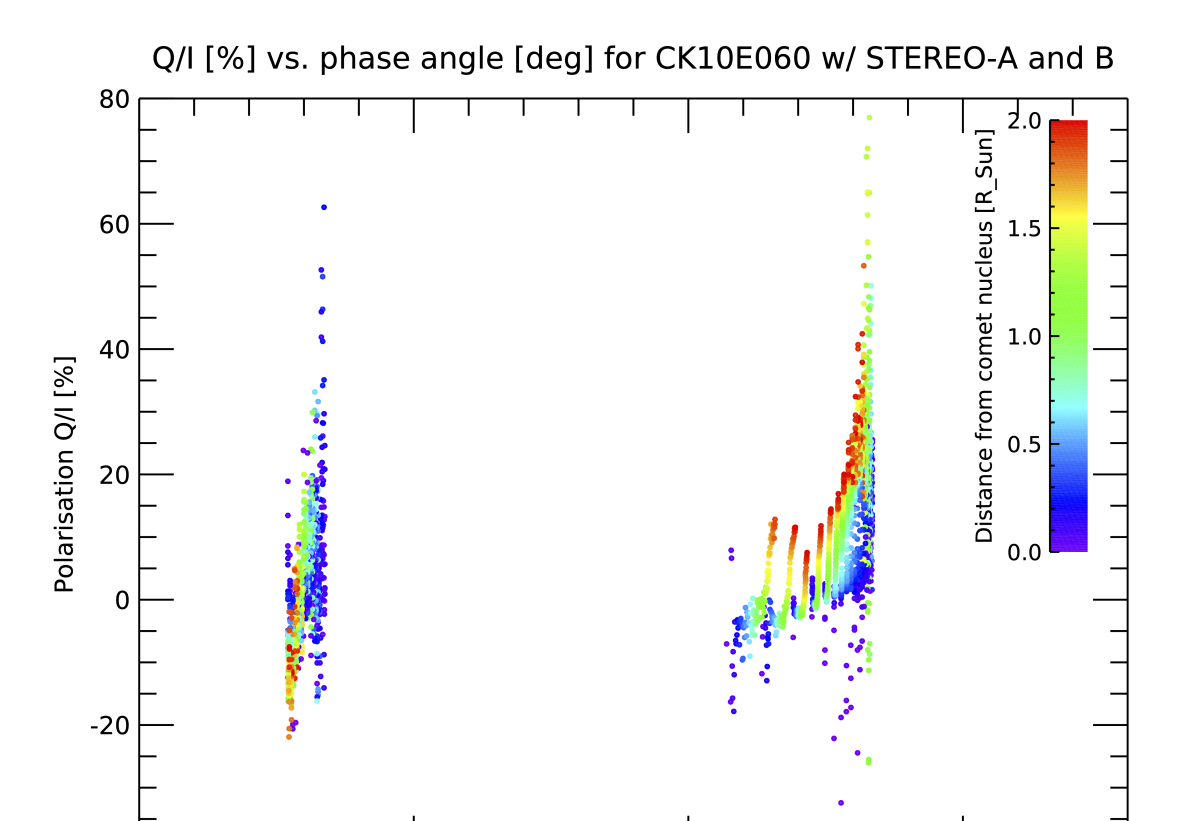
Figure 7 shows and for all the reduced comet tail imagery plotted against phase angle for the full set of STEREO-A and STEREO-B/SECCHI/COR2 observations of comet C/2010 E6. Each presented comet trace along the tail extends from the comet photocentre (purple and dark blue; changing colour along the way) up to (red) away from it, depending on the quality of the data.
(i)
(ii)
Focusing on the results themselves, STEREO-A data is limited to a narrow range of phase angles – between and , decreasing with time while approaching perihelion (decreasing heliocentric distance). Despite the small range, the overall behaviour of the comet photocentre in this region is a clear change in polarisation from to in a steep curve with time, i.e. with decreasing phase angle and heliocentric distance. Generally, the comet tail increases in degree of polarisation with increasing distance from the comet. The quality of STEREO-A data is lower than that of STEREO-B. This can be fully attributed to differing geometry of observations. Figure 6 shows the positions of both spacecraft and the orbit of comet C/2010 E6 (STEREO) in relation to the Sun, Earth, and other planets. It is clear – particularly from the ‘side-on’ view of the system – that STEREO-B is both generally closer to the comet and has the superior vantage point for observing the comet and its tail. From the vantage point of STEREO-A, the tail appears highly projected, which hinders detailed analysis because we are receiving signal from grains at multiple distances in a single pixel. Due to this unfavourable geometry, the mapping of the data points onto the comet’s orbital plane is also less accurate, contributing to lower phase angle resolution along the tail in each image and lower overall data quality. The data quality remains reasonably good when presented in other contexts (see Sec. 4.3). Fig. 7.ii shows a high degree of scatter of values in STEREO-A data, especially at larger heliocentric distances (and larger phase angles) where the comet was dimmer.
Conversely, the quality of data derived from STEREO-B observations of comet C/2010 E6 is high and only matched by a handful of other bright comets, e.g. C/2011 W3 (Lovejoy). The phase angle range observed is from to , also decreasing with time while approaching perihelion. This range is higher than most comets have been observed at. The tail traces are clearly discernible in the figure as series of points tracing distinct curves (save a few stragglers) from dark blue at comet photocentre to red at and show a marked increase in degree of polarisation as we move away from the nucleus. The curve at the lowest end of the phase angle range shows unusual properties, but the overall trend at the inner coma is to change the polarisation from to with time, i.e. decreasing phase angle and heliocentric distance. This is also unusual; the full meaning is considered in Sec. 5. Fig. 7.ii shows a similar degree of scatter of at larger heliocentric distances (larger phase angles) in both STEREO-B and A data, both attributable to lower overall brightness of the comet and its tail. This trend is strongest for the tail data, with comet photocentre generally showing close to zero as expected. Overall, shows much less deviation from zero in STEREO-B data when compared to A, confirming the assertion that this data quality is higher. At smaller heliocentric distances (smaller phase angles) some scatter returns, mirroring the anomalous data points seen there in Fig. 7.i.
While the observed phase angle changes somewhat with passage of time due to evolving observing geometries from both spacecraft, the variation in along the tail in each of the images is generally small. In STEREO-A data, its variation along the tail is negligible. In STEREO-B data, however, the variation changes from negligible at higher heliocentric distances (and higher ) to reaching in the final images approaching perihelion (lower ).
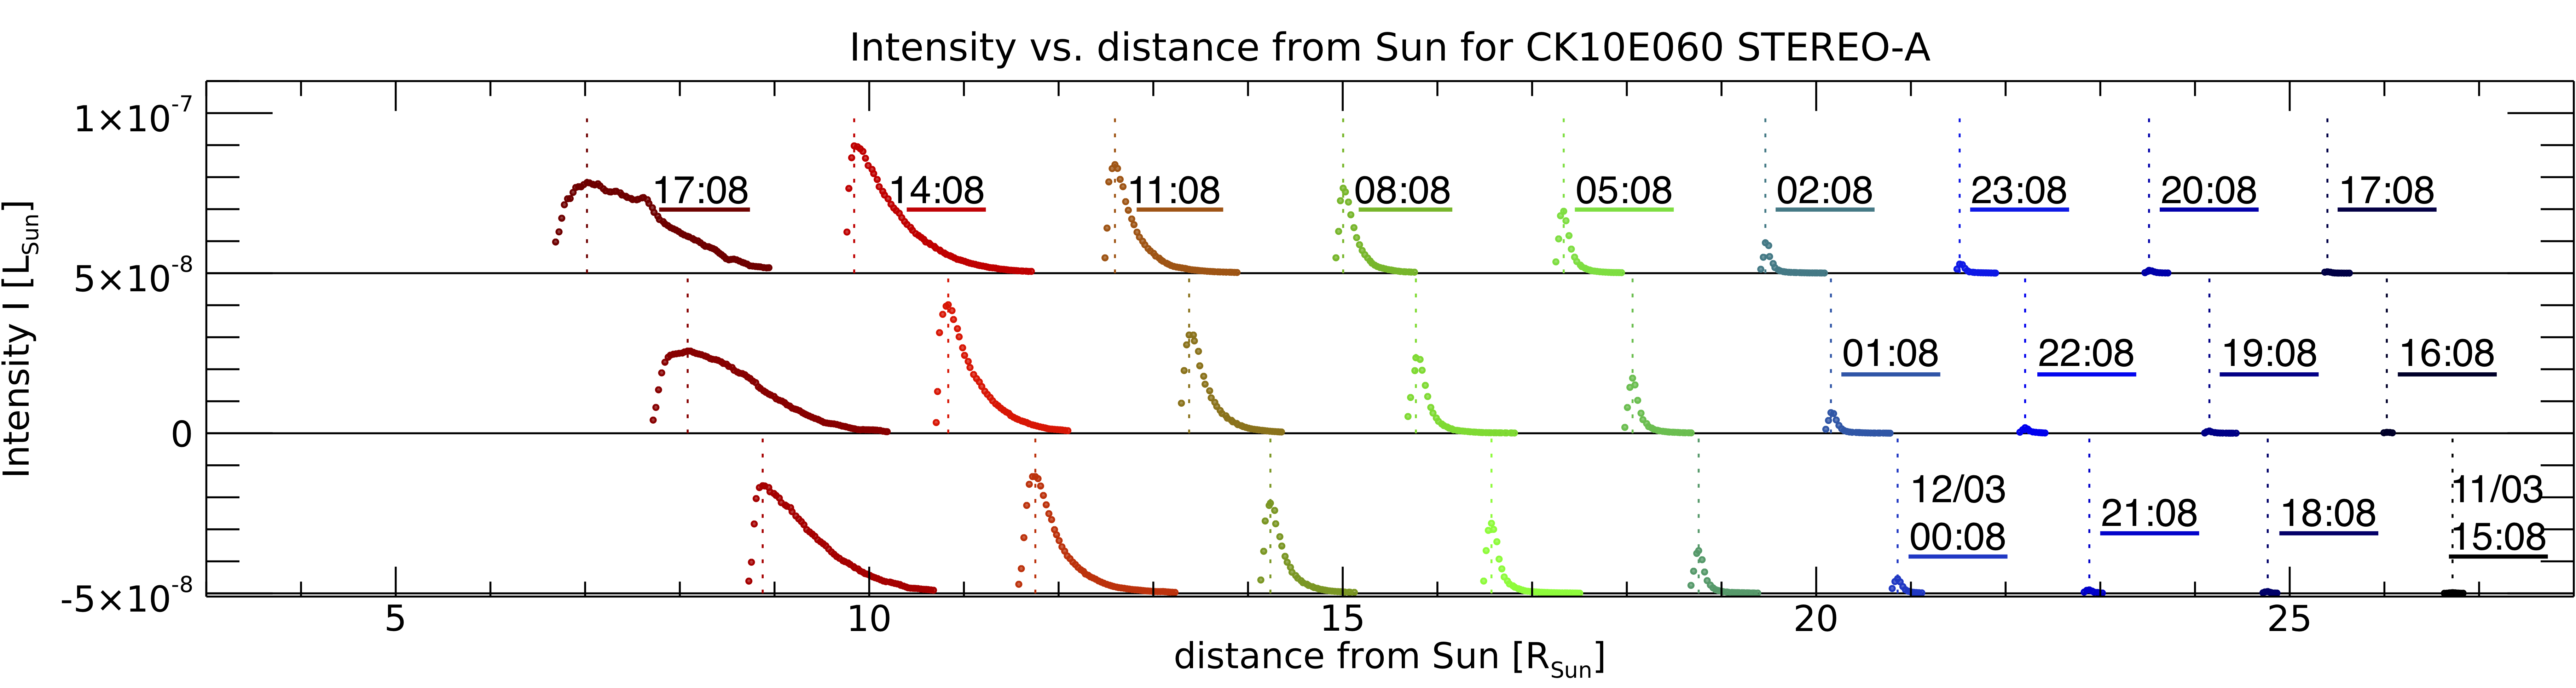
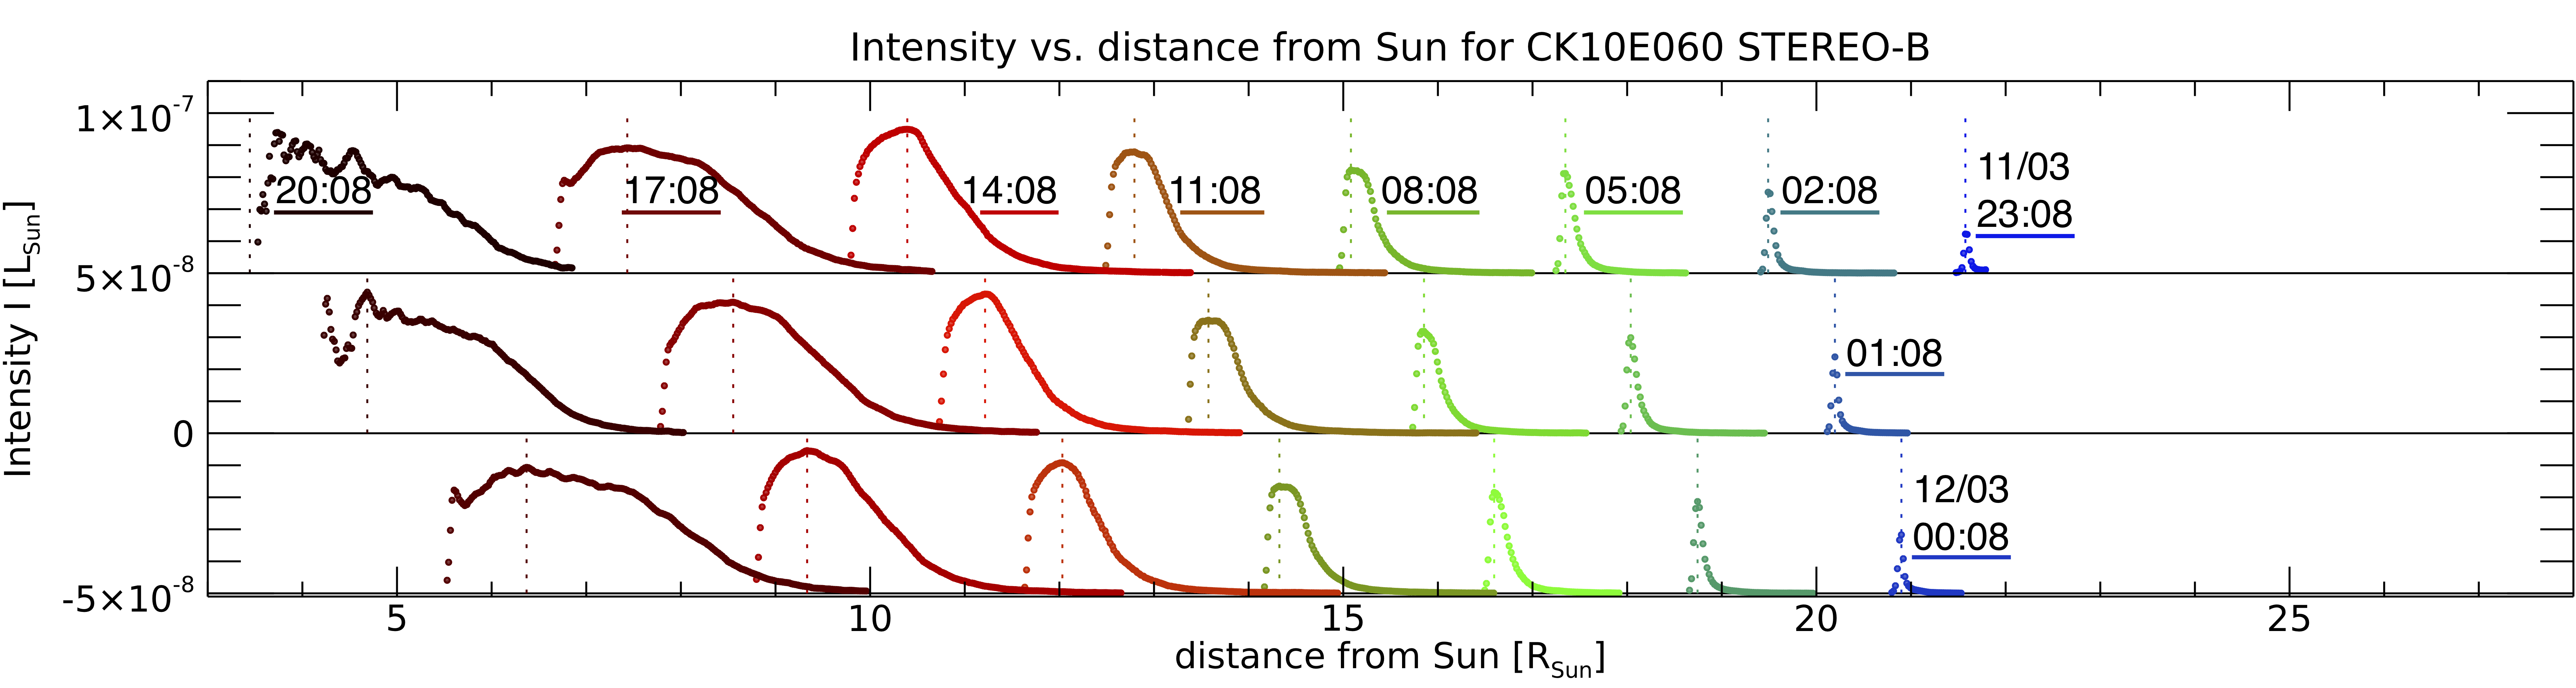
4.3 Photometry and polarisation vs. heliocentric distance
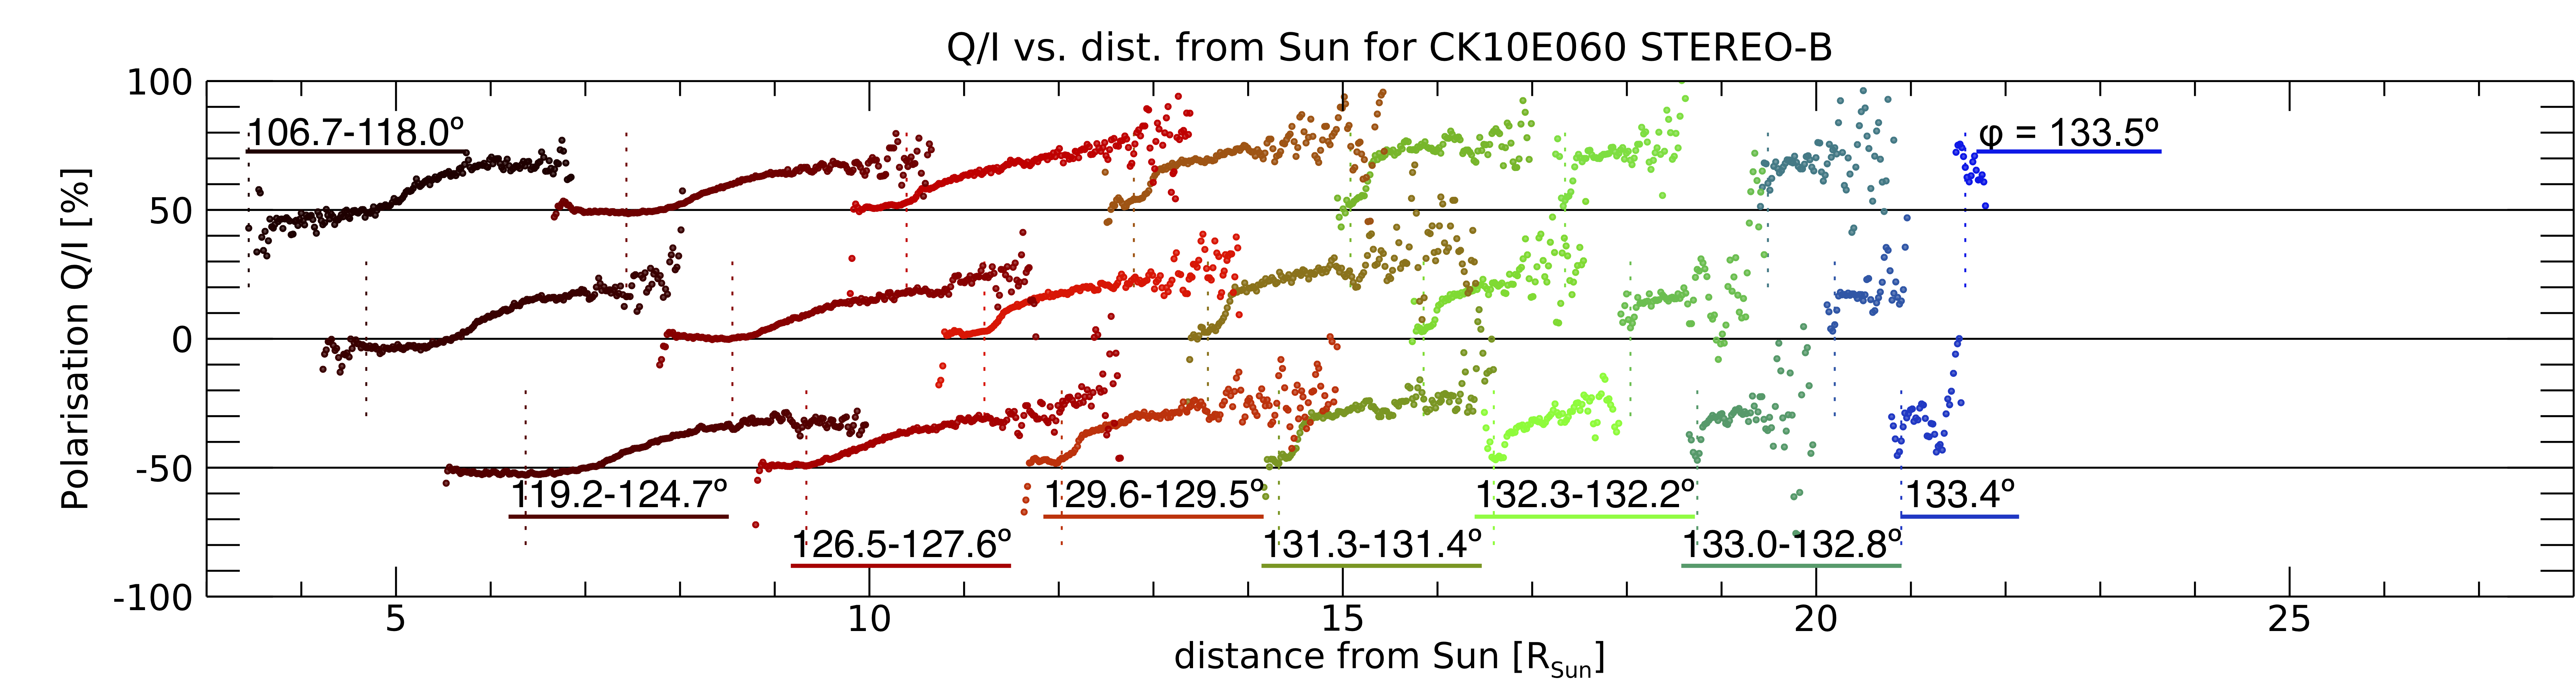
Figure 8 shows the full set of Stokes and reduced data on comet C/2010 E6 (STEREO) with respect to heliocentric distance, analysed from the STEREO/SECCHI/COR2 imagery. They start on the right-hand end (11th March 2010 at 15:08 UT for STEREO-A, at 23:08 UT for STEREO-B) and move closer to the Sun in hourly increments. Since the data would contain considerable overlap otherwise, three different offsets are used, along with a colour gradient (dark blue at large heliocentric distances, dark red at small ones) to further emphasise the fact that plots, even if offset, are part of the same series.
For example – and one can consult either Figure 8.i or 8.ii here with the same effect – STEREO-A observations begin on 11th March 2010 at 15:08 UT at heliocentric distance of (rightmost dataset, bottom level, black/very dark blue, peak intensity denoted by the dashed vertical line of the same colour). The next dataset, at heliocentric distance of , at the middle level (also black/very dark blue), was taken at 16:08 UT, etc. At 23:08 UT (third dataset from the right on the top level in STEREO-A data, at , blue), simultaneous observations begin, and the STEREO-B observations are also at , on the top level, and blue. Simultaneous observations from both spacecraft end on 12th March 2012 at 17:08 UT (peak intensity at , top level, dark red). Reliable STEREO-B observations continue for three more hours, until 20:08 UT and peak intensity distance of (black/very dark red). Each set of points of the same colour belongs to observations taken at the same time. While phase angle information is lost in this plot, its variability along the comet tail is almost negligible and trends with changing cometocentric distance are clear; consult Sec. 4.2 for details.
Focusing specifically on Figure 8.ii, we can better appreciate the steep slope of tail polarisation as we move away from the comet coma, especially in the early observations (right-hand end of STEREO-A data, dark blue). Increase of polarisation with cometocentric distance is a known phenomenon (e.g. Kiselev et al., 2015), but such a steep slope has only been observed for other near-Sun comets (Thompson, 2015, 2020, Figs. 9 and 7, respectively). Both the reasons for this trend and the deviations from it will be discussed in the next section.
(i)
(ii)
5 Discussion
5.1 Comparison to ground-based comet polarimetry
Both STEREO-A and B observations show some peculiar behaviour, which must first be compared against the wealth of existing data from generally ground-based comet polarisation observations. Figure 9 shows the full dataset from the newest Comet Polarimetry Database (Kiselev et al., 2017) in a polarimetric phase angle plot. Plotted are the data points of comet coma polarisation vs. phase angle for 73 different comets with over 3000 measurements spanning over a century between them, and yet a clear trend can be seen.
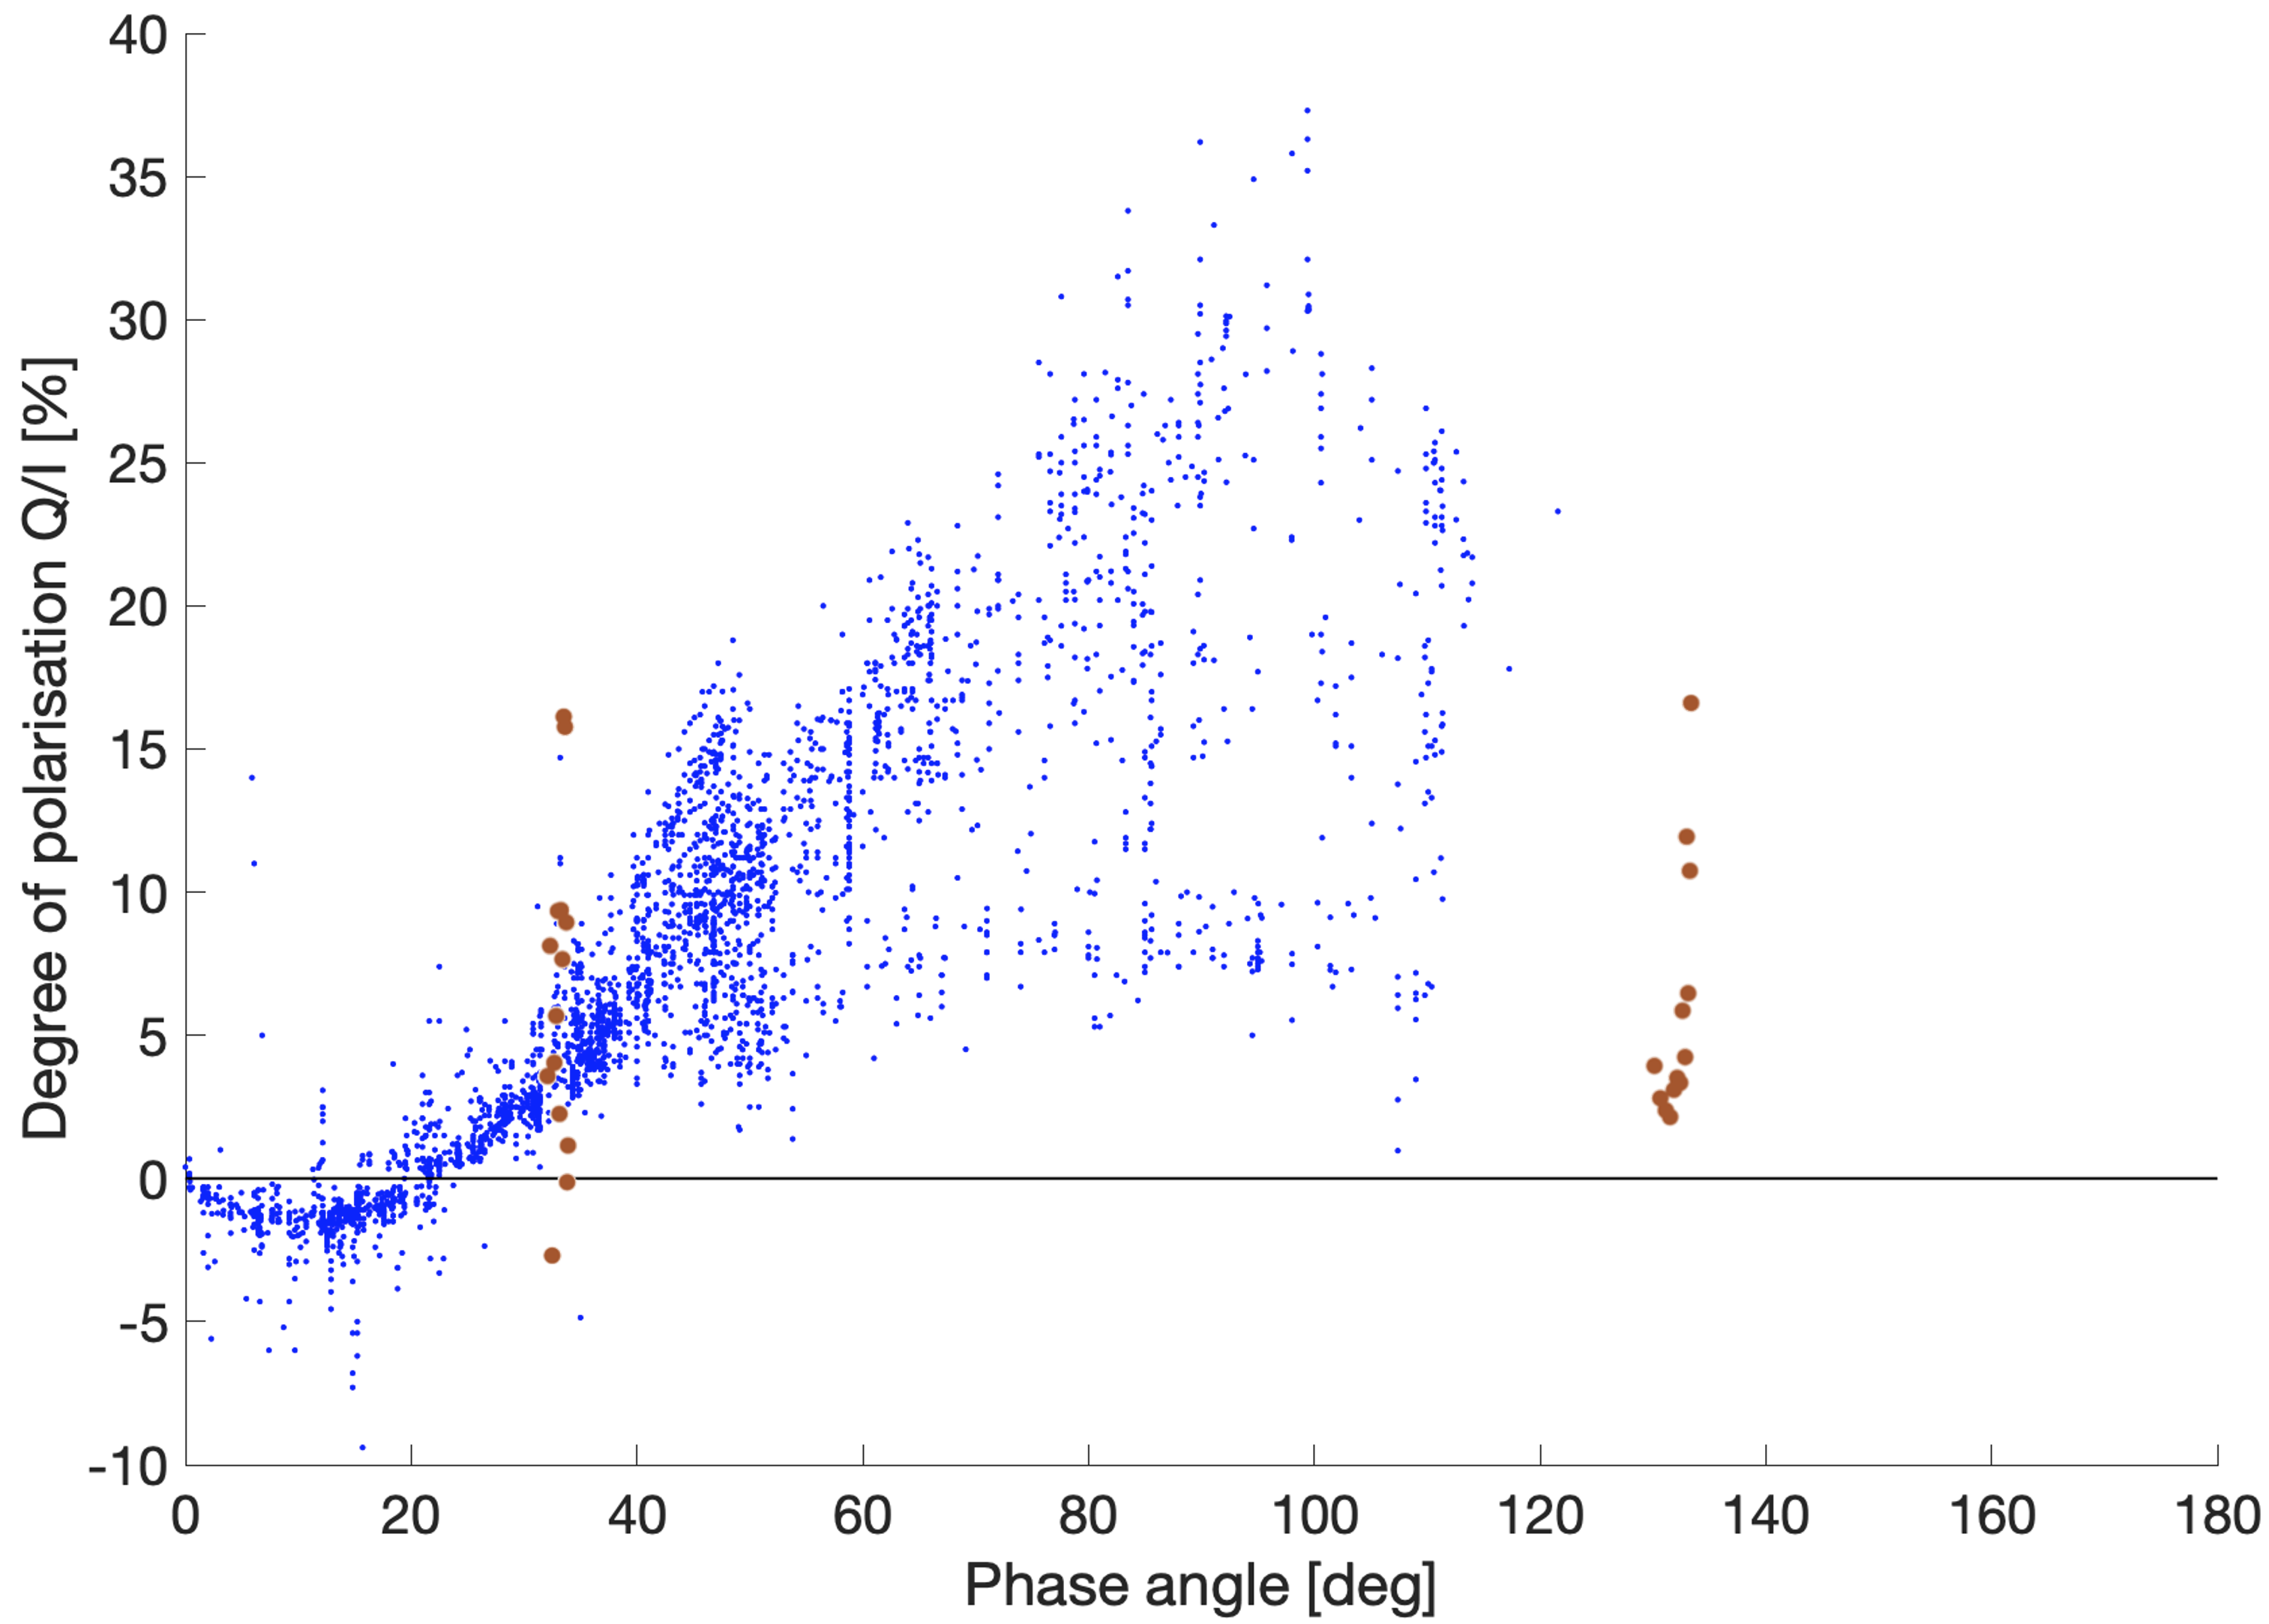
The comet comae show negative polarisation between phase angles and (called the inversion angle) – this regions is referred to as the negative polarisation branch – with a minimum near . Polarisation appears to reach a peak around , after which it drops again, presumably smoothly returning to zero at . There are essentially no data points beyond , however, due to observing limitations discussed earlier. A handful of comets have been observed and analysed at higher phase angles with SOHO and STEREO spacecraft but have not been recorded in the Comet Polarimetry Database. Hui (2013) analysed STEREO-B observations of comet P/2003 T12 = 2012 A3 (SOHO) with phase angles exceeding and thus cannot be directly compared to results presented here. Grynko et al. (2004) analysed SOHO observations of comet 96P/Machholz in a broader range of phase angles and found generally good agreement with high polarisation data in Fig. 9, although with a large degree of uncertainty related to the difficulties with SOHO data discussed in Sec. 2. Notably 96P/Machholz is a periodic comet, therefore more highly processed than Kreutz comets, and – with perihelion at AU – merely a sunskirter rather than a sungrazer (Jones et al., 2018).
The degree of polarisation at the peak varies significantly; from to near . This variation likely reflects the composition of the comets; higher maximum of polarisation is found for dust-rich comets, lower for gas-rich comets. This is easily explained, as light scattering from gases will generally suppress the polarisation induced by the dust particles (Kiselev et al., 2015) - see 5.2 for how this contrasts with observations of near-Sun comets. Similar polarimetric properties are found for asteroids (particularly C-type) and zodiacal dust, hinting at a common origin of the dusty material (Levasseur-Regourd et al., 1990).
Comparing results from the Comet Polarimetry Database against the phase angle curves of comet C/2010 E6 (STEREO), there are clear departures from the trends presented here. Focusing on the coma region (as presented in Fig. 9) for the most direct comparison, STEREO-A observations fall within the phase angle range of previous observations and do show both negative polarisation and an increase of polarisation with increasing , however the inversion angle is at rather than , and the slope is much higher than expected. STEREO-B observations mostly sit beyond the usual range of phase angles, but they also show an increase with increasing phase angle, where a decrease from the peak polarisation at is expected. The solution for these discrepancies is that both of these sets of observations are greatly affected by the near-Sun environment: for STEREO-A observations, the heliocentric distance varies greatly through the observing run, while the phase angle change remains minimal due to geometry of observations (see Fig. 6). For STEREO-B observations, the change in heliocentric distance induces an overall decrease in polarisation with time, but this happens to correlate with decreasing phase angle. Both of these effects will be further discussed in Section 5.2. A caveat in this comparison is that the methodology of observations in Kiselev et al. (2017) is different from our own, however our observations show behaviour extreme enough that it is difficult to compare to any broad review of polarimetric properties of comets.
5.2 Effects of the near-Sun environment
There are a number of effects at play at the small heliocentric distances where comet C/2010 E6 (STEREO) was located when observed by the twin STEREO spacecraft. The comet nucleus will be affected by sublimation of refractory material, which may cause ablation of the surface or rotational spin-up and break-up of the object due to insufficient tensile strength. Tidal forces may play a role. The effect of the diamagentic cavity in shielding the comet from the effects of solar wind – diminished as the comet approaches the Sun – should also be considered. The thermal wave may propagate inside the nucleus – especially if the mantle of old ejected material is not being replenished due to sublimation effects – and disintegrate it via sublimation of unexposed ices and refractory material (Jones et al., 2018, and references therein). Realistically, all of these and other effects are likely to play some role in the evolution and final fate of the comet in the near-Sun environment.
Assuming, firstly, a radiative cooling model based on black body radiation for the comet nucleus, the local temperature can be compared to the equilibrium temperature of various materials. For example, the equilibrium temperature for carbon dioxide is reached at a heliocentric distance of AU, and for water at just under AU ( K). The proximity to the Sun can promote phase changes of refractory material and cometary dust itself in addition to the ices. This will affect its polarimetric properties. Refractory organics begin decomposing and sublimating at K, reached around 0.7 AU (), and silicates in a range between K (distance between AU or ), depending on their composition. Forsterite, for example (in the olivine family), is expected to start sublimating at heliocentric distances below AU; (Kimura et al., 2002; Jones et al., 2018).
Recalling that the comet tail tends to show an increase in polarisation with increasing distance from the comet nucleus, this is a fact previously observed for other comets (e.g. Kiselev et al., 2015), though it can be modulated by decreases in polarisation due to, presumably, variation in the material ejected from the nucleus. This was seen in some polarimetric observations of comet 67P/Churyumov-Gerasimenko (e.g. Hadamcik et al., 2016; Rosenbush et al., 2017; Nežič, 2020). The slope, however, is much higher for comet C/2010 E6 (STEREO) than for comets at larger heliocentric distances. Similar result was found by Thompson (2015) for comet C/2011 W3 (Lovejoy).
The standard explanation for increasing polarisation with cometocentric distance is that dust particles are processed over time as they move away from the nucleus. Assuming a fluffy aggregate composition with silicate grains and refractive organic matrix (Kimura et al., 2002; Kimura et al., 2006; Kolokolova, 2016), this will, in general, result in smaller grains with various materials slowly removed by a variety of processes.
Since the organic matrix is the first refractory material to begin sublimating, it is reasonable to assume that coronagraph observations of comet C/2010 E6 (with heliocentric distances ) already see the tail mostly depleted of it, except in the newly ejected material near the comet photocentre. This causes a particularly steep gradient in polarisation, as silicates become the dominant species as the organics are depleted, in addition to the normal processing of the material with time creating smaller particles. A similar hypothesis is put forward by Thompson (2020).
In addition to this, presence of amorphous carbon among the organics may have a significant effect, as its sublimation temperature is very high. Amorphous carbon is created by UV irradiation of the organics, and is much more strongly affected by the solar radiation pressure than the silicate particles (Zubko et al., 2015a). This means amorphous carbon is likely to be swept along the tail. Theoretical modelling by Zubko et al. (2013) shows that such material can show very strong polarisation. This could easily explain the observed increase in polarisation along the tail, especially the steep slope at higher heliocentric distances.
Analysis of Fig. 8 shows us a broader picture of the comet’s behaviour over time. While the tail (in STEREO-B data in particular) still increases in polarisation over time far from the nucleus, a disruption is propagating from the coma and along the tail. This is seen in intensity plots as the broadening of the intensity peak (STEREO-B) or, less clearly, as the decrease in the intensity drop-off slope (STEREO-A). The overall peak brightness of the comet, , is reached between and , which agrees with the analysis of Kreutz group comets in SOHO coronagraph imagery (Biesecker et al., 2002; Knight et al., 2010). Kimura et al. (2002) also found that fluffy aggregates composed of olivine are likely to cause a peak in brightness between , which falls within this region, with sublimation of olivines at smaller heliocentric distances being the dominant process decreasing coma brightness. An additional brightness enhancement and eventual decrease within is attributed to the presence and then sublimation of pyroxenes, but those distances are sampled less well in this analysis.
This disruption is also characterised by a clear decrease in polarisation to near-zero for STEREO-B data, and in appearance of negative polarisation for STEREO-A – for both the coma and the tail.
The evidence for this disruption is circumstantial, since the resolution of the instruments is insufficient to discern variation in morphology of the comet coma, but similar photometric (broadening of the brightness peak) and polarimetric (an abrupt decrease in polarisation near the coma vs. the tail) effects have been observed in other Kreutz sungrazers, e.g. comet C/2011 W3 (Lovejoy) (Thompson, 2015; Nežič, 2020), which is known to have experienced extreme disruption at its perihelion approach (Sekanina & Chodas, 2012, e.g.). We also know that comet C/2010 E6 (STEREO) did not reappear after perihelion, as is the case for most Kreutz comets due to their small size. A fragmentation of the nucleus, combined with rapid sublimation of newly exposed material, is therefore the most likely cause of the broadening of the intensity peaks at decreasing heliocentric distances.
In light of the fragmentation hypothesis, the negative polarisation seen in STEREO-A data may be caused by the combination of new, freshly exposed silicate particles ejected from the nucleus on the one hand, and the low phase angle on the other. While the inversion angle is expected at and is instead seen at , a small variation in the structure and composition of the particles can extend the theoretical models of the negative branch even to near (e.g. Petrova et al., 2001; Frattin et al., 2019; Zubko et al., 2020; Halder & Ganesh, 2021). Some of the aforementioned theoretical models reproduce the results more readily with compact particles rather than fluffy aggregates, although Zubko et al. (2015b) argues that packing density does not have a significant effect on the polarimetric response when the particle morphology attains a significant level of disorder, when compared to the effects of refractive index. A strong negative polarimetric response at a variety of phase angles might be caused, for instance, by particles with rounded shapes caused due to melting (e.g. Hansen & Travis, 1974; Hansen & Hovenier, 1974).
The abrupt reduction of polarisation to small positive polarisation in STEREO-B data near side-scattering, however, is not quite as easily explained. The often-used explanation of surrounding gas causing the dampening of the polarimetric response is unlikely to be valid for this feature due to the close proximity to the Sun, where strong dissociation effects mean most gas species are very short-lived (e.g. Biesecker et al., 2002; Luk’yanyk et al., 2020). Biesecker et al. (2002) has shown that some species, such as NaI, may be detected as close as , with others, like Ly, appearing even closer to the Sun, but neither of those would be detected by the COR2 coronagraph. Comets observed near AU have several common sources of emission in the COR2 bandpass, including C2, NH2, and forbidden O (e.g. Feldman et al., 2004) but, as noted above, all are expected to be short-lived at the heliocentric distances of our observations. Some theoretical light-scattering models can produce small positive polarisation at phase angles seen in STEREO-B data while also showing negative polarisation in the backscattering regime (e.g. Zubko et al., 2014; Frattin et al., 2019; Halder & Ganesh, 2021). Those results do not match the observed behaviour perfectly, but they do approach it closely, and most of them match the results best with Mg-rich silicate particles such as forsterite. This reconciles well with the photometric observations and is therefore the most likely resolution, although future theoretical modelling that reproduces the observations even better would be beneficial. A role may even be played by the peculiar observing conditions, especially the spread of phase angles due to the Sun acting as an extended source – see Sec. 4.1 above – though the effects of this are not entirely clear.
This difference in polarimetric behaviour in simultaneous observations of a sungrazing comet can also be observed in post-perihelion observations of comet C/2011 W3 (Lovejoy): STEREO-B (phase angle range ) observed near-zero polarisation of the re-emerging comet tail, while STEREO-A (phase angle range ) observed negative polarisation in the older parts of the tail (i.e. the ones originating closer to the Sun) (Nežič, 2020). A similar solution should apply to those observations.
A close look at STEREO-B data in Fig. 8.ii shows that near-zero polarisation in the coma region of comet C/2010 E6 (STEREO) might be traced back to (best seen in STEREO-B data), which precedes the change in the shape and peak of the intensity curve by several hours and solar radii. This may simply be an artefact of data analysis, as small variations in mutual alignment of sharp polarised intensity peaks can have significant effects on polarimetric calculations. It is difficult to decouple that from the emerging broad intensity peak which also reduces polarisation to zero. Other studies have found similar effects, however; Sekanina (2000b) found that dust production peaked at in a sample of 9 comets, and Knight et al. (2010) similarly sees a dramatic change in slope of comet brightening around the same heliocentric distance. This effect may indicate a thus far unexplored process for suppressing the polarimetric response: the heliocentric distance is likely too high to indicate sublimation of silicates at that point. It might, however, be caused by fragmentation of the nucleus itself. This would expose the water ice within and likely suppress the polarisation signal. While this is occurring much earlier than would expected due to tidal forces Knight & Walsh (2013), there appears to be some precedent to that, as comet C/2012 S1 (ISON) has shown indications of fragmentation at heliocentric distances as high as AU or (Sekanina & Kracht, 2014; Boehnhardt et al., 2013). It is therefore plausible that these near-Sun comets are more susceptible to fragmentation than previously thought due to their internal structure; perhaps the thermal wave propagates faster or deeper than for e.g. Jupiter-family comets. It is also plausible that this event caused the propagation of the broad intensity peak and low polarisation, indicating further break-up of the comet.
6 Conclusions
Photometric and polarimetric observations of the sungrazing Kreutz comet C/2010 E6 (STEREO) by the twin STEREO spacecraft in March 2010 were analysed and the implication of the results discussed. Since the comet was not observed post-perihelion, and since this is the fate of most Kreutz comets, it can be safely assumed that the comet fully disintegrated during its perihelion passage. Prior to that, however, it exhibited a variety of peculiar behaviours – both photometric and polarimetric – which distinguish it from most other comet observations (usually at higher heliocentric distances).
Effects of non-negligible angular size of the Sun at small heliocentric distances under consideration were carefully scrutinised. The values reported in this work will be dominated by signal near the mean values, reducing any potential observable effects. Variation in scattering plane angle was found to cancel out effects on by symmetry, whereas the effects on were found to be very small. The uncertainty of the phase angle has also not shown any significant effects on the results, though such effects are more difficult to decouple from the overall peculiar behaviour of the comet. Analysis of a near-Sun comet with more conventional polarimetric characteristics such as 96P/Machholz, which is beyond the scope of this investigation, may shed more light on the potential effects the increased angular size of the Sun might have. For 96P/Machholz in particular the angular size of the Sun at perihelion is only , however, which may not be enough for a discernible result. We recommend observations of a non-disintegrating comet at multiple heliocentric distances but similar phase angles as the best candidate for resolving these effects; a technically challenging task.
Most notable of the peculiar behaviours of comet C/2010 E6 (STEREO) is the sudden drop in polarisation of the comet nucleus observed in STEREO-B data (potentially from heliocentric distances of ), which then spread gradually along the comet tail. This was accompanied (below ) by a broadening of the the intensity peak from the nucleus further down the tail. The broadening and brightening is consistent with that observed by e.g. Knight et al. (2010) for a typical Kreutz comet and is likely a result of fragmentation of the nucleus, but the drop in polarisation gives us an earlier indication of the changing processes in the near-nucleus region, proving it is a useful tool for analysis in this extreme environment.
The observed polarimetric signature of near-zero positive polarisation (STEREO-B, high phase angles) and, simultaneously, negative polarisation (STEREO-A, small phase angles) spreading from the near-nucleus region along the tail may be best explained by the presence of Mg-rich silicate particles, the amount of which has been increased due to the fragmentation of the nucleus, and which are expected to be the prevailing component at such small heliocentric distances and equilibrium temperatures. Although the theoretical light scattering models do not fully match the observed results, this explanation best accounts for the observed polarimetric and the photometric behaviour of comet C/2010 E6 (STEREO).
The observations at varying distances clearly show us the changing behaviour of the comet and thus help shed more light on its likely structure and composition. The benefit of near-simultaneous polarimetric observations from different phase angles is also clear, as any hypotheses are required to explain both sets of observations at once.
It is reasonable to assume that comet C/2010 E6 (STEREO) is, in its peculiar behaviour, a typical representative of the Kreutz group. Further analysis of similar observations of near-Sun comets – already commenced on a set of seven additional comets within Nežič (2020) – and theoretical modelling of light-scattering properties of cometary dust particles will be required to shed more light on this topic. Recent advances – like the work of Halder & Ganesh (2021) – show great promise on the latter point, building upon the work of past decades. Thousands of comets have been observed by SOHO Battams & Knight (2017) and hundreds by STEREO spacecraft, and although majority of them are too faint for a thorough polarimetric analysis, it is likely that several dozen of them are bright enough to analyse and combine into a more coherent picture of the Kreutz family population and effects of the near-Sun environment.
Acknowledgements
This research has made use of data and/or services provided by the International Astronomical Union’s Minor Planet Center. It would not have been possible without the publicly available STEREO data, or the work done by the Sungrazer Project. It was supported by a grant from the UK Science and Technology Facilities Council. The authors would also like to thank the reviewer for their valuable insights, and Mark Bailey for fruitful discussions.
Data Availability
The raw observational data is freely available from e.g. https://stereo.nascom.nasa.gov/data/. The details of the analysis procedure and the processed data underlying this article will be shared on reasonable request to the corresponding author.
References
- Bagnulo et al. (2006) Bagnulo S., Boehnhardt H., Muinonen K., Kolokolova L., Belskaya I., Barucci M. A., 2006, A&A, 450, 1239
- Bailey et al. (1992) Bailey M. E., Chambers J. E., Hahn G., 1992, A&A, 257, 315
- Bappu et al. (1967) Bappu M. K. V., Sivaraman K. R., Bhatnagar A., Natarajan V., 1967, MNRAS, 136, 19
- Battams & Knight (2017) Battams K., Knight M. M., 2017, Phil. Trans. R. Soc. A, 375
- Battams et al. (2010) Battams K., Dennison H., Marsden B. G., 2010, IAU Circ., 9151, 2
- Bewsher et al. (2010) Bewsher D., Brown D. S., Eyles C. J., Kellett B. J., White G. J., Swinyard B., 2010, Sol. Phys., 264, 433
- Biesecker et al. (2002) Biesecker D. A., Lamy P., St. Cyr O. C., Llebaria A., Howard R. A., 2002, Icarus, 157, 323
- Boehnhardt et al. (2013) Boehnhardt H., et al., 2013, Central Bureau Electronic Telegrams, 3715, 1
- Borisov et al. (2015) Borisov G., Bagnulo S., Nikolov P., Bonev T., 2015, Planet. Space Sci., 118, 187
- Brownlee (2014) Brownlee D., 2014, Annual Review of Earth and Planetary Sciences, 42, 179
- Brownlee et al. (2004) Brownlee D. E., et al., 2004, Science, 304, 1764
- Brownlee et al. (2006) Brownlee D., et al., 2006, Science, 314, 1711
- Brueckner et al. (1995) Brueckner G. E., et al., 1995, Sol. Phys., 162, 357
- Domingo et al. (1995) Domingo V., Fleck B., Poland A. I., 1995, Sol. Phys., 162, 1
- Eichstedt et al. (2008) Eichstedt J., Thompson W. T., St. Cyr O. C., 2008, Space Sci. Rev., 136, 605
- Engrand et al. (2016) Engrand C., et al., 2016, MNRAS, 462, S323
- Feldman et al. (2004) Feldman P. D., Cochran A. L., Combi M. R., 2004, Spectroscopic investigations of fragment species in the coma. p. 425
- Frattin et al. (2019) Frattin E., et al., 2019, MNRAS, 484, 2198
- Freeland & Handy (1998) Freeland S. L., Handy B. N., 1998, Sol. Phys., 182, 497
- Grynko et al. (2004) Grynko Y., Jockers K., Schwenn R., 2004, A&A, 427, 755
- Hadamcik et al. (2010) Hadamcik E., Sen A. K., Levasseur-Regourd A. C., Gupta R., Lasue J., 2010, A&A, 517, A86
- Hadamcik et al. (2016) Hadamcik E., Levasseur-Regourd A. C., Hines D. C., Sen A. K., Lasue J., Renard J. B., 2016, MNRAS, 462, S507
- Halder & Ganesh (2021) Halder P., Ganesh S., 2021, MNRAS, 501, 1766
- Hansen & Hovenier (1974) Hansen J. E., Hovenier J. W., 1974, Journal of Atmospheric Sciences, 31, 1137
- Hansen & Travis (1974) Hansen J. E., Travis L. D., 1974, Space Sci. Rev., 16, 527
- Hines et al. (2014) Hines D. C., et al., 2014, ApJ, 780, L32
- Howard et al. (2008) Howard R. A., et al., 2008, Space Sci. Rev., 136, 67
- Hui (2013) Hui M. T., 2013, MNRAS, 436, 1564
- Ishii et al. (2008) Ishii H. A., Bradley J. P., Dai Z. R., Chi M., Kearsley A. T., Burchell M. J., Browning N. D., Molster F., 2008, Science, 319, 447
- Ivanova et al. (2019) Ivanova O., et al., 2019, A&A, 626, A26
- Jewitt (1997) Jewitt D., 1997, Earth Moon and Planets, 79, 35
- Jones et al. (2018) Jones G. H., et al., 2018, Space Sci. Rev., 214, 20
- Kaiser et al. (2008) Kaiser M. L., Kucera T. A., Davila J. M., St. Cyr O. C., Guhathakurta M., Christian E., 2008, Space Sci. Rev., 136, 5
- Kimura et al. (2002) Kimura H., Mann I., Biesecker D. A., Jessberger E. K., 2002, Icarus, 159, 529
- Kimura et al. (2006) Kimura H., Kolokolova L., Mann I., 2006, A&A, 449, 1243
- Kiselev et al. (2015) Kiselev N., Rosenbush V., Levasseur-Regourd A.-C., Kolokolova L., 2015, in Kolokolova L., Hough J., Levasseur-Regourd A.-C., eds, , Polarimetry of Stars and Planetary Systems. Cambridge University Press, Chapt. 22, pp 379–404
- Kiselev et al. (2017) Kiselev N., Shubina E., Velichko S., Jockers K., Rosenbush V., Kikuchi S., 2017, NASA Planetary Data System, urn: nasa: pds: compilcomet, 2
- Kissel et al. (2004) Kissel J., Krueger F. R., Silén J., Clark B. C., 2004, Science, 304, 1774
- Knight & Walsh (2013) Knight M. M., Walsh K. J., 2013, ApJ, 776, L5
- Knight et al. (2010) Knight M. M., A’Hearn M. F., Biesecker D. A., Faury G., Hamilton D. P., Lamy P., Llebaria A., 2010, AJ, 139, 926
- Kolokolova (2016) Kolokolova L., 2016, Nature, 537, 37
- Kolokolova & Jockers (1997) Kolokolova L., Jockers K., 1997, Planet. Space Sci., 45, 1543
- Kolokolova et al. (2018) Kolokolova L., Nagdimunov L., Mackowski D., 2018, J. Quant. Spec. Radiat. Transf., 204, 138
- Kreutz (1888) Kreutz H. C. F., 1888, Untersuchungen uber das comentesystem 1843 I, 1880 I und 1882 II.
- Kreutz (1891) Kreutz H., 1891, Publication der Koeniglichen Sternwarte in Kiel, 6
- Kreutz (1901) Kreutz H., 1901, Astronomische Abhandlungen als Erganzungshefte zu den Astronomische Nachrichten, 1, 1
- Langevin et al. (2016) Langevin Y., et al., 2016, Icarus, 271, 76
- Lawler & Brownlee (1992) Lawler M. E., Brownlee D. E., 1992, Nature, 359, 810
- Levasseur-Regourd et al. (1990) Levasseur-Regourd A. C., Dumont R., Renard J. B., 1990, Icarus, 86, 264
- Levasseur-Regourd et al. (2018) Levasseur-Regourd A.-C., et al., 2018, Space Sci. Rev., 214, 64
- Luk’yanyk et al. (2020) Luk’yanyk I., Zubko E., Videen G., Ivanova O., Kochergin A., 2020, A&A, 642, L5
- Mannel et al. (2016) Mannel T., Bentley M. S., Schmied R., Jeszenszky H., Levasseur-Regourd A. C., Romstedt J., Torkar K., 2016, MNRAS, 462, S304
- Marsden (1967) Marsden B. G., 1967, AJ, 72, 1170
- Marsden (1989) Marsden B. G., 1989, AJ, 98, 2306
- Marsden (2005) Marsden B. G., 2005, ARA&A, 43, 75
- Nežič (2020) Nežič R., 2020, PhD thesis, University College London
- Petrova et al. (2001) Petrova E. V., Jockers K., Kiselev N. N., 2001, Solar System Research, 35, 390
- Rosenbush et al. (2017) Rosenbush V. K., Ivanova O. V., Kiselev N. N., Kolokolova L. O., Afanasiev V. L., 2017, MNRAS, 469, S475
- Rotundi et al. (2015) Rotundi A., et al., 2015, Science, 347, aaa3905
- Ruan et al. (2010) Ruan J., Wang B., Su H., Xu Z., Zhou B., Dennison H., Marsden B. G., 2010, Minor Planet Electronic Circulars, 2010-R93
- Sekanina (2000a) Sekanina Z., 2000a, ApJ, 542, L147
- Sekanina (2000b) Sekanina Z., 2000b, ApJ, 545, L69
- Sekanina (2002) Sekanina Z., 2002, ApJ, 566, 577
- Sekanina (2003) Sekanina Z., 2003, ApJ, 597, 1237
- Sekanina & Chodas (2004) Sekanina Z., Chodas P. W., 2004, ApJ, 607, 620
- Sekanina & Chodas (2007) Sekanina Z., Chodas P. W., 2007, ApJ, 663, 657
- Sekanina & Chodas (2012) Sekanina Z., Chodas P. W., 2012, ApJ, 757, 127
- Sekanina & Kracht (2014) Sekanina Z., Kracht R., 2014, arXiv e-prints, p. arXiv:1404.5968
- Silsbee & Tremaine (2016) Silsbee K., Tremaine S., 2016, AJ, 152, 103
- Thompson (2015) Thompson W. T., 2015, Icarus, 261, 122
- Thompson (2020) Thompson W. T., 2020, Icarus, 338, 113533
- Weinberg & Beeson (1976) Weinberg J. L., Beeson D. E., 1976, A&A, 48, 151
- Zubko et al. (2012) Zubko E., Muinonen K., Shkuratov Y., Hadamcik E., Levasseur-Regourd A. C., Videen G., 2012, A&A, 544, L8
- Zubko et al. (2013) Zubko E., Muinonen K., Shkuratov Y., Videen G., 2013, MNRAS, 430, 1118
- Zubko et al. (2014) Zubko E., Muinonen K., Videen G., Kiselev N. N., 2014, MNRAS, 440, 2928
- Zubko et al. (2015a) Zubko E., et al., 2015a, Planet. Space Sci., 118, 138
- Zubko et al. (2015b) Zubko E., Shkuratov Y., Videen G., 2015b, J. Quant. Spec. Radiat. Transf., 150, 42
- Zubko et al. (2020) Zubko E., Videen G., Arnold J. A., MacCall B., Weinberger A. J., Kim S. S., 2020, ApJ, 895, 110