Measuring What Counts:
The case of Rumour Stance Classification
Abstract
Stance classification can be a powerful tool for understanding whether and which users believe in online rumours. The task aims to automatically predict the stance of replies towards a given rumour, namely support, deny, question, or comment. Numerous methods have been proposed and their performance compared in the RumourEval shared tasks in 2017 and 2019. Results demonstrated that this is a challenging problem since naturally occurring rumour stance data is highly imbalanced. This paper specifically questions the evaluation metrics used in these shared tasks. We re-evaluate the systems submitted to the two RumourEval tasks and show that the two widely adopted metrics – accuracy and macro- – are not robust for the four-class imbalanced task of rumour stance classification, as they wrongly favour systems with highly skewed accuracy towards the majority class. To overcome this problem, we propose new evaluation metrics for rumour stance detection. These are not only robust to imbalanced data but also score higher systems that are capable of recognising the two most informative minority classes (support and deny).
1 Introduction
The automatic analysis of online rumours has emerged as an important and challenging Natural Language Processing (NLP) task. Rumours in social media can be defined as claims that cannot be verified as true or false at the time of posting Zubiaga et al. (2018). Prior research Mendoza et al. (2010); Kumar and Carley (2019) has shown that the stances of user replies are often a useful predictor of a rumour’s likely veracity, specially in the case of false rumours that tend to receive a higher number of replies denying them Zubiaga et al. (2016). However, their automatic classification is far from trivial as demonstrated by the results of two shared tasks – RumourEval 2017 and 2019 Derczynski et al. (2017); Gorrell et al. (2019). More specifically, sub-task A models rumour stance classification (RSC) as a four-class problem, where replies can:
-
•
support/agree with the rumour;
-
•
deny the veracity of the rumour;
-
•
query/ask for additional evidence;
-
•
comment without clear contribution to assessing the veracity of the rumour.
Figure 1 shows an example of a reply denying a post on Twitter.

In RumourEval 2017 the training data contains 297 rumourous threads about eight events. The test set has 28 threads, with 20 threads about the same events as the training data and eight threads about unseen events. In 2019, the 2017 training data is augmented with 40 Reddit threads. The new 2019 test set has 56 threads about natural disasters from Twitter and a set of Reddit data (25 threads). These datasets for RSC are highly imbalanced: the comment class is considerably larger than the other classes. Table 1 shows the distribution of stances per class in both 2017 and 2019 datasets, where 66% and 72% of the data (respectively) correspond to comments. Comments arguably are the least useful when it comes to assessing overall rumour veracity, unlike support and deny which have been shown to help with rumour verification Mendoza et al. (2010). Therefore, RSC is not only an imbalanced, multi-class problem, but it also has classes with different importance. This is different from standard stance classification tasks (e.g. SemEval 2016 task 6 Mohammad et al. (2016)), where classes have arguably the same importance. It also differs from the veracity task (RumourEval sub-task B), where the problem is binary and it is not as an imbalanced problem as RSC.111Other NLP tasks, like sentiment analysis are also not comparable, since these tasks are either binary classification (which is then solved by using macro-) or do not have a clear priority over classes.
| 2017 | 2019 | |
|---|---|---|
| support | 1,004 (18%) | 1,184 (14%) |
| deny | 415 (7%) | 606 (7%) |
| query | 464 (8%) | 608 (7%) |
| comment | 3,685 (66%) | 6,176 (72%) |
| total | 5,568 | 8,574 |
RumourEval 2017 evaluated systems based on accuracy (), which is not sufficiently robust on imbalanced datasets Huang and Ling (2005). This prompted the adoption of macro- in the 2019 evaluation. Kumar and Carley (2019) also argue that macro- is a more reliable evaluation metric for RSC. Previous work on RSC also adopted these metrics Li et al. (2019b); Kochkina et al. (2018); Dungs et al. (2018).
This paper re-evaluates the sub-task A results of RumourEval 2017 and 2019.222We thank the organisers for making the data available. It analyses the performance of the participating systems according to different evaluation metrics and shows that even macro-, that is robust for evaluating binary classification on imbalanced datasets, fails to reliably evaluate the performance on RSC. This is particularly critical in RumourEval where not only is data imbalanced, but also two minority classes (deny and support) are the most important to classify well. Based on prior research on imbalanced datasets in areas other that NLP (e.g. Yijing et al. (2016) and Elrahman and Abraham (2013)), we propose four alternative metrics for evaluating RSC. These metrics change the systems ranking for RSC in RumourEval 2017 and 2019, rewarding systems with high performance on the minority classes.
2 Evaluation metrics for classification
We define true positives, true negatives, false positives and false negatives, where () is equivalent to the true (false) positives and () is equivalent to the true (false) negatives for a given class .
Accuracy ()
is the ratio between the number of correct predictions and the total number of predictions (): , where is the number of classes. only considers the values that were classified correctly, disregarding the mistakes. This is inadequate for imbalanced problems like RSC where, as shown in Table 1, most of the data is classified as comments. As shown in Section 3, most systems will fail to classify the deny class and still achieve high scores in terms of . In fact, the best system for 2017 according to (Turing) fails to classify all denies.
Precision () and Recall ()
is the ratio between the number of correctly predicted instances and all the predicted values for : . is the ratio between correctly predicted instances and the number of instances that actually belongs to the class : .
macro-
score is defined as the harmonic mean of precision and recall, where the per-class score can be defined as: . If , is the score. If , is given a higher weight and if , is given a higher weight. The macro- is the arithmetic mean between the scores for each class: macro-. Although macro- is expected to perform better than for imbalanced binary problems, its benefits in the scenario of multi-class classification are not clear. Specifically, as it relies on the arithmetic mean over the classes, it may hide the poor performance of a model in one of the classes if it performs well on the majority class (i.e. comments in this case). For instance, as shown in Table 2, according to macro- the best performing system would be ECNU, which still fails to classify correctly almost all deny instances.
| macro- | ||||||
|---|---|---|---|---|---|---|
| Turing a | 0.784 (1) | 0.434 (5) | 0.000 (8) | 0.583 (7) | 0.274 (6) | 0.230 (7) |
| UWaterloo Bahuleyan and Vechtomova (2017) | 0.780 (2) | 0.455 (2) | 0.237 (5) | 0.595 (5) | 0.300 (2) | 0.255 (6) |
| ECNU Wang et al. (2017) | 0.778 (3) | 0.467 (1) | 0.214 (7) | 0.599 (4) | 0.289 (4) | 0.263 (4) |
| Mama Edha García Lozano et al. (2017) | 0.749 (4) | 0.453 (3) | 0.220 (6) | 0.607 (1) | 0.299 (3) | 0.283 (3) |
| NileTMRG Enayet and El-Beltagy (2017) | 0.709 (5) | 0.452 (4) | 0.363 (1) | 0.606 (2) | 0.306 (1) | 0.296 (1) |
| IKM Chen et al. (2017) | 0.701 (6) | 0.408 (7) | 0.272 (4) | 0.570 (8) | 0.241 (7) | 0.226 (8) |
| IITP Singh et al. (2017) | 0.641 (7) | 0.403 (8) | 0.345 (2) | 0.602 (3) | 0.276 (5) | 0.294 (2) |
| DFKI DKT Srivastava et al. (2017) | 0.635 (8) | 0.409 (6) | 0.316 (3) | 0.589 (6) | 0.234 (8) | 0.256 (5) |
| majority class | 0.742 | 0.213 | 0.000 | 0.500 | 0.043 | 0.047 |
| all denies | 0.068 | 0.032 | 0.000 | 0.500 | 0.051 | 0.107 |
| all support | 0.090 | 0.041 | 0.000 | 0.500 | 0.066 | 0.132 |
| macro- | ||||||
|---|---|---|---|---|---|---|
| BLCU NLP Yang et al. (2019) | 0.841 (2) | 0.619 (1) | 0.571 (2) | 0.722 (2) | 0.520 (1) | 0.500 (2) |
| BUT-FIT Fajcik et al. (2019) | 0.852 (1) | 0.607 (2) | 0.519 (3) | 0.689 (3) | 0.492 (3) | 0.441 (3) |
| eventAI Li et al. (2019a) | 0.735 (11) | 0.578 (3) | 0.726 (1) | 0.807 (1) | 0.502 (2) | 0.602 (1) |
| UPV Ghanem et al. (2019) | 0.832 (4) | 0.490 (4) | 0.333 (5) | 0.614 (5) | 0.340 (4) | 0.292 (5) |
| GWU Hamidian and Diab (2019) | 0.797 (9) | 0.435 (5) | 0.000 (7) | 0.604 (6) | 0.284 (5) | 0.265 (6) |
| SINAI-DL García-Cumbreras et al. (2019) | 0.830 (5) | 0.430 (6) | 0.000 (8) | 0.577 (7) | 0.255 (7) | 0.215 (7) |
| wshuyi | 0.538 (13) | 0.370 (7) | 0.467 (4) | 0.627 (4) | 0.261 (6) | 0.325 (4) |
| Columbia Liu et al. (2019) | 0.789 (10) | 0.363 (8) | 0.000 (9) | 0.562 (10) | 0.221 (10) | 0.191 (9) |
| jurebb | 0.806 (8) | 0.354 (9) | 0.122 (6) | 0.567 (9) | 0.229 (8) | 0.120 (12) |
| mukundyr | 0.837 (3) | 0.340 (10) | 0.000 (10) | 0.570 (8) | 0.224 (9) | 0.198 (8) |
| nx1 | 0.828 (7) | 0.327 (11) | 0.000 (11) | 0.557 (11) | 0.206 (11) | 0.173 (10) |
| WeST Baris et al. (2019) | 0.829 (6) | 0.321 (12) | 0.000 (12) | 0.551 (12) | 0.197 (12) | 0.161 (11) |
| Xinthl | 0.725 (12) | 0.230 (13) | 0.000 (13) | 0.493 (13) | 0.072 (13) | 0.071 (13) |
| majority class | 0.808 | 0.223 | 0.000 | 0.500 | 0.045 | 0.048 |
| all denies | 0.055 | 0.026 | 0.000 | 0.500 | 0.042 | 0.091 |
| all support | 0.086 | 0.040 | 0.000 | 0.500 | 0.063 | 0.128 |
Geometric mean
Metrics like the geometric mean of :
are proposed for evaluating specific types of errors. As may be more relevant than for imbalanced data, assessing models using is an option to measure this specific type of error. Moreover, applying for each class severely penalises a model that achieves a low score for a given class.
Area under the curve
Receiver operating characteristic () Fawcett (2006) assesses the performance of classifiers considering the relation between and the false positive rate, defined as (per class): . Since RSC consists of discrete classifications, charts for each contain only one point regarding the coordinate (, ). Area under the curve () measures the area of the curve produced by the points in an space. In the discrete case, it measures the area of the polygon drawn by the segments connecting the vertices . High scores are achieved when (probability of detection) is maximised, while (probability of false alarm) is minimised. We experiment with a weighted variation of :
Weighted macro-
a variation of macro-, where each class also receives different weights, is also considered:
We use ( and have the same importance) and ( is more important). Arguably, misclassifying denies and supports ( and , respectively) is equivalent to ignore relevant information for debunking a rumour. Since negatively impact , we hypothesise that is more robust for the RSC case.
and are inspired by empirical evidence that different classes have different importance for RSC.333Similarly, previous work proposes metrics Elkan (2001) and learning algorithms Chawla et al. (2008) based on class-specific mis-classification costs. Weights should be manually defined, since they cannot be automatically learnt. We follow the hypothesis that support and deny classes are more informative than others.444, and .
3 Re-evaluating RumourEval task A
Tables 2 and 3 report the different evaluation scores per metric for each of the RumourEval 2017 and 2019 systems.555The systems HLT(HITSZ), LECS, magc, UI-AI, shaheyu and NimbusTwoThousand are omitted because they do not provide the same number of inputs as the test set. and macro- are reported in the second and third columns respectively, followed by a column for each of the four proposed metrics. Besides evaluating the participating systems, we also computed scores for three baselines: majority class (all stances are considered comments), all denies and all support (all replies are classed as deny/support).
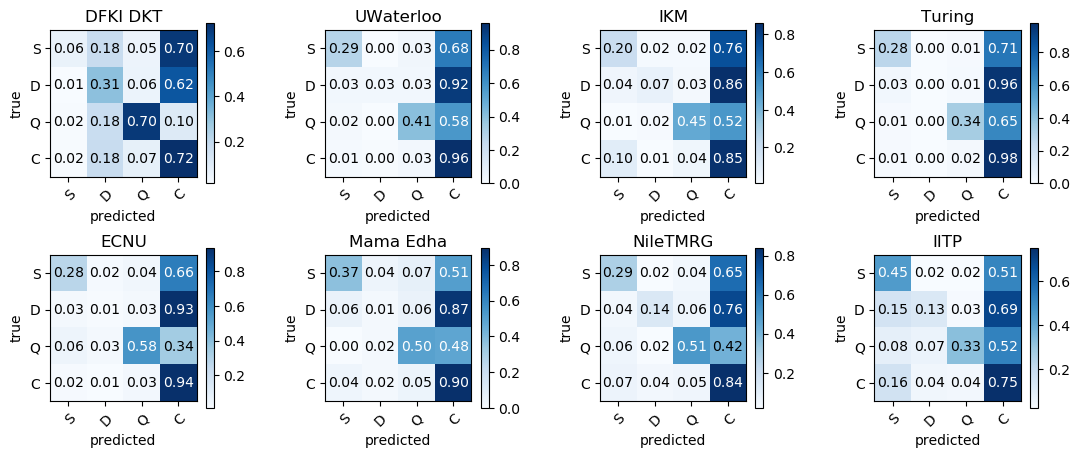
Our results show that the choice of evaluation metric has a significant impact on system ranking. In RumourEval 2017, the winning system based on was Turing. However, Figure 2 shows that this system classified all denies incorrectly, favouring the majority class (comment). When looking at the macro- score, Turing is classified as fifth, whilst the winner is ECNU, followed by UWaterloo. Both systems also perform very poorly on denies, classifying only 1% and 3% of them correctly. On the other hand, the four proposed metrics penalise these systems for these errors and rank higher those that perform better on classes other than the majority one. For example, the winner according to , and is NileTMRG that, according to Figure 2, shows higher accuracy on the deny, support and query classes, without considerably degraded performance on the majority class. still favours the Mama Edha system which has very limited performance on the important deny class. As is evident from Figure 2, NileTMRG is arguably the best system in predicting all classes: it has the highest accuracy for denies, and a sufficiently high accuracy for support, queries and comments. Using the same criteria, the second best system should be IITP. The only two metrics that reflect this ranking are and . In the case of , the second system is UWaterloo, which has a very low accuracy on the deny class.
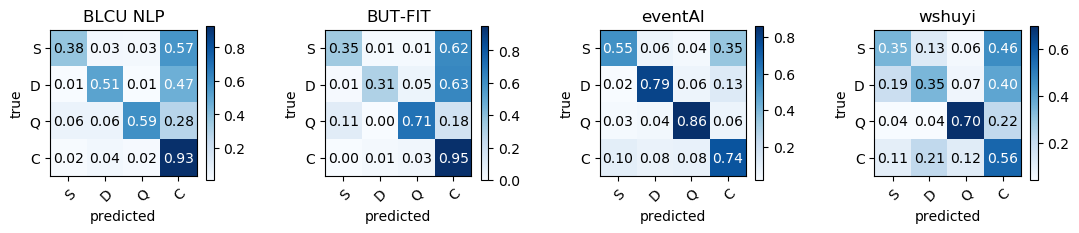
For RumourEval 2019, the best system according to macro- (the official metric) is BLCU NLP, followed by BUT-FIT. However, after analysing the confusion matrices in Figure 3, we can conclude that eventAI is a more suitable model due to its high accuracy on support and deny. Metrics , and show eventAI as the best system. Finally, wshuyi is ranked as fourth according to , and , while it ranked seventh in terms of macro-, behind systems like GWU and SINAI-DL that fail to classify all deny instances. Although wshuyi is clearly worse than eventAI, BLCU NLP and BUT-FIT, it is arguably more reliable than systems that misclassify the large majority of denies.666Confusion matrices for all systems of RumourEval 2019 are presented in Appendix A. Our analyses suggest that and are the most reliable for evaluating RSC tasks.
4 Weight selection
In Section 3, , and have been obtained using empirically defined weights (, and ). These values reflect the key importance of the support and deny classes. Although query is less important than the first two, it is nevertheless more informative than comment.
Previous work tried to adjust the learning weights in order to minimise the effect of the imbalanced data. García Lozano et al. (2017) (Mama Edha), change the weights of their Convolutional Neural Network (CNN) architecture, giving higher importance to support, deny and query classes, to better reflect their class distribution.777, and Ghanem et al. (2019) (UPV) also change the weights in their Logistic Regression model in accordance with the data distribution criterion.888, and Nevertheless, these systems misclassify almost all deny instances.
Table 4 shows the RumourEval 2017 systems ranked according to using the Mama Edha and UPV weights. In these cases, benefits DFKI DKT, ranking it first, since queries receive a higher weight than support. However, this system only correctly classifies 6% of support instances, which makes it less suitable for our task than NileTMRG for instance. ECNU is also ranked better than Mama Edha and IITP, likely due to its higher performance on query instances.
| Mama Edha | UPV | |
| Turing | 0.246 (8) | 0.289 (8) |
| UWaterloo | 0.283 (7) | 0.322 (5) |
| ECNU | 0.334 (3) | 0.364 (3) |
| Mama Edha | 0.312 (4) | 0.349 (4) |
| NileTMRG | 0.350 (2) | 0.374 (2) |
| IKM | 0.293 (5) | 0.318 (7) |
| IITP | 0.289 (6) | 0.321 (6) |
| DFKI DKT | 0.399 (1) | 0.398 (1) |
Arguably, defining weights based purely on data distribution is not sufficient for RSC. Thus our empirically defined weights seem to be more suitable than those derived from data distribution alone, as the former accurately reflect that support and deny are the most important, albeit minority distributed classes. Further research is required in order to identify the most suitable weights for this task.
5 Discussion
This paper re-evaluated the systems that participated in the two editions of RumourEval task A (stance classification). We showed that the choice of evaluation metric for assessing the task has a significant impact on system rankings. The metrics proposed here are better suited to evaluating tasks with imbalanced data, since they do not favour the majority class. We also suggest variations of and macro- that give different weights for each class, which is desirable for scenarios where some classes are more important than others.
The main lesson from this paper is that evaluation is an important aspect of NLP tasks and it needs to be done accordingly, after a careful consideration of the problem and the data available. In particular, we recommend that future work on RSC uses and/or (preferably ) as evaluation metrics. Best practices on evaluation rely on several metrics that can assess different aspects of quality. Therefore, relying on several metrics is likely the best approach for RSC evaluation.
Acknowledgments
This work was funded by the WeVerify project (EU H2020, grant agreement: 825297). The SoBigData TransNational Access program (EU H2020, grant agreement: 654024) funded Diego Silva’s visit to the University of Sheffield.
References
- Bahuleyan and Vechtomova (2017) Hareesh Bahuleyan and Olga Vechtomova. 2017. UWaterloo at SemEval-2017 task 8: Detecting stance towards rumours with topic independent features. In Proceedings of the 11th International Workshop on Semantic Evaluation (SemEval-2017), pages 461–464, Vancouver, Canada. Association for Computational Linguistics.
- Baris et al. (2019) Ipek Baris, Lukas Schmelzeisen, and Steffen Staab. 2019. CLEARumor at SemEval-2019 task 7: ConvoLving ELMo against rumors. In Proceedings of the 13th International Workshop on Semantic Evaluation, pages 1105–1109, Minneapolis, Minnesota, USA. Association for Computational Linguistics.
- Chawla et al. (2008) Nitesh V. Chawla, David A. Cieslak, Lawrence O. Hall, and Ajay Joshi. 2008. Automatically countering imbalance and its empirical relationship to cost. Data Mining and Knowledge Discovery, 17(2):225–252.
- Chen et al. (2017) Yi-Chin Chen, Zhao-Yang Liu, and Hung-Yu Kao. 2017. IKM at SemEval-2017 task 8: Convolutional neural networks for stance detection and rumor verification. In Proceedings of the 11th International Workshop on Semantic Evaluation (SemEval-2017), pages 465–469, Vancouver, Canada. Association for Computational Linguistics.
- Derczynski et al. (2017) Leon Derczynski, Kalina Bontcheva, Maria Liakata, Rob Procter, Geraldine Wong Sak Hoi, and Arkaitz Zubiaga. 2017. SemEval-2017 task 8: RumourEval: Determining rumour veracity and support for rumours. In Proceedings of the 11th International Workshop on Semantic Evaluation (SemEval-2017), pages 69–76, Vancouver, Canada. Association for Computational Linguistics.
- Dungs et al. (2018) Sebastian Dungs, Ahmet Aker, Norbert Fuhr, and Kalina Bontcheva. 2018. Can rumour stance alone predict veracity? In Proceedings of the 27th International Conference on Computational Linguistics, pages 3360–3370, Santa Fe, New Mexico, USA. Association for Computational Linguistics.
- Elkan (2001) Charles Elkan. 2001. The foundations of cost-sensitive learning. In Proceedings of the 17th International Joint Conference on Artificial Intelligence - Volume 2, pages 973–978, Seattle, Washington, USA. International Joint Conferences on Artificial Intelligence.
- Elrahman and Abraham (2013) Shaza M. Abd Elrahman and Ajith Abraham. 2013. A Review of Class Imbalance Problem. Journal of Network and Innovative Computing, 1:332–340.
- Enayet and El-Beltagy (2017) Omar Enayet and Samhaa R. El-Beltagy. 2017. NileTMRG at SemEval-2017 task 8: Determining rumour and veracity support for rumours on twitter. In Proceedings of the 11th International Workshop on Semantic Evaluation (SemEval-2017), pages 470–474, Vancouver, Canada. Association for Computational Linguistics.
- Fajcik et al. (2019) Martin Fajcik, Pavel Smrz, and Lukas Burget. 2019. BUT-FIT at SemEval-2019 task 7: Determining the rumour stance with pre-trained deep bidirectional transformers. In Proceedings of the 13th International Workshop on Semantic Evaluation, pages 1097–1104, Minneapolis, Minnesota, USA. Association for Computational Linguistics.
- Fawcett (2006) Tom Fawcett. 2006. An introduction to ROC analysis. Pattern Recognition Letters, 27(8):861–874.
- García-Cumbreras et al. (2019) Miguel A. García-Cumbreras, Salud María Jiménez-Zafra, Arturo Montejo-Ráez, Manuel Carlos Díaz-Galiano, and Estela Saquete. 2019. SINAI-DL at SemEval-2019 task 7: Data augmentation and temporal expressions. In Proceedings of the 13th International Workshop on Semantic Evaluation, pages 1120–1124, Minneapolis, Minnesota, USA. Association for Computational Linguistics.
- García Lozano et al. (2017) Marianela García Lozano, Hanna Lilja, Edward Tjörnhammar, and Maja Karasalo. 2017. Mama edha at SemEval-2017 task 8: Stance classification with CNN and rules. In Proceedings of the 11th International Workshop on Semantic Evaluation (SemEval-2017), pages 481–485, Vancouver, Canada. Association for Computational Linguistics.
- Ghanem et al. (2019) Bilal Ghanem, Alessandra Teresa Cignarella, Cristina Bosco, Paolo Rosso, and Francisco Manuel Rangel Pardo. 2019. UPV-28-UNITO at SemEval-2019 task 7: Exploiting post’s nesting and syntax information for rumor stance classification. In Proceedings of the 13th International Workshop on Semantic Evaluation, pages 1125–1131, Minneapolis, Minnesota, USA. Association for Computational Linguistics.
- Gorrell et al. (2019) Genevieve Gorrell, Elena Kochkina, Maria Liakata, Ahmet Aker, Arkaitz Zubiaga, Kalina Bontcheva, and Leon Derczynski. 2019. SemEval-2019 task 7: RumourEval, determining rumour veracity and support for rumours. In Proceedings of the 13th International Workshop on Semantic Evaluation, pages 845–854, Minneapolis, Minnesota, USA. Association for Computational Linguistics.
- Hamidian and Diab (2019) Sardar Hamidian and Mona Diab. 2019. GWU NLP at SemEval-2019 task 7: Hybrid pipeline for rumour veracity and stance classification on social media. In Proceedings of the 13th International Workshop on Semantic Evaluation, pages 1115–1119, Minneapolis, Minnesota, USA. Association for Computational Linguistics.
- Huang and Ling (2005) Jin Huang and Charles X Ling. 2005. Using AUC and accuracy in evaluating learning algorithms. IEEE Transactions on Knowledge and Data Engineering, 17(3):299–310.
- Kochkina et al. (2018) Elena Kochkina, Maria Liakata, and Arkaitz Zubiaga. 2018. All-in-one: Multi-task learning for rumour verification. In Proceedings of the 27th International Conference on Computational Linguistics, pages 3402–3413, Santa Fe, New Mexico, USA. Association for Computational Linguistics.
- Kumar and Carley (2019) Sumeet Kumar and Kathleen Carley. 2019. Tree LSTMs with convolution units to predict stance and rumor veracity in social media conversations. In Proceedings of the 57th Annual Meeting of the Association for Computational Linguistics, pages 5047–5058, Florence, Italy. Association for Computational Linguistics.
- Li et al. (2019a) Quanzhi Li, Qiong Zhang, and Luo Si. 2019a. eventAI at SemEval-2019 task 7: Rumor detection on social media by exploiting content, user credibility and propagation information. In Proceedings of the 13th International Workshop on Semantic Evaluation, pages 855–859, Minneapolis, Minnesota, USA. Association for Computational Linguistics.
- Li et al. (2019b) Quanzhi Li, Qiong Zhang, and Luo Si. 2019b. Rumor detection by exploiting user credibility information, attention and multi-task learning. In Proceedings of the 57th Annual Meeting of the Association for Computational Linguistics, pages 1173–1179, Florence, Italy. Association for Computational Linguistics.
- Liu et al. (2019) Zhuoran Liu, Shivali Goel, Mukund Yelahanka Raghuprasad, and Smaranda Muresan. 2019. Columbia at SemEval-2019 task 7: Multi-task learning for stance classification and rumour verification. In Proceedings of the 13th International Workshop on Semantic Evaluation, pages 1110–1114, Minneapolis, Minnesota, USA. Association for Computational Linguistics.
- Mendoza et al. (2010) Marcelo Mendoza, Barbara Poblete, and Carlos Castillo. 2010. Twitter under crisis: can we trust what we RT? In Proceedings of the First Workshop on Social Media Analytics, pages 71–79, Washington, DC, USA. Association for Computing Machinery.
- Mohammad et al. (2016) Saif Mohammad, Svetlana Kiritchenko, Parinaz Sobhani, Xiaodan Zhu, and Colin Cherry. 2016. SemEval-2016 task 6: Detecting stance in tweets. In Proceedings of the 10th International Workshop on Semantic Evaluation (SemEval-2016), pages 31–41, San Diego, California. Association for Computational Linguistics.
- Singh et al. (2017) Vikram Singh, Sunny Narayan, Md Shad Akhtar, Asif Ekbal, and Pushpak Bhattacharyya. 2017. IITP at SemEval-2017 task 8 : A supervised approach for rumour evaluation. In Proceedings of the 11th International Workshop on Semantic Evaluation (SemEval-2017), pages 497–501, Vancouver, Canada. Association for Computational Linguistics.
- Srivastava et al. (2017) Ankit Srivastava, Georg Rehm, and Julian Moreno Schneider. 2017. DFKI-DKT at SemEval-2017 task 8: Rumour detection and classification using cascading heuristics. In Proceedings of the 11th International Workshop on Semantic Evaluation (SemEval-2017), pages 486–490, Vancouver, Canada. Association for Computational Linguistics.
- Wang et al. (2017) Feixiang Wang, Man Lan, and Yuanbin Wu. 2017. ECNU at SemEval-2017 task 8: Rumour evaluation using effective features and supervised ensemble models. In Proceedings of the 11th International Workshop on Semantic Evaluation (SemEval-2017), pages 491–496, Vancouver, Canada. Association for Computational Linguistics.
- Yang et al. (2019) Ruoyao Yang, Wanying Xie, Chunhua Liu, and Dong Yu. 2019. BLCU_NLP at SemEval-2019 task 7: An inference chain-based GPT model for rumour evaluation. In Proceedings of the 13th International Workshop on Semantic Evaluation, pages 1090–1096, Minneapolis, Minnesota, USA. Association for Computational Linguistics.
- Yijing et al. (2016) Li Yijing, Guo Haixiang, Liu Xiao, Li Yanan, and Li Jinling. 2016. Adapted ensemble classification algorithm based on multiple classifier system and feature selection for classifying multi-class imbalanced data. Knowledge-Based Systems, 94:88–104.
- Zubiaga et al. (2018) Arkaitz Zubiaga, Ahmet Aker, Kalina Bontcheva, Maria Liakata, and Rob Procter. 2018. Detection and resolution of rumours in social media: A survey. ACM Computing Surveys, 51(2):32:1–32:36.
- Zubiaga et al. (2016) Arkaitz Zubiaga, Maria Liakata, Rob Procter, Geraldine Wong Sak Hoi, and Peter Tolmie. 2016. Analysing how people orient to and spread rumours in social media by looking at conversational threads. Plos One, 11(3).
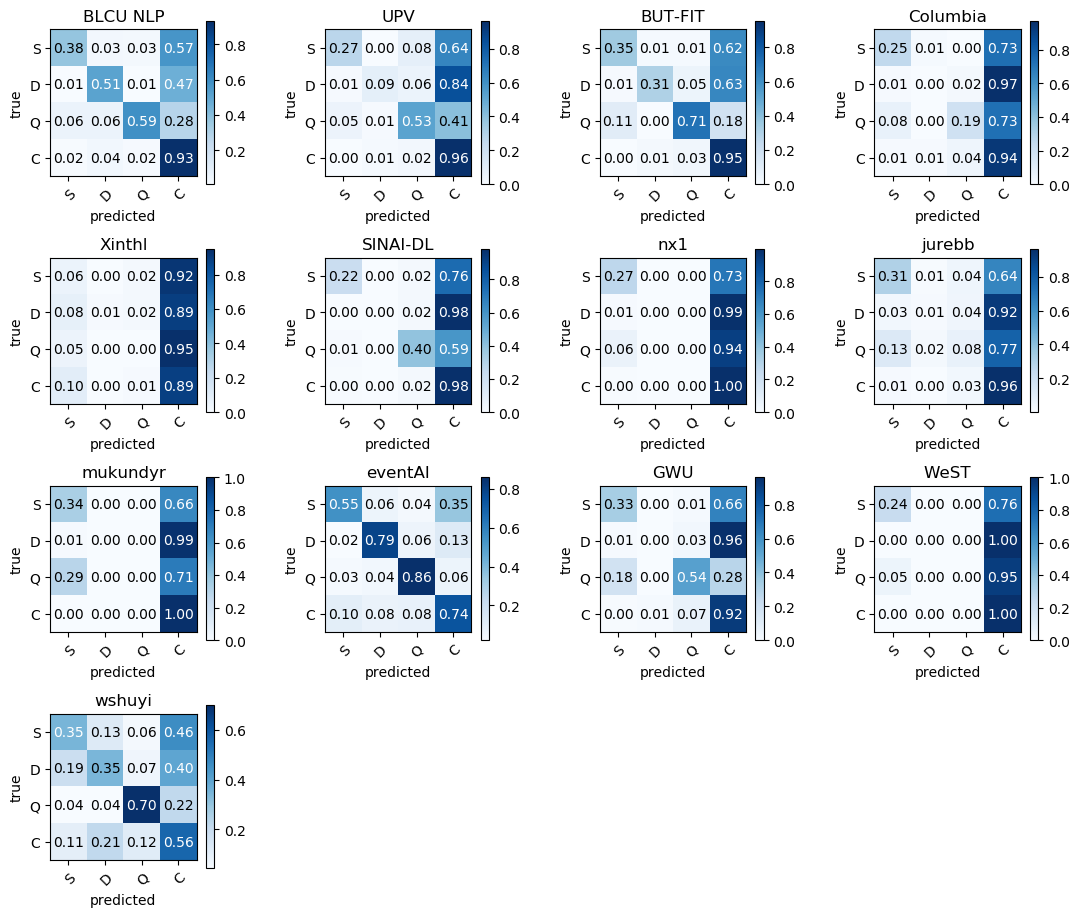
Appendix A Confusion matrices for all RumourEval 2019 systems
For completeness, Figure 4 shows the confusion matrices of all systems submitted to RumourEval 2019. Apart from the four systems discussed in Section 3, all other systems fails to correctly classify the large majority of deny instances.