1Indian Institute of Astrophysics, Koramangala II Block, Bengaluru, Karnataka-560034, India.
INVESTIGATION OF THE HELIUM ENHANCEMENT IN A SUPER LITHIUM RICH GIANT HD 77361
Abstract
In this work, the helium-enhancement (He-enhancement) in the lithium-rich (Li-rich) K-giant HD 77361 is investigated using the strengths of the MgH band and the Mg i lines. The detailed abundance analysis and also the synthesis of the MgH band and the Mg i lines has been carried out for HD 77361. One would expect, within uncertainities, same Mg abundance from both the MgH and Mg i lines. But, we found that Mg abundance derived from MgH lines is significantly less than the abundance from Mg i lines, and this difference cannot be reconciled by changing the stellar parameters within the uncertainties, implying He enhancement in star’s photosphere. The He enhancement in the atmospheres is estimated by using models of different He/H ratios so that both the lines, MgH as well as Mg i, return the same Mg abundance for the adopted model’s He/H ratio. We found He/H=0.40.1 as the value for HD 77361, the normal value of He/H=0.1. Knowing the amount of He-enhancement in the Li-rich giants is a strong clue for understanding the scenarios responsible for the Li and He enrichment. The analysis and results are discussed.
keywords:
Stellar-evolution, Chemically-Peculiar Starshemabp.phy@gmail.com
12.3456/s78910-011-012-3 \artcitid#### \volnum000 0000 \pgrange1– \lp1
1 Introduction
Lithium (Li) is a fragile element that gets destroyed at temperatures of about 2.5 106 K. The initial value of Li abundance from the interstellar medium is about log (Li)=3.3 dex. Due to the mixing in the pre-main sequence phase, main-sequence phase, and during the first dredge-up, the Li gets diluted and the log (Li) reduces to about 1.5-1.8 dex in the low-mass G-K giants (Lambert et al. 1980, Charbonnel & Balachandran 2000). This Li abundance is the upper limit for most of the G-K giants. But there is a group of G-K giants having very strong Li lines in their spectra. They have unexpectedly high values of the Li abundance of about log (Li) 2.5-3.0 dex. These are the enigmatic group of stars, for which the source/process of the Li-enhancement is not clear yet. One of the scenarios that explains the Li-enhancement is dredge-up from the deeper layers, where Li is produced.
In this work we have investigated the amount of helium (He) in the atmosphere of one such super Li-rich giant HD 77361. We suspect that during the mixing process from the deeper layers, the convection zone dredges-up the He along with the other hydrogen burning elements such as Li, C, N, and 13C. The analysis and the results are discussed in the following sections.
2 Observations
The high-resolution optical spectrum of the super Li-rich cool giant HD 77361 was obtained from the McDonald Observatory by Kumar & Reddy (2009) for their study. The spectrum obtained with the 2.7 m Harlan J. Smith Telescope and Tull coude cross-dispersed echelle spectrograph (Tull et al. 1995) is at a resolving power of about / = 50000. The spectra were reduced using IRAF software package following the standard procedure.
3 Abundance analysis
Using the high-resolution spectra of the program star HD 77361, the equivalent widths for several spectral lines of several elements were measured using tasks in the IRAF package. The equivalent widths are measured for the weak and moderately strong, both neutral and ionized, spectral lines. The very strong and saturated spectral lines were discarded as they do not fall in the linear part of the curve-of-growth for the stellar spectral lines.The line list of (Johnson & Pilachowski 2010) was used. The elements for which the lines are very few or none in the Johnson & Pilachowski’s (2010) list, for those the lines were adopted from Ramírez & Allende Prieto (2011).
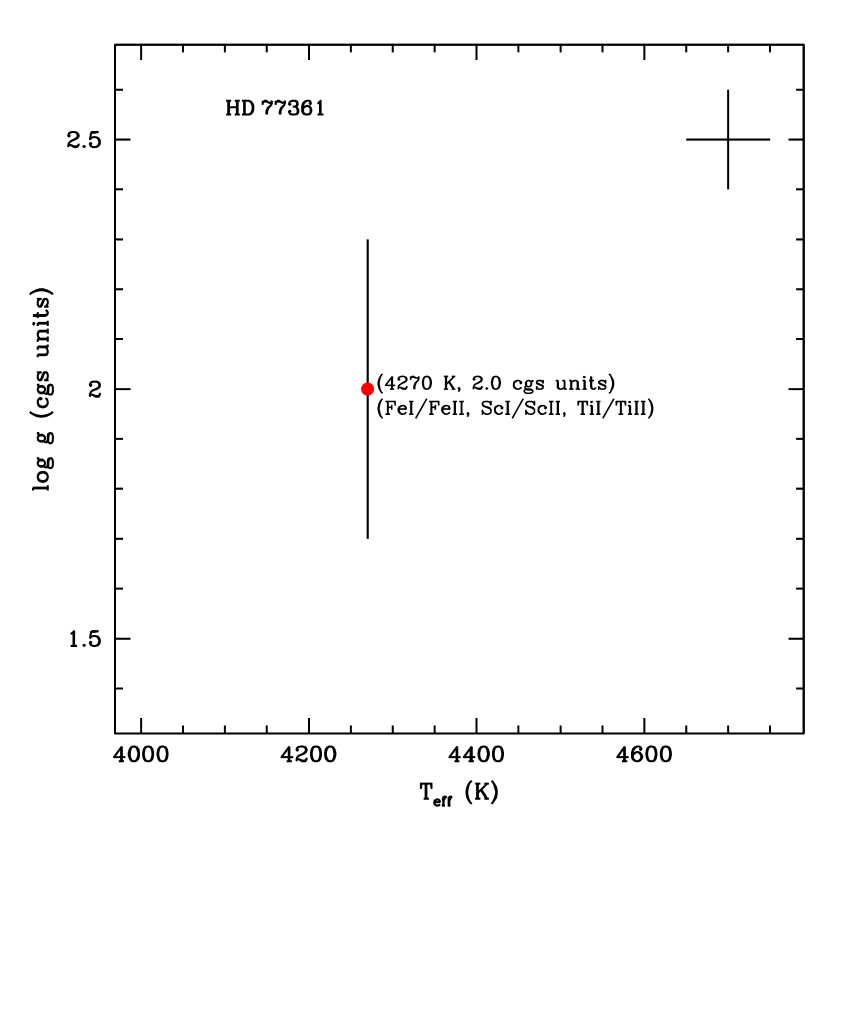
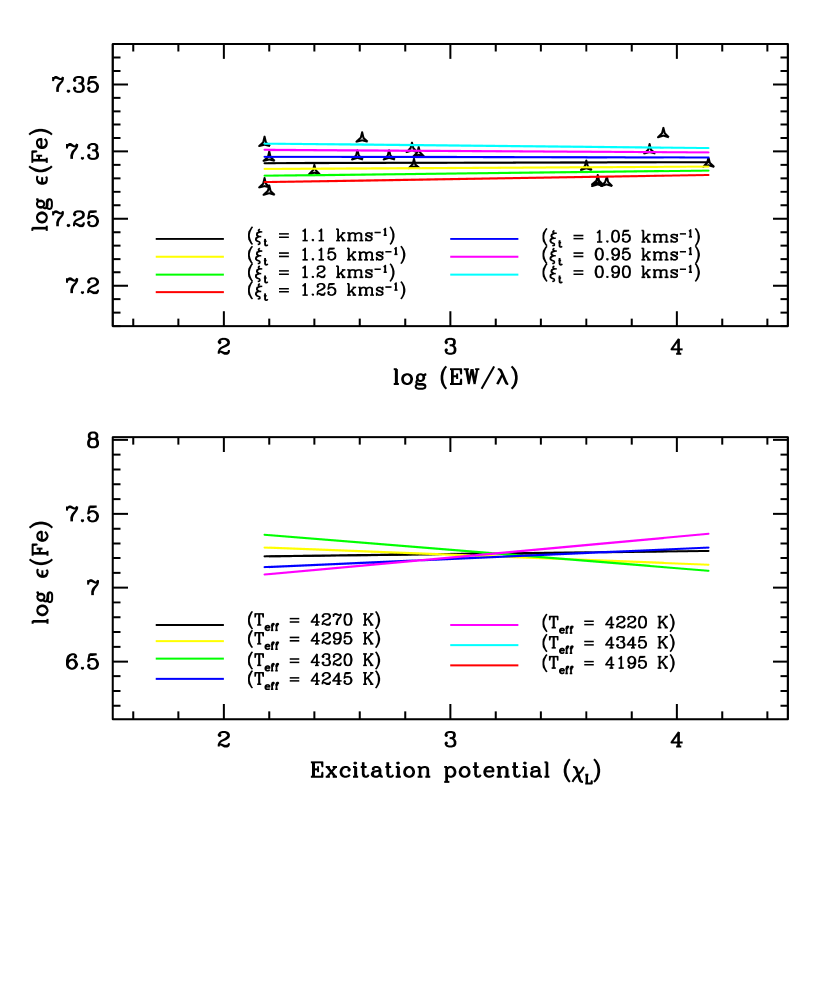
For the determination of stellar parameters and the elemental abundances, the LTE line analysis and spectrum synthesis code MOOG (Sneden 1973) and the ATLAS9 (Kurucz 1998) plane parallel, line-blanketed LTE model atmospheres were used. The microturbulence () is derived using Fe i lines having a similar excitation potential and a range in equivalent width, weak to strong, giving the same abundance (see Figure 1). The effective temperature () is determined using the excitation balance of Fe i lines having a range in lower excitation potential (see Figure 2). The and were fixed iteratively. The process was carried out until both returned zero slope. By adopting the determined and , the surface gravity (log ) is derived. The surface gravity is fixed by demanding the same abundances from the lines of different ionization states of a species, known as ionization balance. The surface gravity is derived using the lines of Fe i/Fe ii, Ti i/Ti ii, and Sc i/Sc ii. Then, the mean log was adopted (see Figure 3).


For HD 77361, the stellar parameters are determined by Kumar & Reddy (2009) and also by Lyubimkov et al. (2015). The stellar parameters determined spectroscopically by Kumar & Reddy (2009) and Lyubimkov et al. (2015), respectively, are; (, , , log (Fe)): (458075 K, 2.50.1 cm s-2, 1.40.5 km s-1, 7.480.1), and (4370100 K, 2.300.1 cm s-2, 1.10.2 km s-1, 7.490.14). The stellar parameters derived in this work are: = 427050 K, = 2.00.1 cm s-2, = 1.2 km s-1, [Fe/H]=7.450.12. The stellar parameters are in very good agreement with those derived by Lyubimkov et al. (2015). Adopting these stellar parameters, the MgH bands and the neutral Mg lines are analysed.
Uncertainties on the and are estimated by changing the in steps of 25 K and in steps of 0.05 km s-1. The change in and and the corresponding deviations in abundance, from the zero slope abundance, of about 1 error, is obtained. This change is adopted as the uncertainty on these parameters. The adopted = 50 K and = 0.1 km s-1 (see Figure 4). The uncertainties on log is the standard deviation from the mean value of the log determined from different species, which is about 0.1 (cgs units). The linelist used for the abundance analysis is adopted from Hema et al. (2018).
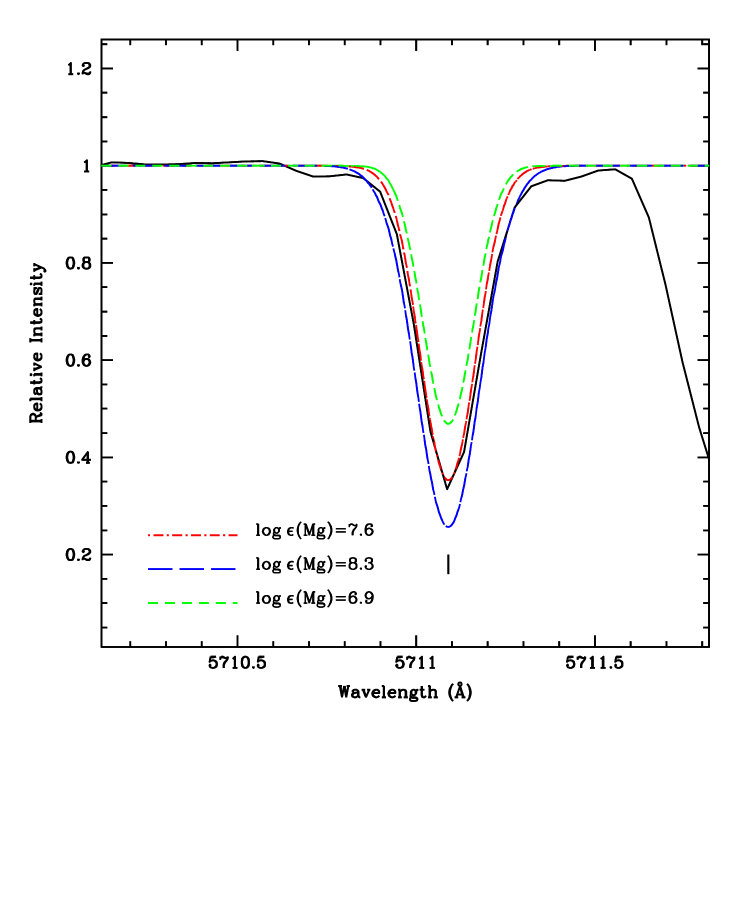
The elemental abundances derived for the determined stellar parameters for the normal He/H ratio 0.1, is given in Table 1. The solar abundances (Asplund et al. 2009), the abundance ratios ([E/Fe]) and the number of lines used are also given. An Mg i line at 5711Å in HD7̇7361 is also synthesized to support the Mg abundance derived from Mg i equivalent width analysis (see Figure 5).
4 MgH Band and Spectrum Synthesis
Using the derived stellar parameters and the elemental abundances, the MgH band in the spectra of HD 77361 is analysed. Our aim is to investigate if the star is He-enhanced. Similar to our previous studies, using the procedure that was developed by Hema & Pandey (2014) and Hema et al. (2018) the He-enhancement is investigated. Our method is that, the Mg abundance derived from the subordinate lines of (0,0) MgH molecular band that are free from contamination, and that from the Mg i atomic lines derived from the neutral weak and clean Mg i lines, are compared to examine if there exists any difference between these two abundances beyond the uncertainties.
The Mg abundance from the atomic lines are derived from the equivalent width analysis and also by synthesis. The well-identified Mg i line at 5711Å is synthesized and is shown in Figure 5. The derived Mg abundance by equivalent width analysis and by synthesis are; log (Mg) = 7.450.13 and 7.6 dex, respectively. These Mg abundances are in good agreement within the uncertainties.
Spectrum of the (0, 0) MgH band is synthesized from 5100–5200Å which includes the Mg b lines and the (0, 0) MgH band. The procedure adopted here is from Hema & Pandey (2014) and Hema et al. 2018. For synthesizing the spectra, the atomic lines were compiled from the standard atomic data sources, and all of the atomic lines identified by Hinkle et al. (2000) were included. The (0, 0) MgH molecular line list was adopted from Hinkle et al. (2013). Synthetic spectra were generated by combining the LTE spectral line analysis/synthesis code MOOG (Sneden 1973), and the ATLAS9 (Kurucz 1998) plane parallel, line-blanketed LTE model atmospheres with convective overshoot. Spectrum of Arcturus, a typical red giant, was synthesized to validate the adopted gf–values of the atomic/molecular lines. Using the spectrum synthesis code, synth in MOOG, the high-resolution optical spectrum of Arcturus was synthesized for the stellar parameters and the abundances given by Ramírez & Allende Prieto (2011). The synthesized spectrum was convolved with a Gaussian profile with a width that represents the broadening due to macroturbulence and the instrumental profile. Minimal adjustments were made to the abundances of the atomic lines to obtain the best fit to the observed high-resolution optical spectrum of Arcturus (Hinkle et al. 2000). The changes in the log gf–values were not more than 0.1 dex. A reasonably good fit was obtained to the MgH molecular lines for the adopted isotopic values from McWilliam & Lambert (1988).
A good match of the synthesized Arcturus spectrum to the observed high–resolution spectra validates the adopted line list for the adopted stellar parameters of Arcturus. These checks on the published analysis of Arcturus are taken as evidence that our implementation of the code MOOG, the LTE models, and the adopted line list were successful for the syntheses of the red giants’ spectra. Hence, the spectrum of HD 77361 was synthesized following the above procedure.
| Elements | log | HD 77361 | ||||
|---|---|---|---|---|---|---|
| log (He/H=0.1) | [X/Fe] | log (He/H=0.40) | [X/Fe] | |||
| H | 12.00 | 12.00 | 11.735 | |||
| He | 10.93 | 11.00 | 11.337 | |||
| Li | 1.05 | 3.90 | 2.9 | 3.67 | 3.02 | 1 |
| C | 6.24 | 8.70.14 | 2.51 | 7.740.15 | 1.90 | 3 |
| O | 8.69 | 8.660.02 | 0.02 | 8.450.03 | 0.16 | 2 |
| Na | 6.24 | 6.180.05 | 0.01 | 5.890.05 | 0.05 | 3 |
| Mg (Mg i) | 7.60 | 7.450.13 | 0.10 | 7.050.09 | 0.15 | 4 |
| Mg (MgH) | 7.00 | 0.55 | 7.05 | 0.15 | ||
| Al | 6.45 | 6.400.08 | 0.00 | 6.050.08 | 0.00 | 4 |
| Si | 7.51 | 7.800.12 | 0.34 | 7.300.11 | 0.19 | 5 |
| Ca | 6.34 | 5.930.18 | 0.36 | 5.580.17 | 0.36 | 8 |
| Sc i | 3.15 | 2.810.13 | 0.29 | 2.690.12 | 0.06 | 3 |
| Sc ii | 3.15 | 3.000.12 | 0.10 | 2.690.07 | 0.06 | 5 |
| Ti i | 4.95 | 4.480.05 | 0.42 | 4.310.06 | 0.24 | 6 |
| Ti ii | 4.95 | 4.620.08 | 0.28 | 4.240.10 | 0.31 | 4 |
| V | 3.93 | 3.560.10 | 0.32 | 3.340.10 | 0.19 | 4 |
| Cr | 5.64 | 5.320.14 | 0.27 | 5.030.12 | 0.21 | 7 |
| Mn | 5.43 | 5.300.20 | 0.08 | 5.060.19 | 0.03 | 3 |
| Fe i | 7.50 | 7.450.12 | 0.05 | 7.100.12 | 0.40 | 18 |
| Fe ii | 7.500.05 | 0.00 | 7.000.05 | 0.50 | 4 | |
| Co | 4.99 | 5.130.17 | 0.19 | 4.780.17 | 0.19 | 6 |
| Ni | 6.22 | 6.190.18 | 0.02 | 5.810.13 | 0.01 | 3 |
| La | 1.10 | 2.10 | 1.05 | 1.76 | 1.06 | 1 |
Note. Abundances derived for the normal (He/H=0.1) and the determined (He/H) for the program star is given. The corresponding abundance ratios, the number of spectral lines used, and the solar abundances (Asplund et al. 2009) are also provided.
The Mg abundance derived from the subordinate lines of MgH band for the stellar parameters derived (see Section 3) is about 7.0, while the Mg abundance derived from the Mg i lines is about 7.450.1 dex (see Figure 6). The abundance ratio [Mg/Fe] derived from MgH bands is less by about 0.45 dex than that derived from the Mg i lines. The Mg abundance from the subordinate lines of the MgH band were derived by changing the stellar parameters within the uncertainties and is summarized in Table 2. From Table 2, it is clear that this difference cannot be reconciled by making the changes to the stellar parameters within the uncertainties (see Figure 6) and also for slightly higher margin on the uncertainty of the . The Mg abundance derived from the MgH bands with a change of about 100 K on the derived also do not provide a comparable Mg abundance from that of the Mg i lines. Hence, this difference is attributed to the lower hydrogen or He-enhancement in the atmosphere of the program star. The amount of He-enhancement is determined using the appropriate models and is discussed in the following section.
| log | [Mg/Fe] from Mg i | [Mg/Fe] from MgH | |
|---|---|---|---|
| 4270 | 2.0 | 0.1 | 0.55 |
| 4320 | 2.0 | 0.13 | 0.50 |
| 4220 | 2.0 | 0.11 | 0.70 |
| 4270 | 2.1 | 0.09 | 0.60 |
| 4270 | 1.9 | 0.12 | 0.50 |
| 4170 | 2.0 | 0.09 | 0.70 |
| 4370 | 2.0 | 0.13 | 0.30 |
5 Determination of the He/H ratio for HD 77361
For the abundance analysis discussed in section 3, the input abundances of H and He provided to MOOG, that adopts a model atmosphere computed for a normal He/H ratio of 0.1, are log (H)=12 and log (He)=11, respectively. The observed spectra of the program star was reanalysed using model atmospheres with differing He/H ratios, computed and interpolated for different He/H ratios (Kurucz 1993, Kurucz 2014, Kurucz 2017, Kurucz 2018 Sbordone et al. 2004, 2007, Sbordone 2005, Castelli & Kurucz 2003), For details on model atmosphere see section 3.2 of Hema et al. (2020).
The stellar parameters were rederived using a grid of model atmosphere with He/H=0.20, 0.30, 0.40, 0.50; the adopted metallicity of the grid is fixed based on the derived metallicity of the program star for the normal He/H ratio. The procedure adopted for determining the stellar parameters is ditto as described in Section 3. The rederived stellar parameters are not sensitive and almost independent of the adopted grid’s He/H ratio. For the program star’s derived stellar parameters, synthetic spectra in the MgH band region were computed for different He/H ratios. The Mg abundance used for the above synthesis were derived from the measured equivalent widths of the weak Mg i lines for the adopted model’s He/H ratio. Hence, the best fit to the MgH band in the observed spectrum determines the adopted model’s He/H ratio. Finally, the elemental abundances are derived for the adopted stellar parameters: , , , and the He/H ratio (see Table 1). Note that the adopted metallicity of the model atmosphere comes from the iron abundances derived from the measured equivalent widths of the Fe lines for the program star, and is an iterative process.
In the case of elemental abundances derived by adopting model atmospheres with same stellar parameters but varying He/H ratios (for example, He/H=0.20 and 0.10), the abundances from the higher He/H ratios are lower than that derived from the normal. Here, decreasing the hydrogen abundance or increasing the helium abundance i.e., increasing the He/H ratio, lowers the continuous opacity per gram (Sumangala Rao et al. 2011). Hence, for the same observed strength of the spectral line, the elemental abundance has to decrease (see Table 1). The decrease in abundance is proportional to the amount of H-deficiency or the He-enrichment applied in the sense of He/H ratio. However, the abundance ratios remain unchanged for most of the elements with few exceptions.
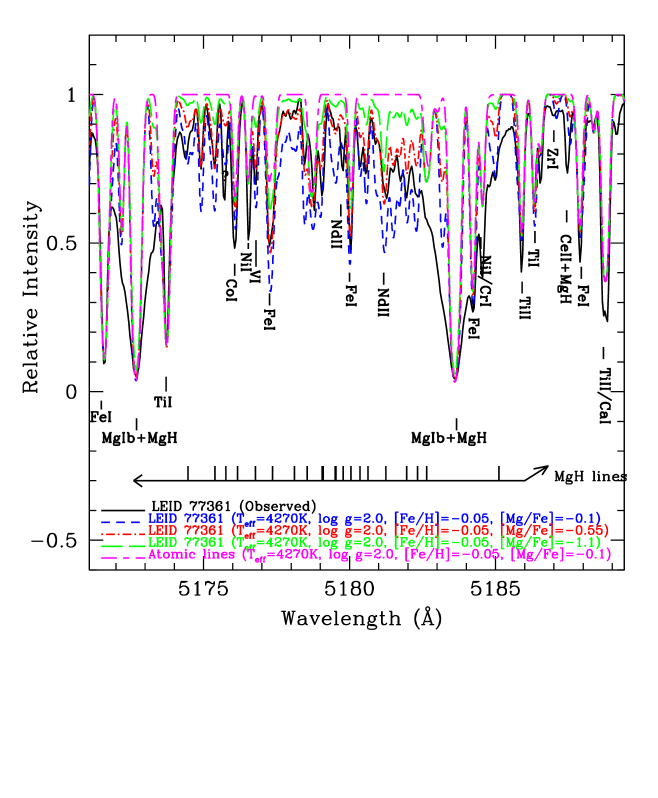
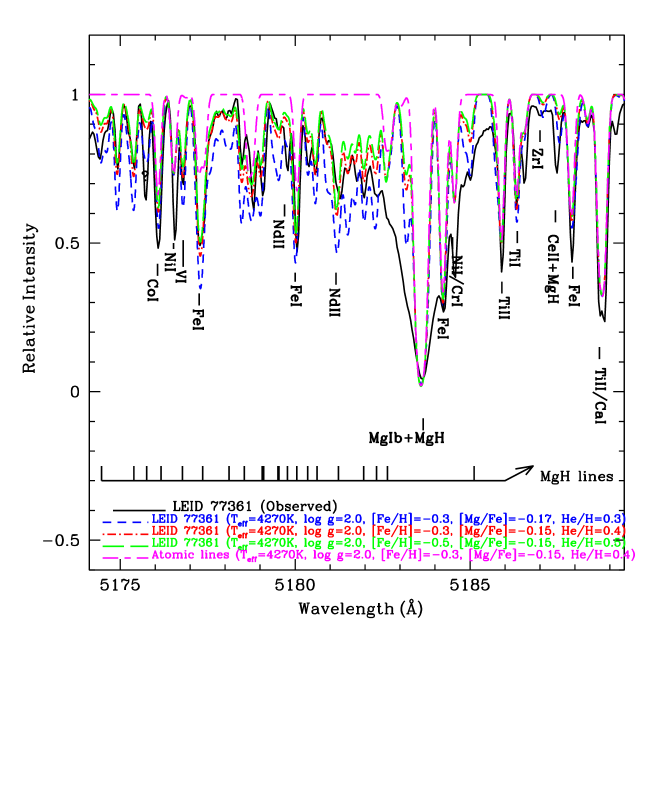
Examples of the spectrum syntheses in the MgH band region for the program star are presented in figure 7. By adopting the respective elemental abundances derived from the adopted model computed for the pair of [Fe/H] and the He/H ratio, spectra in the MgH band region were synthesized. Figure 7, for HD 77361, clearly shows that for the Mg abundance of 7.050.09 (from Mg i lines), the best fit to the observed MgH band (mainly the subordinate lines of MgH band at about 5175Å) is obtained for He/H ratio, He/H=0.40 and the metallicity, [Fe/H]=0.3. Nevertheless, the input abundances of H and He provided to MOOG are log (H)=11.735 and log (He)=11.337, respectively, for the adopted model of He/H=0.4, obtained using the standard relation: + 4 =1012.15. And, the corresponding mass fractions for H and He are: Z(H)=0.385 and Z(He)=Y=0.614.
The He/H ratio for the program star is determined from the observed MgH band in their spectra. Once the stellar parameters and metallicity are determined and fixed, the MgH band strength depends mainly on the atmosphere’s Mg abundance and the He/H ratio. Then, the uncertainty on the He/H ratio is primarily due to the uncertainty on the Mg abundance, which is about 0.1. Hence, for the program star HD 77361, He/H = 0.400.1.
6 Discussion
HD 77361 is a super Li-rich K-giant having high value of observed Li-abundance like the known Li-rich giants. This is located around the bump region of the red giant branch. Our determination of Li-abundance which is about 3.9 is obtained by a single line that is 6103Å, since the Li i line 6707Å is very strong. This is in excellent agreement with that derived by Kumar & Reddy (2009). Our aim was to investigate the He-enhancement in the Li-rich giants. Comparing the abundances derived from the Mg i lines and from the subordinate lines of the (0,0) MgH band, the He abundance (He/H ratio) is estimated for HD 77361. Using the appropriate models, the He-enhancement is determined. The He-enhancement is about He/H=0.40.1, the normal value (He/H=0.1). By adopting the derived He-abundance(He/H ratio) and the metallicity [Fe/H], 0.40.1 and 0.3, respectively, the corresponding elemental abundances are derived. Using the He-enhanced models, the Li abundance is about 3.7, which still places HD 77361 among the super Li-rich giants.
The two plausible scenarios for Li-enrichment in G- and K-giants are, the dredge-up from deeper layers which surfaces the hydrogen-burning products, and the planet engulfment. Since, HD 77361 is a super Li-rich giant and is located around the RGB-bump, the potential scenario for Li-enrichment is the dredge-up process. Since the convective zone reaches into the deeper layers, the mixing dredges up the hydrogen-burning products such as Li, C, N, and also to the surface. From our analysis, HD 77361 is also enhanced in helium and is a product of hydrogen burning. Hence, it appears that along with the Li, and other hydrogen burning products, He is also brought up to the surface due to extra mixing by deeper convective zone. This could be one of the possible scenarios for Li- and He-enrichment in HD 77361. However, the He-enhancement in the Li-rich giants located at different positions in the RGB-phase, such as RGB-bump, clump, RGB-ascent and also at the RGB-tip, needs to be explored, and this work is in progress. Knowing the He- and Li-enrichment in these stars would be a strong clue for understanding the processes responsible for these enhancements.
We are very thankful to Dr. Bharat Kumar Yerra and Prof. Eshwar Reddy for providing us with the spectra of HD 77361. We thank Prof. Carlos Allende Prieto for helping us in obtaining the He-enhanced models.
References
- [1] Castelli, F., & Kurucz, R. L. 2003, in IAU Symposium, Vol. 210, Modelling of Stellar Atmospheres, ed. N. Piskunov, W. W. Weiss, & D. F. Gray, A20
- [2] Charbonnel, C., & Balachandran, S. C. 2000, A&A, 359, 563
- [3] Hema, B. P., & Pandey, G. 2014, ApJL, 792, L28
- [4] Hema, B. P., Pandey, G., & Srianand, R. 2018, ApJ, 864, 121
- [5] Hema, B. P., Pandey, G., R. L. Kurucz, & C. Allende Prieto 2020, ApJ, 897, 32
- [6] Hinkle, K., Wallace, L., Valenti, J., & Harmer, D. 2000, Visible and Near Infrared. Atlas of the Arcturus Spectrum 3727-9300 (San Francisco, CA: ASP)
- [7] Hinkle, K. H., Wallace, L., Ram, R. S., et al. 2013, ApJS, 207, 26
- [8] Johnson, C. I., & Pilachowski, C. A. 2010, ApJ, 722, 1373
- [9] Kumar, Y. B., & Reddy, B. E. 2009, ApJ, 703, L46
- [10] Kurucz, R. 1993, ATLAS9 Stellar Atmosphere Programs and 2 km/s grid. Kurucz CD-ROM No. 13. Cambridge, 13
- [11] Kurucz, R. L. 1998, http://kurucz.harvard.edu/
- [12] Kurucz, R. 2014, Model Atmosphere Codes: ATLAS12 and ATLAS9, 39–51
- [13] Kurucz, R. 2017, Canadian Journal of Physics, 95, 825
- [14] Kurucz, R. 2018, Astronomical Society of the Pacific Conference Series, Vol. 515, Including All the Lines: Data Releases for Spectra and Opacities through 2017, 47
- [15] Lambert, D. L., Dominy, J. F., & Sivertsen, S. 1980, ApJ, 235, 114
- [16] Lyubimkov, L. S., Kaminsky, B. M., Metlov, V. G., et al. 2015, Astronomy Letters, 41, 809
- [17] McWilliam, A., & Lambert, D. L. 1988, MNRAS, 230, 573
- [18] Ramírez, I., & Allende Prieto, C. 2011, ApJ, 743, 135
- [19] Sbordone, L. 2005, Memorie della Societa Astronomica Italiana Supplementi, 8, 61
- [20] Sbordone, L., Bonifacio, P., & Castelli, F. 2007, in IAU Symposium, Vol. 239, Convection in Astrophysics, ed. F. Kupka, I. Roxburgh, & K. L. Chan, 71–73
- [21] Sbordone, L., Bonifacio, P., Castelli, F., & Kurucz, R. L. 2004, Memorie della Societa Astronomica Italiana Supplementi, 5, 93
- [22] Sneden, C. A. 1973, PhD thesis, The Univ. Texas
- [23] Sumangala Rao, S., Pandey, G., Lambert, D. L., & Giridhar, S. 2011, ApJ, 737, L7
- [24] Tull, R. G., MacQueen, P. J., Sneden, C., & Lambert, D. L. 1995, PASP, 107, 251