MMT Spectroscopy of Lyman-alpha at z7: Evidence for Accelerated Reionization Around Massive Galaxies
Abstract
Reionization-era galaxies tend to exhibit weak Ly emission, likely reflecting attenuation from an increasingly neutral IGM. Recent observations have begun to reveal exceptions to this picture, with strong emission now known in four of the most massive z=7–9 galaxies in the CANDELS fields, all of which also exhibit intense [OIII]+H emission (EW800 Å). To better understand why is anomalously strong in a subset of massive galaxies, we have initiated an MMT/Binospec survey targeting a larger sample (N=22) of similarly luminous (1–6 L) z7 galaxies selected over very wide-area fields (3 deg2). We confidently (7) detect in 78% (7/9) of galaxies with strong [OIII]+H emission (EW800 Å) as opposed to only 8% (1/12) of galaxies with more moderate (EW=200-800 Å) [OIII]+H. We argue that the higher EWs of the strong [OIII]+H population likely reflect enhanced ionizing photon production efficiency owing to their large sSFRs (30 Gyr-1). We also find evidence that transmission from massive galaxies declines less rapidly over than in low-mass lensed systems. In particular, our data suggest no strong evolution in transmission, consistent with a picture wherein massive z7 galaxies often reside in large ionized regions. We detect three closely-separated ( = 1.7 physical Mpc) z7 emitters in our sample, conceivably tracing a large ionized structure that is consistent with this picture. We detect tentative evidence for an overdensity in this region, implying a large ionizing photon budget in the surrounding volume.
keywords:
galaxies: high-redshift – cosmology: dark ages, reionization, first stars – galaxies: evolution1 Introduction
Within the past decade, a number of concerted efforts have aimed at better understanding how and when the process of hydrogen reionization occurred. Such information provides insight into not only the growth of structure in the very early Universe, but also the nature of ionizing sources responsible for reionization (e.g. Loeb & Barkana, 2001; Fan et al., 2006; Robertson et al., 2015; Bouwens et al., 2015b; Finkelstein, 2016; Stark, 2016; Dayal & Ferrara, 2018; Naidu et al., 2020). Observationally, there has been great progress in identifying star-forming galaxies at z6–10 (e.g. Ellis et al. 2013; McLure et al. 2013; Bowler et al. 2014, 2020; Atek et al. 2015; Bouwens et al. 2015a, 2019; Finkelstein et al. 2015; Livermore et al. 2017; Oesch et al. 2018; Ono et al. 2018; Stefanon et al. 2017, 2019), revealing a population capable of generating copious amounts of ionizing photons in the early Universe.
The impact of these early ionizing agents on the IGM can be tracked independently using measurements of the timeline of the reionization process. Prominent detections of the and Ly forests in quasar spectra at z6 provide a model-independent constraint suggesting that reionization was largely complete by z=5.9 (neutral fraction 10%; McGreer et al. 2015). However, the presence of a long neutral patch identified at z=5.5 (Becker et al., 2015) suggests that reionization may have ended as late as z5.2–5.3 (Kulkarni et al., 2019; Keating et al., 2020; Nasir & D’Aloisio, 2020). At yet higher redshifts, strong damping wing signatures in the earliest known quasars (z7.0–7.5) provide evidence for significant neutral hydrogen fractions (40–60%; Greig et al. 2017; Bañados et al. 2018; Davies et al. 2018; Wang et al. 2020). Measurements of the Thomson scattering optical depth from the CMB are consistent with this reionization timeline, suggesting a reionization midpoint of z7.7 (Planck Collaboration et al., 2016, 2020).
High-redshift (z6) galaxies have also long enabled complementary constraints on the timeline of reionization owing to the resonant nature of the emission line (e.g. Miralda-Escudé, 1998; Malhotra & Rhoads, 2004; Santos, 2004; Mesinger & Furlanetto, 2008; Dijkstra, 2014). A number of studies have uncovered a marked decline in the fraction of star-forming galaxies showing strong (rest-frame equivalent width EW25 Å) at z6, consistent with expectations of an increasingly neutral IGM (e.g. Fontana et al., 2010; Stark et al., 2010; Vanzella et al., 2011; Ono et al., 2012; Treu et al., 2013; Caruana et al., 2014; Pentericci et al., 2014, 2018; Schenker et al., 2014; De Barros et al., 2017; Jung et al., 2017; Hoag et al., 2019; Mason et al., 2019). In a similar manner, the volume density of narrow-band selected emitters has been found to decrease rapidly from z6 to z7 (e.g. Malhotra & Rhoads, 2004; Hu et al., 2010; Ouchi et al., 2010; Kashikawa et al., 2011; Konno et al., 2014; Ota et al., 2017; Zheng et al., 2017). Both these downturns suggest a highly neutral universe (0.4) at z7 (e.g. Ota et al., 2017; Zheng et al., 2017; Mason et al., 2018a; Whitler et al., 2020), consistent with inferences from quasar spectra.
In the last five years, attention has begun to focus on the properties of the most massive galaxies known in the reionization era. Recent spectroscopic observations have revealed a 100% detection rate among four of the brightest111Throughout this work, we adopt M = 20.6 from the z7 luminosity function results of Bowler et al. (2017). (3–4 L) and most massive z=7–9 galaxies selected over the CANDELS fields (Oesch et al. 2015; Zitrin et al. 2015; Roberts-Borsani et al. 2016; Stark et al. 2017, hereafter the RB16 sample), in marked contrast to the 10–20% detection rate among typical (L) galaxies at z7 (e.g. Ono et al., 2012; Treu et al., 2013; Pentericci et al., 2014, 2018; Schenker et al., 2014). It is not yet clear why the photons emerging from the RB16 galaxies are so readily detectable given the highly neutral state of the IGM at z7. One likely possibility is that these massive galaxies trace strong overdensities (Zitrin et al., 2015) and are hence situated in large ionized regions in the IGM (e.g. Furlanetto et al., 2004; Wyithe & Loeb, 2005; Lee et al., 2007; McQuinn et al., 2007; Weinberger et al., 2018). These bubbles enable photons to redshift further into the damping wing before encountering HI, boosting the transmission (e.g. Mesinger et al., 2004; Mason & Gronke, 2020). On the other hand, the high-EW [OIII]+H emission (800 Å) of the RB16 sample may suggest that their detections were driven more by physics internal to each of the four galaxies (Stark et al., 2017). Strong [OIII]+H typically signals a recent rapid upturn or burst in star formation activity, i.e. high specific star formation rate (sSFR; Tang et al. 2019; Endsley et al. 2021, hereafter E21), giving rise to very young stellar populations. The spectra of such galaxies are therefore dominated by extremely hot stars which produce ionizing photons very efficiently with respect to the far-UV continuum. Assuming these ionizing photons are reprocessed into recombination lines, this should also boost the production rate of Ly relative to the rest-UV continuum.
To better understand the origin of strong from massive reionization-era galaxies, we have initiated an MMT/Binospec campaign targeting in a much larger sample of bright (1–6 L) z7 systems. Here, we use the first results from our spectroscopic campaign to investigate to what extent strong [OIII]+H (and hence large sSFRs) enhance detectability among bright reionization-era galaxies. Because our sources were selected over the very wide-area COSMOS and XMM3 fields (1.5 deg2 each), we are able to assemble a much larger sample of these rare systems relative to CANDELS (0.2 deg2 total; Grogin et al. 2011; Koekemoer et al. 2011).
We furthermore test whether our results are consistent with a picture wherein bright (and therefore likely massive; e.g. Barone-Nugent et al. 2014; Song et al. 2016a) z7 galaxies often reside in large highly-ionized bubbles, as would be expected if they preferentially trace overdensities. If this is the case, we would expect the transmission of photons from bright galaxies to show a substantially weaker decline at z6 relative to much fainter sources. Recent observations suggest a sharp (factor of 10) decline in transmission for faint (0.1 L) lensed galaxies between z6–7 (Hoag et al., 2019; Fuller et al., 2020). Our goal is to test whether our bright (1–6 L) z7 galaxy sample exhibit a less rapid decline in transmission, building on earlier work targeting massive galaxies (e.g. Ono et al. 2012; Furusawa et al. 2016). For this investigation, we complement our z7 targets with a collection of similarly bright z6 sources that were observed simultaneously with the multiplex Binospec instrument.
This paper is organized as follows. In §2, we describe our observations including our sample selection, spectroscopic results, and the inferred [OIII]+H EWs of each source. We present our analysis in §3, including an investigation of whether detectability is enhanced in bright z7 systems with strong [OIII]+H. We then discuss what our results imply for the presence of ionized regions around massive reionization-era galaxies in §4. Our main conclusions are summarized in §5.
2 Observations
We have initiated a large spectroscopic survey of bright (1–6 L) galaxies at z7 with MMT/Binospec. Our selection criteria are described in §2.1. We then detail our spectroscopic results and the photometric properties of galaxies in our spectroscopic sample in §2.2. Finally, we infer the physical properties (e.g. stellar mass and [OIII]+H EW) of each spectroscopic target in §2.3.
2.1 Source Selection and Photometry
In this work, we aim to accomplish two goals focused on targeting in bright (L) galaxies at z6–7. First, we seek to investigate whether strong [OIII]+H (and hence large sSFRs) lead to enhanced emission among bright reionization-era galaxies. Second, we aim to quantify the evolution in the EW distribution of bright galaxies between z6–7 to test whether our results are consistent with a picture wherein massive z7 systems often reside in large ionized bubbles. Given the rarity of such luminous high-redshift galaxies, we select these sources over very wide-area fields, specifically the COSMOS and XMM3 fields which span 1.5 and 1.8 deg2, respectively. We describe our z7 and z6 source selection criteria in turn below.
2.1.1 Selection of z7 Sources
To ensure we can reliably identify z7 galaxies and infer their [OIII]+H EWs, we photometrically select our targets over wide-area (1 deg2) fields with deep optical through mid-infrared imaging. Because of the exceptionally deep imaging over COSMOS, the majority of our sources are selected within this field. The Subaru/Hyper Surpime-Cam (HSC) Subaru Strategic Program (HSCSSP; Aihara et al. 2018, 2019) provides optical (0.4–1m) imaging across COSMOS in the g,r,i,z,y broad-bands as well as the nb816 and nb921 narrow-bands. The near-infrared data come from the UltraVISTA survey (McCracken et al., 2012) which delivers imaging in VISTA/VIRCam Y, J, H, and Ks broad-bands. We use PDR2 and DR4 data from HSCSSP and UltraVISTA, respectively, both of which are already astrometrically calibrated to the Gaia frame which we adopt throughout this work.
Our z7 source selection over COSMOS largely follows that described in E21 which utilizes, in part, the nb921 photometry to limit the selection to z6.6 with high confidence. The specific adopted Lyman-break colour cuts are zy1.5, zY1.5, nb921Y1.0, and yY0.4 where we set fluxes in the z and nb921 dropout filters to their 1 values in cases of non-detections, consistent with previous literature (e.g. Bouwens et al., 2015a; Stefanon et al., 2019). These z7 selection criteria were designed by simulating the colours of z=6–8 galaxies with flat rest-UV slopes ( = 2 where F) using the Inoue et al. (2014) IGM transmission function. As with any Lyman-break selection utilizing broad-band photometry, the exact redshift selection window depends slightly on the assumed EW. Galaxies with weak emission (0 Å EW) are only likely to satisfy the above criteria from z6.6–6.9 because at higher redshifts the yY colour becomes too red. On the other hand, sources with strong satisfy our selection criteria to larger maximum redshifts – up to z7.1 and z7.2 for EW = 25 Å and 100 Å, respectively. This is because strong will boost the y-band flux resulting in bluer yY colours at a given redshift. We refer the interested reader to Figure 2 of E21 for a visualization of the impact of on our redshift selection window. Because only 10% of bright z7 galaxies show strong emission (EW25 Å; Ono et al. 2012; Schenker et al. 2014; Pentericci et al. 2018), the large majority of our sample will likely lie at z6.6–6.9. None the less, we directly account for how our redshift selection window depends on strength when inferring the EW distribution as described in §2.2.4.
Along with the above colour cuts, we ensure that each z7 source is real by requiring a 3 detection in y, Y, and J as well as a 5 detection in at least one of those three bands. We also enforce non-detections (2) in g and r since both these bands probe flux blueward of the Lyman-continuum limit at z6.6. Finally, we clean our sample of T-type brown dwarfs (which can exhibit very strong z and nb921-drops) by preserving only those with YJ0.45 or (JH0 and JKs 0). These cuts are guided by brown dwarf spectra in the SPEX library (Burgasser, 2014) which demonstrate that T-type brown drafts have red YJ colours but blue JH and JKs colours.
To build statistics on the brightest end, we also select galaxies over the XMM3 field. While the optical through mid-infrared coverage over XMM3 is significantly shallower relative to COSMOS, we are still able to identify the most luminous (J 24.5) z7 galaxies within this field. Near-infrared imaging over XMM3 comes from DR3 of the VIDEO survey222We astrometrically correct the public VIDEO mosaics to the Gaia frame to bring into agreement with the optical HSC imaging. (Jarvis et al., 2013) which provides data from the Z, Y, J, H, and Ks VISTA/VIRCam broad-bands. For the optical imaging, we again use PDR2 of the HSCSSP which provides coverage in all the same bands as in COSMOS except for nb921. To compensate for the lack of nb921 imaging over XMM3, we enforce a much stronger dropout in the Z band, specifically requiring Zy2.5 and ZY2.5 while maintaining the yY0.4 cut we applied in COSMOS. We found that such cuts select z7 sources in a very similar redshift window as COSMOS after performing colour simulations of z=6–8 galaxies similar to those described in E21. Here, we use VIRCam Z as the dropout band in XMM3 because the imaging in Z is often slightly deeper relative to z and both bands have very similar (normalized) transmission curves. All other selection criteria are equivalent to that over COSMOS.
To identify sources within each field, we run SExtractor (Bertin & Arnouts, 1996) on a yYJHKs detection image (Szalay et al., 1999). We then calculate the optical and near-infrared photometry of each source in 1.2″ diameter apertures which is 1.5 the seeing in all bands. Aperture corrections are calculated from the median curve-of-growth of nearby isolated, unsaturated stars and photometric errors are determined using the standard deviation of flux within apertures randomly placed in nearby empty locations. As reported in E21, the typical 5 depths in the COSMOS field are m=27.7, 27.4, 27.3, 26.1, 26.9, 26.2, and 26.1 in g, r, i, nb816, z, nb921, and y, respectively. For the UltraVISTA data, the typical depths are m=24.7, 24.5, 24.2, and 24.5 in Y, J, H, and Ks, respectively, for the deep stripes and m=25.9, 25.8, 25.6, and 25.2, respectively for the ultra-deep stripes. We are therefore able to identify z7 galaxies as faint as J26 in the ultra-deep stripes and J25 in the deep stripes. In XMM3, the typical 5 depths are m=26.7, 26.3, 25.7, 25.3, 25.5, 24.3, 25.6, 25.0, 24.7, 24.3, and 23.9 in g, r, i, nb816, z, y, Z, Y, J, H, and Ks, respectively. We can therefore identify z7 galaxies as faint as J24.5 across XMM3.
2.1.2 Selection of z6 Sources
To quantify the evolution in the transmission for massive galaxies between z6–7, we also observed bright z6 sources that were photometrically selected as follows. Similar to our z7 procedure, we design optimal z6 selection criteria by simulating the HSC and VIRCam colours of z=5–7 galaxies with rest-UV slope = 2 and adopting the IGM transmission function from Inoue et al. (2014).
Our resulting z6 selection criteria over COSMOS includes the following colour cuts:
-
1.
nb816z1.5
-
2.
rz1.5
-
3.
zy0.5
-
4.
0.5nb921y0.5
Similar to our z7 selection, fluxes in nb816 and r are set to their 1 value in cases of non-detections. With these criteria, most selected bright z6 sources (i.e. those with weak ; Stark et al. 2011; De Barros et al. 2017) will lie at z5.75–6.25 while strong emitters can be selected up to z6.5. We have enforced the cut 0.5nb921y0.5 to minimize the likelihood that strong z6.5 emitters are scattering into our z6 selection. We additionally require a 5 detection in z as well as a 3 detection in nb921 and y to ensure each source is real. Finally, we enforce non-detections (2) in g given that this band lies blueward of the Lyman-continuum break at z5.
In XMM3, our z6 selection is largely similar. Specifically, we enforce nb816Z1.5, rZ1.5, and ZY0.5 (as detailed in §2.1.1, the Z and Y imaging are generally deeper than z and y, respectively, across XMM3). We also require a 5 detection in Z as well as a 3 detection in z and Y to ensure each source is real, in addition to non-detections (2) in g. As in COSMOS, these cuts result in a redshift selection window of z5.75–6.25 for sources with weak emission (EW0 Å). Due to the lack of nb921 imaging across this field, sources with very strong emission (EW100 Å) can be selected up to z6.6. However, our spectroscopic data confirm that all three of our z6 XMM3 targets lie at z6.5 (§2.2) so this is not a concern for this work.
These z6 sources are identified after running SExtractor on a znb921yYJHKs and zZyYJHKs detection image over COSMOS and XMM3, respectively. Optical and near-infrared photometry are calculated in the same way as for the z7 sources (1.2″ diameter apertures). Given the depths in each field, we are able to identify z6 sources down to y26.5 in COSMOS333Because our z6 selection criteria in COSMOS does not utilize VIRCam photometry, the selection is equivalent for the deep and ultra-deep UltraVISTA stripes. and Y25.5 in XMM3. Note that throughout this work, for the z6 galaxies, we quote y-band magnitudes for those in COSMOS and Y-band magnitudes for those in XMM3 given the depth differences noted above.
| Mask Name | RA | Dec | PA | Exposure Time | Average Seeing | |
|---|---|---|---|---|---|---|
| [deg] | [Å] | [s] | [arcsec] | |||
| COSa | 10:02:29.53 | 02:17:24.58 | 45.0 | 8500 | 7200 | 1.0 |
| COSb | 10:00:28.37 | 01:53:50.84 | 98.5 | 8700 | 32400 | 1.1 |
| COSc | 09:59:09.41 | 02:21:25.80 | 101.0 | 8700 | 7200 | 1.1 |
| COSd | 09:59:10.01 | 02:21:07.83 | 101.0 | 8700 | 18900 | 1.0 |
| COSe | 10:00:39.92 | 02:35:16.12 | 20.0 | 8720 | 17100 | 1.2 |
| XMM3a | 02:26:38.04 | 05:03:11.15 | 12.0 | 8700 | 10200 | 0.9 |
| XMM3b | 02:27:22.70 | 04:19:35.44 | 116.2 | 8700 | 18900 | 1.0 |
| Source ID | RA | Dec | J | 3.6 m | 4.5 m | [3.6][4.5] | Masks |
|---|---|---|---|---|---|---|---|
| COS-221419 | 10:00:26.28 | +01:46:03.22 | 26.07 | 25.22 | 26.30 | -1.08 | COSb |
| COS-235129 | 10:00:39.21 | +01:46:43.68 | 25.75 | 24.94 | 25.03 | -0.09 | COSb |
| COS-237729 | 10:00:31.42 | +01:46:51.01 | 25.68 | 24.84 | 25.33 | -0.49 | COSb |
| COS-301652 | 10:00:54.82 | +01:50:05.18 | 25.65 | 24.38 | 24.67 | -0.28 | COSb |
| COS-469110 | 10:00:04.36 | +01:58:35.53 | 24.97 | 24.28 | 24.69 | -0.40 | COSb |
| COS-505871 | 10:00:21.35 | +02:00:30.93 | 25.51 | 24.39 | 24.54 | -0.16 | COSb |
| COS-534584 | 10:00:42.13 | +02:01:56.87 | 24.99 | 24.02 | 24.44 | -0.42 | COSb |
| COS-788571 | 09:59:21.68 | +02:14:53.02 | 25.27 | 24.40 | 25.32 | -0.92 | COSd |
| COS-851423 | 09:59:11.46 | +02:18:10.42 | 25.91 | 24.82 | 25.54 | -0.72 | COSc & COSd |
| COS-854905 | 09:59:09.13 | +02:18:22.38 | 25.75 | 24.46 | 24.90 | -0.44 | COSc & COSd |
| COS-856875 | 09:58:45.34 | +02:18:28.87 | 25.64 | 25.09 | 25.66 | -0.57 | COSc |
| COS-862541 | 10:03:05.25 | +02:18:42.75 | 24.49 | 23.33 | 24.65 | -1.33 | COSa |
| COS-940214 | 09:59:06.73 | +02:22:45.93 | 26.27 | 25.06 | 26.32 | <-1.26 | COSd |
| COS-955126 | 09:59:23.62 | +02:23:32.73 | 25.38 | 24.20 | 25.14 | -0.94 | COSd |
| COS-1009842 | 09:59:06.33 | +02:26:30.48 | 26.22 | 25.16 | 25.78 | -0.61 | COSc & COSd |
| COS-1048848 | 09:59:09.76 | +02:28:32.95 | 26.09 | 26.11 | 26.24 | <-0.13 | COSc & COSd |
| COS-1053257 | 09:58:46.20 | +02:28:45.76 | 24.79 | 23.81 | 24.13 | -0.33 | COSc & COSd |
| COS-1099982 | 10:00:23.37 | +02:31:14.80 | 25.45 | 24.11 | 25.43 | -1.32 | COSe |
| COS-1205190 | 10:00:45.44 | +02:36:48.81 | 25.82 | 25.81 | 25.82 | -0.01 | COSe |
| COS-1235751 | 10:00:11.57 | +02:38:29.81 | 25.62 | 24.27 | 24.45 | -0.18 | COSe |
| XMM3-227436 | 02:26:46.19 | -04:59:53.57 | 24.67 | 24.37 | 23.78 | 0.58 | XMM3a |
| XMM3-504799 | 02:27:13.12 | -04:17:59.25 | 24.33 | 23.37 | 24.32 | -0.95 | XMM3b |
2.1.3 IRAC Photometry
To infer the [OIII]H EWs of our z7 sample, we take advantage of the Spitzer/IRAC imaging over both COSMOS and XMM3. A full description of our procedure for generating IRAC mosaics in both the 3.6m and 4.5m filters is provided in E21. Briefly, we use the mopex software (Makovoz & Khan, 2005) to coadd background-subtracted images (using SExtractor) and astrometrically match the output mosaics to the Gaia reference frame using the IRAF package ccmap. In COSMOS, the IRAC data comes from a multitude of surveys: the Spitzer Extended Deep Survey (SEDS; Ashby et al. 2013), S-CANDELS (Ashby et al., 2015), Star Formation at 4z6 from the Spitzer Large Area Survey with Hyper Suprime-Cam (SPLASH; Steinhardt et al. 2014), Spitzer Matching survey of the UltraVISTA ultra-deep Stripes (SMUVS; Ashby et al. 2018), and Completing the Legacy of Spitzer/IRAC over COSMOS (P.I. I. Labbé). The IRAC data over XMM3 largely comes from the Spitzer Extragalactic Representative Volume Survey (SERVS; Mauduit et al. 2012) with deeper imaging on our z7 targets from late-2019 observations led by P.I. M. Stefanon.
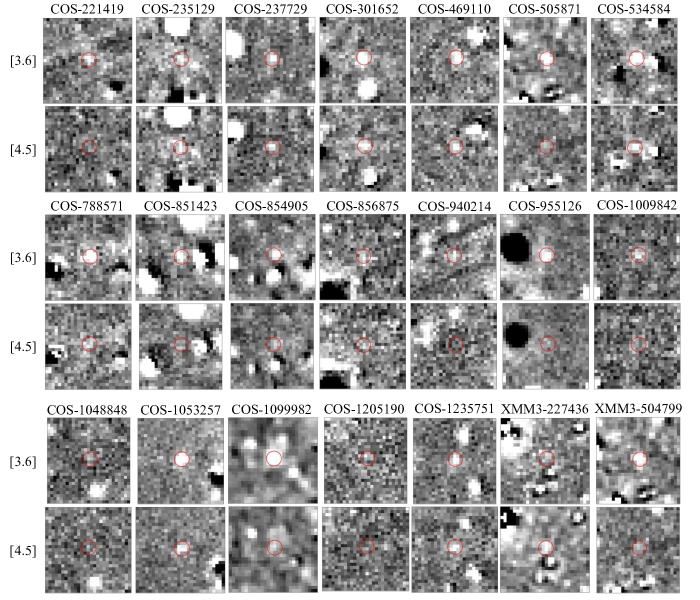
To compensate for the considerably broader IRAC PSF relative to the optical/near-infrared seeing, we measure IRAC photometry in 2.8″ diameter apertures and utilize a deconfusion algorithm to remove contaminating flux from neighboring sources. In XMM3, our deconfusion approach is equivalent to that detailed in E21. To summarize, we convolve the flux profile of every nearby source detected in the yYJHKs image with a 2D Gaussian having FWHM equal to the quadrature difference of the IRAC FWHM and the median seeing from each band in our detection images. Flux profiles are calculated as the square root of the image using the SExtractor segmentation map to determine source footprints. The convolved flux profiles are fit to the IRAC image with total fluxes of each source as free parameters. Once this is done, the best-fitting flux profile of each neighboring source is subtracted before measuring the IRAC photometry. We note that our XMM3 targets are not strongly confused and that residuals from the deconfusion algorithm are acceptably smooth. That is the S/N of the pixels inside the aperture do not appear to be systematically offset due to poor flux-profile fitting of the neighboring sources upon visual inspection. We show the deconfused IRAC postage stamps of both sources in Fig. 11 (see Appendix) to illustrate this point.
In COSMOS, we take advantage of the very high-resolution HST F814W imaging across this field (Scoville et al., 2007) to calculate the flux profile of each neighboring source. By convolving these flux profiles with IRAC PSFs calculated using unsaturated stars near each source (3′ separation), we are able to obtain much smoother residual images from the deconfusion algorithm for sources lying in crowded regions. For the purposes of this work, we remove sources from our sample that have poor IRAC residuals after employing our deconfusion algorithm, as is common in the literature (e.g. Labbé et al., 2013; Smit et al., 2015; Bouwens et al., 2015a; De Barros et al., 2019). One of our COSMOS targets (COS-862541) lies outside the F814W imaging and we therefore employ the same deconfusion approach as for XMM3, noting that this source is also not strongly confused. The deconfused IRAC postage stamp images of all our targets are shown in Fig. 11 (see Appendix).
2.2 MMT/Binospec Spectroscopy
We have followed up a subset of our z6 and z7 galaxy samples described in §2.1 using the Binospec spectrograph (Fabricant et al., 2019) installed at the MMT. Binospec is a wide-field (240 arcmin2) and multi-object (up to 150 sources) spectrograph enabling wavelength coverage up to 1m with moderately high resolution (). As such, Binospec is an ideal instrument to target in large numbers of z6–7 galaxies selected over wide-area fields. So far, we have observed seven masks with five in COSMOS and two in XMM3, totaling just over 31 hours of integration time across all masks. In Table 1, we report the central coordinate, position angle, central wavelength, total exposure time, and average seeing for each mask. When choosing which sources would be assigned slits for each mask, we assigned higher priority to sources with brighter UV magnitudes to obtain a more homogeneous sample across luminosity. Because galaxy rest-UV slopes typically become bluer at higher redshifts (e.g. Bouwens et al., 2014), we also gave higher priority to z6 sources with bluer rest-UV slopes to obtain z6 and z7 samples with more similar properties.
2.2.1 Sample Description
Across these seven masks, we have targeted 22 z7 sources satisfying the selection criteria described in §2.1. In Table 2, we report the coordinates, J-band magnitudes, 3.6 and 4.5m photometry, as well as the [3.6][4.5] colour for each targeted z7 galaxy. We also note in Table 2 the mask containing each source, where four sources were placed on both the COSc and COSd masks for a total integration time of 26100 seconds. The J-band magnitudes of our z7 targets range from J = 24.3–26.3. The vast majority of these sources show blue [3.6][4.5] colours (0), as expected given that z7 galaxies typically possess strong [OIII]+H emission (Labbé et al. 2013; Smit et al. 2014; De Barros et al. 2019; E21). Furthermore, 8 of our 22 z7 targets have very blue [3.6][4.5] colours ( 0.8) which translates to strong [OIII]+H emission (EW800 Å) assuming a flat rest-optical continuum slope and z=6.75. This includes two sources (COS-221419 and COS-940214) that have 3.6m fluxes substantially above the 4.5m 2 upper limit. Thus, even though these sources are not detected in 4.5m, the data still suggest that they likely possess strong [OIII]+H emission.
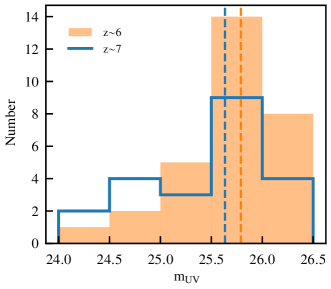
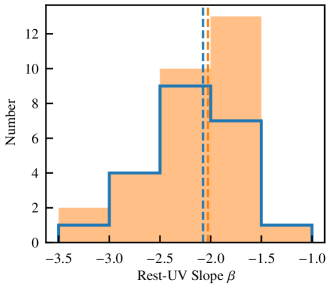
Within these same seven masks, we have also targeted 30 z6 galaxies satisfying the selection criteria from §2.1. The rest-UV apparent magnitudes444As discussed in §2.1.2, we use y and Y-band magnitudes to quote for z6 sources in COSMOS and XMM3, respectively. of these z6 targets range from = 24.3–26.4, very similar to that of the z7 targets (Fig. 1 top). The range of rest-UV slopes spanned by our z6 spectroscopic targets () is also very similar to that of the z7 targets (). Furthermore, the typical rest-UV slopes of each sample are almost exactly equal – the median of the z7 sample is 2.07 and that of the z6 sample is 2.09 (Fig. 1 bottom). For the z7 sources, we calculate rest-UV slopes using YJHKs, while for the z6 sources we use nb921yYJHKs and yYJHKs in COSMOS and XMM3, respectively.
2.2.2 Data Reduction
To design our Binospec multi-object slit masks, we used the BinoMask software. We adopted a slit width of 1.0″ and the 600 l/mm grating, yielding a resolving power of . Central wavelengths for each mask range from 8500–8720 Å (see Table 1) with the exact value chosen to optimize the red-end wavelength coverage of our z7 targets. For all z7 targets, the maximum wavelength coverage was 9635 Å meaning that our observations covered up to at least = 6.93. Furthermore, the typical wavelength coverage of our z7 targets was 0.75–1.00m ( = 5.17–7.23). For the z6 targets, our observations covered at least 7890–9510 Å and therefore (assuming they all lie at z5) fully encompassed the redshift range 5.75–6.50 set by our selection criteria (§2.1.2).
We adopted a slit length of at least 20″ (7″) for the z7 (z6) targets which we found leads to sufficient modeling of the sky background from 0.9–1m (0.8–0.9m). Each mask also included at least five stars off the primary field of views555Binospec’s field of view is composed of two separate 815 arcmin2 FoVs separated by a 3.2 arcminute gap. (FoVs) for guiding and monitoring seeing throughout the observations. In addition, we placed three stars within the primary FoVs to determine exposure weighting (see below) and absolute flux calibration.
Each individual exposure was reduced separately using the publicly available Binospec data reduction pipeline (Kansky et al., 2019). Exposures for each mask were then co-added using the weighting scheme from Kriek et al. (2015) which takes the height of the telluric-corrected 1D flux profile of bright stars on the mask as the relative weight. This accounts for both the average sky transmission and relative seeing in each exposure. The average seeing of each mask (calculated from the co-added spectra) is listed in Table 1 and ranges from 0.9–1.2″.
We extract 1D spectra using optimal extraction (Horne, 1986) after fitting a Gaussian666The FWHM of this Gaussian is not allowed to be less than the seeing. to the observed emission line profile along the spatial axis. As in E21, absolute flux calibration is determined by calculating the average scaling factor that matches the 1D spectra of the three stars placed on the mask to their mean PSF -band magnitudes from the Pan-STARRS survey (Chambers et al., 2016). Given the relatively narrow wavelength range covered by these observations (0.75-1m), we assume that this factor does not evolve with wavelength.
To estimate slit loss factors, we adopt the size-luminosity relation of bright z=6–7 galaxies found by Curtis-Lake et al. (2016) which assumes a Sérsic profile with (consistent with the approach of Ono et al. 2013). The modeled Sérsic profile of each source is convovled with a 2D Gaussian with FWHM equal to the seeing of the respective mask, and the fraction of flux within the 1″ Binospec slit is compared to that for a point source. The resulting relative slit loss correction factors range from 4–10% for all z6 and z7 targets, with brighter sources having larger corrections due to their larger assumed half-light radius. We note that our results are not significantly altered if we instead calculate slit loss correction factors assuming the size-luminosity relation from Bowler et al. (2017) which mainly yields larger sizes (and hence larger correction factors) for the brightest ( 25) sources.
We identify emission lines by first visually inspecting the 2D spectra of all sources. For emission features relatively clear of strong skylines, we calculate the flux in an aperture where the width along the wavelength axis is set by visual inspection of the 2D spectra with flux errors computed as described in E21. For these relatively clean emission features, we estimate that the fraction777This fraction is calculated by assuming a fixed line profile shape equivalent to that used in our completeness simulations (Gaussian with FWHM = 220 km s-1; §2.2.4) and fitting this profile to the 1D spectra of each detected source. of flux potentially obscured by strong skylines is small (15–20%) on average in both the z6 and z7 galaxies. We therefore conclude that our results on the evolution of the EW distribution between these two redshifts (§3.2) are not significantly impacted by this slight obscuration. Such small obscuration would furthermore only serve to slightly strengthen our conclusions888This is because the EW for detected sources (which almost always lie in the strong [OIII]+H emitter sub-sample; §3.1) would be pushed to higher values. on differences in the EW distribution for moderate versus strong [OIII]+H emitters at z7 (§3.1). Because the exact skyline obscuration fraction for a given source depends on the assumed line profile and accounting for it does not significantly alter our conclusions, we do not fold an obscuration correction for these relatively clean sources into our analysis.
For the few features that overlap more significantly with moderate-strength skylines, we adopt a slightly different approach to minimize the impact of skylines on the recovered flux (these sources are marked with asterisks in Tables 3 and 4). We fit the 1D spectra with a half-Gaussian (red-side only) convolved with the spectral resolution of our instrument (e.g. Hu et al., 2010) after masking portions of the spectrum contaminated by skylines. In this fitting procedure, we adopt a grid of three parameters describing the half-gaussian (amplitude, standard deviation, and central wavelength) and compute the value for each point in the grid. The likelihood for a given set of parameters is then calculated as which we convert to a probability distribution on the flux of the emission line. The flux and its uncertainty is then computed as the median value and standard deviation from this probability distribution. For all emission features, we subtract the continuum flux estimated from the photometry999For z7 sources with 6.9, we use the Y-band photometry to estimate the continuum. For those with 6.9, we use the J band because Y is partially contaminated by at these redshifts. For the z6 sources, we adopt the y and Y-band photometry for the continuum in COSMOS and XMM3, respectively. but compute the significance of the feature prior to this subtraction.
| Source ID | Flux | EW | |
|---|---|---|---|
| [10-18 erg/s/cm2] | [Å] | ||
| COS-469110 | 6.650 | 9.71.3 (7.8) | 14.55.0 |
| COS-940214∗ | 6.748 | 11.81.8 (7.1) | 43.114.7 |
| COS-1009842 | 6.761 | 12.30.8 (15.4) | 41.69.5 |
| COS-955126 | 6.813 | 8.20.9 (10.4) | 12.32.5 |
| COS-862541 | 6.850 | 15.31.9 (9.0) | 11.82.7 |
| XMM3-504799 | 6.883 | 5.10.9 (7.1) | 3.70.8 |
| COS-788571 | 6.884 | 16.31.1 (15.9) | 30.63.9 |
| COS-1205190 | 7.049 | 12.41.6 (8.1) | 28.86.0 |
| XMM3-227436 | 7.093 | 18.62.3 (8.9) | 15.03.2 |
2.2.3 Detected Emission Lines
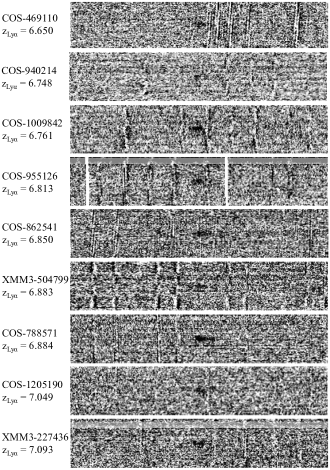
We detect confident (7) emission features in 9 of the 22 z7 galaxies in our sample (see Fig. 2). In all cases, we interpret these features as because all are fully consistent with such a solution given the expected redshift range of our sample and none are consistent with an [OII]3727,3729 solution (two narrow peaks of roughly similar strength separated by 6.8 Å in the observed frame). We consider [OII]3727,3729 as the primary alternative solution because it would be very difficult for anything but a Balmer break to mimic the strong nb921 and Z drops required by our selection criteria. We also find no other convincing features in the spectra of these sources (aside from the tentative features in COS-469110 consistent with NV emission; see below). The measured line fluxes and rest-frame EWs for sources with a detection are reported in Table 3. We also calculate the corresponding redshifts, , using the observed wavelength of peak flux in the 1D extraction and a rest-frame wavelength of 1215.67 Å. The detection for COS-862541 was previously reported in E21.
Our z7 detections span redshifts of = 6.650–7.093. Measured fluxes and EWs range from (5.1–18.6)10-18 erg/s/cm2 and 3.7–43.1 Å, respectively. None of the detections lie at 6.6, consistent with the strong nb921 and Z drops used in our selection. Furthermore, the large majority of detected targets lie at 6.6–6.9. While two of our sources (COS-1205190 and XMM3-227436) lie at z=7.05–7.09, these redshifts are still consistent with our selection given the moderate-strength emission for these sources (EW = 15–29 Å; see §2.1.1).
| Source ID | RA | Dec | y/Y | Flux | EW | ||
|---|---|---|---|---|---|---|---|
| [10-18 erg/s/cm2] | [Å] | ||||||
| XMM3-229059∗ | 02:26:22.67 | -05:05:31.13 | 24.31 | -2.290.19 | 5.824 | 27.64.8 (7.6) | 13.62.3 |
| COS-291078 | 10:00:41.08 | +01:47:18.54 | 25.73 | -1.950.39 | 5.863 | 10.91.3 (8.5) | 16.02.6 |
| COS-1131140 | 09:59:20.27 | +02:23:22.22 | 25.63 | -1.660.12 | 5.904 | 6.80.7 (11.1) | 11.41.8 |
| COS-1163498∗ | 09:59:18.45 | +02:24:53.93 | 26.21 | -1.810.30 | 5.909 | 10.21.3 (8.9) | 29.27.4 |
| COS-905289 | 09:59:44.62 | +02:13:29.21 | 25.79 | -1.940.80 | 5.915 | 6.90.8 (9.0) | 13.42.7 |
| COS-1181452 | 10:00:19.93 | +02:25:36.81 | 24.53 | -1.910.12 | 5.924 | 10.51.4 (8.9) | 6.40.9 |
| COS-881759 | 09:58:56.89 | +02:12:29.64 | 26.20 | -2.030.37 | 5.954 | 9.10.8 (11.3) | 26.16.0 |
| XMM3-569712∗ | 02:27:23.06 | -04:25:53.27 | 24.68 | -2.060.24 | 5.986 | 7.92.0 (7.1) | 5.51.0 |
| COS-282685 | 10:00:55.03 | +01:46:56.00 | 25.49 | -1.890.20 | 6.041 | 13.81.5 (10.3) | 20.83.0 |
| XMM3-198954 | 02:26:26.29 | -05:08:56.68 | 25.63 | -3.400.88 | 6.076 | 62.32.7 (23.4) | 10732 |
| COS-1260899 | 09:58:54.84 | +02:29:12.33 | 25.66 | -2.430.29 | 6.143 | 22.83.4 (7.0) | 40.78.1 |
| COS-631233∗ | 10:00:07.02 | +02:01:48.85 | 26.42 | -2.980.73 | 6.212 | 31.72.4 (13.2) | 11332 |
| COS-930465 | 09:58:48.31 | +02:14:33.66 | 25.68 | -2.570.52 | 6.303 | 9.90.7 (14.1) | 18.42.7 |
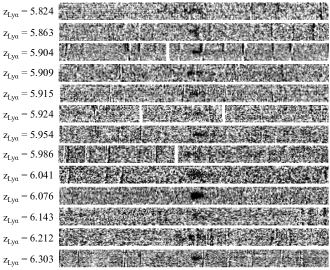
We also detect confident (7) emission features in 13 of our 30 z6 targets. In Table 4, we report the coordinates, rest-UV slopes, redshifts, fluxes, EWs, and y/Y-band magnitudes of each detected z6 source in COSMOS/XMM3. The 2D spectra of all z6 detections are shown in Fig. 3 and span redshifts of = 5.824–6.303, consistent with expectations given their selection criteria (§2.1.2). We measure fluxes ranging from (6.8–62.3)10-18 erg/s/cm2 and EWs ranging from 5.5–113 Å.
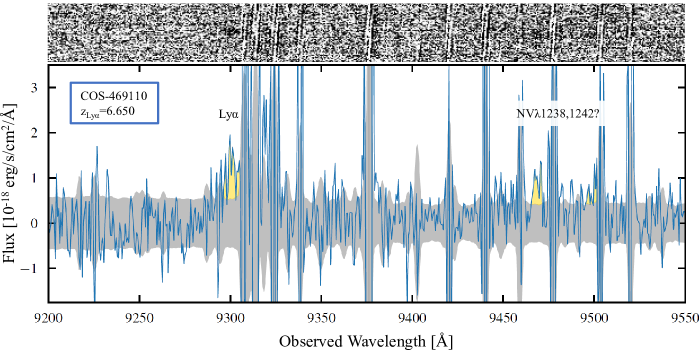
Motivated by recent detections in similarly luminous z7 galaxies (Tilvi et al. 2016; Laporte et al. 2017; Mainali et al. 2018; see also Hu et al. 2017), we search for NV1238.8,1242.8 emission in the spectra of our z7 emitters. Given the very high ionization potential of this line (77 eV), any such detection would likely signal significant AGN activity. As shown in Fig. 4, we tentatively identify the NV doublet in COS-469110 ( = 21.7) where the emission is located at the exact expected spatial position of the source. We regard both these features as tentative because each are detected at 7 significance, specifically 6.4 and 5.2 for the 1238.8 and 1242.8 Å components, respectively. However, we note that if we split our data into two distinct stacks101010We divide our data such that the total weight of all exposures in each stack is roughly equal., the NV1238.8 feature is significantly detected in each stack (5.2 and 3.8), adding evidence that this feature is likely real.
The NV1238.8 component is clearly distinct from strong skylines and has a measured flux of (5.41.0)10-18 erg/s/cm2 which, using the Y-band photometry for the continuum, corresponds to an EW of 8.43.0 Å. The flux of the NV1242.8 component is measured to be (3.80.8)10-18 erg/s/cm2 which corresponds to an EW of 5.92.2 Å. While the 1242.8 Å component does rest up against a skyline, the peak wavelengths of both components correspond to the exact same redshift of z=6.645 which is well consistent with the redshift of = 6.650 (we discuss the implied velocity offset below). Furthermore, the measured EWs of both components are consistent with that recently reported in three other similarly luminous z=7–9 galaxies (Tilvi et al., 2016; Laporte et al., 2017; Mainali et al., 2018) as well as a 1:1 to 2:1 flux ratio for the doublet (Bickel, 1969; Torres-Peimbert & Pena, 1984). However, we do note that calculating this flux ratio is complicated by the partial skyline masking of the 1242.8 Å component.
While we do not detect any significant NV features in any of our other z7 emitters, we are able to place 5 NV1238.8 EW limits111111Here, we report the 5 EW limit over the observed wavelength range corresponding to velocity offsets of 0–500 km s-1 similar to the approach of Mainali et al. (2018). of 10 Å in six of our other twelve z7 emitters, suggesting that the (tentative) NV emission from COS-469110 is likely exceptional among the bright z7 population. This is perhaps further supported by the fact that the total NV flux we measure implies a line flux ratio of = 0.950.19, much larger than typical upper limits recently placed on several other bright z6.5 emitters ( 0.2; Mainali et al. 2018; Shibuya et al. 2018). Because of the partial skyline obscuration of the the 1242.8 Å component, this flux ratio for COS-469110 is likely a lower limit.
The velocity offset implied for COS-469110 is 200 km s-1, assuming that NV well traces the systemic redshift (Laporte et al., 2017). This velocity offset falls well within the range previously reported for similarly luminous ( 21.5) galaxies at z6 (110–500 km s-1; Willott et al. 2015; Inoue et al. 2016; Pentericci et al. 2016; Laporte et al. 2017; Stark et al. 2017; Mainali et al. 2018; Matthee et al. 2020), though it does sit on the lower end of that range. This may help explain the exceptionally large NV to line flux ratio mentioned above as emission is more susceptible to strong scattering by the partially neutral IGM at lower velocity offsets (e.g. Miralda-Escudé, 1998; Mason et al., 2018b).
2.2.4 Completeness Simulations
When inferring the EW distribution in §3.2, we fold in constraints from non-detections. We do so by calculating the detection completeness of each non-detected source as a function of EW from EW = 0–100 Å in 1 Å steps. We insert 10,000 simulated 1D flux profiles for each value of EW into the fully reduced 1D spectrum of each source at its expected spatial position and determine what fraction of simulated features would be detected at 7. The observed wavelengths of these simulated features are randomly sampled using the redshift completeness distributions as a function of EW and rest-UV magnitude described in §2.1. In doing so, we account for the dependence of our redshift selection window on EW and for the impact of skyline obscuration. The profile of each simulated feature is a Gaussian with FWHM set to 220 km s-1, equal to the mean value measured from the two z7 features detected with very high significance (15) in our sample, namely COS-788571 (FWHM = 180 km s-1) and COS-1009842 (FWHM = 260 km s-1). This FWHM is also in excellent agreement with that found by Pentericci et al. (2018) using stacked spectra of fainter z7 galaxies.
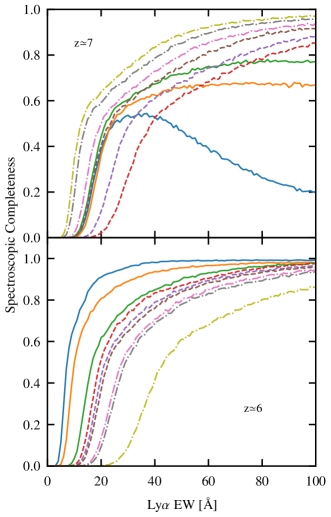
We plot the simulated spectroscopic completeness for a representative subset of the non-detected z7 (z6) galaxies in the top (bottom) panel of Fig. 5. The spectral constraints on most of these z6-7 targets yield 50% completeness at EW = 20 Å, increasing to 80% at EW = 60 Å. For a small subset of the non-detected z7 sources, the spectral completeness declines at high EW due to their lack of very red (9750 Å) spectral coverage which prohibits detecting at z7.0. Such a high-redshift solution is only likely for strong emitters given our selection criteria (§2.1.1). All of this information is folded into our analysis when inferring the EW distributions (§3).
| Source ID | Redshift | sSFR | [OIII]+H EW | ||||
|---|---|---|---|---|---|---|---|
| [] | [Gyr-1] | [Å] | [erg-1 Hz] | ||||
| COS-221419 | 6.70 | -21.0 | 8.4 | 0.01 | 6.3 | 690 | 25.52 |
| COS-235129 | 6.76 | -21.4 | 9.5 | 0.03 | 0.9 | 200 | 25.25 |
| COS-237729 | 6.83 | -21.1 | 8.8 | 0.05 | 5.1 | 650 | 25.60 |
| COS-301652 | 6.63 | -21.2 | 9.3 | 0.08 | 2.0 | 520 | 25.59 |
| COS-469110 | 6.650 | -21.7 | 8.8 | 0.04 | 5.3 | 730 | 25.58 |
| COS-505871 | 6.67 | -21.2 | 10.0 | 0.04 | 1.2 | 290 | 25.50 |
| COS-534584 | 6.60 | -21.9 | 9.2 | 0.12 | 5.7 | 790 | 25.50 |
| COS-788571 | 6.884 | -21.5 | 8.9 | 0.02 | 173.3 | 3680 | 25.91 |
| COS-851423 | 6.65 | -21.1 | 8.3 | 0.01 | 9.5 | 1030 | 25.63 |
| COS-854905 | 6.67 | -21.4 | 8.8 | 0.02 | 2.4 | 560 | 25.51 |
| COS-856875 | 6.68 | -21.2 | 8.6 | 0.01 | 3.1 | 540 | 25.48 |
| COS-862541 | 6.850 | -22.5 | 9.1 | 0.06 | 155.6 | 4160 | 25.89 |
| COS-940214 | 6.748 | -20.4 | 8.0 | 0.01 | 134.1 | 3210 | 25.87 |
| COS-955126 | 6.813 | -21.5 | 8.5 | 0.02 | 29.2 | 1620 | 25.73 |
| COS-1009842 | 6.761 | -20.6 | 8.3 | 0.03 | 10.4 | 910 | 25.65 |
| COS-1048848 | 6.69 | -20.7 | 8.4 | 0.01 | 2.1 | 310 | 25.35 |
| COS-1053257 | 6.68 | -22.0 | 8.5 | 0.04 | 5.0 | 630 | 25.75 |
| COS-1099982 | 6.68 | -21.6 | 8.6 | 0.01 | 72.7 | 2470 | 25.76 |
| COS-1205190 | 7.049 | -20.9 | 8.6 | 0.01 | 2.8 | 330 | 25.42 |
| COS-1235751 | 6.74 | -21.3 | 9.4 | 0.32 | 1.6 | 300 | 25.35 |
| XMM3-227436 | 7.093 | -22.3 | 9.0 | 0.04 | 6.6 | 930 | 25.84 |
| XMM3-504799 | 6.883 | -22.5 | 9.3 | 0.05 | 80.1 | 2310 | 26.22 |
2.3 Photoionization Modeling
We now infer the [OIII]+H EWs of each of our z7 targets to test whether we see a correlation with visibility. To infer the [OIII]+H emission strength (as well as other physical properties such as stellar mass), we use the BayEsian Analysis of GaLaxy sEds (beagle; Chevallard & Charlot 2016) SED fitting code. beagle computes both the stellar and nebular emission of star-forming galaxies by adopting the photoionization models from Gutkin et al. (2016), which are derived by incorporating the latest version of Bruzual & Charlot (2003) stellar population synthesis models into cloudy (Ferland et al., 2013). Our SED fitting procedure with beagle matches that described in E21. Briefly, we assume a delayed star formation history (SFR t e-t/τ) with an allowed recent (10 Myr) burst, a minimum age of 1 Myr, an sSFR ranging from 0.1 Gyr-1 to 1000 Gyr-1, and an SMC dust prescription.
We note that some of our spectroscopically confirmed sources lie at 6.85–6.9 (COS-788571, COS-862541, and XMM3-504799) where the transmission of [OIII]5007 through [3.6] (and hence the inferred [OIII]+H EW) is very sensitive to the exact systemic redshift, zsys. At z6, visible emission is often redshifted relative to systemic due to complex radiative transfer effects in the ISM, CGM, and IGM (see e.g. Dijkstra 2014 for a review). The current maximum observed velocity offset at z6 is 500 km s-1 (Willott et al., 2015) which translates to zsys = 0.013 at z=6.6–7.1 where we have z7 detections. Therefore, during the beagle fitting process, we allow zsys to range between 0.013 and for z7 sources with a detection.
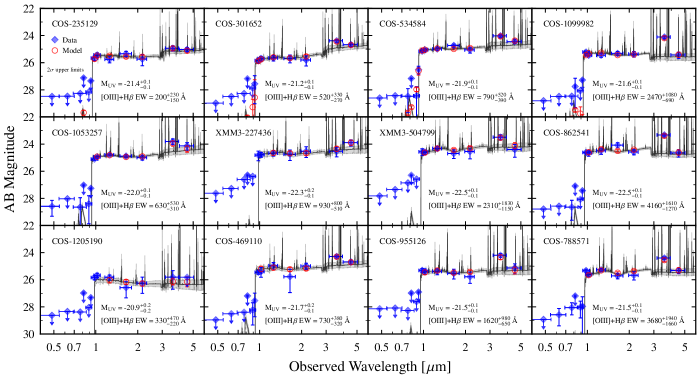
For sources with a detection, we furthermore exclude bands blueward of the break during the fitting process. We also do not fit to bands significantly impacted by emission for these sources as it is currently not possible to leave the effective transmission fraction through the IGM as a free parameter in beagle. This means we fit to all bands redder than and including Y for sources with 6.9 and all bands redder than including J for sources with 6.9. Sources without a detection are fit using all optical through mid-infrared photometry with a uniform redshift prior of z=6–8 and we remove emission from the nebular templates given the low (10%) fraction of strong emitters (EW25 Å) found among the bright z7 population in previous works (e.g. Ono et al., 2012; Schenker et al., 2014; Pentericci et al., 2018). We report the inferred [OIII]H EWs of each z7 source in Table 5, along with their inferred absolute UV magnitudes (at 1600 Å rest-frame), stellar masses, V-band optical depths, and sSFRs. In the final column, we report the inferred ionizing photon production efficiencies, , computed using the intrinsic UV luminosity (at 1500 Å rest-frame) of the stellar population before processing through dust and gas (see Chevallard et al. 2018 for details). We also quote photometric redshifts for sources without a detection and for sources with a detection in Table 5.
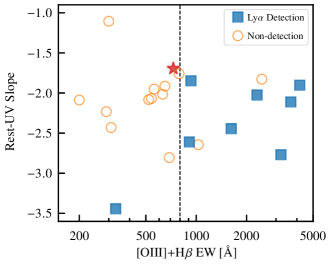
Overall, we find a diverse range of galaxy properties within our sample as illustrated in Fig. 6. In particular, the inferred [OIII]H EWs range from 200–4000 Å and the sSFRs span 1–150 Gyr-1. Galaxies with inferred [OIII]+H EW800 Å (and therefore similar to those in the RB16 sample) tend to possess very large sSFRs (30 Gyr-1), consistent with expectations of galaxies experiencing a recent strong upturn or burst in star formation activity (Atek et al. 2011; Amorín et al. 2015; Maseda et al. 2018; Tang et al. 2019; E21). As expected (Chevallard et al., 2018; Tang et al., 2019), we also find that tends to increase with [OIII]+H EW among our sample where sources with [OIII]+H EW800 Å are inferred to produce ionizing photons 2.2 as efficiently as those with weaker [OIII]+H. The median inferred [OIII]+H EW of all sources is 710 Å, suggesting that our sample is reasonably well representative of the global z7 galaxy population (typical EW = 692 Å; E21).
The absolute UV magnitudes of our z7 targets also span 22.5 20.4 which corresponds to a luminosity range of 0.8–5.8 L when adopting the z7 value121212As appropriate for our work, we are using the (double-power law) luminosity function parameters obtained when treating ground-based as a single galaxy. of 20.6 from Bowler et al. (2017). Our survey is therefore capturing a subset of the most luminous reionization-era galaxies. Furthermore, over half the galaxies in our z7 sample are 2 L, a population that has been largely missed by previous spectroscopy targeting this epoch. Considering the published literature of z7 observations from Fontana et al. (2010), Pentericci et al. (2011, 2014), Vanzella et al. (2011), and Schenker et al. (2012); Schenker et al. (2014), only 4 of 64 targeted galaxies were 2 L. The only previous spectroscopic z7 studies with a comparable luminosity range to our sample are Ono et al. (2012) and Furusawa et al. (2016). Even so, our sample is at least twice as large as either of these previous studies.
The bright UV luminosities of our z7 targets suggest that they are among the most massive galaxies present in the reionization era, given both clustering measurements (Barone-Nugent et al., 2014) as well as inferences of the - relation (Song et al., 2016a). Stellar masses derived from our SED fitting procedure suggest a similar picture. Most of our z7 galaxies are inferred to have 9–10, which is significantly more massive than fainter z7 galaxies identified over the GOODS fields (E21). Therefore, in what follows, we interchangeably use the terms ‘bright’ and ‘massive’ when describing our sample.
| Source ID | EW | [OIII]+H EW | |
|---|---|---|---|
| [Å] | [Å] | ||
| COS-221419 | 11.8 | 690 | 2.800.62 |
| COS-235129 | 7.6 | 200 | 2.090.47 |
| COS-237729 | 12.9 | 650 | 1.920.34 |
| COS-301652 | 9.8 | 520 | 2.080.09 |
| COS-469110 | 12.54.3 | 730 | 1.690.50 |
| COS-505871 | 11.5 | 290 | 2.230.62 |
| COS-534584 | 5.2 | 790 | 1.760.29 |
| COS-788571 | 30.63.9 | 3680 | 2.110.53 |
| COS-851423 | 7.5 | 1030 | 2.640.38 |
| COS-854905 | 6.4 | 560 | 1.950.24 |
| COS-856875 | 20.0 | 540 | 2.070.37 |
| COS-862541 | 11.82.7 | 4160 | 1.900.43 |
| COS-940214 | 43.114.7 | 3210 | 2.770.54 |
| COS-955126 | 12.32.5 | 1620 | 2.440.13 |
| COS-1009842 | 41.69.5 | 910 | 2.610.44 |
| COS-1048848 | 11.2 | 310 | 2.430.35 |
| COS-1053257 | 3.2 | 630 | 2.020.20 |
| COS-1099982 | 12.5 | 2470 | 1.830.08 |
| COS-1205190 | 28.86.0 | 330 | 3.441.03 |
| COS-1235751 | 17.4 | 300 | 1.100.30 |
| XMM3-227436 | 15.03.2 | 930 | 1.850.27 |
| XMM3-504799 | 3.70.8 | 2310 | 2.020.42 |
3 Analysis
In this section, we first investigate how detectability correlates with [OIII]+H emission (and hence sSFR) within our sample of 22 bright (LUV 1–6 L) z7 galaxies (§3.1). We then quantify evolution in the EW distribution of bright galaxies between z6–7 to test whether our results are consistent with accelerated reionization around massive z7 systems (§3.2). Finally, we investigate the spatial separations of our z7 emitters to identify any potentially large ionized bubbles within our observed fields (§3.3).
3.1 The Connection Between [OIII]H and Ly at z7
The number of detections among UV-continuum selected galaxies in the reionization era (z7) has grown rapidly over the past decade (e.g. Vanzella et al., 2011; Ono et al., 2012; Schenker et al., 2012; Shibuya et al., 2012; Finkelstein et al., 2013; Pentericci et al., 2014, 2018; Song et al., 2016b; Jung et al., 2017, 2018; Castellano et al., 2018; Larson et al., 2018; Hoag et al., 2019; Fuller et al., 2020; Tilvi et al., 2020). One of the most surprising results from these campaigns was the 100% detection rate among the four brightest (LUV = 3–4 L) z7 galaxies selected over the CANDELS fields (i.e. the RB16 sample). While this led some to suggest that massive reionization-era systems may trace accelerated sites of reionization (Zitrin et al., 2015; Stark et al., 2017), this interpretation was complicated by the fact that the RB16 galaxies were selected to not only be very massive, but also to possess strong [OIII]+H emission (EW800 Å). Such strong nebular emission signals the presence of intense radiation fields likely powered by a recent rapid upturn in star formation activity (i.e. high sSFR; Tang et al. 2019; E21). This therefore raises the possibility that the detections within the RB16 sample were not necessarily due to large ionized regions, but perhaps instead driven by physics internal to each of the four galaxies (Tang et al., 2019).
To better understand the origin of strong from the RB16 sample, we here analyse the constraints from our larger sample (N=22) of similarly massive (LUV 1–6 L) z7 galaxies possessing a wide range of inferred [OIII]+H EWs (200–4000 Å). This diversity of nebular emission strengths enables us to explore how the sSFRs of massive reionization-era galaxies impact their detectability. To this end, we divide our sample into galaxies with strong (EW800 Å) versus more moderate (EW = 200–800 Å) inferred [OIII]+H emission. By this classification, galaxies in the strong [OIII]+H emitter sub-sample will possess large sSFRs comparable to those in the RB16 sample while the moderate [OIII]+H emitters are more representative of the typical massive z7 population (E21). Here, we do not include COS-469110 in either sub-sample given its tentative NV detection (Fig. 4) which is a likely signpost of significant AGN activity. We do, however, discuss the potential implications of this unique source below.
An essential question for interpreting the RB16 result is whether our z7 targets with strong [OIII]+H emission show an increased detection rate. From our observations, we confidently (7) detect in seven of nine (78%) galaxies with strong [OIII]+H emission, yet in only one of twelve (8%) galaxies with more moderate [OIII]+H (see Fig. 7). Our results therefore suggest that is indeed more easily detectable from massive z7 galaxies possessing very large sSFRs (30 Gyr-1). We note that the two strong [OIII]+H emitters in our sample that went undetected may exhibit prominent emission that is masked by skylines. This possibility is accounted for in our analysis below.
Given this marked contrast in detection rate, we now seek to quantify the enhancement in EW among those with strong [OIII]+H relative to the more moderate population. To do so, we infer the EW distribution of each [OIII]+H emitter sub-sample utilizing a Bayesian approach that accounts for spectroscopic incompleteness of non-detected sources. Specifically, we assume that the EW distribution of each sub-sample follows a log-normal131313We adopt a log-normal EW distribution throughout our analysis because this function yields the best fit to our data when comparing to a Gaussian (e.g. Ouchi et al., 2008; Guaita et al., 2010) and exponentially declining (e.g. Jung et al., 2017; Mason et al., 2018a) function. None of our major conclusions are significantly altered if we adopt one of these other distributions instead. function (e.g. Schenker et al., 2014) parametrized by a median EW, , and standard deviation, . After generating a grid141414Here we ignore the third parameter, , in the parametrization by Schenker et al. (2014) used to quantify the fraction of sources with EW0. We find that this value is well consistent with unity when constraining the EW distribution using all 22 z7 sources in our sample (§3.2). spanning (/Å) = 0.0–2.0 Å and = 0.1–1.2 dex (both with a spacing of 0.01), we compute the probability for each set of parameters, , following the Bayesian approach of Boyett et al. (2020 in prep; see also E21):
| (1) |
Here, represents the index of each z7 source and, for sources with a detection, is a Gaussian distribution centred on the measured EW with its calculated uncertainties. For those without a detection, is the probability that a line with equivalent width EW would not have been detected. This is set equal to where is the spectroscopic completeness for source calculated using the simulations described in §2.2.4 (see also Fig. 5).
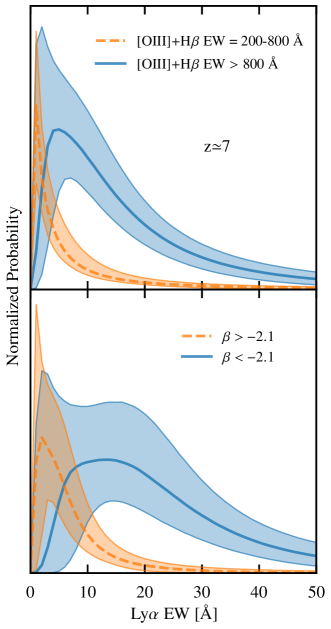
We find that massive z7 galaxies with strong [OIII]+H emission typically exhibit much stronger (4.7 higher EW) relative to more moderate [OIII]+H emitters when comparing the best-fitting values for each sub-sample (see top panel of Fig. 8). Therefore, while uncertainties remain significant151515The median and inner 68% confidence interval of this ratio on median EWs from the marginalized of each sub-sample is 3.8. These uncertainties are largely due to our current sample size and non-detections in most moderate [OIII]+H emitters., our results suggest that galaxy sSFRs play a significant role in regulating emission from massive reionization-era galaxies. The recent results of Castellano et al. (2017) provide additional empirical support of this picture. In their study, they find that the stacked IRAC colours of z6.8 emitters selected over the CANDELS fields indicate much stronger [OIII]+H emission relative to galaxies that went undetected in . This is consistent with our results using [OIII]+H EWs inferred for individual (and generally more massive) galaxies.
Interestingly, two sources in our sample, COS-469100 and COS-1205190, both show fairly strong (EW=15–29 Å), yet possess only moderate [OIII]+H emission (EW=200-800 Å). It is therefore of interest to explore whether there are other reasons to believe that these two sources may still possess unusually powerful radiation fields as expected in very large sSFR systems. Indeed, the tentative NV detection within COS-469110 (see Fig. 4) signals that this source likely harbors an AGN. We also find reason to believe that COS-1205190 may be powering an intense radiation field given its extremely blue rest-UV slope of = 3.441.03. Such a blue slope (the bluest in our sample; Table 6) is consistent with not only extremely low dust content, but also very low metallicity. This possible dearth of metals in COS-1205190 would naturally lead to relatively weak [OIII] emission161616While H EW does increase with decreasing metallicity, it only reaches 300 Å at 0.01 even in extremely rapidly star-forming systems (sSFR 100 Gyr-1) according to the Gutkin et al. (2016) templates used in beagle. even if it recently experienced a burst of star formation activity (sSFR 30 Gyr-1) as typically inferred for the strong [OIII]+H emitters in our sample. If our above suspicions of COS-469100 and COS-1205190 are correct, all nine of our z7 detections are from sources with intense radiation fields and we would infer that such systems typically exhibit substantially stronger (5.9 higher EW) relative to the more typical massive z7 population which has moderate [OIII]+H (EW = 200–800 Å), moderately-low metallicity (0.2 ; E21), and emission dominated by star formation.
The strong emission (EW = 29 Å) from our bluest source (COS-1205190) also motivates an investigation into how the observed EW is related to the rest-UV slope among massive z7 galaxies. While it has been shown that becomes stronger in z4 galaxies from to (Stark et al., 2010), it is not necessarily clear that such a prominent trend would continue to exist when the bulk of the galaxy population is very blue () as is the case at z7 (Bouwens et al., 2014). To test for any such association, we split our sample (again ignoring COS-469110) into sources with and , where we adopt a dividing point equal to the approximate median rest-UV slope of the entire sample (). Following the Bayesian approach used for the [OIII]+H vs. analysis above, we find that our bluest galaxies () typically exhibit much stronger (4.0 higher EW) relative to those more representative of the massive z7 population (; E21) as illustrated in the bottom panel of Fig. 8. This trend likely reflects lower dust content (and therefore relatively little attenuation) within bluer sources as is the case at lower redshifts (e.g. Shapley et al., 2003; Pentericci et al., 2009; Kornei et al., 2010; Stark et al., 2010; Hathi et al., 2016; Trainor et al., 2016). Notably, our z7 galaxies also follow a similar behavior to the z6 sources presented in De Barros et al. (2017) where our strongest emitters (EW25 Å) all possess very blue rest-UV slopes (; see Table 6) likely signaling particularly low dust content along the line of sight.
The overall picture emerging from these results is that the observed EW is substantially enhanced by a recent strong burst of star formation (or presence of an AGN) among massive reionization-era galaxies. Low dust content along the line of sight will further enhance visible similar to trends at lower redshifts. While we defer a more detailed physical interpretation until §4, we emphasize that our results demonstrate that can be detected with high success rate in massive z7 galaxies possessing strong [OIII]+H emission (800 Å EW) and very blue rest-UV slopes ().
3.2 Evolution in the EW Distribution of Massive Galaxies from z6 to z7
Over the past decade, a variety of observational campaigns have presented evidence that the IGM rapidly transitions from highly ionized at z6 ( 10%; e.g. McGreer et al. 2015) to substantially neutral at z7 ( 50%, e.g. Greig & Mesinger 2017; Zheng et al. 2017; Davies et al. 2018; Wang et al. 2020; Whitler et al. 2020). Such a rapid transition is naturally expected to reduce transmission between z6–7 for the typical galaxy population. This is perhaps evidenced by the factor of 10 decline in the strong (EW25 Å) emitter fraction among the low-mass lensed population (0.1 L; Hoag et al. 2019; Fuller et al. 2020). One of the primary goals of our spectroscopic campaign is to build a sufficiently large sample of very bright z6–7 galaxies to explicitly test whether transmission from massive systems is evolving at a slower pace, as would be expected if they commonly reside in large ionized bubbles (e.g. Wyithe & Loeb, 2005; McQuinn et al., 2007; Weinberger et al., 2018). While this campaign is still ongoing, we here report our current constraints on the EW distribution evolution between z6–7 using our sample of 30 and 22 massive (LUV 1–6 L) galaxies at z6 and z7, respectively.
At each redshift, we infer the EW distribution following the Bayesian approach presented in §3.1 where we assume a log-normal function parametrized by a median EW, , and standard deviation, . Here we also add a third parameter, , quantifying the fraction of sources with EW0 Å because some galaxies may not show any in emission (e.g. Schenker et al., 2014; Mason et al., 2018a). Using the same grid for and as in §3.1 and allowing to vary between 0–1 (with a spacing of 0.01), we calculate the probability for each set of parameters as in Eq. 1.
| [Å] | [dex] | ||
|---|---|---|---|
| z6 | 12.0 | 0.31 | 0.89 |
| z7 | 11.0 | 0.37 | 0.88 |
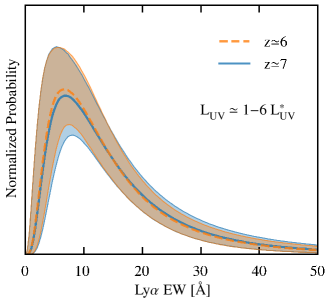
The EW distribution of our 22 massive z7 galaxies is well characterized by a log-normal distribution with a median EW = 11.0 Å and standard deviation = 0.37 dex. The fraction of EW0 Å sources is found to be very high ( = 0.88) with a best-fitting value of , suggesting that a large majority of massive z7 galaxies show in emission. This EW distribution further implies that approximately 15% of our z7 galaxies exhibit strong (EW25 Å) , in agreement with previous studies quantifying this emitter fraction among the bright ( 20.25) population (e.g. Ono et al., 2012; Pentericci et al., 2018; Schenker et al., 2014). Interestingly, the EW distribution inferred from our 30 massive z6 galaxies is remarkably similar to that at z7 with all three parameters agreeing well within 1 uncertainties (see Table 7).
Our results therefore appear to suggest that the EW distribution (and hence transmission) is evolving less rapidly for the massive population relative to low-mass galaxies (Hoag et al., 2019; Fuller et al., 2020). To provide a more direct comparison, we now quantify the confidence to which our data rule out a strong (factor of 2) decline in transmission between z6–7. We do so by assuming that massive galaxies have the same EW distribution at z6 and z7, with the exception that the EWs at z7 are multiplied by a factor which will describe evolution in transmission171717This is similar to the ‘smooth’ evolution approach of previous works (e.g. Treu et al., 2012; Pentericci et al., 2014).. Adopting a log-normal EW distribution, the probability for a given set of parameters, is then calculated in a manner similar to Eq. 1:
| (2) |
Here, and are the indices of the z6 and z7 sources, respectively. We adopt the same grid of , , and as above, as well as a grid in spanning 0–3 with a spacing of 0.01. Doing so, we infer = 1.04 which is consistent with unity as expected given the similarity of the EW distributions at z6 and z7 (Fig. 9).
Our goal is to quantify evolution in the transmission of for massive galaxies between z6–7. While the value of inferred above does account for evolution in transmission, it also includes any evolution in the physical conditions that may be impacting production and escape within galaxies. Fortunately, we can take the first steps towards decoupling these internal factors using the insight gained from our analysis in §3.1. Therein, we found that the observed EW in massive z7 galaxies correlates with rest-UV slope and [OIII]+H EW. As detailed in §2.2, the typical rest-UV slopes of our z6 () and z7 () samples are essentially equal. Given this, we assume that the dust content of our two samples are similar enough to not cause a significant evolution in the EW distribution. As discussed further in §4, the trend between [OIII]+H EW and EW seen in our sample is likely driven by the relationship between [OIII]+H EW and the stellar ionizing photon production efficiency, (Chevallard et al., 2018; Tang et al., 2019). Our SED fits with beagle suggests that the typical ionizing photon production efficiencies of our z6 ( = 25.62) and z7 ( = 25.59) samples are also similar enough to not significantly impact the evolution of the EW distribution. We therefore assume that our inferred value of is dominated by the evolution in transmission.
Equipped with this knowledge, we find that our spectroscopic data rule out a strong decline in transmission ( / ) with 98.5% (2) confidence. This is in contrast to the ten-fold decrease in strong emitters among low-mass lensed galaxies over the same redshift interval (Hoag et al., 2019; Fuller et al., 2020). Therefore, while uncertainties are significant given our modest sample size, our results currently suggest that transmission is evolving less rapidly between z6–7 for the massive population.
There are a number of possible explanations for this difference in transmission evolution as we enter the epoch of reionization. One is that massive z7 galaxies may tend to possess larger velocity offsets, helping push the photons into the damping wing before escaping the host galaxy (Mason et al., 2018b). This may be expected given the positive correlation between velocity offset and rest-UV luminosity at z2–3 (Erb et al., 2014), likely reflecting (in part) the ability of more massive galaxies to drive stronger outflows. Another explanation is that massive z7 galaxies are more likely to reside in large ionized bubbles (Furlanetto et al., 2004; Wyithe & Loeb, 2005; Lee et al., 2007; McQuinn et al., 2007; Weinberger et al., 2018) which enable photons to cosmologically redshift far into the damping wing and thus transmit more easily through a partially neutral IGM.
3.3 A Possible Large Ionized Region at z7
As discussed in §3.2, our results are consistent with a scenario wherein massive z7 systems often reside in large ionized regions. In this same picture, we might expect to find some of our z7 emitters nearby one another if they reside in the same bubble. Interestingly, we do indeed find an instance where three of our massive z7 emitters possess very similar redshifts (z 0.05) and are also closely separated in angular space (5 arcmin).
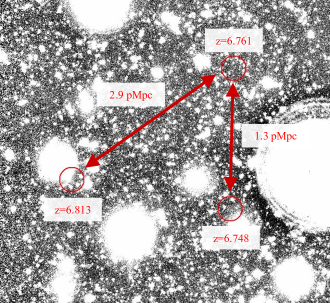
Our spectroscopic results indicate that COS-940214 ( = 6.748), COS-1009842 ( = 6.761), and COS-995126 ( = 6.813) all lie within a spherical volume with radius physical Mpc (Fig. 10), consistent with the expected sizes of HII regions at z=7 (e.g. Furlanetto et al., 2004; Mesinger & Furlanetto, 2007; Lin et al., 2016). These three sources have luminosities ranging from 0.8–2.3 L and therefore are likely among the most massive galaxies present at z7. All three are also inferred to be actively forming stars with SFRs of 7–28 yr-1 using the SED fitting procedure described in §2.3. Their very blue IRAC colours ([3.6][4.5] 0.6) further suggest large sSFRs ranging from approximately 10–130 Gyr-1 (see Table 5). Because the typical sSFR at z7 is 5 Gyr-1 (E21), these three galaxies are likely undergoing a burst of star formation.
It is of interest to estimate whether these three z7 emitters could individually power ionized bubbles large enough to cover the separation between them. To estimate the plausible sizes of such bubbles, we assume that the dominant ionizing output from these three galaxies has been over the past 10 Myr as evidenced by their large sSFRs. Because the recombination time-scale at z7 is much longer (of order the Hubble time181818This is assuming a clumping factor of C3 at z=7 (e.g. Finlator et al., 2012; Shull et al., 2012; Pawlik et al., 2015). More recent, higher resolution simulations find that the clumping factor is temporarily increased to C10–20 shortly (3–10 Myr) after a region becomes reionized (Park et al., 2016; D’Aloisio et al., 2020). Adopting such a higher value would yield smaller estimated bubble sizes, still insufficient to cover the observed separation between the three galaxies.), we can approximate the radius of an individual ionized region as (Cen & Haiman, 2000):
| (3) |
Here, Myr, is the average hydrogen density at the redshift of each source, is the escape fraction of ionizing photons, and is the rate at which ionizing photons are produced by stars in the galaxy. We take from the beagle SED fits to each galaxy and assume an escape fraction of = 20% (e.g. Robertson et al., 2013). Our estimated bubble sizes are not significantly altered if we instead use the relation from Tang et al. (2019) to obtain from the inferred [OIII]H EWs.
We estimate that the three aforementioned sources could individually power bubbles of sizes = 0.29–0.41 physical Mpc, consistent with other estimates recently reported at z7–8 (Castellano et al., 2018; Tilvi et al., 2020). The largest region ( = 0.41 Mpc) is estimated to come from COS-955126 given that it is inferred to produce more than twice as many ionizing photons as the other two sources, mainly due to its much higher luminosity. COS-940214 and COS-1009842 have very similar estimated bubble sizes ( = 0.30 and 0.29 Mpc, respectively) due to the similarity in their inferred . Notably, these estimated bubble sizes ( 0.3 Mpc) are much smaller than the observed separation between the three galaxies ( = 1.7 Mpc).
One way in which a larger bubble may have grown around these sources is through the impact of a local overdensity (e.g. Furlanetto et al., 2004; Wyithe & Loeb, 2005; Lee et al., 2007; McQuinn et al., 2007). Such a scenario may already be hinted at by the proximity of these L galaxies. Using the z7 luminosity function from Bowler et al. (2017), we would expect only N=0.7 bright (0.8 L) galaxies on average within a 1.7 Mpc radius sphere. Because we know there are at least three such galaxies within this volume, our data suggest this region is likely a factor of 4 overdense. Further evidence of an overdensity comes from investigating the surface density of photometrically-selected z7 galaxies over this region. In an 60 arcmin2 rectangular area encompassing the three emitters, we identify a total of nine galaxies satisfying our z7 selection criteria (§2.1), a factor of 6 above that expected on average191919This 60 arcmin2 rectangular area is entirely contained within an UltraVISTA ultra-deep stripe. We identify 67 z7 galaxies across all the ultra-deep stripes (0.73 deg2 total) translating to an average surface density of 0.0255 arcmin-2 (not corrected for completeness). in the same area (N=1.5). Future observations will enable us to better quantify the spectroscopic overdensity within this region.
4 Discussion
Numerous observational studies over the past decade have demonstrated a low (10–20%) detection rate among typical (L) z7 galaxies (e.g. Ono et al., 2012; Treu et al., 2013; Pentericci et al., 2014, 2018; Schenker et al., 2014; Tilvi et al., 2014). It was therefore a surprise when was detected in all four of the brightest (3–4 L) z7 galaxies selected over the CANDELS fields (i.e. the RB16 sample), particularly given that the IGM is thought to be highly neutral at these epochs (40%; e.g. Davies et al. 2018; Planck Collaboration et al. 2020; Wang et al. 2020; Whitler et al. 2020). The unusual detectability of these sources hence suggested that their photons may be less sensitive to strong scattering by the IGM, as would be expected if these objects reside in large, highly ionized bubbles (e.g. Zitrin et al., 2015; Weinberger et al., 2018). However, it has been proposed that intense radiation fields may also be driving their enhanced detectability given that all four RB16 galaxies are inferred to possess strong [OIII]+H emission (EW 800 Å; Stark et al. 2017). In this section, we use our observations of a larger population (N=22) of similarly bright (LUV 1–6 L) z7 galaxies with Spitzer/IRAC constraints on [OIII]+H EWs to better understand the origin of strong within the RB16 sample.
We find that the detectability of depends strongly on the [OIII]+H EW at z7. We detect in 78% (7/9) of bright z7 galaxies possessing strong [OIII]+H (EW 800 Å) as opposed to only 8% (1/12) of galaxies with more moderate [OIII]+H (EW = 200-800 Å; §3.1). The much (4.7) higher EWs of the strong [OIII]+H population likely reflects, in part, a larger ionizing photon production efficiency associated with young stellar populations (Chevallard et al., 2018; Tang et al., 2019). The high sSFRs (30 Gyr-1) of these galaxies may also help drive low HI column density channels through the ISM/CGM (e.g. Clarke & Oey, 2002; Ma et al., 2020) through which photons can efficiently escape (Jaskot et al., 2019; Gazagnes et al., 2020).
While we have shown that efficient ionizing photon production significantly boosted the detectability of the RB16 sample, our results also suggest that the IGM ionization may have played a significant role in enhancing their visibility as well. In particular, we find no evidence of strong evolution in the EW distribution of bright (LUV 1–6 L) galaxies between z6–7 (§3.2). This result stands in contrast to the rapid downturn in the fraction of strong emitters (25 Å EW) among low-mass (0.1 L) lensed galaxies between z6–7 (Hoag et al., 2019; Fuller et al., 2020), suggesting that Ly in the bright population may evolve more slowly. Such findings are consistent with theoretical expectation that the brightest (and hence the most massive; e.g. Barone-Nugent et al. 2014) z7 galaxies trace overdensities that are the first to create large, highly-ionized bubbles (e.g. Furlanetto et al., 2004; Wyithe & Loeb, 2005; Lee et al., 2007; McQuinn et al., 2007; Weinberger et al., 2018).
If massive z7 galaxies do trace overdense regions, we may expect to find emitting galaxies in our sample nearby one another within the same ionized structure. Indeed, our results revealed three z7 emitters separated by relatively small angular distances (5 arcmin) and with similar redshifts (§3.3). The corresponding spatial separation of these emitters ( = 1.7 physical Mpc) is consistent with the expected sizes of HII regions at z7 (Furlanetto et al., 2004; Mesinger & Furlanetto, 2007; Lin et al., 2016), suggesting that they may lie within the same large, highly-ionized bubble. None the less, with our present data, it is not yet possible to characterize the extent of the ionized regions surrounding these z7 emitters. There are two distinct possibilities consistent with our current data. On one hand, these massive z7 galaxies may be tracing a large ionized region, with a size comparable to their spatial separation ( 2 Mpc). This would be expected if the galaxies trace a strongly-overdense structure with larger-than-average ionizing photon output. In this case, we would expect to see enhanced Ly from all systems within the ionized region. However it is also possible that these systems are situated within distinct, moderate-sized ( 0.3 Mpc) bubbles in which they are the dominant contributors of ionizing photons. The smaller bubbles would lead to larger damping wing attenuation of from the IGM. But the corresponding reduction in the Ly flux is countered by efficient production of nebular emission, as signaled by the large EW [OIII]+H emission (and hence high sSFRs). The transmission could be further boosted if these massive systems have large velocity offsets (e.g. Erb et al., 2014; Stark et al., 2017; Mason et al., 2018b), redshifting the line further into the damping wing before it encounters hydrogen.
Which of these two pictures is true depends largely on whether the nearby Ly emitting galaxies we have identified trace a strong overdensity in galaxies. In §3.3, we presented evidence that this may indeed be the case. The number density of spectroscopically confirmed 0.8 L systems in this region (N=3) is 4 times the average (N=0.7) expected from z7 luminosity functions (e.g., Bowler et al. 2017). Furthermore, the surface density of photometrically-selected z7 galaxies surrounding the nearby emitters is 6 the average. This suggests that an overdense population of neighboring galaxies may potentially help power a large ionized region.
These results add to two similar instances of grouped emitting galaxies that have been reported at z=7.0–7.7 (Vanzella et al., 2011; Castellano et al., 2018; Tilvi et al., 2020). Both these previously identified regions contain at least one bright (L) galaxy. Furthermore, one of these regions (the BDF) shows evidence of a host overdensity similar to that in our sample (Castellano et al., 2016). Interestingly, deep spectroscopic follow-up of relatively faint (0.7 L) z7 systems identified photometrically in the BDF revealed no detections (Castellano et al., 2018). As stated therein, this may suggest that many of the fainter systems reside outside the ionized region, though it is also possible that is preferentially seen in the brightest systems because of their larger velocity offsets. Ultimately, future spectroscopy of fainter sources (with known spatial positions via e.g. JWST rest-optical line detections) will be able to discern whether the EW distribution in the vicinity of these massive emitters is enhanced towards larger values as would be expected if they reside in large bubbles.
5 Summary
We present the first results from a new spectroscopic MMT/Binospec program aimed at targeting in a large sample of bright (LUV 1–6 L) z7 galaxies selected over very wide-area fields (3 deg2 total). We use these results to investigate to what extent strong [OIII]+H emission (and hence large sSFRs) boost detectability from bright reionization-era galaxies. We secondly test whether the decline in the visibility of Ly emission is less rapid for massive galaxies, as might be expected if they trace strong overdensities that are situated in large ionized bubbles. Our conclusions are as follows:
-
1.
From our 22 targeted bright z7 galaxies, we confidently (7) detect from nine sources. The redshifts of our z7 emitters range from =6.650–7.093, consistent with expectations given our photometric selection criteria. We measure fluxes ranging from (5.1–18.6)10-18 erg/s/cm2 and rest-frame EWs spanning 3.7–43.1 Å. For sources lacking a confident detection, the data typically place a (7) EW limit of 10 Å in skyline-free regions of the spectra.
-
2.
We find that the detectability of depends strongly on [OIII]+H EW among luminous z7 galaxies. We confidently detect in 78% (7/9) of sources with strong [OIII]+H emission (EW 800 Å) as opposed to only 8% (1/12) of sources with more moderate [OIII]+H (EW = 200-800 Å). The much (4.7) higher EWs of the strong [OIII]+H population likely reflect a larger ionizing photon production efficiency (and hence likely also a larger L/L) owing to extremely young, hot stars formed in a recent rapid upturn or burst in star formation activity (Chevallard et al., 2018; Tang et al., 2019). The high sSFRs (30 Gyr-1) of such galaxies may also help create low HI column density channels through the ISM/CGM (e.g. Clarke & Oey, 2002; Ma et al., 2020) through which photons can efficiently escape (e.g. Jaskot et al., 2019; Gazagnes et al., 2020). Given the large variations in detectability within our data, it will be necessary to ensure that future samples be well matched in sSFR across cosmic time to well infer the evolution of the IGM neutral state.
-
3.
We tentatively detect the nebular NV1238.8,1242.8 doublet, a signpost of significant AGN activity, in one of our z7 emitters. This is the fifth tentative detection of NV so far reported in a z7 emitter (Tilvi et al., 2016; Hu et al., 2017; Laporte et al., 2017; Mainali et al., 2018) suggesting that low-luminosity AGN are present in a subset of the most massive reionization-era galaxies. Further investigation of this population will ultimately help clarify the contribution of such AGN to cosmic reionization (Madau & Haardt, 2015; Giallongo et al., 2019; Grazian et al., 2020).
-
4.
We find no evidence for strong evolution in the transmission of emission for the massive (1–6 L) population between z6–7 ( = 1.04). This is in contrast to observations of low-mass (0.1 L) lensed galaxies which suggest a factor of 10 decline in transmission (Hoag et al., 2019; Fuller et al., 2020). With our current sample size, we can rule out a factor of 2 decline in transmission with 98.5% (2) confidence among massive galaxies. We discuss a number of possible explanations for these findings, including the expectation that massive z7 galaxies often reside within large, highly-ionized bubbles (e.g. Furlanetto et al., 2004; McQuinn et al., 2007; Weinberger et al., 2018).
-
5.
We find three emitters in our z7 sample separated by relatively small angular distances (5 arcmin) and with nearly identical redshifts (z 0.05). These small angular separations may be a signpost of an ionized bubble enhancing transmission. Indeed, the spatial separations of these emitters ( = 1.7 physical Mpc) are consistent with the expected sizes of HII regions at z7 (e.g. Furlanetto et al., 2004; Mesinger & Furlanetto, 2007; Lin et al., 2016). With our present data, we cannot yet characterize the full extent of the ionized regions surrounding these closely-separated emitters. However, we estimate that the these emitters are individually capable of powering ionized bubbles with radii of R0.3 Mpc, consistent with other estimates recently reported at z7–8 (Castellano et al., 2018; Tilvi et al., 2020). Future work targeting fainter galaxies in the region should be able to determine if the ionized region extends beyond these radii.
-
6.
We find tentative evidence of an overdensity surrounding these closely-separated emitters. The number density of spectroscopically confirmed 0.8 L systems in these regions (N=3) is 4 times the average (N=0.7) expected from z7 luminosity functions. Furthermore, the surface density of photometrically-selected z7 galaxies surrounding the nearby emitters is 6 the average. Such an overdensity may help facilitate the growth of a large (R2 physical Mpc) bubble around these sources.
As a next step towards understanding emission from massive reionziation-era galaxies, in future work we will combine this Binospec dataset with recent results from a Cycle 7 ALMA Large Program, the Reionization Era Bright Emission Line Survey (REBELS; 2019.1.01634.L). REBELS has begun providing systemic redshifts via the [CII]158m emission line as well as constraints on far-infrared dust continuum emission for a number of our z7 targets. With this more complete rest-UV through far-infrared view, we will begin to better characterize the velocity offsets of massive z7 galaxies as well as understand how their observed [CII] and dust continuum emission relates to .
Acknowledgements
RE and DPS acknowledge funding from JWST/NIRCam contract to the University of Arizona, NAS5-02015. JC and SC acknowledge financial support from the European Research Council (ERC) via an Advanced Grant under grant agreement no. 321323 – NEOGAL. RJB and MS acknowledge support from the Nederlandse Organisatie voor Wetenschappelijk Onderzoek via TOP grant TOP1.16.057. BER was supported in part by NASA program HST-GO-14747, contract NNG16PJ25C, and grant 80NSSC18K0563, and NSF award 1828315. Observations reported here were obtained at the MMT Observatory, a joint facility of the University of Arizona and the Smithsonian Institution.
This research has benefited from the SpeX Prism Library (and/or SpeX Prism Library Analysis Toolkit), maintained by Adam Burgasser at http://www.browndwarfs.org/spexprism. This research also made use of astropy, a community-developed core python package for Astronomy (Astropy Collaboration et al., 2013; Price-Whelan et al., 2018); matplotlib (Hunter, 2007); numpy (Van Der Walt et al., 2011); and scipy (Jones et al., 2001).
Data Availability
The optical through mid-infrared imaging data underlying this article are available through their respective data repositories. See https://hsc-release.mtk.nao.ac.jp/doc/ for HSC data, http://www.eso.org/rm/publicAccess#/dataReleases for UltraVISTA and VIDEO data, and https://sha.ipac.caltech.edu/applications/Spitzer/SHA/ for IRAC data. The MMT/Binospec data will be shared upon reasonable request to the corresponding author.
References
- Aihara et al. (2018) Aihara H., et al., 2018, PASJ, 70, S4
- Aihara et al. (2019) Aihara H., et al., 2019, PASJ, 71, 114
- Amorín et al. (2015) Amorín R., et al., 2015, A&A, 578, A105
- Ashby et al. (2013) Ashby M. L. N., et al., 2013, The Astrophysical Journal, 769, 80
- Ashby et al. (2015) Ashby M. L. N., et al., 2015, The Astrophysical Journal Supplement Series, 218, 33
- Ashby et al. (2018) Ashby M. L. N., et al., 2018, The Astrophysical Journal Supplement Series, 237, 39
- Astropy Collaboration et al. (2013) Astropy Collaboration et al., 2013, A&A, 558, A33
- Atek et al. (2011) Atek H., et al., 2011, ApJ, 743, 121
- Atek et al. (2015) Atek H., et al., 2015, ApJ, 814, 69
- Bañados et al. (2018) Bañados E., et al., 2018, Nature, 553, 473
- Barone-Nugent et al. (2014) Barone-Nugent R. L., et al., 2014, ApJ, 793, 17
- Becker et al. (2015) Becker G. D., Bolton J. S., Madau P., Pettini M., Ryan-Weber E. V., Venemans B. P., 2015, MNRAS, 447, 3402
- Bertin & Arnouts (1996) Bertin E., Arnouts S., 1996, A&AS, 117, 393
- Bickel (1969) Bickel W., 1969, J. Quant. Spectrosc. Radiative Transfer, 9, 1145
- Bouwens et al. (2014) Bouwens R. J., et al., 2014, ApJ, 793, 115
- Bouwens et al. (2015a) Bouwens R. J., et al., 2015a, ApJ, 803, 34
- Bouwens et al. (2015b) Bouwens R. J., Illingworth G. D., Oesch P. A., Caruana J., Holwerda B., Smit R., Wilkins S., 2015b, ApJ, 811, 140
- Bouwens et al. (2019) Bouwens R. J., Stefanon M., Oesch P. A., Illingworth G. D., Nanayakkara T., Roberts-Borsani G., Labbé I., Smit R., 2019, ApJ, 880, 25
- Bowler et al. (2014) Bowler R. A. A., et al., 2014, MNRAS, 440, 2810
- Bowler et al. (2017) Bowler R. A. A., Dunlop J. S., McLure R. J., McLeod D. J., 2017, MNRAS, 466, 3612
- Bowler et al. (2020) Bowler R. A. A., Jarvis M. J., Dunlop J. S., McLure R. J., McLeod D. J., Adams N. J., Milvang-Jensen B., McCracken H. J., 2020, MNRAS, 493, 2059
- Bruzual & Charlot (2003) Bruzual G., Charlot S., 2003, MNRAS, 344, 1000
- Burgasser (2014) Burgasser A. J., 2014, in Astronomical Society of India Conference Series. (arXiv:1406.4887)
- Caruana et al. (2014) Caruana J., Bunker A. J., Wilkins S. M., Stanway E. R., Lorenzoni S., Jarvis M. J., Ebert H., 2014, MNRAS, 443, 2831
- Castellano et al. (2016) Castellano M., et al., 2016, ApJ, 818, L3
- Castellano et al. (2017) Castellano M., et al., 2017, ApJ, 839, 73
- Castellano et al. (2018) Castellano M., et al., 2018, ApJ, 863, L3
- Cen & Haiman (2000) Cen R., Haiman Z., 2000, ApJ, 542, L75
- Chambers et al. (2016) Chambers K. C., et al., 2016, arXiv e-prints, p. arXiv:1612.05560
- Chevallard & Charlot (2016) Chevallard J., Charlot S., 2016, MNRAS, 462, 1415
- Chevallard et al. (2018) Chevallard J., et al., 2018, MNRAS, 479, 3264
- Clarke & Oey (2002) Clarke C., Oey M. S., 2002, MNRAS, 337, 1299
- Curtis-Lake et al. (2016) Curtis-Lake E., et al., 2016, MNRAS, 457, 440
- D’Aloisio et al. (2020) D’Aloisio A., McQuinn M., Trac H., Cain C., Mesinger A., 2020, ApJ, 898, 149
- Davies et al. (2018) Davies F. B., et al., 2018, ApJ, 864, 142
- Dayal & Ferrara (2018) Dayal P., Ferrara A., 2018, Phys. Rep., 780, 1
- De Barros et al. (2017) De Barros S., et al., 2017, A&A, 608, A123
- De Barros et al. (2019) De Barros S., Oesch P. A., Labbé I., Stefanon M., González V., Smit R., Bouwens R. J., Illingworth G. D., 2019, MNRAS, 489, 2355
- Dijkstra (2014) Dijkstra M., 2014, Publ. Astron. Soc. Australia, 31, e040
- Ellis et al. (2013) Ellis R. S., et al., 2013, ApJ, 763, L7
- Endsley et al. (2021) Endsley R., Stark D. P., Chevallard J., Charlot S., 2021, MNRAS, 500, 5229
- Erb et al. (2014) Erb D. K., et al., 2014, ApJ, 795, 33
- Fabricant et al. (2019) Fabricant D., et al., 2019, PASP, 131, 075004
- Fan et al. (2006) Fan X., Carilli C. L., Keating B., 2006, ARA&A, 44, 415
- Ferland et al. (2013) Ferland G. J., et al., 2013, Rev. Mex. Astron. Astrofis., 49, 137
- Finkelstein (2016) Finkelstein S. L., 2016, Publ. Astron. Soc. Australia, 33, e037
- Finkelstein et al. (2013) Finkelstein S. L., et al., 2013, Nature, 502, 524
- Finkelstein et al. (2015) Finkelstein S. L., et al., 2015, ApJ, 810, 71
- Finlator et al. (2012) Finlator K., Oh S. P., Özel F., Davé R., 2012, MNRAS, 427, 2464
- Fontana et al. (2010) Fontana A., et al., 2010, ApJ, 725, L205
- Fuller et al. (2020) Fuller S., et al., 2020, ApJ, 896, 156
- Furlanetto et al. (2004) Furlanetto S. R., Zaldarriaga M., Hernquist L., 2004, ApJ, 613, 1
- Furusawa et al. (2016) Furusawa H., et al., 2016, ApJ, 822, 46
- Gazagnes et al. (2020) Gazagnes S., Chisholm J., Schaerer D., Verhamme A., Izotov Y., 2020, A&A, 639, A85
- Giallongo et al. (2019) Giallongo E., et al., 2019, ApJ, 884, 19
- Grazian et al. (2020) Grazian A., et al., 2020, ApJ, 897, 94
- Greig & Mesinger (2017) Greig B., Mesinger A., 2017, MNRAS, 465, 4838
- Greig et al. (2017) Greig B., Mesinger A., Haiman Z., Simcoe R. A., 2017, MNRAS, 466, 4239
- Grogin et al. (2011) Grogin N. A., et al., 2011, ApJS, 197, 35
- Guaita et al. (2010) Guaita L., et al., 2010, ApJ, 714, 255
- Gutkin et al. (2016) Gutkin J., Charlot S., Bruzual G., 2016, MNRAS, 462, 1757
- Hathi et al. (2016) Hathi N. P., et al., 2016, A&A, 588, A26
- Hoag et al. (2019) Hoag A., et al., 2019, ApJ, 878, 12
- Horne (1986) Horne K., 1986, PASP, 98, 609
- Hu et al. (2010) Hu E. M., Cowie L. L., Barger A. J., Capak P., Kakazu Y., Trouille L., 2010, ApJ, 725, 394
- Hu et al. (2017) Hu W., et al., 2017, ApJ, 845, L16
- Hunter (2007) Hunter J. D., 2007, Computing in Science & Engineering, 9, 90
- Inoue et al. (2014) Inoue A. K., Shimizu I., Iwata I., Tanaka M., 2014, MNRAS, 442, 1805
- Inoue et al. (2016) Inoue A. K., et al., 2016, Science, 352, 1559
- Jarvis et al. (2013) Jarvis M. J., et al., 2013, MNRAS, 428, 1281
- Jaskot et al. (2019) Jaskot A. E., Dowd T., Oey M. S., Scarlata C., McKinney J., 2019, ApJ, 885, 96
- Jones et al. (2001) Jones E., Oliphant T., Peterson P., et al., 2001, SciPy: Open source scientific tools for Python, http://www.scipy.org/
- Jung et al. (2017) Jung I., et al., 2017, ApJ, 834, 81
- Jung et al. (2018) Jung I., et al., 2018, ApJ, 864, 103
- Kansky et al. (2019) Kansky J., et al., 2019, PASP, 131, 075005
- Kashikawa et al. (2011) Kashikawa N., et al., 2011, ApJ, 734, 119
- Keating et al. (2020) Keating L. C., Weinberger L. H., Kulkarni G., Haehnelt M. G., Chardin J., Aubert D., 2020, MNRAS, 491, 1736
- Koekemoer et al. (2011) Koekemoer A. M., et al., 2011, ApJS, 197, 36
- Konno et al. (2014) Konno A., et al., 2014, ApJ, 797, 16
- Kornei et al. (2010) Kornei K. A., Shapley A. E., Erb D. K., Steidel C. C., Reddy N. A., Pettini M., Bogosavljević M., 2010, ApJ, 711, 693
- Kriek et al. (2015) Kriek M., et al., 2015, ApJS, 218, 15
- Kulkarni et al. (2019) Kulkarni G., Keating L. C., Haehnelt M. G., Bosman S. E. I., Puchwein E., Chardin J., Aubert D., 2019, MNRAS, 485, L24
- Labbé et al. (2013) Labbé I., et al., 2013, ApJ, 777, L19
- Laporte et al. (2017) Laporte N., Nakajima K., Ellis R. S., Zitrin A., Stark D. P., Mainali R., Roberts-Borsani G. W., 2017, ApJ, 851, 40
- Larson et al. (2018) Larson R. L., et al., 2018, ApJ, 858, 94
- Lee et al. (2007) Lee J. C., Kennicutt R. C., Funes S. J. J. G., Sakai S., Akiyama S., 2007, ApJ, 671, L113
- Lin et al. (2016) Lin Y., Oh S. P., Furlanetto S. R., Sutter P. M., 2016, MNRAS, 461, 3361
- Livermore et al. (2017) Livermore R. C., Finkelstein S. L., Lotz J. M., 2017, ApJ, 835, 113
- Loeb & Barkana (2001) Loeb A., Barkana R., 2001, ARA&A, 39, 19
- Ma et al. (2020) Ma X., et al., 2020, MNRAS,
- Madau & Haardt (2015) Madau P., Haardt F., 2015, ApJ, 813, L8
- Mainali et al. (2018) Mainali R., et al., 2018, MNRAS, 479, 1180
- Makovoz & Khan (2005) Makovoz D., Khan I., 2005, in Shopbell P., Britton M., Ebert R., eds, Astronomical Society of the Pacific Conference Series Vol. 347, Astronomical Data Analysis Software and Systems XIV. p. 81
- Malhotra & Rhoads (2004) Malhotra S., Rhoads J. E., 2004, ApJ, 617, L5
- Maseda et al. (2018) Maseda M. V., et al., 2018, ApJ, 854, 29
- Mason & Gronke (2020) Mason C. A., Gronke M., 2020, MNRAS, 499, 1395
- Mason et al. (2018a) Mason C. A., Treu T., Dijkstra M., Mesinger A., Trenti M., Pentericci L., de Barros S., Vanzella E., 2018a, ApJ, 856, 2
- Mason et al. (2018b) Mason C. A., et al., 2018b, ApJ, 857, L11
- Mason et al. (2019) Mason C. A., et al., 2019, MNRAS, 485, 3947
- Matthee et al. (2020) Matthee J., Sobral D., Gronke M., Pezzulli G., Cantalupo S., Röttgering H., Darvish B., Santos S., 2020, MNRAS, 492, 1778
- Mauduit et al. (2012) Mauduit J. C., et al., 2012, PASP, 124, 714
- McCracken et al. (2012) McCracken H. J., et al., 2012, A&A, 544, A156
- McGreer et al. (2015) McGreer I. D., Mesinger A., D’Odorico V., 2015, MNRAS, 447, 499
- McLure et al. (2013) McLure R. J., et al., 2013, MNRAS, 432, 2696
- McQuinn et al. (2007) McQuinn M., Lidz A., Zahn O., Dutta S., Hernquist L., Zaldarriaga M., 2007, MNRAS, 377, 1043
- Mesinger & Furlanetto (2007) Mesinger A., Furlanetto S., 2007, ApJ, 669, 663
- Mesinger & Furlanetto (2008) Mesinger A., Furlanetto S. R., 2008, MNRAS, 386, 1990
- Mesinger et al. (2004) Mesinger A., Haiman Z., Cen R., 2004, ApJ, 613, 23
- Miralda-Escudé (1998) Miralda-Escudé J., 1998, ApJ, 501, 15
- Naidu et al. (2020) Naidu R. P., Tacchella S., Mason C. A., Bose S., Oesch P. A., Conroy C., 2020, ApJ, 892, 109
- Nasir & D’Aloisio (2020) Nasir F., D’Aloisio A., 2020, MNRAS, 494, 3080
- Oesch et al. (2015) Oesch P. A., et al., 2015, ApJ, 804, L30
- Oesch et al. (2018) Oesch P. A., Bouwens R. J., Illingworth G. D., Labbé I., Stefanon M., 2018, ApJ, 855, 105
- Oke & Gunn (1983) Oke J. B., Gunn J. E., 1983, ApJ, 266, 713
- Ono et al. (2012) Ono Y., et al., 2012, ApJ, 744, 83
- Ono et al. (2013) Ono Y., et al., 2013, ApJ, 777, 155
- Ono et al. (2018) Ono Y., et al., 2018, PASJ, 70, S10
- Ota et al. (2017) Ota K., et al., 2017, ApJ, 844, 85
- Ouchi et al. (2008) Ouchi M., et al., 2008, ApJS, 176, 301
- Ouchi et al. (2010) Ouchi M., et al., 2010, ApJ, 723, 869
- Park et al. (2016) Park H., Shapiro P. R., Choi J.-h., Yoshida N., Hirano S., Ahn K., 2016, ApJ, 831, 86
- Pawlik et al. (2015) Pawlik A. H., Schaye J., Dalla Vecchia C., 2015, MNRAS, 451, 1586
- Pentericci et al. (2009) Pentericci L., Grazian A., Fontana A., Castellano M., Giallongo E., Salimbeni S., Santini P., 2009, A&A, 494, 553
- Pentericci et al. (2011) Pentericci L., et al., 2011, ApJ, 743, 132
- Pentericci et al. (2014) Pentericci L., et al., 2014, ApJ, 793, 113
- Pentericci et al. (2016) Pentericci L., et al., 2016, ApJ, 829, L11
- Pentericci et al. (2018) Pentericci L., et al., 2018, A&A, 619, A147
- Planck Collaboration et al. (2016) Planck Collaboration et al., 2016, A&A, 596, A108
- Planck Collaboration et al. (2020) Planck Collaboration et al., 2020, A&A, 641, A6
- Price-Whelan et al. (2018) Price-Whelan A. M., et al., 2018, AJ, 156, 123
- Roberts-Borsani et al. (2016) Roberts-Borsani G. W., et al., 2016, ApJ, 823, 143
- Robertson et al. (2013) Robertson B. E., et al., 2013, ApJ, 768, 71
- Robertson et al. (2015) Robertson B. E., Ellis R. S., Furlanetto S. R., Dunlop J. S., 2015, ApJ, 802, L19
- Santos (2004) Santos M. R., 2004, MNRAS, 349, 1137
- Schenker et al. (2012) Schenker M. A., Stark D. P., Ellis R. S., Robertson B. E., Dunlop J. S., McLure R. J., Kneib J.-P., Richard J., 2012, ApJ, 744, 179
- Schenker et al. (2014) Schenker M. A., Ellis R. S., Konidaris N. P., Stark D. P., 2014, ApJ, 795, 20
- Scoville et al. (2007) Scoville N., et al., 2007, ApJS, 172, 38
- Shapley et al. (2003) Shapley A. E., Steidel C. C., Pettini M., Adelberger K. L., 2003, ApJ, 588, 65
- Shibuya et al. (2012) Shibuya T., Kashikawa N., Ota K., Iye M., Ouchi M., Furusawa H., Shimasaku K., Hattori T., 2012, ApJ, 752, 114
- Shibuya et al. (2018) Shibuya T., et al., 2018, PASJ, 70, S15
- Shull et al. (2012) Shull J. M., Harness A., Trenti M., Smith B. D., 2012, ApJ, 747, 100
- Smit et al. (2014) Smit R., et al., 2014, ApJ, 784, 58
- Smit et al. (2015) Smit R., et al., 2015, ApJ, 801, 122
- Song et al. (2016a) Song M., et al., 2016a, ApJ, 825, 5
- Song et al. (2016b) Song M., Finkelstein S. L., Livermore R. C., Capak P. L., Dickinson M., Fontana A., 2016b, ApJ, 826, 113
- Stark (2016) Stark D. P., 2016, ARA&A, 54, 761
- Stark et al. (2010) Stark D. P., Ellis R. S., Chiu K., Ouchi M., Bunker A., 2010, MNRAS, 408, 1628
- Stark et al. (2011) Stark D. P., Ellis R. S., Ouchi M., 2011, ApJ, 728, L2
- Stark et al. (2017) Stark D. P., et al., 2017, MNRAS, 464, 469
- Stefanon et al. (2017) Stefanon M., et al., 2017, ApJ, 851, 43
- Stefanon et al. (2019) Stefanon M., et al., 2019, ApJ, 883, 99
- Steinhardt et al. (2014) Steinhardt C. L., et al., 2014, The Astrophysical Journal, 791, L25
- Szalay et al. (1999) Szalay A. S., Connolly A. J., Szokoly G. P., 1999, AJ, 117, 68
- Tang et al. (2019) Tang M., Stark D. P., Chevallard J., Charlot S., 2019, MNRAS, 489, 2572
- Tilvi et al. (2014) Tilvi V., et al., 2014, ApJ, 794, 5
- Tilvi et al. (2016) Tilvi V., et al., 2016, ApJ, 827, L14
- Tilvi et al. (2020) Tilvi V., et al., 2020, ApJ, 891, L10
- Torres-Peimbert & Pena (1984) Torres-Peimbert S., Pena M., 1984, Rev. Mex. Astron. Astrofis., 9, 107
- Trainor et al. (2016) Trainor R. F., Strom A. L., Steidel C. C., Rudie G. C., 2016, ApJ, 832, 171
- Treu et al. (2012) Treu T., Trenti M., Stiavelli M., Auger M. W., Bradley L. D., 2012, ApJ, 747, 27
- Treu et al. (2013) Treu T., Schmidt K. B., Trenti M., Bradley L. D., Stiavelli M., 2013, ApJ, 775, L29
- Van Der Walt et al. (2011) Van Der Walt S., Colbert S. C., Varoquaux G., 2011, Computing in Science & Engineering, 13, 22
- Vanzella et al. (2011) Vanzella E., et al., 2011, ApJ, 730, L35
- Wang et al. (2020) Wang F., et al., 2020, ApJ, 896, 23
- Weinberger et al. (2018) Weinberger L. H., Kulkarni G., Haehnelt M. G., Choudhury T. R., Puchwein E., 2018, MNRAS, 479, 2564
- Whitler et al. (2020) Whitler L. R., Mason C. A., Ren K., Dijkstra M., Mesinger A., Pentericci L., Trenti M., Treu T., 2020, MNRAS, 495, 3602
- Willott et al. (2015) Willott C. J., Carilli C. L., Wagg J., Wang R., 2015, ApJ, 807, 180
- Wyithe & Loeb (2005) Wyithe J. S. B., Loeb A., 2005, ApJ, 625, 1
- Zheng et al. (2017) Zheng Z.-Y., et al., 2017, ApJ, 842, L22
- Zitrin et al. (2015) Zitrin A., et al., 2015, ApJ, 810, L12
Appendix A IRAC Imaging
We show the deconfused (§2.1.3) IRAC postage stamps of our z7 targets in Fig. 11. The postage stamps for COS-862541 are shown in E21.