Temporal properties of higher-order interactions in social networks
Abstract
Human social interactions in local settings can be experimentally detected by recording the physical proximity and orientation of people. Such interactions, approximating face-to-face communications, can be effectively represented as time varying social networks with links being unceasingly created and destroyed over time. Traditional analyses of temporal networks have addressed mostly pairwise interactions, where links describe dyadic connections among individuals. However, many network dynamics are hardly ascribable to pairwise settings but often comprise larger groups, which are better described by higher-order interactions. Here we investigate the higher-order organizations of temporal social networks by analyzing three publicly available datasets collected in different social settings. We find that higher-order interactions are ubiquitous and, similarly to their pairwise counterparts, characterized by heterogeneous dynamics, with bursty trains of rapidly recurring higher-order events separated by long periods of inactivity. We investigate the evolution and formation of groups by looking at the transition rates between different higher-order structures. We find that in more spontaneous social settings, group are characterized by slower formation and disaggregation, while in work settings these phenomena are more abrupt, possibly reflecting pre-organized social dynamics. Finally, we observe temporal reinforcement suggesting that the longer a group stays together the higher the probability that the same interaction pattern persist in the future. Our findings suggest the importance of considering the higher-order structure of social interactions when investigating human temporal dynamics.
Introduction
Complex networks are fundamental tools to represent complex systems made of interacting units, with applications in biology, social sciences, transport infrastructures, communications, financial markets, and more newman2018networks ; barabasi2016network ; latora2017complex . Incorporating a set of discrete nodes and the connections between them, the networks schematize the existing relationships among agents, providing a synthetic picture of the system architecture. Despite the success of network representations of complex systems in the last thirty years, static graphs fall short to effectively describe a wide variety of real world systems, especially when the dynamics of their structural changes is in focus. In networked systems, whether nodes represent people, cells, neurons, virtual or physical sites, their interactions are not bounded to be static but are rather evolving, with nodes and links, which appear and disappear over time. To address the time-varying aspect of complex structures, the field of temporal networks emerged holme2012temporal ; lambiotte2016guide ; holme2015modern ; latapy2018stream providing useful representations and tools to study the dynamics of real complex systems. The framework is particularly suited to describe social systems where coupling contacts among people naturally change over time in online and offline social networks, email and mobile phone communications, and more karsai2011small ; miritello2011 ; zhao2011 ; karsai2014 ; kobayashi2019 . However, social interactions may vary over multiple temporal scales, ranging from long lasting friendships to accidental interactions between strangers. Moreover, consecutive interactions may not appear independently but follow each other rapidly forming bursty patterns karsai2018bursty potentially due to intrinsic correlations barabasi2005origin or simply via circadian fluctuations of human activity malmgren2008poissonian . Temporal networks describe such processes at the highest time resolution to understand how single interactions may lead to collective phenomena, as long trains of bursty events, or the emergence of the complex social structure.
Network approaches were originally devised to describe dyadic relationships and can only provide a limited representation of systems interacting beyond pairwise schemes. Such higher-order interactions are ubiquitous battiston2020networks , from human societies to artificial or biological systems. For instance scientific authors naturally team up in larger groups to complement the expertise of different members patania2017shape , neurons send and receive stimuli from multiple adjacent partners at the same time petri2014homological ; giusti2016two , and the stability of large ecosystems relies on mutual and cooperative partnerships often involving three or more species grilli2017higher ; bairey2016high . Besides, higher-order interactions were shown to significantly modify the collective behavior of many dynamical processes, from diffusion schaub2020random ; carletti2020random and synchronization skardal2019abrupt ; millan2020explosive ; lucas2020multi to spreading iacopini2019simplicial ; de2020social , social dynamics neuhauser2020multibody and games alvarez2020evolutionary . For a thorough introduction on the structure and dynamics of these higher-order systems, we refer the interested reader to the comprehensive overview provided in Ref battiston2020networks .
In this paper our goal is to study the heterogeneous dynamics of group interactions by looking at bursty patterns of higher-order structures in temporal networks. We analyze the temporal properties of multi-party face-to-face interactions genois2018can recorded in the SocioPatterns project isella2011 . We define group interactions in this setting and determine the number of groups to classify them according to their size. By analysing their duration and the time between their subsequent appearances we identify long bursty trains of recurrent group interactions due to temporal correlations. Finally, we investigate the temporal evolution of groups and how their size changes over time by progressively acquiring or losing members, observing a reinforcement of group structures over time. Our results generalise universal phenomena earlier observed for dyadic interactions karsai2012universal for the case of higher-order temporal structures.
Results
Temporal higher-order social interactions
We aim at investigating the temporal dynamics of the higher-order structure of human proximity interactions in different social settings. To this end, we choose three datasets, which describe face-to-face interactions isella2011 ; genois2018can (a) in an office building in France genois2015 over 11 days; (b) in a hospital ward between patients, medical doctors, nurses and administrative staff over 72 hours vanhems2013estimating ; and (c) during 32 hours in a scientific conference isella2011 . Each dataset records the dyadic face-to-face interactions of people with time resolution of seconds, but also identifies simultaneous contacts of the participants thus allowing for the observation of group interactions. Originally exploited for pairwise network analysis, the fine grained temporal structure of these interactions allows us to reconstruct the formation, presence, and deletion of higher-order groups.
In the traditional network formalism, a dyadic temporal interaction between two people and at time , which lasted for duration , is represented by a temporal link . In this setting, the sequence of temporal events builds up a temporal network , where any node , any event and the network evolve over period, thus and .
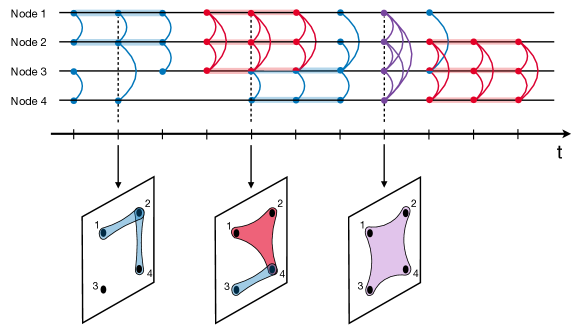
However, people often connect in larger groups, where more than two individuals interact at the same time. Simple links, by definition describing dyadic connections, are not suited to describe such higher-order interactions, which require different types of building blocks, known as hyperedges. An -hyperedge, or hyperedge of size , describes an interaction of individuals. In more mathematical terms this is denoted a simplex of order battiston2020networks .Simple dyadic links represent the first non-trivial interaction, described by a 2-hyperedge. For temporal data, we define the interaction between a group of people, , at time and for duration as a temporal -hyperedge assigned as . The sequence of temporal events builds up a temporal hypergraph , where any node , any event (now describing a set of hyperedges) and the hypergraph evolve over period, thus and . An example of a temporal hypergraph is shown in Fig. 1, where the connections that nodes undertake are coloured according to their size shown with some instantaneous snapshots of the temporal hypergraph underneath.
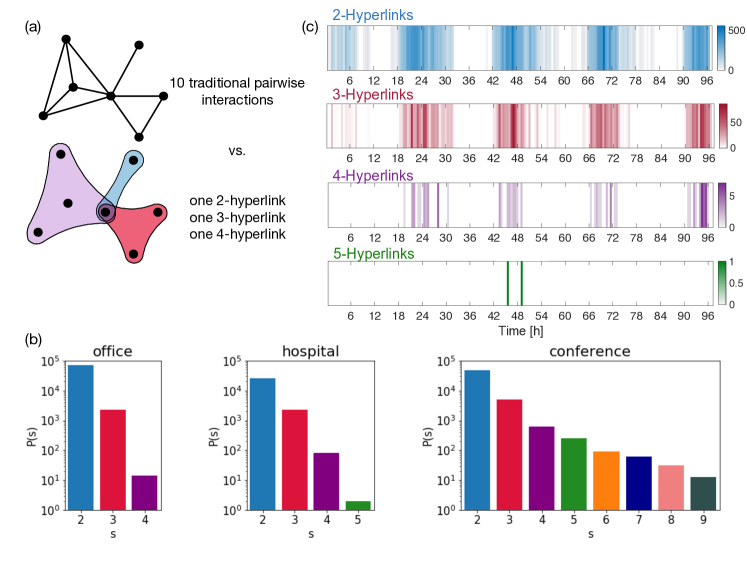
In the considered datasets each interaction is originally stored through simple links. However, they do not necessarily represent the original building blocks of the interactions. The fine-grained temporal nature of the datasets allow us to reconstruct the original higher-order features of the connections and the corresponding hyperedges. In practice, if at a time there are dyads between the members of a set of nodes such that they form a fully connected clique, we promote the links to a -hyperedge. For instance, if at time , is interacting with and , and is interacting with too, the interactions will be stored into an 3-hyperedge. Note that the same reconstruction is not possible from temporally-aggregated data, where the presence of a closed triangle may be the byproduct of the temporal aggregation of distinct truly pairwise interactions. This is demonstrated in Fig. 2(a) where the schematic representation of a network is compared with its hypergraph version. The traditional network is characterized by ten simple links, while considering their simultaneous group interactions, we identify one 2-hyperedge (in blue), one 3-hyperedge (in red), and one 4-hyperedge (in purple).
In the following when we refer to a group interaction of size , it corresponds to a maximal clique of size , or in other words an -hyperedge, without being a part of any larger group.
Statistics of higher-order interactions
The statistics of maximal higher-order interactions for the three datasets are reported in Fig. 2(b). Smaller interactions involving less people are more numerous in all datasets, however different settings are characterized by different statistics: for instance the conference dataset reveals the presence of very large aggregations, with up to events of size 9, while in the hospital and office settings the group sizes are limited to 5 and 4 respectively. Note also that the office dataset was collected for a longer period thus it represents the most connected aggregated network and the one with the largest total number of interactions. However, these interactions are mainly pairwise, as demonstrated in Fig. 2, which is particularly peaked at , while interactions of size 4 are poorly represented (less than 20 in 11 days). In addition, the office network has the highest ratio (nearly one and half orders of magnitude) between the number of dyadic and triplet interactions. This suggests that the office network is “the lowest-order”, especially as compared to the conference network, which instead appears to be the “the highest-order” network. In general, the presence of several group interactions in these networks and their heterogeneous size call for a deeper analysis of their higher-order structures to properly characterize their dynamical evolution.
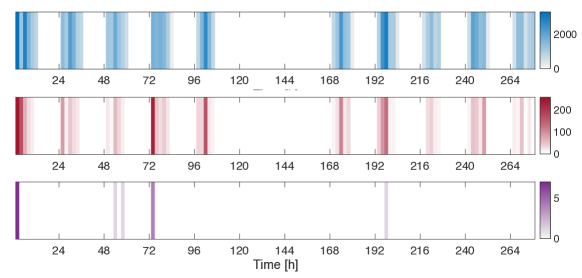
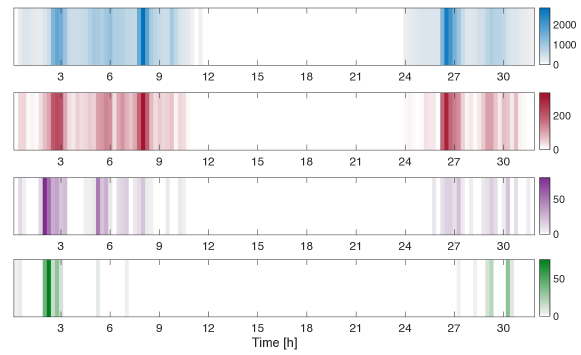
Moreover, it is interesting to observe that the emergence of higher-order structures is strongly heterogeneous in time. This is evident from Fig. 2(c) where we show the timely occurrences of interactions of sizes 2, 3, 4 and 5 in the hospital dataset. Note that similar time-series for the other datasets are reported in the Supplementary Information. This visualisation already suggests bursty patterns of higher-order interactions, which are not independent across different orders. In one way it is not surprising as higher-order events always build up from lower-order structures, but their heterogeneous dynamics and short term recurrence is far from being obvious. In the following section we will provide a more formal inspection of these features by defining and analysing higher-order bursty behavior.
Higher-order bursty behavior
To study the dynamics of higher-order interactions we study the dynamics of events, which can be a singular interaction or hyperedge of any kind and duration. In the investigated datasets interactions were recorded every 20 seconds, which define the minimum duration associated to an interaction. In order to construct events with longer duration, we merge consecutive events which involved exactly the same group of people. In this way we are able to identify longer events with durations modulo 20 seconds.
Another interesting quantity measures the time between consecutive events of the same group of people. More precisely, if a generic event begins at time and has duration , inter event time is defined as . In other words it spans from the end of the group’s previous interaction to the beginning of the next one. Inter-event times are a central measure to study event dynamics as their distribution evidently show whether the dynamics are heterogeneous and thus indicated by a broad , or they resemble a homogeneous dynamics, such as a Poisson process, with exponential inter-event time distribution karsai2018bursty . In the Supplementary Information, we report the probability density functions of event durations and inter-event times, respectively in Figs. 4 and 5. These results show evidently that face-to-face interactions are strongly heterogeneous in duration and inter-events times regardless the social setting.
| Office | Hospital | Conference | |
|---|---|---|---|
| size 2 | 0.58 | 0.61 | 0.58 |
| size 3 | 0.63 | 0.54 | 0.62 |
| size 4 | -0.17 | 0.79 | 0.70 |
To further quantify burstiness in event sequences of different size we measured the burstiness index, defined in Ref. kim2016measuring as , where with the mean inter-event time and the corresponding standard deviation respectively. This measure is corrected for the sample size and represents an improved version of the original measure defined in Ref. goh2008burstiness . This index takes values between for regular signals, in case of independent events, and in case events are temporally correlated. Average values of for the three considered datasets and up to interactions of size 4 are reported in Table 1. With the exception of interactions of size 4 in the office setting, for which we lack sufficient statistics, all other cases presented appeared with values of burstiness significantly larger than 0. Interestingly, burstiness of events of different sizes appear to be comparable.
The time series reported in Fig. 2 anecdotally suggest that events often occur in successions of high activity, known as trains of events, alternated with periods of inactivity. This phenomenon has already been observed for pairwise interactions in various temporal processes karsai2012universal , like communication (i.e. emails, text messages or mobile calls), recurrent seismic activities in a specific location, and neuron firing signals. It has been argued in Ref. karsai2012universal that the emergence of long bursty trains is ascribable to short-term temporal correlation between events. This can be demonstrated by the distribution of the number of events in the bursty period. To define we need to identify events, which belong to the same bursty period, also called bursty train. In our definition we consider two events to be related if they are consecutive and happen with an inter-event time smaller than a given value . Related consecutive event pairs can build up to longer trains where the above condition is true for each consecutive event and otherwise the train is separated by longer than inter-event times from the rest of the sequence. The number of events in these trains give the metric , which distribution appears as exponential in case of independent events, while any deviation from this scaling indicates present temporal correlations between the events in the trains. In empirical observations, as mentioned before, the distribution has been found to be well approximated by power-law functions, evidently indicating temporal correlations characterising these systems karsai2012universal .
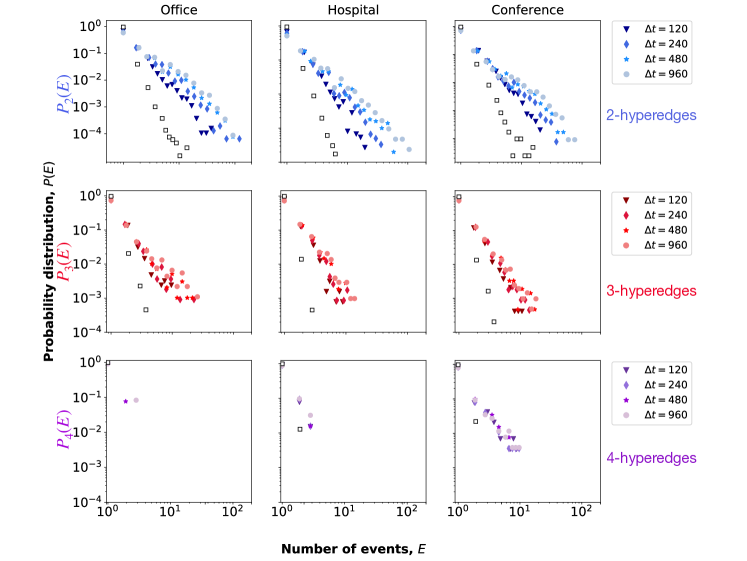
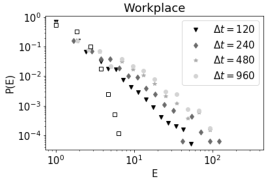
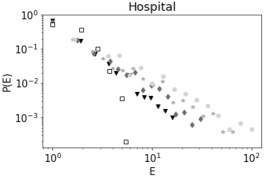
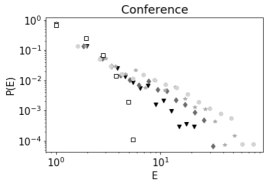
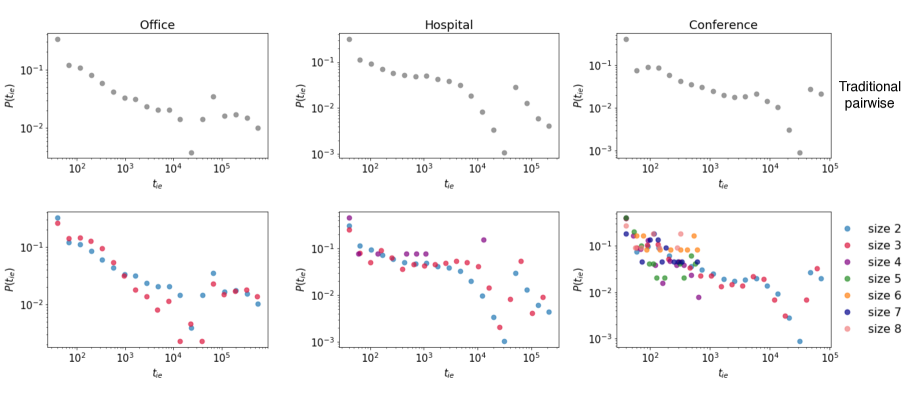
However, bursty event trains have never been investigated for events involving more than two nodes. Here we move beyond traditional pairwise interactions and we separate the events according to their size to identify trains of events of each order separately. As earlier defined, we introduce a parameter, , which allows to discern what we consider related events from uncorrelated ones and to identify event trains. We can identify trains containing only events of a specific size and compute their quantity to obtain the distribution for events of size . Such distributions computed for different event sizes and datasets appear with heavy tails, as shown in Fig. 3. Moreover, this phenomena appears to be robust against the choice of values, coherently with the analysis presented in Ref. karsai2012universal . Note that these observations cannot be reproduced by simple null models where event sequences are constructed from uncorrelated interactions obtained by shuffling event times. Equivalent distributions computed in such independent signals are shown on panels of Fig. 3 as empty symbols, appearing evidently different than the empirical observations. For further details on the definition of utilised null models see Methods and Ref. karsai2012universal
In summary, these results indicate the existence of bursty dynamics not only for dyadic but also for higher-order event sequences. We observed that they evolve in bursty trains of correlated events in case of any size and investigated dataset. More importantly these observations cannot be reproduced by null models of independent events, indicating the observed correlations to be significant in the empirical systems.
Evolution and formation of higher-order social interactions

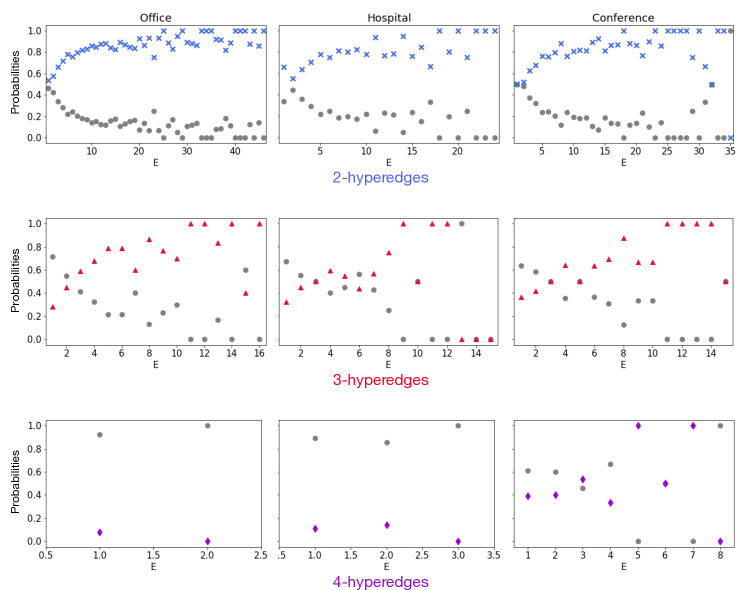
The above analyses allowed to generalize to higher-order network measures some findings firstly observed in dyadic settings. However, this framework also allows for some genuine higher-order investigation about group formation and evolution, similar to Ref. benson2018simplicial . The composition of a group in general is related to the previous interaction history of participants, which extends well beyond pairwise relationships. To observe any group formation scenario, we look for the presence of actual interactions in forthcoming time steps thus following how the order of events changes in time. In practice, for events of a given size we consider all the trains of size , and measure the probability that (a) the train continues with an th event of the same or higher-order or (b) the group falls apart. The results are shown in Fig. 4 for our three datasets, extending to higher-order interactions a similar analysis proposed in Ref. karsai2012universal for traditional pairwise communications. Panels in the first line of Fig. 4 depict the evolution of dyadic interactions. For each value of blue crosses indicate the probability that the event is followed by a new event of the same or higher-order, while complementary probability, shown as grey dots, measures the probability the corresponding nodes break their interaction in the following time step. Analogous measures are shown in the second and third line for interactions of size 3 and 4, where the two probabilities are shown in color and in grey respectively. Overall, the colored symbols display an increasing trend across the different interaction sizes and datasets. These results indicate the existence of temporal reinforcement, meaning that the longer the length of an interaction – no matter the group size – the higher the chances the relationship will not break down. We note that these trends are more pronounced for groups of small size, which could be due to the significantly larger number of smaller size events in the networks. Although these observations are rooted in some earlier results on group formation dynamics observed through dyadic interactions zhao2011social ; karsai2012universal ; karsai2012correlated , they provide an independent verification of similar phenomena by using higher-order events.
The question remains, what happens exactly before and after a higher-order event is formed? To answer this question we depart from the exclusive investigation of higher-order events. For each event corresponding to a hyperedge of generic size , we identify the relations among the nodes involved one step before the formation of the group and one step after it disappeared. Out of simplicity, we focus on groups of size 3 (3-hyperedges), as they are by far more numerous within our datasets. At the previous and following time step a clique of three nodes can be arranged across for different classes, as illustrated in Fig. 5. In the first case there are no connections between any of the nodes (grey sketch); in the second one there is a single link connecting two of the three nodes, while the last unit is disconnected (dark blue); in the third case the nodes are connected across an open triad (light blue); the fourth configuration (purple) represents the case where the three nodes are interacting all together but they are part of a larger hyperedge (and for this reason they are not classified anymore as a maximal 3-hyperedge). The pie charts in Fig. 5 depict the proportions of the four different configurations before and after a higher-order interaction of size 3 for events lasting at least 300 seconds.
Results in Fig. 5 suggest that a triplet is infrequently formed from or evolve into a larger group, as purple sections indicate scarce observation of this case in Fig. 5. Exception is the conference setting, where events growing to higher-order seem to be more frequent. At the same time, it is rather infrequent, especially in the conference setting, that a group is created from scratch or vanishes into three isolated nodes (grey configuration are also quite uncommon). The configurations that prevail are those where two nodes are already connected and a third one is added (dark blue) or, alternatively, two nodes are linked to the same node in an open triad and then they get connected (light blue). Similarly, transition rates for the dis-aggregation of the interaction are high when the triplet is broken in one (dark blue) or two (light blue) connected couples.
These results suggest a more similar group formation dynamics in the interaction pattern of the hospital and the office settings, where people may undergo work dynamics, dictated by daily work routines. Observation may be driven by scheduled meetings where a group of people come together suddenly at a given time and then depart. Group formation, instead, appears to be more fluid at the conference, where individuals can connect more freely thus it is more common for groups to aggregate and disaggregate step by step, one node at a time. Another important difference between the two kinds of datasets is the formation frequency of larger cliques, indicated by the purple section in Fig. 5. Indeed, in the first two datasets (i.e. the hospital and the office) a triplet can in few cases stem from the disintegration of larger groups, but the opposite, i.e. a triplet increasing its size by acquiring new members, never happens. This last possibility is instead common in the conference dataset, where the probability that a group size switches from 3 to 4, or even more, is even higher than the opposite, i.e. a triplet generated from a larger group. This suggests that a triplet is more suitable to represent the starting point of a larger aggregation in the conference setting than in the two working places, and therefore the greater tendency in the former environment to build groups step by step.
Conclusions
In this work we investigated the dynamics of higher-order interactions in temporal social networks. To this scope, we made use of three publicly available datasets of face-to-face human interactions collected in different settings as in a hospital, in an office, and during a conference. Originally analyzed by means of traditional network tools, the temporal nature of the datasets allowed us to reconstruct the real higher-order organization of social interactions. A first analysis of the datasets revealed the presence of frequent higher-order interactions not limited to simple dyads. More interestingly, such higher-order events appear with heterogeneous bursty dynamics, however with lower frequency for higher-order.
By following the time evolution of the different kinds of interactions we observed bursty trains of higher-order events in all settings. The distributions of bursty train sizes revealed a broad tailed scaling, hinting at similar behavior of higher-order interactions already observed for dyadic events in other bursty systems in biological, geological and social domains karsai2012universal .We also inspected memory effects in group formation by measuring the probability that a specific train of interactions is protracted in time, based on the number of previous events and its groups size. We discovered that interactions lasting longer times are more likely to persist even longer, potentially due to temporal reinforcement mechanisms characterising all settings.
Group evolution showed differences across the considered datasets. In particular for higher-order interactions involving three individuals, we looked at the relational structures at the preceding and forthcoming periods. We found in the hospital and office settings similar behavior, possibly due to their work related organisation where individuals are subject to pre-organized and regular dynamics, leading to a higher probability to generate or dis-aggregate groups instantaneously. Differently, in the conference setting we observed a tendency to build groups by progressively adding members, one step at a time, reflecting a more spontaneous way of group formation.
This study however comes with some limitations. First, despite the large amount of face-to-face interactions captured by the three analyzed datasets, the investigation of large group behaviors is inherently limited by the lower statistics associated to higher-order events, as compared to pairwise interactions. In the future this problem could be addressed by considering datasets with a higher proportion of non-dyadic interactions. Such a setting would indeed make possible to generalize the study of transition rates in group evolution, now presented only for triplets. Second, our study focuses on face-to-face interactions, not considering alternative types of information e.g. geo-localised data and the corresponding co-mobility networks, which are naturally suited for a higher-order analysis.
Overall, our work reveals a new level of richness in temporal human dynamics, neglected in the previous literature. We showed how, taking into account the new framework of higher-order interactions battiston2020networks , helps us to better characterise social dynamics extracted from three different settings. Taken together we hope that our findings will pave the way to the use of higher-order network tools for investigating the dynamics of human interactions.
Methods
Shuffled model. The null model of independent sequences for traditional pairwise interactions is built from the original data by shuffling the times of the events but maintaining all the original pairwise interactions. In this way, we maintain the same time stamps and each node is interacting in the same number of times. Interested readers may look at the comprehensive review on randomized reference models in temporal networks in Ref. gauvin2018randomized
For group interactions, one possibility is to consider the above defined time shuffled event sequence for each pairwise interaction, and then identify higher-order interactions among them. However this method breaks almost all higher-order patterns and allows the formation of very few cliques of size larger than 2. Hence, we followed another method, where we kept each higher-order event with a given size and shuffled their occurrence times between events of the same size. This shuffling ensures that each event of a given size appears the same number of times as in the original sequence but independently from each other.
Acknowledgments
G.C. acknowledges partial support from the “European Cooperation in Science & Technology” (COST): Action CA15109. F.B. acknowledges partial support from the ERC Synergy Grant No. 810115 (DYNASNET). M.K. acknowledges support from the DataRedux (ANR-19-CE46-0008) ANR and the SoBigData++ (871042) H2020 projects.
References
- (1) M. Newman, Networks. Oxford university press, 2018.
- (2) A.-L. Barabási, Network science. Cambridge University Press, 2016.
- (3) V. Latora, V. Nicosia, and G. Russo, Complex networks: principles, methods and applications. Cambridge University Press, 2017.
- (4) P. Holme and J. Saramäki, “Temporal networks,” Physics Reports, vol. 519, no. 3, pp. 97–125, 2020.
- (5) R. Lambiotte and N. Masuda, A guide to temporal networks, vol. 4. World Scientific, 2016.
- (6) P. Holme, “Modern temporal network theory: a colloquium,” The European Physical Journal B, vol. 88, no. 9, p. 234, 2015.
- (7) M. Latapy, T. Viard, and C. Magnien, “Stream graphs and link streams for the modeling of interactions over time,” Social Network Analysis and Mining, vol. 8, no. 1, p. 61, 2018.
- (8) M. Karsai, M. Kivelä, R. K. Pan, K. Kaski, J. Kertész, A.-L. Barabási, and J. Saramäki, “Small but slow world: How network topology and burstiness slow down spreading,” Physical Review E, vol. 83, no. 2, p. 025102, 2011.
- (9) G. Miritello, E. Moro, and R. Lara, “Dynamical strength of social ties in information spreading,” Physical Review E, vol. 83, no. 4, p. 045102, 2011.
- (10) K. Zhao, J. Stehlé, G. Bianconi, and A. Barrat, “Social network dynamics of face-to-face interactions,” Phys. Rev. E, vol. 83, no. 5, p. 056109, 2011.
- (11) M. Karsai, N. Perra, and A. Vespignani, “Time varying networks and the weakness of strong ties,” Scientific Reports, vol. 4, no. 4001, 2014.
- (12) T. Kobayashi, T. Takaguchi, and A. Barrat, “The structured backbone of temporal social ties,” Nature Communications, vol. 10, no. 220, 2019.
- (13) M. Karsai, H.-H. Jo, K. Kaski, et al., Bursty human dynamics. Springer, 2018.
- (14) A.-L. Barabasi, “The origin of bursts and heavy tails in human dynamics,” Nature, vol. 435, no. 7039, pp. 207–211, 2005.
- (15) R. D. Malmgren, D. B. Stouffer, A. E. Motter, and L. A. Amaral, “A poissonian explanation for heavy tails in e-mail communication,” Proceedings of the National Academy of Sciences, vol. 105, no. 47, pp. 18153–18158, 2008.
- (16) F. Battiston, G. Cencetti, I. Iacopini, V. Latora, M. Lucas, A. Patania, J.-G. Young, and G. Petri, “Networks beyond pairwise interactions: structure and dynamics,” Physics Reports, vol. 1, p. 874, 2020.
- (17) A. Patania, G. Petri, and F. Vaccarino, “The shape of collaborations,” EPJ Data Science, vol. 6, no. 1, p. 18, 2017.
- (18) G. Petri, P. Expert, F. Turkheimer, R. Carhart-Harris, D. Nutt, P. J. Hellyer, and F. Vaccarino, “Homological scaffolds of brain functional networks,” Journal of The Royal Society Interface, vol. 11, no. 101, p. 20140873, 2014.
- (19) C. Giusti, R. Ghrist, and D. S. Bassett, “Two’s company, three (or more) is a simplex,” Journal of computational neuroscience, vol. 41, no. 1, pp. 1–14, 2016.
- (20) J. Grilli, G. Barabás, M. J. Michalska-Smith, and S. Allesina, “Higher-order interactions stabilize dynamics in competitive network models,” Nature, vol. 548, no. 7666, pp. 210–213, 2017.
- (21) E. Bairey, E. D. Kelsic, and R. Kishony, “High-order species interactions shape ecosystem diversity,” Nature communications, vol. 7, no. 1, pp. 1–7, 2016.
- (22) M. T. Schaub, A. R. Benson, P. Horn, G. Lippner, and A. Jadbabaie, “Random walks on simplicial complexes and the normalized hodge 1-laplacian,” SIAM Review, vol. 62, no. 2, pp. 353–391, 2020.
- (23) T. Carletti, F. Battiston, G. Cencetti, and D. Fanelli, “Random walks on hypergraphs,” Physical Review E, vol. 101, no. 2, p. 022308, 2020.
- (24) P. S. Skardal and A. Arenas, “Abrupt desynchronization and extensive multistability in globally coupled oscillator simplexes,” Physical review letters, vol. 122, no. 24, p. 248301, 2019.
- (25) A. P. Millán, J. J. Torres, and G. Bianconi, “Explosive higher-order kuramoto dynamics on simplicial complexes,” Physical Review Letters, vol. 124, no. 21, p. 218301, 2020.
- (26) M. Lucas, G. Cencetti, and F. Battiston, “Multiorder laplacian for synchronization in higher-order networks,” Physical Review Research, vol. 2, no. 3, p. 033410, 2020.
- (27) I. Iacopini, G. Petri, A. Barrat, and V. Latora, “Simplicial models of social contagion,” Nature communications, vol. 10, no. 1, pp. 1–9, 2019.
- (28) G. F. de Arruda, G. Petri, and Y. Moreno, “Social contagion models on hypergraphs,” Physical Review Research, vol. 2, no. 2, p. 023032, 2020.
- (29) L. Neuhäuser, A. Mellor, and R. Lambiotte, “Multibody interactions and nonlinear consensus dynamics on networked systems,” Physical Review E, vol. 101, no. 3, p. 032310, 2020.
- (30) U. Alvarez-Rodriguez, F. Battiston, G. F. de Arruda, Y. Moreno, M. Perc, and V. Latora, “Evolutionary dynamics of higher-order interactions,” arXiv preprint arXiv:2001.10313, 2020.
- (31) M. Génois and A. Barrat, “Can co-location be used as a proxy for face-to-face contacts?,” EPJ Data Science, vol. 7, no. 1, p. 11, 2018.
- (32) L. Isella, J. Stehlé, A. Barrat, C. Cattuto, J.-F. Pinton, and W. Van den Broeck, “What’s in a crowd? analysis of face-to-face behavioral networks,” Journal of Theoretical Biology, vol. 271, no. 1, pp. 166–180, 2011.
- (33) M. Karsai, K. Kaski, A.-L. Barabási, and J. Kertész, “Universal features of correlated bursty behaviour,” Scientific reports, vol. 2, p. 397, 2012.
- (34) M. Génois, C. L. Vestergaard, J. Fournet, A. Panisson, I. Bonmarin, and A. B. Barrat, “Data on face-to-face contacts in an office building suggest a low-cost vaccination strategy based on community linkers,” Network Science, vol. 3, no. 3, pp. 326–347, 2015.
- (35) P. Vanhems, A. Barrat, C. Cattuto, J.-F. Pinton, N. Khanafer, C. Régis, B.-a. Kim, B. Comte, and N. Voirin, “Estimating potential infection transmission routes in hospital wards using wearable proximity sensors,” PloS one, vol. 8, no. 9, p. e73970, 2013.
- (36) K.-I. Goh and A.-L. Barabási, “Burstiness and memory in complex systems,” EPL (Europhysics Letters), vol. 81, no. 4, p. 48002, 2008.
- (37) E.-K. Kim and H.-H. Jo, “Measuring burstiness for finite event sequences,” Physical Review E, vol. 94, no. 3, p. 032311, 2016.
- (38) A. R. Benson, R. Abebe, M. T. Schaub, A. Jadbabaie, and J. Kleinberg, “Simplicial closure and higher-order link prediction,” Proceedings of the National Academy of Sciences, vol. 115, no. 48, pp. E11221–E11230, 2018.
- (39) K. Zhao, J. Stehlé, G. Bianconi, and A. Barrat, “Social network dynamics of face-to-face interactions,” Physical review E, vol. 83, no. 5, p. 056109, 2011.
- (40) M. Karsai, K. Kaski, and J. Kertész, “Correlated dynamics in egocentric communication networks,” Plos one, vol. 7, no. 7, p. e40612, 2012.
- (41) L. Gauvin, M. Génois, M. Karsai, M. Kivelä, T. Takaguchi, E. Valdano, and C. L. Vestergaard, “Randomized reference models for temporal networks,” arXiv preprint arXiv:1806.04032, 2018.
- (42) M. Starnini, B. Lepri, A. Baronchelli, A. Barrat, C. Cattuto, and R. Pastor-Satorras, “Robust modeling of human contact networks across different scales and proximity-sensing techniques,” in International Conference on Social Informatics, pp. 536–551, Springer, 2017.
Supplementary Information
We provide a set of additional figures in order to offer the elements for a more detailed comparison between an approach taking into account higher-order behaviors and a more traditional point of view treating each singular pairwise interaction separately.
Office time series
Conference time series
Structure of temporal trains of traditional pairwise interactions
Duration time of events

Inter-event times
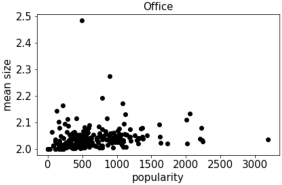
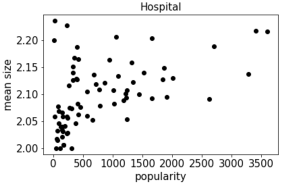
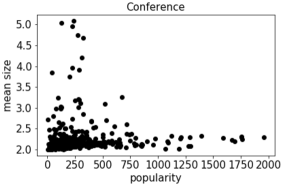
Mean size of interactions vs popularity