Universal Weighting Metric Learning for Cross-Modal Matching
Abstract
Cross-modal matching has been a highlighted research topic in both vision and language areas. Learning appropriate mining strategy to sample and weight informative pairs is crucial for the cross-modal matching performance. However, most existing metric learning methods are developed for unimodal matching, which is unsuitable for cross-modal matching on multimodal data with heterogeneous features. To address this problem, we propose a simple and interpretable universal weighting framework for cross-modal matching, which provides a tool to analyze the interpretability of various loss functions. Furthermore, we introduce a new polynomial loss under the universal weighting framework, which defines a weight function for the positive and negative informative pairs respectively. Experimental results on two image-text matching benchmarks and two video-text matching benchmarks validate the efficacy of the proposed method. The source code is available at: https://github.com/wayne980/PolyLoss.
1 Introduction
Cross-modal matching aims at retrieving relevant instances of a different media type from the query, which has a variety of applications such as Image-Text matching [6, 30, 26, 34, 29, 35, 39, 2, 12], Video-Text matching [20, 27, 8, 36], Sketch-based image matching [3], etc. Compared with unimodal matching, cross-modal matching is more challenging due to the heterogeneous gap between different modalities. The key issue in cross-modal matching is to reduce the heterogeneous gap and exploit discriminative information across modalities [19, gan2016learning, 33, 31, 25].
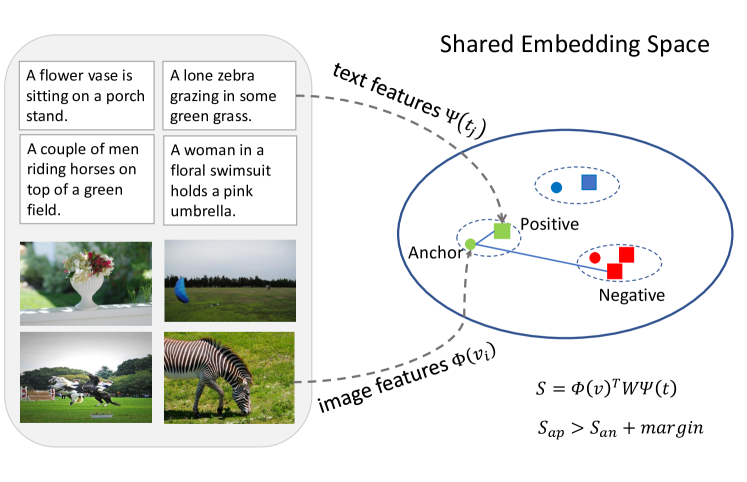
A common solution for cross-modal matching is to learn a shared embedding space for different modalities so that the features from different modalities can be compared. Recently, a variety of cross-modal matching methods have been devoted to learning richer semantic representations for different modalities and a ranking loss is adopted to jointly optimize the network so that the similarity of the positive pairs is higher than that of all negative pairs, as illustrated in Figure 1. In previous literature, attention mechanism [16] and generative models [9, 13] have been explored to build advanced encoding networks. Liu et al. [21] proposed a recurrent residual fusion block to reduce the modality gap, and a triplet loss [11] was used to encourage semantically associated samples close to each other in the shared embedding space. Li et al. [17] proposed a visual reasoning model to generate global representation of a scene.
While these methods have achieved encouraging performance, most of them use the ranking loss as an objective function, which usually trained with random sampling. This gives rise to an issue for cross-modal matching, where random sampling cannot effectively select informative pairs for training, leading a slow convergence and poor performance. While more recent metric learning methods have provided various mining strategies for unimodal matching, few of them are suitable for cross-modal matching. Hence, learning an appropriate mining strategy to sample and weight informative pairs is still a challenging problem for cross-modal matching.
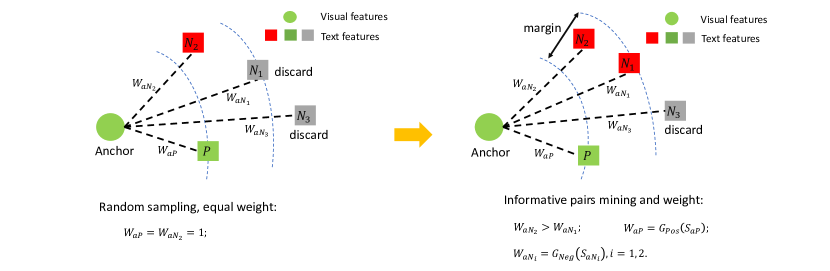
In this paper, we propose a universal weighting framework for cross-modal matching. Our intuition is based on the fact that a larger weight is assigned to a more informative pair, as illustrated in Figure 2. Unlike widely used unweighted triplet loss which treats all pairs equally, our proposed universal weighting framework can effectively assign appropriate weight to informative pairs for cross-modal matching. Specifically, we define two polynomial functions to calculate the weight values for positive and negative pairs respectively. Furthermore, we introduce a new polynomial loss under the universal weighting framework. Since the form of a polynomial function is flexible, our polynomial loss has a better generalization.
The major contributions of this paper are summarized as follows:
-
•
We propose a universal weighting framework for cross-modal matching, which defines two polynomial functions to calculate the weight values for positive and negative pairs respectively. It provides a powerful tool to analyze the interpretability of various loss functions.
-
•
We introduce a new polynomial loss under the universal weighting framework. The polynomial loss can effectively select informative pairs from redundant pairs, and assign appropriate weights to different pairs, resulting in performance boost.
-
•
We conduct extensive experiments and evaluate our proposed method on two cross-modal matching tasks, image-text matching and video-text matching. Experimental results demonstrate that our method achieves very competitive performance on the four widely used benchmark datasets: MS-COCO, Flickr30K, ActivityNet-captions and MSR-VTT.
2 Related Work
Cross-Modal Matching. Cross-modal matching has a variety of applications, such as Image-Text matching [6, 30], Video-Text matching [gan2016recognizing, 28, 20], Sketch-based image retrieval [3] etc. The key issue of cross-modal matching is measuring the similarity between different modal features. A common solution is to learn a shared embedding space where features of different modalities can be directly compared. In recent years, a variety of methods have been devoted to learning modality invariant features.
Lee et al. [16] proposed a stacked cross attention network for image-text matching, which measures the image-text similarity by aligning image regions and words. Li et al. [17] used graph convolutional network to generate relationship-enhanced image region features, then a global semantic reasoning network is performed to generate discriminative visual features that capture key objects and semantic concepts of a scene. Song et al. [28] introduced a polysemous instance embedding network that uses multi-head self-attention and residual learning to generate multiple representations of an instance. Liu et al. [20] proposed a collaborative expert (CE) framework for video-text matching, which generates dense representations for videos via aggregating information from different pre-trained models. Above embedding-based methods learn an advanced encoding network to generate richer semantic representations for different modalities, which make the matched pairs close to each other and the mismatched pairs far apart in the shared embedding space.
Metric Learning for Cross-Modal Matching. Another popular approach for cross-modal matching is to learn a loss function in the embedding space, which encourages the similarity of matched pairs larger than mismatched pairs. In recent years, a variety of metric learning methods have been proposed in both vision and language areas. However, most of existing metric learning methods are designed for unimodal matching, which cannot effectively model the relationship of features captured from different modalities [19]. Only few of metric learning methods have been implemented particularly for cross-modal matching [33, 19, 6].
Liong et al. [19] introduced a deep coupled metric learning that designs two nonlinear transformations to reduce the modality map. Frome et al. [7] proposed a deep visual-semantic embedding model mapping visual features and semantic features into a shared embedding space, using a hinge rank loss as the objective function. Faghri et al. [6] introduced a variant triplet loss for image-text matching, and reported improved results. Xu et al. [33] introduced a modality classifier to ensure that the transformed features are statistically indistinguishable. However, these methods treat positive and negative pairs equally. Hardly any advanced sampling and weighting mechanism has been proposed for cross-modal matching. In this work, we present a universal weighting framework for cross-modal matching, which assigns a larger weight value to a harder sample.
3 The Proposed Approach
In this section, we formulate the sampling problem of cross-modal matching as a general weighting formulation. The proposed polynomial loss will be elaborated afterward.
3.1 Problem Statement
Let be a visual feature vector, be a text feature vector, be a training set of cross-modal instance pairs. In general, components of an instance pair come from different modalities. For simplicity, we refer to as a positive pair and as a negative pair. Given a query instance, the goal of cross-modal matching is to find a sample that matches it in another modality gallery. In the case of image-text matching, given an image caption , the goal is to find the most relevant image in the image gallery. It is important to note that in the cross-modal matching task, there is only one positive sample for each anchor in a mini-batch. Previous work for cross-modal matching focused on building a shared embedding space that contains both the image and text. The core idea behind these methods is that there exists a mapping function, to measure the similarity score between the visual features and the text features . is the parameter of . In general, the similarity score of the positive pair is higher than the negative pair by a margin, it can be formulated as:
| (1) |
| (2) |
where is a fixed margin.
Since cross-modal matching is a mutual retrieval problem, the widely used triplet loss is formulated as :
| (3) |
where is positive pair, ) is the hardest negative pair for a query , and is the hardest negative pair for a query caption . . However, these methods discard pairs with less information than the hardest pair, while treating positive pairs and negative pairs equally. To our best knowledge, there is no advanced sampling and weighting method for cross-modal matching.
3.2 Universal Weighting Framework for Cross-Modal Matching
Let be the set of similarity scores for all negative pairs of a sample , and be the set of similarity scores for all negative pairs of a sample . Most existing hinge-based loss functions can be formulated as a function of similarity scores: . Current existing weighting methods are given a special function to represent the relationship between weight values and similarity scores, the form of the function varies from task to task. All these functions can be reformulated into a universal weighting framework:
| (4) |
where is the weight value of the positive pair, is the weight value of negative pairs. Both of and are a function of similarity scores, but in a different forms.
| (5) |
| (6) |
where is a function that represents the relationship between weight value and similarity score. Theoretically, can be a function of self-similarity and relative similarity. The form of is various, but it should satisfy a basic rule: as the positive pairs’ similarity score increases, its weight value decreases, and as the negative pairs’ similarity score increases, its weight value increases. As illustrated in Figure 2. It provides a powerful tool to analyze the interpretability of various loss functions through weight analysis. Eq. 4 is a general pair formulation, existing pair-based loss is one of its special cases.
3.3 Informative Pairs Mining
For cross-modal matching tasks, in a mini-batch, each anchor has only one positive sample, but many negative pairs. These negative pairs are redundant and most of them are less informative. Random sampling are difficult to select more informative pairs, resulting in the model is difficult to convergence and have a poor performance. It is urgent and important to develop efficient algorithms that can select informative negative pairs and discard less informative negative pairs. In this section, we select informative negative pairs by comparing the relative similarity scores between positive and negative pairs of an anchor. For a given anchor , we assume its positive sample is , negative samples is , and a negative pair is selected if satisfies the condition:
| (7) |
where is a fixed margin. As illustrated in Figure 3. Note that there only one positive sample for each anchor in a mini-batch.
3.4 Polynomial Loss for Cross-Modal Matching
Through the above steps, negative pairs with more informative pairs can be selected and less informative pairs can be discarded. In this section, we introduce a new weighting function to weight the selected pairs. Theoretically, can be a function of self-similarity and relative similarity. However, the more complex the , the more hyper-parameters it contains, and the hyper-parameters setting is more difficult. In this paper, to reduce the number of hyper-parameters, we define as a function of self-similarity. Specifically, given a selected positive pair , its weight can be formulated as:
| (8) |
where is the similarity score, is hyper-parameters, is positive integer. The form of is diverse, but its value should decrease with the increase of similarity score . Its trend should conform to the curve in figure 2a.
The weight for a selected negative pair can be formulated as:
| (9) |
where is similarity score, is hyper-parameters, and is positive integer. The form of is diverse, but its trend should conform to the curve in figure 2b.
Through Eq. 8 and 9, we obtain the weights of positive and negative pairs. In this paper, we introduce two different functions, average polynomial loss and maximum polynomial loss.
Avg Polynomial Loss. Average polynomial loss can be defined as:
| (10) |
Eq. 10 can be reformulated as:
| (11) |
here, and denote the number of negative pairs of sample and respectively. and are the highest power of positive and negative pairs, respectively. Note, we make the minimum of and to 0, and , .
For cross-modal matching tasks, only one positive sample for each anchor in a mini-batch. Our loss function can make full use of informative negative pairs. Since cross-modal matching tasks involve the mutual retrieval between different modalities, our loss comprises two terms. The former term represents the loss of image retrieval caption, and the latter represents the loss of caption retrieval image. Since the form of a polynomial function is flexible, our polynomial loss has a better generalization.
Max Polynomial Loss. To further highlight the superiority of our weighting mechanism, we introduce another version of polynomial loss , which only contains the hardest negative pair. The formulation of is defined as:
| (12) |
here, and represent the hardest negative pair of sample and respectively. Eq.12 can be reformulated as:
| (13) |
Both and can be minimized with gradient descent optimization. More discussions about and can be found in the subsection of experiments.
4 Experiments
In this section, we conducted extensive experiments to evaluate the proposed polynomial loss in both image-text matching and video-text matching tasks. Following the [28, 16], we use the Recall@K as the performance metrics for both image-text matching and video-text matching tasks, which indicates the percentage of queries for which the model returns the correct item in its top K results. Ablation studies are conducted to analyze the effectiveness of proposed polynomial loss. We set the margin in Eq. 7 to 0.2 for all experiments.
| Methods | Loss Function | Image-to-Text | Text-to-Image | ||||
|---|---|---|---|---|---|---|---|
| R@1 | R@5 | R@10 | R@1 | R@5 | R@10 | ||
| RRF [21] | Triplet | 47.6 | 77.4 | 87.1 | 35.4 | 68.3 | 79.9 |
| VSE++ [6] | Triplet | 52.9 | 80.5 | 87.2 | 39.6 | 70.1 | 79.5 |
| DAN [23] | Triplet | 55.0 | 81.8 | 89.0 | 39.4 | 69.2 | 79.1 |
| SCO [13] | Triplet+NLL | 55.5 | 82.0 | 89.3 | 41.1 | 70.5 | 80.1 |
| SCAN (I2T) [16] | Triplet | 67.9 | 89.0 | 94.4 | 43.9 | 74.2 | 82.8 |
| SCAN (I2T) | Max Polynomial Loss | 69.4 | 89.9 | 95.4 | 47.5 | 75.5 | 83.1 |
| Methods | Loss Function | Image-to-Text | Text-to-Image | ||||
|---|---|---|---|---|---|---|---|
| R@1 | R@5 | R@10 | R@1 | R@5 | R@10 | ||
| 1K Test images | |||||||
| VSE++ [6] | Triplet | 64.6 | 89.1 | 95.7 | 52.0 | 83.1 | 92.0 |
| GXN [9] | Triplet | 68.5 | - | 97.9 | 56.6 | - | 94.5 |
| PVSE [28] | Triplet++ | 69.2 | 91.6 | 96.6 | 55.2 | 86.5 | 93.7 |
| SCAN (I2T) [16] | Triplet | 69.2 | 93.2 | 97.5 | 54.4 | 86.0 | 93.6 |
| SCAN (I2T) | Max Polynomial Loss | 71.1 | 93.7 | 98.2 | 56.8 | 86.7 | 93.0 |
| 5K Test images | |||||||
| VSE++ [6] | Triplet | 41.3 | 71.1 | 81.2 | 30.3 | 59.4 | 72.4 |
| GXN [9] | Triplet | 42.0 | - | 84.7 | 31.7 | - | 74.6 |
| PVSE [28] | Triplet++ | 45.2 | 74.3 | 84.5 | 32.4 | 63.0 | 75.0 |
| SCAN (I2T) [16] | Triplet | 46.4 | 77.4 | 87.2 | 34.4 | 63.7 | 75.7 |
| SCAN (I2T) | Max Polynomial Loss | 46.9 | 77.7 | 87.6 | 34.4 | 64.2 | 75.9 |
4.1 Implementation Details
Image-Text Matching. We evaluate our polynomial loss on two standard benchmarks: MS-COCO [18] and Flickr30K [37]; MS-COCO dataset contains 123,287 images, and each image comes with 5 captions. We mirror the data split setting of [16]. More specifically, we use 113,287 images for training, 5,000 images for validation and 5,000 images for testing. We report results on both 1,000 test images (averaged over 5 folds) and full 5,000 test images. Flickr30K dataset contains 31,783 images, each image is annotated with 5 sentences. Following the data split of [16], we use 1,000 images for validation, 1,000 images for testing and the remaining for training.
Our implementation follows the practice in Stacked Cross Attention Network (SCAN) [16]. SCAN maps image regions and words into a shared embedding space to measure the similarity score between an image and a caption. For fair comparison, we keep the network structure unchanged and replace the loss function with polynomial loss. There are two inputs for SCAN, a set of image features which extracted by a pretrained Faster-RCNN model [1] with ResNet-101 [10], and a set of word features which encoded by a bi-directional Gated Recurrent Unit (GRU) [24]. Models are trained from scratch using Adam [14] with batch size of 128 for both datasets. For MS-COCO, we start training with learning rate 0.0005 for 10 epochs, and then lower it to 0.00005 for another 10 epochs. For Flickr30K, the learning rate is 0.0002 for 15 epochs, and then lower it to 0.00002 for another 15 epochs. There are two sets of parameters in the polynomial loss, and . We adopt a heuristic method to select hyper-parameters. Concretely, we first initialize the to ensure that its curve conforms to the trend in Figure 2. Then, a grid search technology is adopted to select hyper-parameters. We set , , and for MS-COCO and , , , for Flickr30K.
Video-Text Matching. We evaluate our polynomial loss on two popular datasets: ActivityNet-captions [15] and MSR-VTT [32]. ActivityNet-captions contains 20K videos, and each video comes with 5 text descriptions. We follow the data split of [20], 10,009 videos for training and 4,917 for testing. MSR-VTT contains 10K videos and each video is associated with about 20 sentences. We follow the data split of [20], 6,513 videos for training, and 2,990 videos for testing.
| Methods | Loss Function | Video-to-Text | Text-to-Video | ||||
|---|---|---|---|---|---|---|---|
| R@1 | R@5 | R@10 | R@1 | R@5 | R@10 | ||
| DENSE [15] | Cross-entropy | 18.0 | 36.0 | 74.0 | 14.0 | 32.0 | 65.0 |
| HSE (4SEGS) [38] | Multi-loss | 18.7 | 48.1 | - | 20.5 | 49.3 | - |
| CE [20] | Triplet | 27.9 | 61.6 | 95.0 | 27.3 | 61.1 | 94.4 |
| CE | Max Polynomial Loss | 27.9 | 61.9 | 94.1 | 28.5 | 62.6 | 94.9 |
| Methods | Loss Function | Video-to-Text | Text-to-Video | ||||
|---|---|---|---|---|---|---|---|
| R@1 | R@5 | R@10 | R@1 | R@5 | R@10 | ||
| Minthum wt al. [22] | Cross-entropy | 12.5 | 32.1 | 42.4 | 7.0 | 20.9 | 29.7 |
| W2VV [4] | Multi-loss | 11.8 | 28.9 | 39.1 | 6.1 | 18.7 | 27.5 |
| Dual encoding [5] | Triplet | 13.0 | 30.8 | 43.3 | 7.7 | 22.0 | 31.8 |
| CE [20] | Triplet | 34.4 | 64.6 | 77.0 | 22.5 | 52.1 | 65.5 |
| CE | Max Polynomial Loss | 36.2 | 71.5 | 82.2 | 25.0 | 55.4 | 68.2 |
We report results on video-text matching task with Collaborative Experts (CE) [20] framework. CE is a framework that aggregated various pretrained features of a video into a dense representation before mapping to the shared embedding space. We keep the network structure unchanged and replace the loss function with polynomial loss. Models are trained from scratch using Adam [14] with batch size of 64 for both datasets. The learning rate is set to 0.0004. There are two sets of parameters in the polynomial loss, and . We set , , and for ActivityNet-captions and , , , for MSR-VTT.
4.2 Image-Text Matching Results
For image-text matching task, we compare the performance of our method with the several state-of-the-art methods, including: PVSE [28], VSE++ [6], SCO [13], RRF [21], DAN [23], GXN [9]and SCAN [16]. Table 1 and Table 2 summarize the results of our method on the Flickr30K and MS-COCO datasets, respectively. We also list the loss function used by various methods. From the table, we can make the following observations:
-
•
From Table 1, we find the proposed method outperforms the baseline SCAN at all metrics. Compared with the classical triplet loss, the performance of SCAN with polynomial loss improves R@1 by 3.6% for text to image retrieval and 1.5% for image to text retrieval on Flickr30K.
-
•
Table 2 summarizes the results on MS-COCO dataset. From Table 2, we can observe that the proposed method outperforms the state-of-the-art approaches, especially for R@1. By replacing the triplet loss with our , the performance of SCAN improves 1.9% on image to text retrieval (R@1) and 2.4% on text to image retrieval (R@1) on 1K test images.
-
•
Classical triplet loss tries to sample the informative pairs from redundant pairs, but treats positive and negative pairs equally. In contrast to it, the proposed polynomial loss assigns appropriate weight value to the positive and negative pairs, and the weight value is related to its similarity score. The proposed method can simultaneously select and weight informative pairs. Extensive experimental results demonstrated that the proposed polynomial loss improved the matching performance effectively.
4.3 Video-Text Matching Results
We evaluate the effectiveness of our method on two standard benchmarks: ActivityNet-captions and MSR-VTT. We report our results and comparison with current state-of-the-art methods for video-to-text and text-to-video retrievals. The results are summarized in the Table 3 and Table 4 for ActivityNet-captions and MSR-VTT datasets, respectively.
In order to promote a comprehensive comparison, we list existing state-of-the-art results on these datasets, including: DENSE [15], HSE [38], CE [20] for ActivityNet-captions dataset and Minthum et al. [22], W2VV [4], CE [20] and Dual encoding [5] for MSR-VTT dataset. Furthermore, we list the loss function used by various methods. From Table 3 and Table 4, we can observe that our method outperforms the baselines on all measures, and achieves the new state-of-the-art performance on the video-text matching task. When compared with CE (Triplet) which uses the same video and sentence encoders with our method, our method improves 2.5% on text-to-video (R@1) task on the MSR-VTT dataset. Our method outperforms the CE on all metrics on the ActivityNet-captions dataset. The performance gap between CE (Triplet) and CE (Max Polynomial Loss) shows the effectiveness of our polynomial Loss.
4.4 Ablation Study
Parameter Analysis. There are two sets of parameters in the polynomial loss, and . It is worth exploring to seek a set of parameters to make the model converge faster and achieves better performance. Since the number of hyper-parameters is too large, it is almost impossible to analyze the sensitivity of the hyper-parameters one by one, so we mainly analyze the sensitivity of several hyper-parameters with great influence. and respectively determines the highest power of and , which has a direct impact on the number of hyper-parameters. Therefore, we first fixed them to 2. In practice, we find that model performance is most sensitive to parameters , thus we mainly analyze the sensitivity of parameters . We test the effect of and by fixing , results are summarized in Table 5. and impact the hard level of negative pairs, the model is sensitive to different values. However, all of these combinations outperform the baseline, which demonstrates the superiority of our approach.
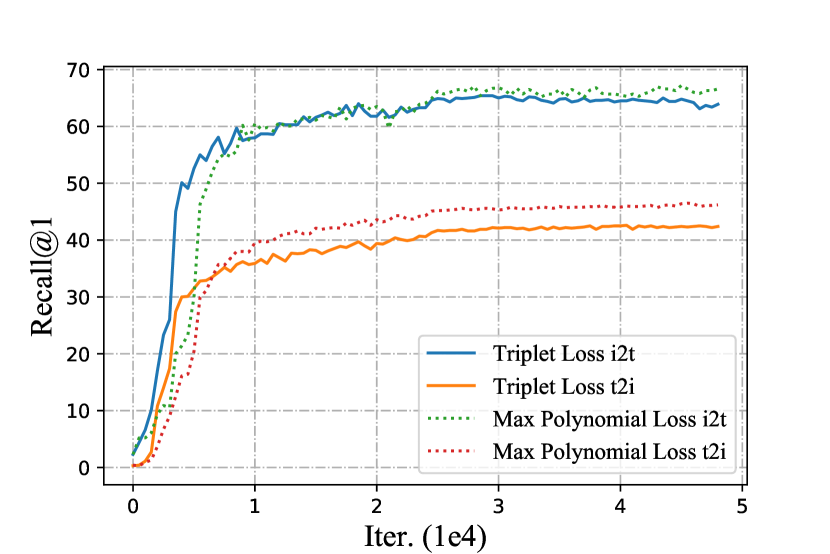
Triplet Loss vs. Max Polynomial Loss. Triplet loss is the most frequently used loss function for cross-modal matching tasks. Its effectiveness has been proved by many works, such as [6]. In this section, we further analyze the effectiveness of the proposed polynomial weighting mechanism. Max polynomial loss only includes the hardest negative pairs, which can be considered as a weighted version of triplet loss. We compare the max polynomial loss with triplet loss on MS-COCO dataset, the results are shown in Figure 4. From the results, we find the max polynomial loss converges faster than triplet loss and achieves a better result, which proven the superiority of our polynomial weighting mechanism.
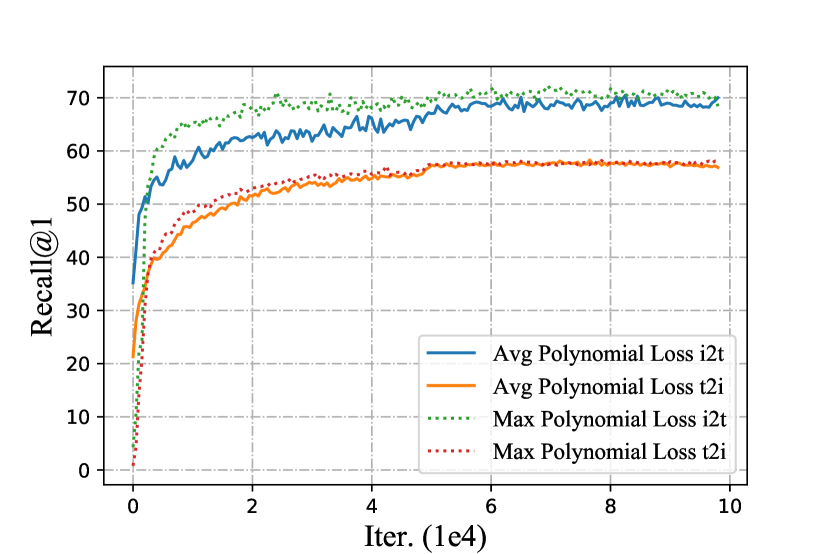
Max vs. Avg Ploynomial Loss. In this section, we further analyze the effectiveness of the proposed Max and Avg polynomial loss. Max polynomial loss weights the positive pair and the hardest negative pair for each anchor, which can be considered as a weighted version of the hardest triplet loss. In contrast, average polynomial loss contains all of informative negative pairs and assigns different weight values for them. Since the max polynomial loss only utilizes a subset of informative pairs so that its computational complexity is lower than the average polynomial loss which contains all of informative negative pairs.
| Tasks | 1.5 | 1.7 | 1.8 | 1.9 | |
|---|---|---|---|---|---|
| Video-to-Text | -0.2 | 36.0 | 35.5 | 36.1 | 35.5 |
| -0.3 | 34.6 | 35.0 | 36.2 | 35.6 | |
| -0.4 | 34.0 | 35.3 | 35.6 | 35.3 | |
| Text-to-Video | -0.2 | 25.0 | 25.0 | 24.8 | 25.0 |
| -0.3 | 24.8 | 24.9 | 25.0 | 24.8 | |
| -0.4 | 24.6 | 24.8 | 24.7 | 24.9 |
Figure 5 shows the performance of two functions on MS-COCO dataset. From the results, we find the average polynomial loss is converges faster than the max polynomial loss at the first few iterations. The reason is that the average polynomial loss contains more informative pairs. However, the final performance of max polynomial loss is slightly better than average polynomial loss. This is possibly due to the unreasonable parameter setting. Since average polynomial loss contains too many negatives pairs, it is difficult to find a set of parameters to fit all informative negative pairs.
4.5 Qualitative Results
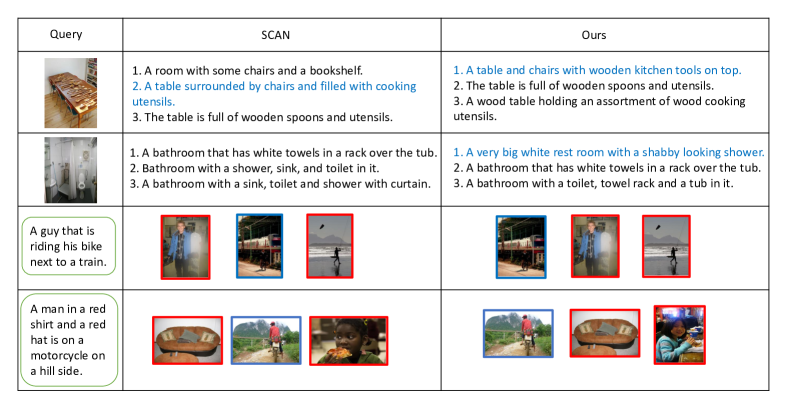
In this section, we perform visualizations Top-3 retrieval results for a handful of examples on MS-COCO. Both qualitative results of the image-to-text retrieval and the text-to-image retrieval are shown in Figure 6, which qualitatively illustrate the model behavior. Predictions are ordered by decreasing similarity score, with correct labels are shown in blue. From Figure 6, we can observe that by replacing the loss function with our polynomial loss, the performance of SCAN is further improved.
5 Conclusion
We have developed a universal weighting framework for cross-modal matching, which defines a weight function for the positive and negative pairs respectively. Universal weighting framework provides a powerful tool to analyze the interpretability of various loss functions. Furthermore, we proposed a polynomial loss function under the universal weighting framework, which can effectively sample and weight the informative pairs. Experimental results on four cross-modal matching benchmarks have demonstrated the proposed polynomial loss significantly improve the matching performance. In future work, we would like to investigate the potential of more advanced weighting functions for cross-modal matching.
Acknowledgments. This work was supported in part by the National Key Research and Development Program of China (No. 2018AAA0102200); the National Natural Science Foundation of China (No. 61976049 and No. 61632007); the Fundamental Research Funds for the Central Universities (No. ZYGX2019Z015); the Sichuan Science and Technology Program, China, (No. 2019ZDZX0008 and No. 2018GZDZX0032).
References
- [1] Peter Anderson, Xiaodong He, Chris Buehler, Damien Teney, Mark Johnson, Stephen Gould, and Lei Zhang. Bottom-up and top-down attention for image captioning and visual question answering. In CVPR, 2018.
- [2] Hui Cui, Lei Zhu, Jingjing Li, Yang Yang, and Liqiang Nie. Scalable deep hashing for large-scale social image retrieval. IEEE Transactions on Image Processing, 29:1271–1284, 2019.
- [3] Sounak Dey, Pau Riba, Anjan Dutta, Josep Llados, and Yi-Zhe Song. Doodle to search: Practical zero-shot sketch-based image retrieval. In CVPR, 2019.
- [4] Jianfeng Dong, Xirong Li, and Cees GM Snoek. Predicting visual features from text for image and video caption retrieval. IEEE Transactions on Multimedia, 2018.
- [5] Jianfeng Dong, Xirong Li, Chaoxi Xu, Shouling Ji, and Xun Wang. Dual dense encoding for zero-example video retrieval. arXiv, 2018.
- [6] Fartash Faghri, David J Fleet, Jamie Ryan Kiros, and Sanja Fidler. Vse++: Improving visual-semantic embeddings with hard negatives. In BMVC, 2018.
- [7] Andrea Frome, Greg S Corrado, Jon Shlens, Samy Bengio, Jeff Dean, Marc’Aurelio Ranzato, and Tomas Mikolov. Devise: A deep visual-semantic embedding model. In NIPS, 2013.
- [8] Lianli Gao, Xiangpeng Li, Jingkuan Song, and Heng Tao Shen. Hierarchical lstms with adaptive attention for visual captioning. IEEE transactions on pattern analysis and machine intelligence, 2019.
- [9] Jiuxiang Gu, Jianfei Cai, Shafiq R Joty, Li Niu, and Gang Wang. Look, imagine and match: Improving textual-visual cross-modal retrieval with generative models. In CVPR, 2018.
- [10] Kaiming He, Xiangyu Zhang, Shaoqing Ren, and Jian Sun. Deep residual learning for image recognition. In CVPR, 2016.
- [11] Elad Hoffer and Nir Ailon. Deep metric learning using triplet network. In Similarity-based Pattern Recognition, 2015.
- [12] Mengqiu Hu, Yang Yang, Fumin Shen, Ning Xie, Richang Hong, and Heng Tao Shen. Collective reconstructive embeddings for cross-modal hashing. IEEE Transactions on Image Processing, 28(6):2770–2784, 2018.
- [13] Yan Huang, Qi Wu, Chunfeng Song, and Liang Wang. Learning semantic concepts and order for image and sentence matching. In CVPR, 2018.
- [14] Diederik P Kingma and Jimmy Ba. Adam: A method for stochastic optimization. In ICLR, 2015.
- [15] Ranjay Krishna, Kenji Hata, Frederic Ren, Li Fei-Fei, and Juan Carlos Niebles. Dense-captioning events in videos. In ICCV, 2017.
- [16] Kuang-Huei Lee, Xi Chen, Gang Hua, Houdong Hu, and Xiaodong He. Stacked cross attention for image-text matching. In ECCV, 2018.
- [17] Kunpeng Li, Yulun Zhang, Kai Li, Yuanyuan Li, and Yun Fu. Visual semantic reasoning for image-text matching. In ICCV, 2019.
- [18] Tsung-Yi Lin, Michael Maire, Serge Belongie, James Hays, Pietro Perona, Deva Ramanan, Piotr Dollár, and C Lawrence Zitnick. Microsoft coco: Common objects in context. In ECCV, 2014.
- [19] Venice Erin Liong, Jiwen Lu, Yap-Peng Tan, and Jie Zhou. Deep coupled metric learning for cross-modal matching. IEEE Transactions on Multimedia, 2016.
- [20] Yang Liu, Samuel Albanie, Arsha Nagrani, and Andrew Zisserman. Use what you have: Video retrieval using representations from collaborative experts. In BMVC, 2019.
- [21] Yu Liu, Yanming Guo, Erwin M Bakker, and Michael S Lew. Learning a recurrent residual fusion network for multimodal matching. In ICCV, 2017.
- [22] Niluthpol Chowdhury Mithun, Juncheng Li, Florian Metze, and Amit K Roy-Chowdhury. Learning joint embedding with multimodal cues for cross-modal video-text retrieval. In ACM MM, 2018.
- [23] Hyeonseob Nam, Jung-Woo Ha, and Jeonghee Kim. Dual attention networks for multimodal reasoning and matching. In CVPR, 2017.
- [24] Mike Schuster and Kuldip K Paliwal. Bidirectional recurrent neural networks. IEEE Transactions on Signal Processing, 1997.
- [25] Fumin Shen, Xiang Zhou, Jun Yu, Yang Yang, Li Liu, and Heng Tao Shen. Scalable zero-shot learning via binary visual-semantic embeddings. IEEE Transactions on Image Processing, 28(7):3662–3674, 2019.
- [26] Heng Tao Shen, Luchen Liu, Yang Yang, Xing Xu, Zi Huang, Fumin Shen, and Richang Hong. Exploiting subspace relation in semantic labels for cross-modal hashing. IEEE Transactions on Knowledge and Data Engineering, 2020.
- [27] Jingkuan Song, Yuyu Guo, Lianli Gao, Xuelong Li, Alan Hanjalic, and Heng Tao Shen. From deterministic to generative: Multimodal stochastic rnns for video captioning. IEEE transactions on neural networks and learning systems, 30(10):3047–3058, 2018.
- [28] Yale Song and Mohammad Soleymani. Polysemous visual-semantic embedding for cross-modal retrieval. In CVPR, 2019.
- [29] Bokun Wang, Yang Yang, Xing Xu, Alan Hanjalic, and Heng Tao Shen. Adversarial cross-modal retrieval. In ACM MM, pages 154–162, 2017.
- [30] Tan Wang, Xing Xu, Yang Yang, Alan Hanjalic, Heng Tao Shen, and Jingkuan Song. Matching images and text with multi-modal tensor fusion and re-ranking. In ACM MM, 2019.
- [31] Jiwei Wei, Yang Yang, Jingjing Li, Lei Zhu, Lin Zuo, and Heng Tao Shen. Residual graph convolutional networks for zero-shot learning. In Proceedings of the ACM Multimedia Asia on ZZZ, pages 1–6. 2019.
- [32] Jun Xu, Tao Mei, Ting Yao, and Yong Rui. Msr-vtt: A large video description dataset for bridging video and language. In CVPR, 2016.
- [33] Xing Xu, Li He, Huimin Lu, Lianli Gao, and Yanli Ji. Deep adversarial metric learning for cross-modal retrieval. World Wide Web, 2019.
- [34] Xing Xu, Huimin Lu, Jingkuan Song, Yang Yang, Heng Tao Shen, and Xuelong Li. Ternary adversarial networks with self-supervision for zero-shot cross-modal retrieval. IEEE transactions on cybernetics, 2019.
- [35] Xing Xu, Fumin Shen, Yang Yang, Heng Tao Shen, and Xuelong Li. Learning discriminative binary codes for large-scale cross-modal retrieval. IEEE Transactions on Image Processing, 26(5):2494–2507, 2017.
- [36] Yang Yang, Jie Zhou, Jiangbo Ai, Yi Bin, Alan Hanjalic, Heng Tao Shen, and Yanli Ji. Video captioning by adversarial lstm. IEEE Transactions on Image Processing, 27(11):5600–5611, 2018.
- [37] Peter Young, Alice Lai, Micah Hodosh, and Julia Hockenmaier. From image descriptions to visual denotations: New similarity metrics for semantic inference over event descriptions. In Transactions of the Association for Computational Linguistics, 2014.
- [38] Bowen Zhang, Hexiang Hu, and Fei Sha. Cross-modal and hierarchical modeling of video and text. In ECCV, 2018.
- [39] Lei Zhang, Ji Liu, Yang Yang, Fuxiang Huang, Feiping Nie, and David Zhang. Optimal projection guided transfer hashing for image retrieval. IEEE Transactions on Circuits and Systems for Video Technology, 2019.