Stochastic sampling effects favor manual over digital contact tracing
Abstract
Isolation of symptomatic individuals, tracing and testing of their nonsymptomatic contacts are fundamental strategies for mitigating the current COVID-19 pandemic. The breaking of contagion chains relies on two complementary strategies: manual reconstruction of contacts based on interviews and a digital (app-based) privacy-preserving contact tracing. We compare their effectiveness using model parameters tailored to describe SARS-CoV-2 diffusion within the activity-driven model, a general empirically validated framework for network dynamics. We show that, even for equal probability of tracing a contact, manual tracing robustly performs better than the digital protocol, also taking into account the intrinsic delay and limited scalability of the manual procedure. This result is explained in terms of the stochastic sampling occurring during the case-by-case manual reconstruction of contacts, contrasted with the intrinsically prearranged nature of digital tracing, determined by the decision to adopt the app or not by each individual. The better performance of manual tracing is enhanced by heterogeneity in agent behavior: superspreaders not adopting the app are completely invisible to digital contact tracing, while they can be easily traced manually, due to their multiple contacts. We show that this intrinsic difference makes the manual procedure dominant in realistic hybrid protocols.
I Introduction
The current COVID-19 pandemic is impacting daily life worldwide at an
unprecedented scale. Among the features that have contributed to
transform the emerging diffusion of SARS-CoV-2 coronavirus into such a
global scale crisis, a prominent role is played by the high rates of
virus transmission mediated by presymptomatic and asymptomatic
individuals Lavezzo2020 ; Ferretti2020 ; Rothe2020 ; Pinotti2020 ; Li2020 ; wei2020presymptomatic .
Given the absence of effective
pharmaceutical interventions, this feature makes the mitigation of the pandemic a highly nontrivial
task, that has been tackled with various strategies, none of them
devoid of drawbacks.
Initially, governments resorted to very restrictive limitations of non
strictly necessary activities (lock-downs) to curb the diffusion of
the infection. Such measures turned out to be effective from an
epidemiological point of view, but exceedingly costly in other
respects, for their economic and social
consequences Bonaccorsi2020 ; Nicola2020 . Recently, such
restrictive measures have been progressively lifted, and
we now rely on other tools to contain the pandemic: social distancing,
reinforced hygiene and the use of individual protection devices. Along
with these provisions, aimed at preventing single virus transmission
events, another set of measures points at breaking contagion chains:
the isolation of infected individuals (symptomatic or found via some
testing), followed by the tracing of their contacts (contact tracing,
CT), the testing of the latter and the possible isolation of the
infected Eames2003 ; Fraser2004 ; Klinkenberg2006 ; kojaku2020 .
This CT procedure has proven effective in the past in various
contexts Mclean2010 ; Crook2017 ; Bell2004 ; WilderSmith2020
but it comes, in its standard manual implementation, with important
limitations Hellewell2020 . It requires the set up of a
physical infrastructure, needed to find infected individuals,
interview them and reconstruct their contacts in a temporal window,
call these contacts, convince them to get tested and eventually
isolated. Apart from the evident problems of practical feasibility and
economic cost, the manual CT procedure intrinsically implies a
delay between the moment an individual is found infected (and
isolated) and the time her contacts are tested and possibly isolated.
For an epidemic such as COVID-19, characterized by a rather long
presymptomatic infectious stage and a high relevance of transmission
by asymptomatics, the delay implied by manual CT risks to undermine
the effectiveness of the whole procedure.
For this reason the additional strategy of a digital CT procedure,
based in particular on the installation of apps on smartphones
(app-based), has been proposed alongside manual CT Ferretti2020 . The rationale is
that proximity sensors installed on these ubiquitous devices allow the
detection of contacts of epidemiological significance among
individuals. When an individual is found infected, the app permits to
instantaneously trace all contacts in the recent past, thus allowing
for much quicker testing and isolation. A quantitative comparison
between manual and digital CT applied to an epidemiological model
describing COVID-19 diffusion suggested that already a delay of the
order of 3 days completely spoils the
ability of manual CT to prevent the initial exponential growth of the
epidemic Ferretti2020 . The conclusion was that only a digital
CT avoiding this delay could be a viable strategy to control the
current epidemic. The proposal for digital CT rapidly gained momentum,
leading to the development of technical
solutions PPCT2020 ; Troncoso2020 ; Oliver2020 and to the
deployment of app-based CT infrastructures in many
countries Ahmed2020 .
Many works have scrutinized the actual validity of this solution and investigated the possible shortcomings of app-based CT, casting doubts over many of the assumptions underlying such strategy Sapiezynski2020 ; Braithwaite2020 ; Zastrow2020 : there are too few modern enough smartphones; Bluetooth based proximity measurements are unreliable; co-location is not always a good proxy for epidemiological contact. The potential risks for privacy breaches have also been exposed.
Other papers have tried to evaluate the impact of digital CT on the current COVID-19 epidemic, attempting to precisely determine, by means of detailed data-driven epidemiological models, to what extent such a strategy is able to suppress virus diffusion Cencetti2020 ; Almagor2020 ; Nielsen2020 ; Kretzschmar2020 ; Barrat2020 . A critical role is played by the fraction of individuals in a population that actually use the app. Fairly high values of (of the order of ) are required for the digital CT protocol to lead to global protection Eames2003 ; Ferretti2020 ; Braithwaite2020 . These values are in striking contrast with the low app adoption rates observed so far in most countries Longo2020 ; MIT2020 ; MIT2020_2 .
In this paper we take a different approach. We compare the effectiveness of the two CT protocols in exactly the same conditions, i.e., in the very same realistic epidemiological scenario, without making claims on their absolute performance, and we estimate their relative contribution in realistic hybrid protocols, where the two strategies are complementary. We consider a sensible epidemiological model incorporating all main ingredients of the current epidemic, with parameters tuned to values derived from empirical observations about COVID-19 spreading. Within this single framework we consider the impact of both manual and digital CT strategies, working in similar manner but with their own specific features: delayed isolation of contacts, limited scalability and imperfect recall for the manual procedure; dependence on the predetermined app adoption decision for the digital CT.
The comparison reveals that even when the number of reconstructed contacts is the same, manual CT performs better than digital CT in practically all realistic cases. The manual protocol is more efficient in increasing the epidemic threshold (i.e., the value of the effective infection rate above which the infection spreads diffusely), in limiting the height of the epidemic peaks and in reducing the number of isolated individuals. This surprising result is due to the stochastic annealed nature of the manual CT procedure, in which each symptomatic node randomly recalls a fraction of her contacts, in contrast with the digital CT where the traced nodes belong deterministically to the prearranged quenched fraction of the population adopting the app. In the latter case, the individuals not adopting the app can never be reached by the CT protocol, while the entire population is potentially detectable through the stochastic sampling of the manual procedure. The better performance of manual CT is already evident in homogeneous populations and it is strongly enhanced in the presence of a heterogeneous distribution of contacts. Superspreaders not adopting the app are invisible to the digital tracing while they are very likely to be detected by a manual tracing originating from one of their many contacts. In a realistic setup where both protocols are adopted simultaneously, manual CT leads to a considerable reduction of the transmission even considering delays and scalability, while the digital protocol produces a relevant contribution only for large adoption rates, as suggested by previous literature.
II Results
II.1 Epidemic spreading on heterogeneous dynamical networks
We consider an activity-driven network model with attractiveness, taking into account both the temporal dynamics of social contacts and the heterogeneity in the propensity to establish social ties Perra2012 ; Ubaldi2016 ; Pozzana2017 ; Tizzani2018 . Each susceptible node is assigned with an activity and an attractiveness parameter , drawn from the joint distribution : the activation rate describes the Poissonian activation dynamics of the node; the attractiveness sets the probability for a node to be contacted by an active agent. At the beginning all nodes are disconnected and when a node activates it creates links with randomly selected nodes (hereafter we set ); then all links are destroyed and the procedure is iterated. The functional form of encodes the correlations between activity and attractiveness in a population with a given distribution of activity. It has been observed that several social systems feature positive correlations between activity and attractiveness and a broad power-law distribution of activity Tizzani2018 ; Perra2012 ; Pozzana2017 ; Ubaldi2016 ; Ghoshal2006 ; Ubaldi2017 ; Starnini2013 :
| (1) |
with typically ranging between and .
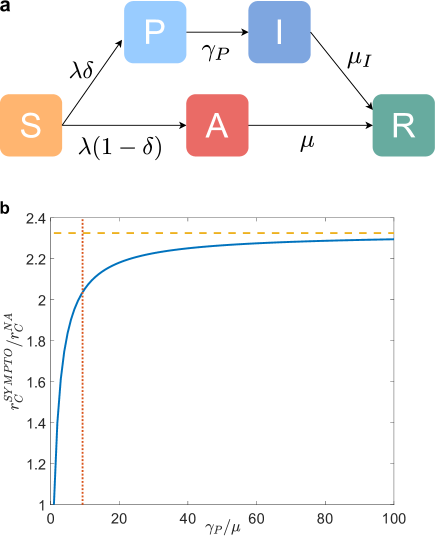
On top of the activity-driven dynamics, we consider a compartmental epidemic model which includes the main phases of clinical progression of the SARS-CoV-2 infection wei2020presymptomatic ; Guan2020 ; DiDomenico2020 ; who_china_report , also applicable to other infectious diseases with asymptomatic and presymptomatic transmission. The model is composed by five compartments: susceptible, presymptomatic, infected asymptomatic, infected symptomatic, recovered. A contagion process (see Fig. 1a) occurs with probability when a link is established between an infected (either , and ) and a susceptible node (contact-driven transition): a node has probability to become presymptomatic after infection and probability to become asymptomatic, thus and . A presymptomatic node spontaneously develops symptoms with rate , thus with a Poissonian process ; both asymptomatic and symptomatic nodes spontaneously recover respectively with rate and with rate , so that the average infectious period for both symptomatic and asymptomatic is . We neglect states of hospitalization and consider recovery without death: this choice does not affect the infection dynamics.
Adaptive behavior of populations exposed to epidemics can be modelled within the activity-driven network framework: infected nodes experience a reduction in activity, due to isolation or the appearance of symptoms; similarly, other individuals undertake self-protective behavior to reduce the probability of contact with an infected node, and this is modelled as a reduction in the attractiveness of infected nodes Vankerkove2013 ; Mancastroppa2020 ; Fenichel2010 . We assume that symptomatic infected nodes are immediately isolated , therefore not being able to infect anymore. On the contrary, we assume that recovered , asymptomatic and presymptomatic individuals behave as when they were susceptible . The adaptive behavior is implemented without affecting the activity of nodes which are not isolated Mancastroppa2020 .
The control parameter is the effective infection rate, whose critical value – the epidemic threshold – sets the transition point between the absorbing and the active phase of the epidemic. The increase in the value of is an indicator of the effectiveness of mitigation strategies. Within the adaptive activity-driven framework, the epidemic threshold can be calculated analytically via a mean-field approach (see Methods).
The effect of isolating symptomatic nodes as the only containment measure is shown in Fig. 1b. We compare the epidemic threshold , obtained with the isolation of symptomatic nodes only, with the epidemic threshold of the non-adaptive (NA) case, in which no containment measures are taken on infected individuals, as a function of (see Methods for the explicit expression). In the case of instantaneous symptoms development (), the threshold is increased by a factor of , while for smaller the gain is reduced. For example, for , that is of asymptomatic individuals, days and days as observed for SARS-CoV-2 (see Methods for details on the parameters used in all figures), the threshold is doubled by the isolation of symptomatic nodes. This is the baseline reference for the evaluation of the performance of CT strategies.
II.2 Manual and digital contact tracing protocols
The CT protocols differ in their practical implementation as well in their exploration properties.
Manual tracing is performed by personnel who, through interviews, collects information, contacts individuals who may have been infected and arranges for testing. In manual CT, as soon as an individual develops symptoms (i.e. ), her contacts in the previous days are traced with recall probability , where is the activity of the symptomatic individual. A traced contact is tested and, if found in state (infected asymptomatic), isolated (): the average time between the isolation of the symptomatic individual and the isolation of her asymptomatic infected contacts is . Such delay can be quite large, due to the time required for the collection of the diary, the execution of the diagnostic test and the subsequent isolation Ferretti2020 ; Hellewell2020 . Moreover, the manual protocol depends on , which takes into account the limited resources allocated for tracing and the limited memory/knowledge of symptomatic individuals in reconstructing their contacts. Low activity nodes make few contacts over time and a fraction of their contacts will be traced; on the other hand high activity nodes will only remember a finite number of their contacts so that, also because of limitations of the tracing capacity, we expect that at most a number of contacts can be traced ECDC_ct ; CDC_ct . This translates into the limited scalability property:
| (2) |
where . Manual CT also
suffers from a global scalability limitation. Indeed in the active
phase with a large number of infected individuals, the tracing
system could be ineffective due to the excessive number of contacts
to be followed. However, here we focus on the epidemic threshold and
we evaluate the features of the CT procedure that keep the
epidemic spreading under control before widespread diffusion occurs.
Digital CT is based on the download of an app which allows the tracing of close contacts equipped with the same app. We assume that each of the individuals has a probability to download the app before the epidemic starts. As soon as an individual develops symptoms (i.e. ), if she downloaded the app, her contacts are traced only if they downloaded the app as well. A traced contact is tested and, if found in state (infected asymptomatic), is isolated (). The time passing between the isolation of a symptomatic individual and the isolation of her asymptomatic infected contacts is taken to be , thus assuming an idealized scenario of instantaneous notification and isolation. We finally consider a more realistic scenario where the two procedures are combined into a hybrid protocol in which digital CT supports manual CT, potentially reaching individuals not traced manually Troncoso2020 ; Cencetti2020 ; Barrat2020 . See Methods for details on the implementation of the CT protocols.
II.3 Stochastic vs. prearranged sampling
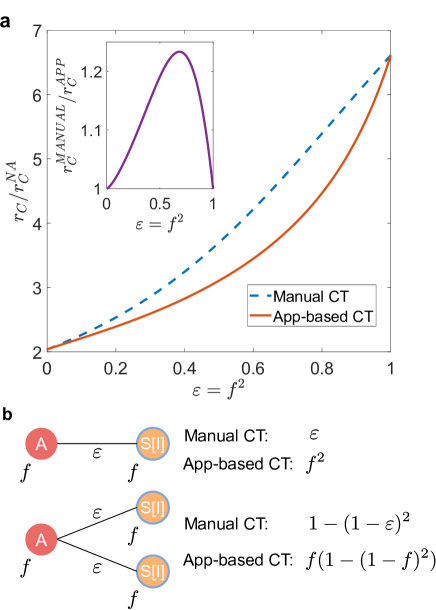
We first compare the manual and digital CT protocols in the case of a population with homogeneous activity and attractiveness, , without delay even in manual CT, i.e., . We set so that the probability that a single contact is traced in the two protocols is the same. However, it should be emphasized that typical values of range between and in many countries MIT2020_2 ; MIT2020 ; Longo2020 , while is usually larger (), since typically of contacts are close and occur at home, at work or at school and thus are easily traceable Mossong2008 ; Keeling2020 . An exact analytical estimate of the epidemic threshold is obtained through a linear stability analysis around the absorbing state (see Methods for explicit expressions and Supplementary Method 1 for detailed derivation): in Fig. 2a we compare the threshold for manual and app-based CT, compared to the non-adaptive case (NA), for realistic COVID-19 parameters. Both protocols feature the same epidemic threshold when and : indeed the former corresponds to the isolation of symptomatic individuals only, without CT, while the latter limit corresponds to the case in which all contacts are traced. For intermediates values of , manual tracing is strongly and surprisingly more effective than digital tracing, as it increases significantly the epidemic threshold, compared to the app-based protocol. Since we are considering no heterogeneity or delays, the difference is due only to sampling effects in the CT dynamics. In practice, in app-based CT the population to be tested is prearranged, based on whether or not the app was downloaded before the outbreak started. On the contrary, manual CT performs a stochastic sampling of the population: the random exploration can potentially reach the entire population, since anyone who has come in contact with a symptomatic node can be traced. The simplest example of the difference in tracing multiple infections processes in the two protocols is illustrated in Fig. 2b.
II.4 Effects of heterogeneous activity
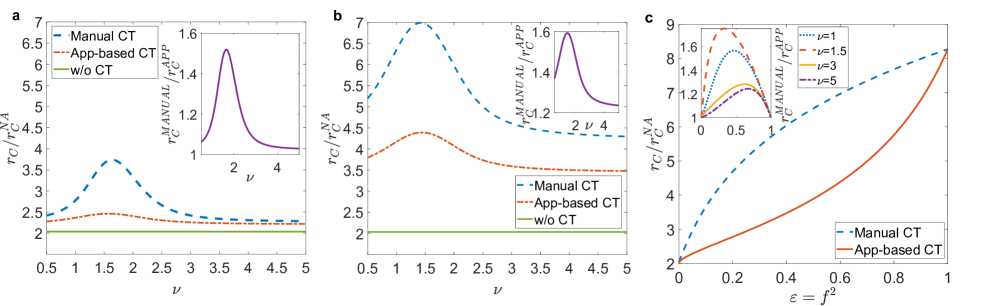
We now consider a heterogeneous activity distribution, as observed in several human systems, and we consider a positive activity-attractiveness correlation, as defined in Eq. (1) Perra2012 ; Pozzana2017 ; Ubaldi2016 ; Ghoshal2006 ; Ubaldi2017 ; Starnini2013 . The power-law distribution for the activity implies the presence of hubs with high activity and high attractiveness. We investigate the pure effect of heterogeneities in contact tracing Nielsen2020 ; kojaku2020 setting now and not considering delays in manual CT, . We perform again a mean-field approach, obtaining an analytical closed form for the epidemic threshold (see Methods and Supplementary Method 1): in Fig. 3 we compare the epidemic threshold with the two protocols as a function of the exponent of the activity distribution, for realistic parameters and setting an average activity days-1 Mossong2008 ; Vankerkove2013 . Both protocols are more effective in heterogeneous populations, that is at . Note that due to the cut-offs and the constraint on the average, the fluctuations of the activity distribution are maximum for , and the epidemic thresholds depend both on activity fluctuations and higher order moments of (see Methods and Supplementary Method 1 for details). However heterogeneity greatly amplifies stochastic effects, further increasing the advantage of the manual tracing over the app-based prearranged protocol. Indeed, in heterogeneous populations nodes with high activity and attractiveness (super-spreaders) drive and sustain the spread of the epidemic. Manual CT is far more effective in identifying and isolating them than app-based CT: in digital CT, hubs which have not downloaded the app will never be traced, despite the high number of their contacts. On the contrary, manual CT is very effective in tracing super-spreaders, because they are engaged in many contacts and are traced very effectively by stochastic exploration.
II.5 Limited scalability and delay in manual contact tracing
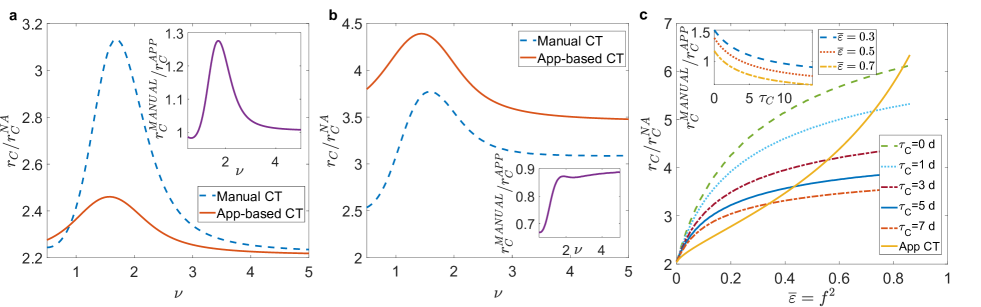
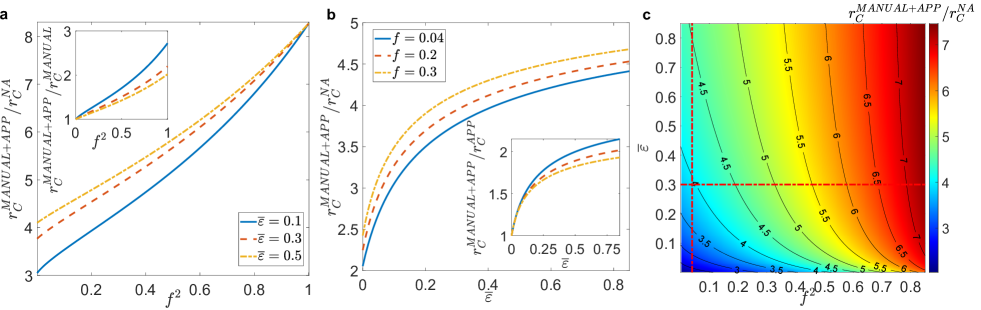
We now consider some features of manual CT that can reduce its effectiveness: the limited scalability of the tracing capacity ECDC_ct ; CDC_ct and the delays in CT and isolation Ferretti2020 ; Braithwaite2020 ; Kretzschmar2020 . We set as in Eq. (2) and consider a large delay days Ferretti2020 in manual CT. In Fig. 4 we compare the epidemic threshold for the two CT protocols, setting equal probabilities of tracing a contact , where . For small values of (note that this however corresponds to a quite large adoption rate ) manual CT is still more effective (see Fig. 4a): the delay in isolation and the limited scalability are not able to significantly reduce the advantage provided by the stochastic exploration of contacts. Fig. 4b shows that digital CT can become more effective than manual CT, but this occurs only for very large values of and . This indicates that for realistic settings, the advantage of the manual protocol over the app-based protocol is robust even including delays and limited scalability. Fig. 4c further illustrates for which (unrealistically large) values of and , digital CT outperforms manual CT. Note that realistic values of correspond to at most of the order of 0.1. Hence, an extremely high adoption of the app is necessary in order to obtain an effective advantage of the digital CT.
II.6 Manual and app-based CT in the epidemic phase
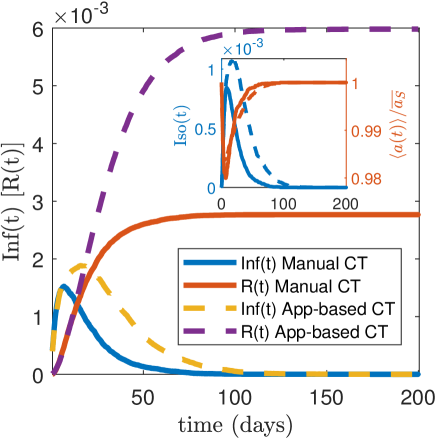
We now explore with numerical simulations (see Methods, Supplementary Method 2) the effects of manual and digital CT protocols in the active phase of the epidemic. We consider an optimistic value of , setting that is a very low value for the recall probability, and we consider the system above the epidemic threshold , in the conditions of Fig. 4a. Fig. 5 shows that the infection peak with manual tracing is lower than the app-based one. Moreover, in the manual CT the duration of the epidemic is reduced: this strongly impacts on the final epidemic size, which is about half of the one observed in the app-based CT. We also plot the temporal evolution of the average activity of the system and of the fraction of isolated nodes Iso(t) (see inset). In general, the average activity features a minimum, however its value remains very large (about of the case without any tracing measure). This implies that both protocols do not disrupt the functionality of the system. Interestingly, the fraction of isolated nodes is coherent with the infection peak, and in particular it is lower when the infection peak is lowered. This means that the most effective procedure, i.e. manual CT for realistic values of the parameters, not only lowers the infection peak but it is also able to isolate a smaller number of nodes, a key feature of any effective CT strategy.
II.7 Robustness
In the Supplementary Notes we show that the advantage of the manual CT is robust with respect to the relaxation of several assumptions and to changes of parameters. In particular, we consider the case where all nodes have equal attractiveness , we take into account very long delays and we change the maximum number of traceable contacts . We also show that the advantage of manual contact tracing in the presence of heterogeneous activity is robust, if one takes into account that contacts belonging to the close social circle of the index case (same household) are always traced and isolated manually, also in the digital protocol. This can be verified by using a hybrid procedure with a fixed small number of contacts always traced (see Supplementary Notes).
II.8 Hybrid contact tracing protocols: manual plus digital CT
We now consider the implementation of a realistic hybrid CT protocol with manual and digital contact tracing working at the same time. We assume that each individual has downloaded the app with probability before the epidemic starts. As soon as an individual with activity develops symptoms (i.e. ), contact tracing is activated with reference to the previous days: if the infected individual and also her contact downloaded the app, the contacted agent is immediately traced and isolated with no delay. Otherwise, the contact can only be traced manually, with probability (as in Eq. (2)) and, if found in state , the contact is isolated with a delay . We set a realistically large delay days.
The threshold in the hybrid case can be determined through the solution of a complex set of equations, that we solve numerically in Supplementary Method 1. In the presence of heterogeneous activity (i.e. superspreaders), starting form a purely digital protocol (Fig. 6b,c) the addition of manual contact tracing rapidly increases the threshold, leading to an improvement by a large factor (about 80%), for realistic values . Instead, starting from a realistic manual contact tracing setup , a significant improvement (i.e. a 50% of threshold increase) is obtained by implementing a digital contact tracing only if (Fig. 6a,c). These values are consistent with other results in the literature Eames2003 ; Ferretti2020 ; Braithwaite2020 ; however, in most countries, the app adoption rates do not reach these values Longo2020 ; MIT2020 ; MIT2020_2 .
III Discussion
Our results indicate that manual CT, despite its drawbacks, can be an efficient protocol in heterogeneous populations, more efficient than its digital counterpart, due to its specific sampling properties. This conclusion is robust with respect to variations in several model assumptions, including correlations between activity and attractiveness or the limited scalability of the manual CT protocol. However, epidemic propagation and strategies to mitigate it are very complex processes and several of their features have been left out from our modelling scheme. Some of these features (the possibility that isolation is non complete, that some individuals do not report symptoms or the existence of testing campaigns detecting infected nonsymptomatic individuals) act similarly on both types of CT and hence do not modify the relative performance. Other more realistic features (the presence of delays even in digital CT and the existence of additional sources of heterogeneity in viral shedding Liu2020 , recovery rates Arruda2020 and activity temporal patterns Mancastroppa2019 ) would even reduce the relative performance of digital CT.
Our results put forward several directions to increase the effectiveness of tracing. An important aspect is the correlation between app adoption rates and activity of nodes: our analysis in the Supplementary Notes shows that, as expected, in heterogeneous populations a positive correlation strongly increases the success of digital CT. This is a direction that could be pursued in campaigns aimed at driving app adoption among potential superspreaders. However, this represents a challenge for policy makers. Evidence is currently emerging that those who download the app are individuals who adopt very cautious behavior, i.e. and are typically anticorrelated Wyl2020 ; Saw2020 . Another road that could enhance the efficacy of CT protocols is to follow chains of transmissions along multiple steps, so that when a traced contact is found infected also her contacts are reconstructed and tested. This additional step improves the overall effectiveness of CT protocols, but also increases the delay associated to the manual procedure with respect to the digital one. Digital CT allows in principle to extend the tracing procedure to an arbitrary number of steps, however, strong concerns related to privacy issues Firth2020 make this path difficult to follow.
In summary, even if additional features of CT can be considered, the weakness of digital CT, originated by the nature of the sampling of contacts and worsened by heterogeneities, seems to be an intrinsic unavoidable property of the procedure. The manual CT protocol, with its higher intrinsic stochasticity, does not suffer from this problem and samples contacts effectively, especially in realistic heterogeneous populations: thus, digital CT cannot be considered simply as a cheaper and more rapid way of implementing standard contact tracing and should only be considered in combination with manual protocols. Manual CT must necessarily play an important role in any strategy to mitigate the current pandemic. Considerations about costs and practical feasibility of the two approaches (which have not been taken into account here) suggest that a careful integration of the two protocols may be the key for more effective mitigation strategies. As suggested in the last part of our results, an optimal set up should include both procedures, adopted simultaneously. In this respect, the availability of detailed data about the rates of app adoption in various population groups (and correlations with age or activity levels), as well as more precise estimates of other parameters, such as the recall probability, would be highly beneficial. The design of optimal hybrid CT protocols, including decisions on how to allocate resources and how to target recommendations for app adoption, is a very promising direction for future work.
IV Methods
IV.1 Mean-field equations and implementation of CT protocols
We consider an activity-attractiveness based mean-field approach, dividing the population into classes of nodes with the same activity and attractiveness and treating them as if they were statistically equivalent. For each class we consider the probability that at time a node is in one of the epidemic compartments. For arbitrary distribution and arbitrary functional form of and we build the mean-field equations which describe the temporal evolution of the network, the epidemic spreading and the adaptive behavior due to isolation and CT. In particular, in order to model the manual and app-based CT we introduce two further compartments: traced asymptomatic and isolated asymptomatic. An asymptomatic individual became traced when infected by a presymptomatic node or when she infects a susceptible node that eventually develops symptoms. In the manual case the tracing is effective with probability . In the app-based case, tracing occurs only if both nodes involved in the contact downloaded the app. A traced node is still infective and with rate it is quarantined, ; while a quarantined node is no more infective since . In order to take into account the delay in the manual CT we set: for the manual case and for the app-based process. See Supplementary Method 1 for the detailed equations of manual, digital and hybrid CT protocols.
IV.2 Epidemic thresholds
We perform a linear stability analysis of the mean field equations around the absorbing state obtaining the conditions for its stability and then the epidemic threshold (see Supplementary Method 1 for details). For the non-adaptive case (NA), when infected individuals do not modify their behavior, the threshold is equal to the one obtained in Refs. Pozzana2017 ; Mancastroppa2020 . Indeed, setting we obtain:
| (3) |
If only symptomatic nodes are isolated as soon as they develop symptoms, we obtain, setting :
| (4) |
For the case with CT on homogeneous population, we set , and no delay in manual CT . We obtain the epidemic threshold for both the manual and digital CT:
| (5) |
| (6) |
The more general case of populations with arbitrary distribution , arbitrary delays and general form of and , is reported in Supplementary Method 1. In Supplementary Method 1 we also report the derivation of the epidemic threshold for the hybrid protocol. Its values are derived from the stability conditions of a complex set of differential equations, that we can solve numerically.
IV.3 Model parameters
Figures present results where one of the model parameters is varied and all the others are fixed. Here we report the parameter values used throughout the paper, unless specified otherwise. They are tailored to describe the current COVID-19 pandemic.
The fraction of infected individuals who develop symptoms is Lavezzo2020 . The time after which a presymptomatic individual spontaneously develops symptoms is days DiDomenico2020 ; wei2020presymptomatic ; Keeling2020 , while infected individuals recover on average after days who_china_report ; Liu2020 . The time window over which contacts are reconstructed is days Keeling2020 : it is fixed equal to to track both nodes infected by the index case in the pre-symptomatic phase (forward CT) and the primary case who infected the index case (backward CT) kojaku2020 . The maximum number of contacts engaged in by a single individual that can be reconstructed with the manual CT procedure is , according to reasonable estimates of the number of contacts manually traced for very active individuals Keeling2020 . Moreover, fixing and for realistic Mossong2008 , the average number of traced contacts for each index case is approximatively , consistently with reported data on manual CT and with estimates for resources allocation ECDC_ct ; ECDC_ct2 ; Keeling2020 ; Guardian2020 (see Supplementary Notes for the distribution of contacts traced manually by each index case). The activity-driven network parameters are fixed so that the average value of the activity is always the same, i.e. days-1 Mossong2008 ; Vankerkove2013 . In particular for a power-law distribution , the values of are constrained between a minimum and a maximum value (). We keep and then we tune to set .
IV.4 Numerical simulations
We perform numerical simulations of the epidemic model on the adaptive activity-driven network: the network dynamics and epidemic spreading are implemented by a continuous time Gillespie-like algorithm. We consider an activity-driven network of nodes. The results are averaged over several realizations of the disorder and of the dynamical evolution, so that the error on the infection peak height is lower than . The initial conditions are imposed by infecting the node with the highest activity and the CT protocols are immediately adopted. A detailed description of the simulations is reported in Supplementary Method 2.
References
- (1) Lavezzo, E. et al. Suppression of a sars-cov-2 outbreak in the italian municipality of vo’. Nature 584, 425–429 (2020).
- (2) Ferretti, L. et al. Quantifying sars-cov-2 transmission suggests epidemic control with digital contact tracing. Science 368, eabb6936 (2020).
- (3) Rothe, C. et al. Transmission of 2019-ncov infection from an asymptomatic contact in germany. N. Engl. J. Med. 382, 970–971 (2020).
- (4) Pinotti, F. et al. Tracing and analysis of 288 early sars-cov-2 infections outside china: A modeling study. PLOS Med. 17, 1–13 (2020).
- (5) Li, R. et al. Substantial undocumented infection facilitates the rapid dissemination of novel coronavirus (sars-cov-2). Science 368, 489–493 (2020).
- (6) Wei, W. E. et al. Presymptomatic transmission of sars-cov-2—singapore, january 23–march 16, 2020. Morb. Mortal. Wkly. Rep. 69, 411 (2020).
- (7) Bonaccorsi, G. et al. Economic and social consequences of human mobility restrictions under covid-19. Proc. Natl. Acad. Sci. U.S.A. 117, 15530–15535 (2020).
- (8) Nicola, M. et al. The socio-economic implications of the coronavirus pandemic (covid-19): A review. Int. J. Surg. 78, 185 – 193 (2020).
- (9) Eames, K. T. & Keeling, M. J. Contact tracing and disease control. Proc. Royal Soc. B 270, 2565–2571 (2003).
- (10) Fraser, C., Riley, S., Anderson, R. M. & Ferguson, N. M. Factors that make an infectious disease outbreak controllable. Proc. Natl. Acad. Sci. U.S.A. 101, 6146–6151 (2004).
- (11) Klinkenberg, D., Fraser, C. & Heesterbeek, H. The effectiveness of contact tracing in emerging epidemics. PLOS ONE 1, 1–7 (2006).
- (12) Kojaku, S., Hébert-Dufresne, L., Mones, E., Lehmann, S. & Ahn, Y.-Y. The effectiveness of backward contact tracing in networks. Nat. Phys. https://doi.org/10.1038/s41567-021-01187-2 (2021).
- (13) McLean, E. et al. Pandemic (h1n1) 2009 influenza in the uk: clinical and epidemiological findings from the first few hundred (ff100) cases. Epidemiol. Infect. 138, 1531–1541 (2010).
- (14) Crook, P. et al. Lack of secondary transmission of ebola virus from healthcare worker to 238 contacts, united kingdom, december 2014. Emerg. Infect. Dis. 23, 2081 (2017).
- (15) Bell, D. M., on International, W. H. O. W. G. & of SARS, C. T. Public health interventions and sars spread, 2003. Emerg. Infect. Dis. 10, 1900–1906 (2004).
- (16) Wilder-Smith, A., Chiew, C. J. & Lee, V. J. Can we contain the covid-19 outbreak with the same measures as for sars? Lancet Infect. Dis. 20, e102–e107 (2020).
- (17) Hellewell, J. et al. Feasibility of controlling covid-19 outbreaks by isolation of cases and contacts. Lancet Glob. Health 8, e488 – e496 (2020).
- (18) Privacy-preserving contact tracing. https://covid19.apple.com/contacttracing (2020).
- (19) Troncoso, C. et al. Decentralized privacy-preserving proximity tracing. IEEE Data Eng. Bull. 43, 36–66 (2020).
- (20) Oliver, N. et al. Mobile phone data for informing public health actions across the covid-19 pandemic life cycle. Sci. Adv. 6, eabc0764 (2020).
- (21) Ahmed, N. et al. A survey of covid-19 contact tracing apps. IEEE Access 8, 134577–134601 (2020).
- (22) Sapiezynski, P., Pruessing, J. & Sekara, V. The fallibility of contact-tracing apps. eprint Preprint at https://arxiv.org/abs/2005.11297 (2020)
- (23) Braithwaite, I., Callender, T., Bullock, M. & Aldridge, R. W. Automated and partly automated contact tracing: a systematic review to inform the control of covid-19. Lancet Digital Health 2, e607–e621 (2020).
- (24) Zastrow, M. Coronavirus contact-tracing apps: can they slow the spread of covid-19? Nature - Technology Feature https://doi.org/10.1038/d41586-020-01514-2 (19 May 2020).
- (25) Cencetti, G. et al. Digital proximity tracing on empirical contact networks for pandemic control. Nat. Commun. 12, 1655 (2021).
- (26) Almagor, J. & Picascia, S. Exploring the effectiveness of a covid-19 contact tracing app using an agent-based model. Sci. Rep. 10, 22235 (2020).
- (27) Nielsen, B. F., Sneppen, K., Simonsen, L. & Mathiesen, J. Social network heterogeneity is essential for contact tracing. eprint Preprint at https://doi.org/10.1101/2020.06.05.20123141 (2020)
- (28) Kretzschmar, M. E. et al. Impact of delays on effectiveness of contact tracing strategies for covid-19: a modelling study. Lancet Public Health 5, e452 – e459 (2020).
- (29) Barrat, A., Cattuto, C., Kivelä, M., Lehmann, S. & Saramäki, J. Effect of manual and digital contact tracing on covid-19 outbreaks: a study on empirical contact data eprint Preprint at https://doi.org/10.1101/2020.07.24.20159947 (2020)
- (30) Alessandro, L. Immuni è efficace? gli ultimi numeri, le luci e le ombre dell’app per il covid-19. Sole24Ore (2020). 09-09-2020.
- (31) O’Neill, P. H., Ryan-Mosley & Johnson, B. A flood of coronavirus apps are tracking us. now it’s time to keep track of them. MIT Technology Review (2020). Tech policy/Privacy: 09-29-2020.
- (32) MIT Technology Review. Covid tracing tracker. https://docs.google.com/spreadsheets/d/1ATalASO8KtZMx__zJREoOvFh0nmB-sAqJ1-CjVRSCOw/edit#gid=0 (2020). Accessed on: 09-29-2020.
- (33) Perra, N., Gonçalves, B., Pastor-Satorras, R. & Vespignani, A. Activity driven modeling of time varying networks. Sci. Rep. 2, 469 (2012).
- (34) Ubaldi, E. et al. Asymptotic theory of time-varying social networks with heterogeneous activity and tie allocation. Sci. Rep. 6, 35724 (2016).
- (35) Pozzana, I., Sun, K. & Perra, N. Epidemic spreading on activity-driven networks with attractiveness. Phys. Rev. E 96, 042310 (2017).
- (36) Tizzani, M. et al. Epidemic spreading and aging in temporal networks with memory. Phys. Rev. E 98, 062315 (2018).
- (37) Ghoshal, G. & Holme, P. Attractiveness and activity in internet communities. Physica A 364, 603 – 609 (2006).
- (38) Ubaldi, E., Vezzani, A., Karsai, M., Perra, N. & Burioni, R. Burstiness and tie activation strategies in time-varying social networks. Sci. Rep. 7, 46225 (2017).
- (39) Starnini, M., Baronchelli, A. & Pastor-Satorras, R. Modeling human dynamics of face-to-face interaction networks. Phys. Rev. Lett. 110, 168701 (2013).
- (40) Guan, W.-j. et al. Clinical characteristics of coronavirus disease 2019 in china. N. Engl. J. Med. 382, 1708–1720 (2020).
- (41) Di Domenico, L., Pullano, G., Sabbatini, C. E., Boëlle, P.-Y. & Colizza, V. Impact of lockdown on covid-19 epidemic in île-de-france and possible exit strategies. BMC Med. 18, 240 (2020).
- (42) World Health Organization. Report of the who-china joint mission on coronavirus disease 2019 (covid-19). https://www.who.int/docs/default-source/coronaviruse/who-china-joint-mission-on-covid-19-final-report.pdf (2020). Accessed on: 09-29-2020.
- (43) Van Kerckhove, K., Hens, N., Edmunds, W. J. & Eames, K. T. D. The Impact of Illness on Social Networks: Implications for Transmission and Control of Influenza. Am. J. Epidemiol. 178, 1655–1662 (2013).
- (44) Mancastroppa, M., Burioni, R., Colizza, V. & Vezzani, A. Active and inactive quarantine in epidemic spreading on adaptive activity-driven networks. Phys. Rev. E 102, 020301 (2020).
- (45) Fenichel, E. P. et al. Adaptive human behavior in epidemiological models. Proc. Natl. Acad. Sci. U.S.A. 108, 6306–6311 (2011).
- (46) European Center for Disease Prevention and Control. Resource estimation for contact tracing, quarantine and monitoring activities for covid-19 cases in the eu/eea. https://www.ecdc.europa.eu/sites/default/files/documents/COVID-19-resources-for-contact-tracing-2-March-2020.pdf (2020). Accessed on: 09-29-2020.
- (47) Centers for Disease Control and Prevention. Scaling up staffing roles in case investigation and contact tracing. https://www.cdc.gov/coronavirus/2019-ncov/php/contact-tracing/contact-tracing-plan/scaling-staff.html (2020). Accessed on: 09-29-2020.
- (48) Mossong, J. et al. Social contacts and mixing patterns relevant to the spread of infectious diseases. PLOS Med. 5, 1–1 (2008).
- (49) Keeling, M. J., Hollingsworth, T. D. & Read, J. M. Efficacy of contact tracing for the containment of the 2019 novel coronavirus (covid-19). J. Epidemiology Community Health 74, 861–866 (2020).
- (50) Liu, Y. et al. Viral dynamics in mild and severe cases of covid-19. Lancet Infect. Dis. 20, 656–657 (2020).
- (51) de Arruda, G. F., Petri, G., Rodrigues, F. A. & Moreno, Y. Impact of the distribution of recovery rates on disease spreading in complex networks. Phys. Rev. Res. 2, 013046 (2020).
- (52) Mancastroppa, M., Vezzani, A., Muñoz, M. A. & Burioni, R. Burstiness in activity-driven networks and the epidemic threshold. J. Stat. Mech. Theory Exp. 2019, 053502 (2019).
- (53) von Wyl, V. et al. Drivers of acceptance of covid-19 proximity tracing apps in Switzerland: panel survey analysis. JMIR Public Health Surveill. 7, e25701 (2021).
- (54) Saw, Y. E., Tan, E. Y., Liu, J. S. & Liu, J. C. Predicting public uptake of digital contact tracing during the covid-19 pandemic: results from a nationwide survey in Singapore. J. Med. Internet Res. 23, e24730 (2021).
- (55) Firth, J. A. et al. Using a real-world network to model localized covid-19 control strategies. Nat. Med. 26, 1616–1622 (2020).
- (56) European Center for Disease Prevention and Control. Contact tracing for covid-19: current evidence, options for scale-up and an assessment of resources needed. https://www.ecdc.europa.eu/sites/default/files/documents/COVID-19-Contract-tracing-scale-up.pdf (2020). Accessed on: 09-29-2020.
- (57) Visontay, E. Victoria’s contact-tracing effort buckles under the weight of covid-19 cases. The Guardian (2020). 08-04-2020.