Ultrafast broadband optical spectroscopy for quantifying subpicometric coherent atomic displacements in WTe2
Abstract
Here we show how time-resolved broadband optical spectroscopy can be used to quantify, with femtometer resolution, the oscillation amplitudes of coherent phonons through a displacive model without free tuning parameters, except an overall scaling factor determined by comparison between experimental data and density functional theory calculations. WTe2 is used to benchmark this approach. In this semimetal, the response is anisotropic and provides the spectral fingerprints of two A1 optical phonons at 8 cm-1 and 80 cm-1. In principle, this methodology can be extended to any material in which an ultrafast excitation triggers coherent lattice modes modulating the high-energy optical properties.
Several fundamental properties of materials, including the electrical and thermal conductivities, are influenced by lattice vibrations Ashcroft and Mermin (1976). Recently, the possibility to control such behaviors by resonant coupling of ultrashort light pulses to specific lattice modes has been proved Rini et al. (2007)Nicoletti and Cavalleri (2016). Conversely, coherent phonon spectroscopy has emerged as a powerful method to directly observe, in the time domain, coherent lattice vibrations Dekorsy et al. (2000)Ishioka and Misochko (2010)Kuznetsov and Stanton (1996). Despite the many studies, coherent phonons have been exploited primarily to characterize ground state properties Ishioka et al. (2006)Melnikov et al. (2011)Kim et al. (2015)Ishioka et al. (2016), rather than controlling the material properties. This observation motivates the quest to learn how specific lattice vibrations affect the electronic behavior in the vicinity of the Fermi energy. Structural dynamics experiments, such as time-resolved x-ray diffraction Sokolowski-Tinten et al. (2003) and time-resolved electron diffraction Chatelain et al. (2014), are currently used to measure the amplitude of synchronized collective excitations of the atoms in a solid, i.e. coherent phonon modes. Yet, subpicometer displacements in complex materials are very challenging to be resolved.
In time-resolved reflectivity experiments, such modes appear as ultrafast oscillations of the probe signal Cheng et al. (1990)Kaoru et al. (2010). Their amplitude has been related to the atomic shifts for single-element materials DeCamp et al. (2001)Katsuki et al. (2013) by using single-frequency measurements. In materials with complex unit cells, a larger number of phonon modes is present and a method that avoids correlations in the estimation of individual amplitudes is required. Here, we report on a novel approach to estimate the non-equilibrium atomic displacements of coherent optical phonon modes by detecting the modulation induced in a broadband reflectivity probe signal, which is central to obtain reliable signatures of the modes. Density functional theory (DFT) calculations are applied to a displacive model to simulate the time-resolved optical reflectivity signals and to estimate the coherent phonon amplitudes in the tens of femtometers regime.
At present, our method is applied to the orthorhombic semimetallic (Td) phase of tungsten ditelluride (WTe2), a transition metal dichalcogenide that has recently gained interest for showing an unusually high and non-saturating magnetoresistance Ali et al. (2014) along with a possible type-II Weyl semimetal character Soluyanov et al. (2015). WTe2 has a layered structure belonging to the space group Pmn21 Mar et al. (1992) (see Fig. S1 in SI ) with in-plane covalent bonding and principally van der Waals interactions holding together the individual layers. Furthermore, it has been shown that its electronic, optical and topological properties are influenced by strain forces Soluyanov et al. (2015)Amin et al. (2014), which can be induced through non-equilibrium perturbations Sie et al. (2019) allowing an ultrafast control of the functionalities of this material.
Expressly, we focus on two A1 coherent optical phonon modes at 8 cm-1 and 80 cm-1. They are comprised of non-equilibrium displacements of the atoms along the y and z crystallographic directions. The 8 cm-1 optical phonon is a uniform in-plane shift of the atoms, estimated to be 350 fm using a 230 J/cm2 absorbed pump fluence, while the 80 cm-1 mode corresponds to atomic displacements of few tens of femtometers which depend on the specific atom. A more detailed description will be given further on in this work.
High-quality tungsten ditelluride samples were grown as reported in Ali et al. (2014). The presence of defects was previously studied Ali et al. (2014)Das et al. (2016) and has negligible impact on our estimate of the average displacements. In order to identify the in-plane crystallographic axes, LEED images were acquired under ultra-high vacuum conditions. Time-resolved reflectivity experiments (sketch of the set-up in Fig. 1(a)) were performed using a Ti:sapphire femtosecond (fs) laser system, delivering, at a repetition rate of 250 kHz, 50 fs light pulses at a wavelength of 800 nm (1.55 eV). The broadband (0.8-2.3 eV) supercontinuum probe beam was generated using a sapphire window.
DFT simulations were carried out using norm-conserving (NC) Hamann et al. (1979) scalar relativistic Takeda (1978) pseudopotentials with the generalized gradient approximation (GGA) in the Perdew-Burke-Ernzerhof (PBE) parametrization for the exchange-correlation functional Perdew et al. (1992) chosen from the PseudoDojo database Hamann (2013)van Setten et al. (2018). Structural optimizations and zone-center optical phonon calculations in the framework of density functional perturbation theory (DFPT) were performed using the Quantum Espresso (QE) Giannozzi et al. (2009) suite of codes. We calculated the diagonal macroscopic dielectric tensor components through the Yambo code Marini et al. (2009) at the independent-particle (IP) level, starting from the calculated wavefunctions and eigenvalues obtained through QE SI .
The normalized time-resolved differential reflectivity (DR/R), measured in a near-normal incidence geometry, revealed a large anisotropy consistent with the two-fold in-plane symmetry of WTe2 (Fig. 1(b)) also reported for equilibrium electrodynamics Frenzel et al. (2017).
In Figs. 1(c),(d), the broadband probe beam polarization was set parallel to the x () and y () crystallographic axes respectively with pump beam polarization kept perpendicular to the probe one. Measurements were acquired with a 710 J/cm2 absorbed pump fluence and 1.55 eV pump photon energy at T=295 K. A region of the spectrum was disturbed by the scattering of pump beam photons from the sample, so it was removed.

The temporal evolution of the reflectivity is directly related to the electronic and ionic degrees of freedom Dekorsy et al. (2000)Cheng et al. (1990)Kaoru et al. (2010). In general, the DR/R is a superposition of signals due to transient variations of electronic density of the states and population. We describe the temporal evolution after the perturbation (time-zero, t=0) as
| (1) |
where represents the pump and probe pulses cross-correlation and , and denote the amplitudes of three different phenomena: i) electronic relaxation phenomena with time constants , ii) heating contribution with a characteristic time and iii) oscillations due to coherent phonons with angular frequency , initial phase and decay time .
After the pump pulse excitation, electron-electron and electron-phonon scattering processes constitute the main incoherent relaxation phenomena in the first hundreds of femtoseconds and are responsible for the initial exponential decay of the DR/R signal. After a few picoseconds, the differential reflectivity DR/R reached a plateau, showcasing an offset with respect to the equilibrium value. It vanished in almost one nanosecond SI . Due to its timescale, this effect is likely to be associated with local lattice heating, as described in Ligges et al. (2009) for transition metals. For our purposes, we can consider the offset as a constant over the temporal range explored in Figs. 1(c),(d).
The temporal profiles are very well fitted by using Eq. (1) SI . Their sign and magnitude vary with the photon energy, while the main relaxation presents a time constant which is almost the same and equal to 1 ps with only small differences, as previously found in Dai et al. (2015) at h=1.55 eV.
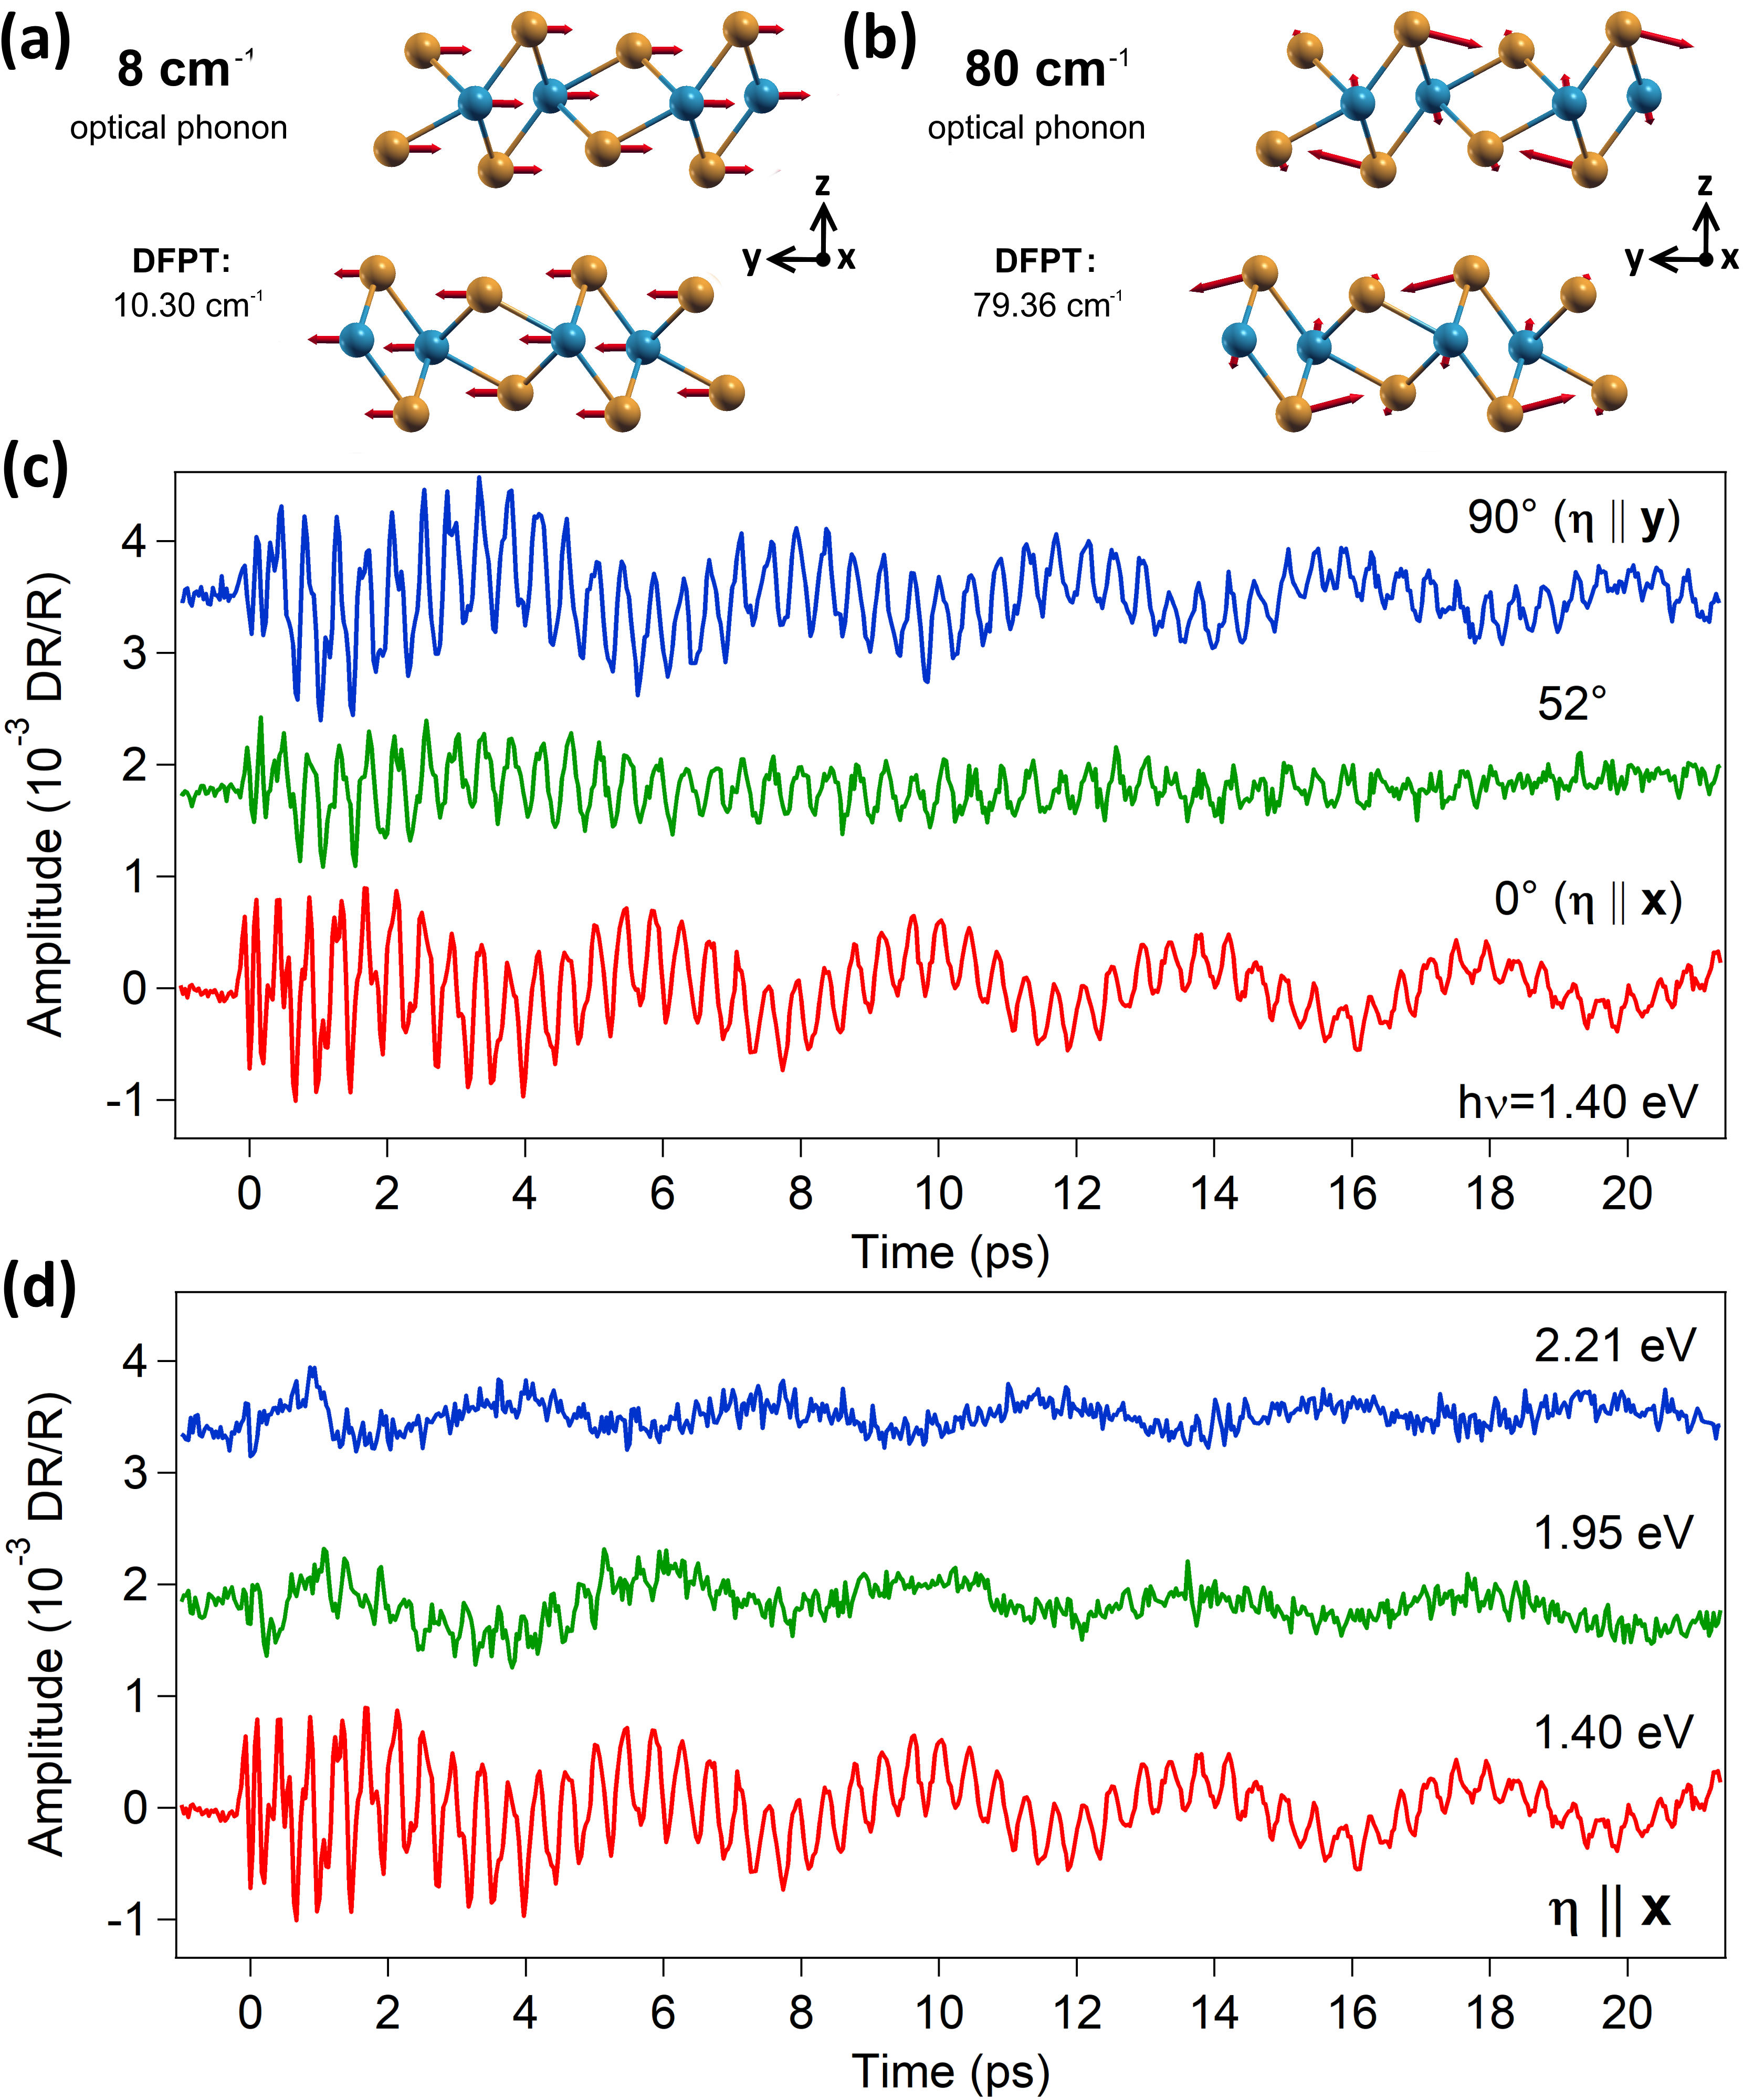
Subtracting an exponential fit function from the experimental signals allows the extraction of the coherent component of the DR/R signal. The resulting signal displays marked periodic modulations in the time domain, arising from the excitation of coherent phonon modes. The most prominent oscillating features, as detected by Fast Fourier Transform (FFT) and in Dai et al. (2015), have frequency of 7.9±0.4 cm-1 and 79.7±0.4 cm-1. For notation purposes, we refer to these modes with the labels 8 cm-1 and 80 cm-1. The associated time-decay constants, derived by fitting the modulations with two exponentially-damped cosine waves, are =774 ps for the 8 cm-1 mode and =12.10.2 ps for the 80 cm-1 mode. DFPT results indicate that these frequencies are linked to A1 zone-center optical phonon modes, represented in Fig. 2(a),(b). The 8 cm-1 mode can be pictured as adjacent layers moving in antiphase, while the 80 cm-1 involves more complex in-plane and out-of-plane movements. The smaller value of the experimental frequency for the 8 cm-1 mode with respect to the DFPT result (10.30 cm-1) can be attributed to a redshift as temperature or fluence are increased He et al. (2016). The marked difference between the time constants of the two modes could be linked to the different type of perturbation of the interatomic bonds induced by the associated displacements. The 8 cm-1 mode (Fig. 2(a)) only alters the interplanar, mainly van der Waals, interactions. Differently, the 80 cm-1 mode (Fig. 2(b)) induces a modification of the in-plane covalent bonds. A more detailed DFPT analysis could provide a rigorous basis for this intuitive argument, which is beyond the scope of the present work.
Weaker additional A1 contributions at 116.5±0.4 cm-1, 132.2±0.4 cm-1 and 210.2±0.4 cm-1 frequency appear as beats in the DR/R signal in the first hundreds of femtoseconds.
When switching the probed direction from to , a phase change for the 8 cm-1 mode (Fig. 2(c)) was clearly registered for most of the probe photon energies. Analogous phase changes were found by comparing the temporal profiles taken at different probe photon energies using the same polarization for the same mode (Fig. 2(d)). These phase differences can be explained in terms of the peculiar anisotropy of the dielectric function and were reproduced through our numerical simulations (see discussion for Fig. 4).
In order to model the effects of the coherent phonons on the reflectivity, we first calculated the wavefunctions and eigenvalues for the equilibrium configuration using QE and the macroscopic dielectric tensor diagonal components and the reflectivity curves through Yambo. Then, we considered four out-of-equilibrium configurations labeled as 0 and phases, corresponding to displacements in opposite directions, for each of the coherent phonon modes, using the eigendisplacements obtained through DFPT with respect to the equilibrium positions. The optical phonons led to modifications of the electronic band structure that, although small, were beyond the numerical accuracy and were confirmed by linearly rescaling the effects of larger perturbations SI . For each configuration we calculated the associated reflectivity and DR/R with respect to the equilibrium configuration. These curves describe the effect of the optical phonons on a quasi-equilibrium adiabatic system. Indeed, a few picoseconds after time-zero, the system has relaxed through electron-phonon scattering processes and the incoherent part of the DR/R signal reaches a plateau having a decay time much larger than the coherent phonon period and damping timescale.
Experimentally, the effects of each single optical phonon mode on the DR/R were isolated with the following procedure. For the 8 cm-1 phonon, we took the mean value over one period of the 80 cm-1 modulation around two consecutive 8 cm-1 extrema (Fig. 3). For the 80 cm-1 oscillation, we directly used the spectral profiles at the extrema, considering that the period of the slower phonon is about ten times larger. The spectral profiles were collected after the main relaxation peak, as precisely indicated in the insets. The difference between the spectral profiles at the maximum (0 phase) and minimum ( phase) of the coherent phonons, named with respect to the DR/R, gives an unique signature of the phonon mode.
Analogously, in our calculations, we considered the difference between the calculated DR/R curves at 0 and , multiplied by an exponential factor derived from the experimental data, to account for the damping of the optical modulation.
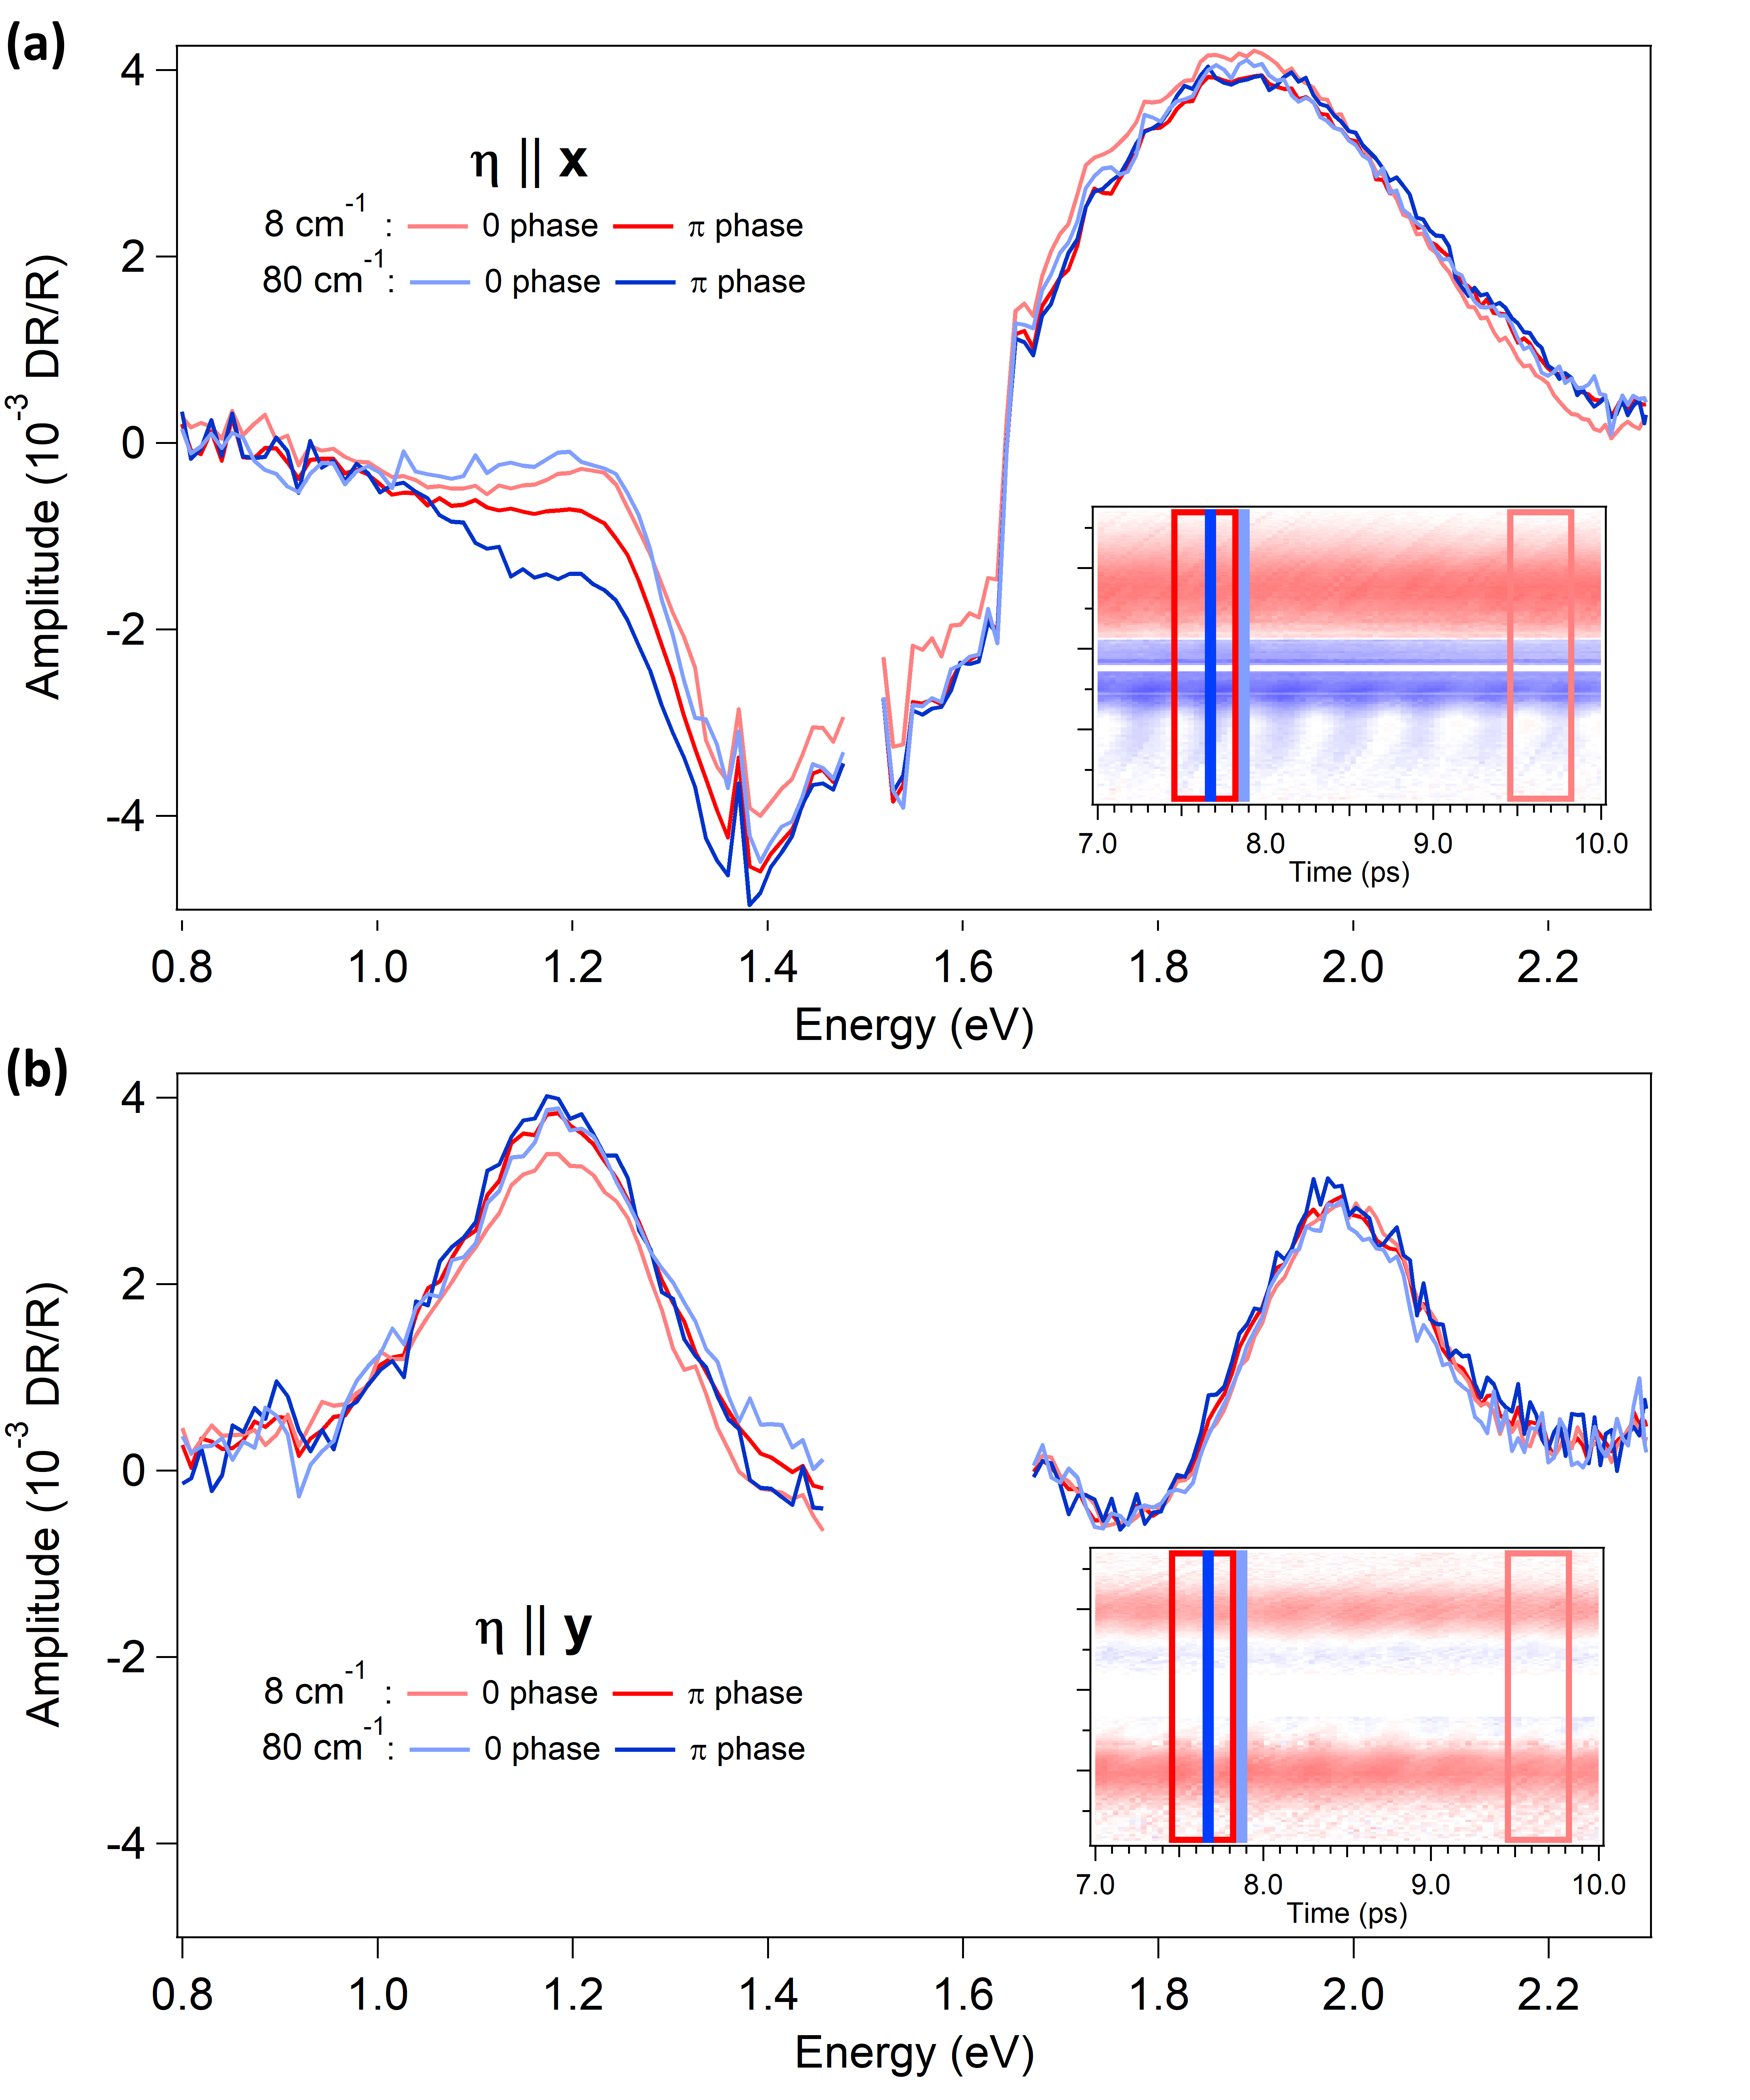
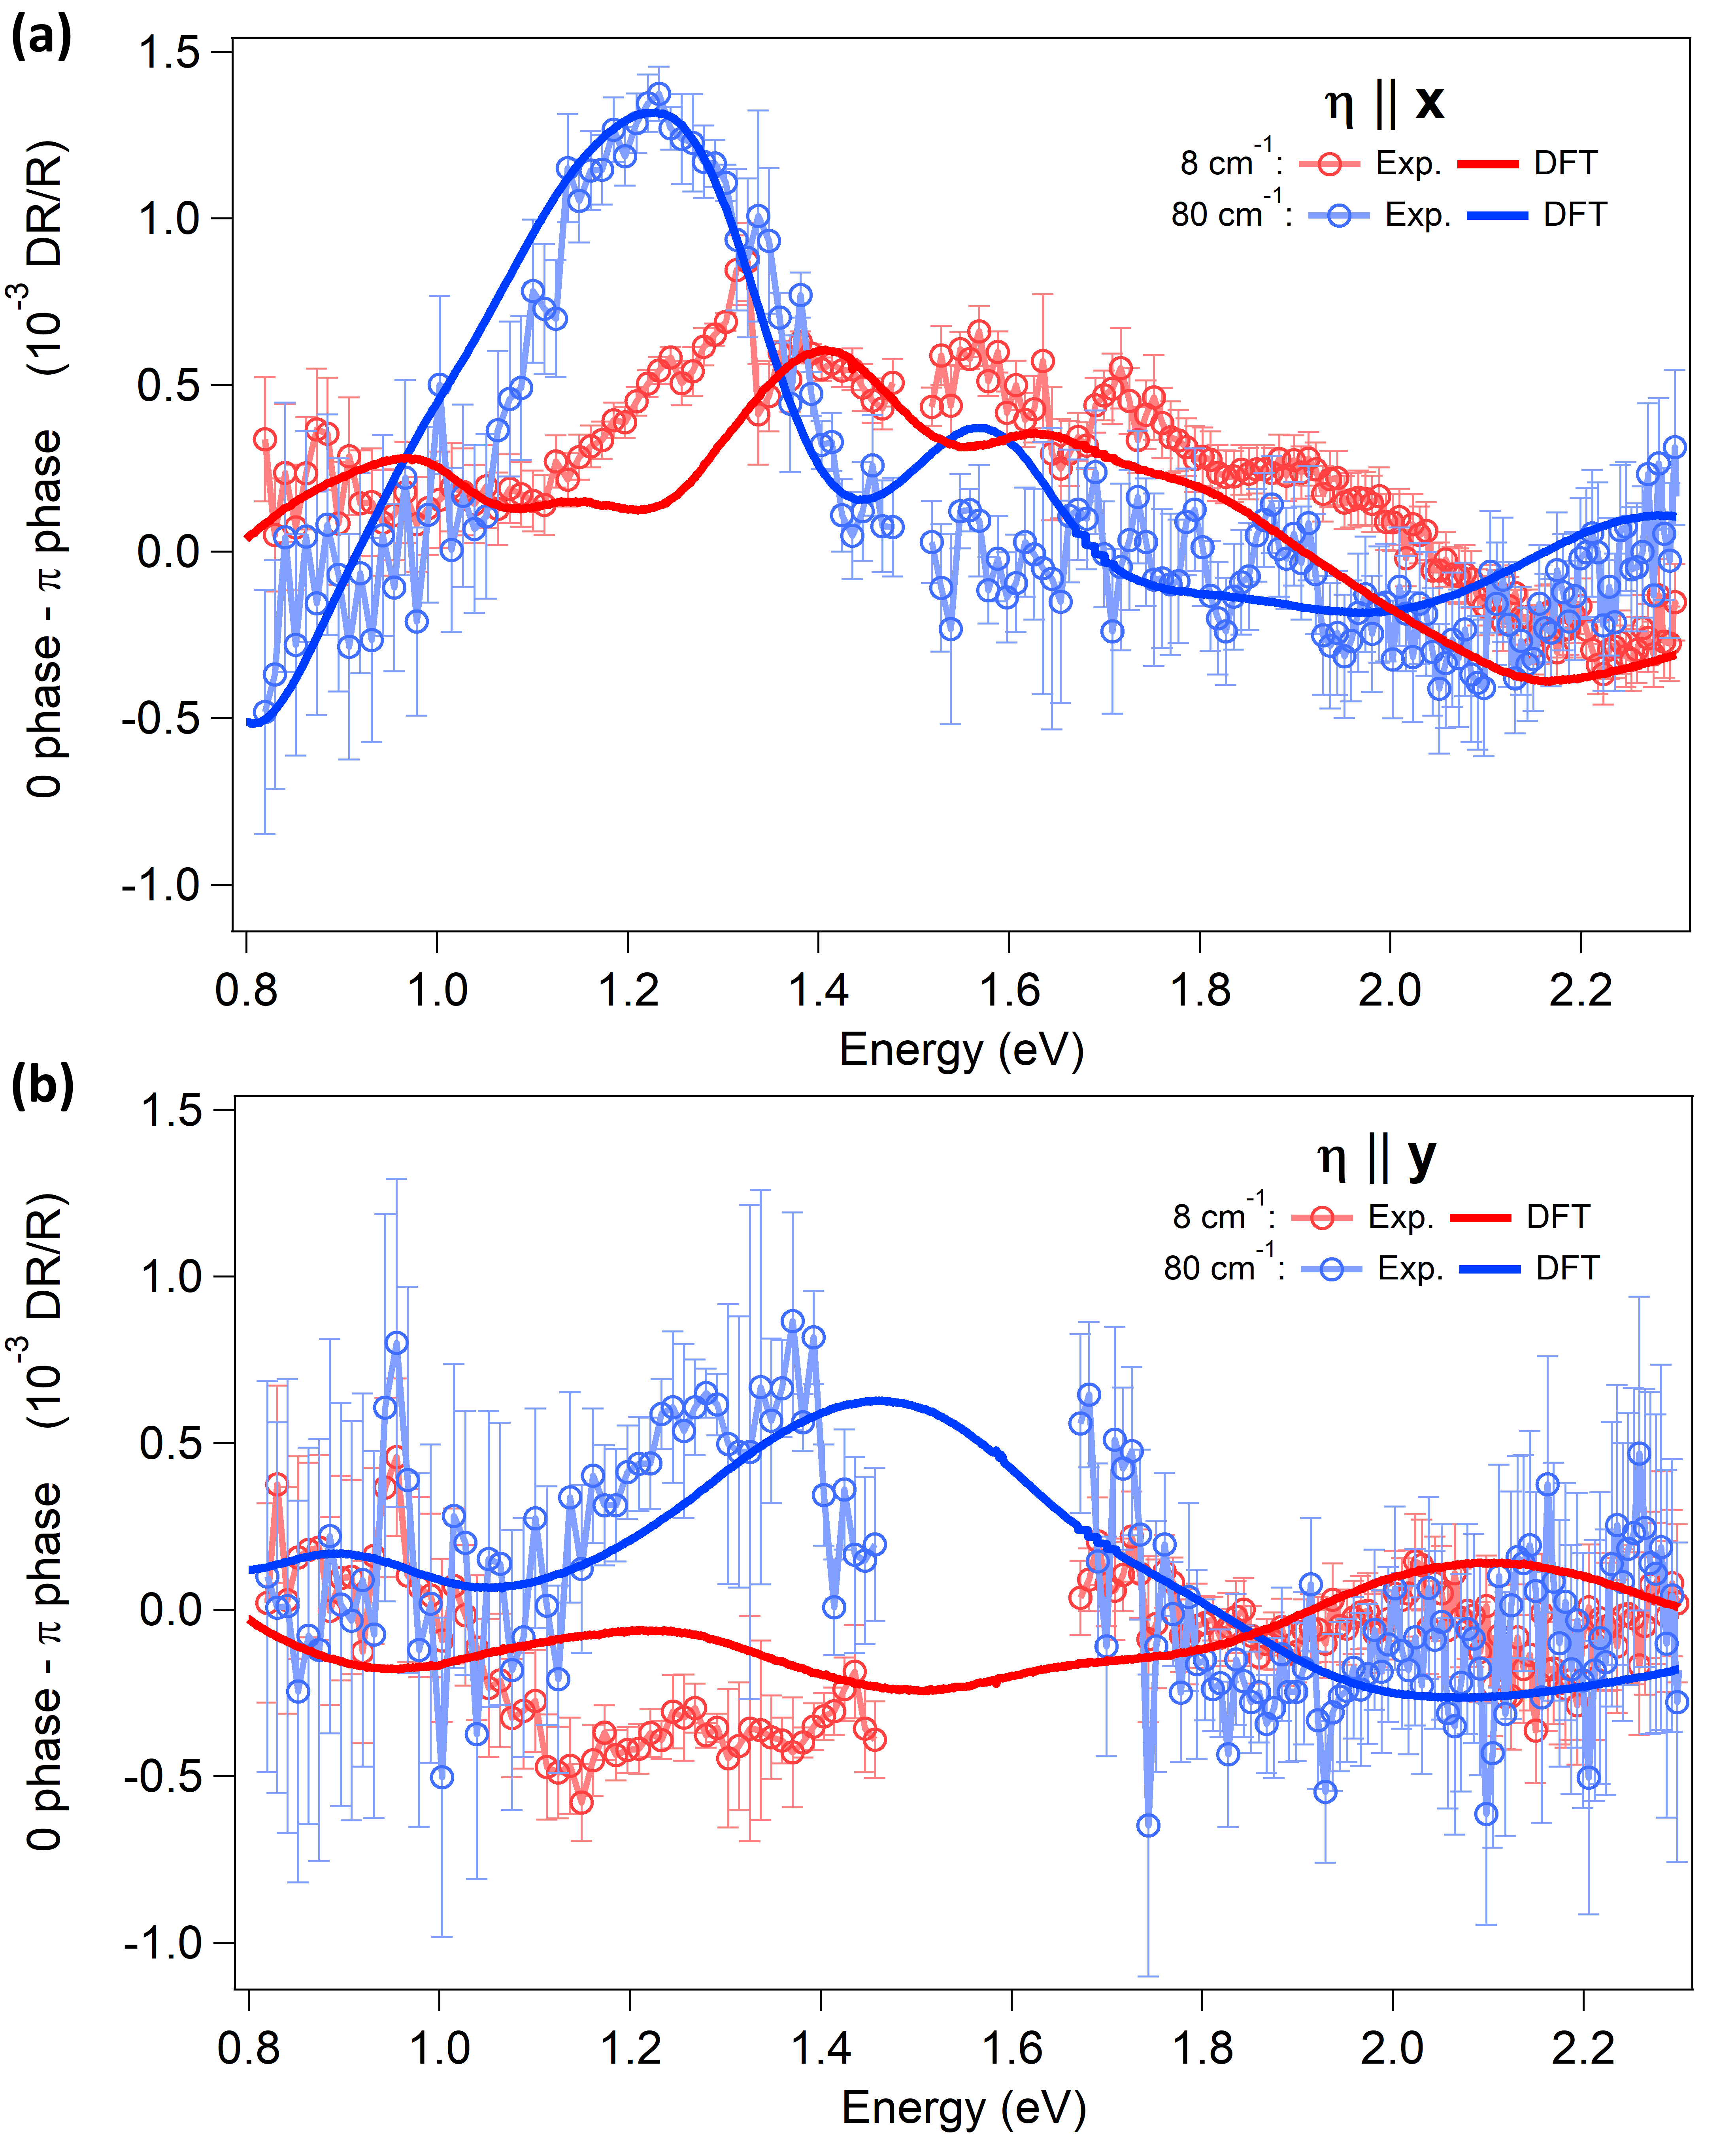
The DFT predictions closely match the experimental results for both the 8 cm-1 and 80 cm-1 modes by rescaling the atomic displacements, whose relative amplitude is given by DFPT, with a global multiplicative factor, common to both polarizations (Fig. 4). The agreement is particularly good for where the phonon effects are most prominent. Peculiar features, such as their trend and change of sign, are maintained throughout the relaxation process as previously illustrated in Fig. 2(c),(d).
From this comparison we can quantify the magnitude of the ionic displacements right after the perturbation, when the atoms of different unit cells move uniformly in the probed region. The estimated displacements have to be regarded as average displacements over the probed volume and photon energies. The penetration depth, derived from the optical data in Frenzel et al. (2017), is almost constant and similar for the two perpendicular polarizations in the probed spectral region, with minor deviations towards the infrared for direction.
In order to evaluate very small atomic displacements, we repeated the experiments at lower fluence (230 J/cm2). We checked that the DR/R spectral shape does not change at lower temperature or lower fluence, where we showed that the phonon effects can be considered linear with the deposited energy SI . This is not the case for 710 J/cm2, since the phonon effects measured at that fluence are only twice those at 230 J/cm2. At 230 J/cm2, for the 8 cm-1 mode, the initial positions shifts are found to be 350 fm along the direction. For the 80 cm-1 mode, the displacements are quite distinct for the twelve atoms in the basis cell. The four tungsten atoms remain almost fixed (displacements smaller than 10 fm) along the direction whereas they shift by 40 fm along the interlayer z direction. Four tellurium atoms are displaced by 90 fm along the direction and by 25 fm along . The remaining four tellurium atoms are displaced by 15 fm along the direction and by 30 fm along . None of these modes involves movements along the crystallographic direction.
We highlight that with the present approach the atomic displacements can be evaluated with a precision of a few femtometers without free tuning parameters, except a scaling factor determined by an overall comparison between experimental data and numerical simulations of the broadband DR/R signal. Concerning WTe2, a good agreement between the measured and calculated phonon effects on the optical properties for both in-plane crystal axes has been obtained. This finding confirms that the macroscopic lattice distortions excited in WTe2 at 8 cm-1 and 80 cm-1 can be entirely mimicked by the coherent population of selected zone-center A1 lattice modes. We stress that the possibility to measure the optical properties on a wide spectral range is fundamental to extract reliable quantitative results about the magnitude of eigendisplacements of multiple and intertwined phonon modes. Finally, we mention that the method described here is not system-specific and in principle can be extended to any crystalline material, provided that its high-energy optical properties are affected by the coherent motion of atoms. In perspective, our findings can pave the way to the design of tailored devices in which the coherent lattice motion (at selected frequencies and up to large displacements) is exploited to finely tune the functional properties of semiconducting and metallic systems.
We acknowledge fruitful discussion and suggestions concerning the use of the Yambo code by Davide Sangalli and Andrea Marini. We thank Paolo Giannozzi for useful discussions. D.S. acknowledges support from the European Social Fund Operational Programme 2014/2020 of Region Friuli Venezia Giulia. High-performance computing resources were obtained from CINECA through the ISCRA initiative and the agreement with the University of Trieste and from Elettra Sincrotrone Trieste. R.J.C. acknowledges that funding for the growth of the crystals used in this work was provided by the US NSF MRSEC program, grant DMR-1420541. F.P. and M.P. acknowledge the University of Trieste for supporting this research with the projects FRA 2016, code J96J16000980005 and FRA 2018, code J91G18000730002, respectively.
References
- Ashcroft and Mermin (1976) N. Ashcroft and N. Mermin, “Solid State Physics,” (Saunders College, Philadelphia, 1976) Chap. 21.
- Rini et al. (2007) M. Rini, R. Tobey, N. Dean, J. Itatani, Y. Tomioka, Y. Tokura, R. W. Schoenlein, and A. Cavalleri, Nature 449, 72 (2007).
- Nicoletti and Cavalleri (2016) D. Nicoletti and A. Cavalleri, Adv. Opt. Photon. 8, 401 (2016).
- Dekorsy et al. (2000) T. Dekorsy, G. C. Cho, and H. Kurz, “Coherent phonons in condensed media,” in Light Scattering in Solids VIII: Fullerenes, Semiconductor Surfaces, Coherent Phonons (Springer Berlin Heidelberg, Berlin, Heidelberg, 2000) pp. 169–209.
- Ishioka and Misochko (2010) K. Ishioka and O. V. Misochko, “Coherent lattice oscillations in solids and their optical control,” in Progress in Ultrafast Intense Laser Science: Volume V (Springer Berlin Heidelberg, Berlin, Heidelberg, 2010) pp. 23–46.
- Kuznetsov and Stanton (1996) A. V. Kuznetsov and C. J. Stanton, “Theory of coherent phonon oscillations in semiconductors,” in Hot Carriers in Semiconductors (Springer US, Boston, MA, 1996) pp. 217–220.
- Ishioka et al. (2006) K. Ishioka, M. Hase, M. Kitajima, and H. Petek, Applied Physics Letters 89, 231916 (2006).
- Melnikov et al. (2011) A. Melnikov, O. Misochko, and S. Chekalin, Physics Letters A 375, 2017 (2011).
- Kim et al. (2015) S.-H. Kim, B.-J. Kim, T.-Y. Jeong, Y.-S. Lee, and K.-J. Yee, Journal of Applied Physics 117, 163107 (2015).
- Ishioka et al. (2016) K. Ishioka, K. Brixius, A. Beyer, A. Rustagi, C. J. Stanton, W. Stolz, K. Volz, U. Höfer, and H. Petek, Applied Physics Letters 108, 051607 (2016).
- Sokolowski-Tinten et al. (2003) K. Sokolowski-Tinten, C. Blome, J. Blums, A. Cavalleri, C. Dietrich, A. Tarasevitch, I. Uschmann, E. Förster, M. Kammler, M. Horn-von Hoegen, and D. von der Linde, Nature 422, 287 (2003).
- Chatelain et al. (2014) R. P. Chatelain, V. R. Morrison, B. L. M. Klarenaar, and B. J. Siwick, Phys. Rev. Lett. 113, 235502 (2014).
- Cheng et al. (1990) T. K. Cheng, S. D. Brorson, A. S. Kazeroonian, J. S. Moodera, G. Dresselhaus, M. S. Dresselhaus, and E. P. Ippen, Applied Physics Letters 57, 1004 (1990).
- Kaoru et al. (2010) Y. Kaoru, G. Antonio, and L. Kenneth, Progress in Ultrafast Intense Laser Science Volume V (Springer Berlin Heidelberg, 2010) Chap. 2.
- DeCamp et al. (2001) M. F. DeCamp, D. A. Reis, P. H. Bucksbaum, and R. Merlin, Phys. Rev. B 64, 092301 (2001).
- Katsuki et al. (2013) H. Katsuki, J. C. Delagnes, K. Hosaka, K. Ishioka, H. Chiba, E. S. Zijlstra, M. E. Garcia, H. Takahashi, K. Watanabe, M. Kitajima, Y. Matsumoto, K. G. Nakamura, and K. Ohmori, Nature Communications 4, 2801 (2013).
- Ali et al. (2014) M. N. Ali, J. Xiong, S. Flynn, J. Tao, Q. D. Gibson, L. M. Schoop, T. Liang, N. Haldolaarachchige, M. Hirschberger, N. P. Ong, and R. J. Cava, Nature 514, 205 (2014).
- Soluyanov et al. (2015) A. A. Soluyanov, D. Gresch, Z. Wang, Q. Wu, M. Troyer, X. Dai, and B. A. Bernevig, Nature 527, 495 (2015).
- Mar et al. (1992) A. Mar, S. Jobic, and J. A. Ibers, Journal of the American Chemical Society 114, 8963 (1992).
- (20) See Supplemental Material at [URL will be inserted by publisher] for complementary experimental and computational details.
- Amin et al. (2014) B. Amin, T. P. Kaloni, and U. Schwingenschlögl, RSC Adv. 4, 34561 (2014).
- Sie et al. (2019) E. J. Sie, C. M. Nyby, C. D. Pemmaraju, S. J. Park, X. Shen, J. Yang, M. C. Hoffmann, B. K. Ofori-Okai, R. Li, A. H. Reid, S. Weathersby, E. Mannebach, N. Finney, D. Rhodes, D. Chenet, A. Antony, L. Balicas, J. Hone, T. P. Devereaux, T. F. Heinz, X. Wang, and A. M. Lindenberg, Nature 565, 61 (2019).
- Das et al. (2016) P. K. Das, D. Di Sante, I. Vobornik, J. Fujii, T. Okuda, E. Bruyer, A. Gyenis, B. E. Feldman, J. Tao, R. Ciancio, G. Rossi, M. N. Ali, S. Picozzi, A. Yadzani, G. Panaccione, and R. J. Cava, Nature Communications 7, 10847 (2016).
- Hamann et al. (1979) D. R. Hamann, M. Schlüter, and C. Chiang, Phys. Rev. Lett. 43, 1494 (1979).
- Takeda (1978) T. Takeda, Zeitschrift für Physik B Condensed Matter 32, 43 (1978).
- Perdew et al. (1992) J. P. Perdew, J. A. Chevary, S. H. Vosko, K. A. Jackson, M. R. Pederson, D. J. Singh, and C. Fiolhais, Phys. Rev. B 46, 6671 (1992).
- Hamann (2013) D. R. Hamann, Phys. Rev. B 88, 085117 (2013).
- van Setten et al. (2018) M. van Setten, M. Giantomassi, E. Bousquet, M. Verstraete, D. Hamann, X. Gonze, and G.-M. Rignanese, Computer Physics Communications 226, 39 (2018).
- Giannozzi et al. (2009) P. Giannozzi, S. Baroni, N. Bonini, M. Calandra, R. Car, C. Cavazzoni, D. Ceresoli, G. L. Chiarotti, M. Cococcioni, I. Dabo, A. Dal Corso, S. de Gironcoli, S. Fabris, G. Fratesi, R. Gebauer, U. Gerstmann, C. Gougoussis, A. Kokalj, M. Lazzeri, L. Martin-Samos, N. Marzari, F. Mauri, R. Mazzarello, S. Paolini, A. Pasquarello, L. Paulatto, C. Sbraccia, S. Scandolo, G. Sclauzero, A. P. Seitsonen, A. Smogunov, P. Umari, and R. M. Wentzcovitch, Journal of Physics: Condensed Matter 21, 395502 (2009).
- Marini et al. (2009) A. Marini, C. Hogan, M. Grüning, and D. Varsano, Computer Physics Communications 180, 1392 (2009).
- Frenzel et al. (2017) A. J. Frenzel, C. C. Homes, Q. D. Gibson, Y. M. Shao, K. W. Post, A. Charnukha, R. J. Cava, and D. N. Basov, Phys. Rev. B 95, 245140 (2017).
- Ligges et al. (2009) M. Ligges, I. Rajkovic, P. Zhou, O. Posth, C. Hassel, G. Dumpich, and D. von der Linde, Applied Physics Letters 94, 101910 (2009).
- Dai et al. (2015) Y. M. Dai, J. Bowlan, H. Li, H. Miao, S. F. Wu, W. D. Kong, P. Richard, Y. G. Shi, S. A. Trugman, J.-X. Zhu, H. Ding, A. J. Taylor, D. A. Yarotski, and R. P. Prasankumar, Phys. Rev. B 92, 161104 (2015).
- He et al. (2016) B. He, C. Zhang, W. Zhu, Y. Li, S. Liu, X. Zhu, X. Wu, X. Wang, H. Wen, and M. Xiao, Scientific Reports 6, 30487 (2016).