Experimental and numerical analysis of cyclic deformation and fatigue behavior of a Mg-RE alloy
Abstract
Strain-controlled fatigue of Mg-1Mn-0.5Nd (wt.%) alloy were studied by experiment and simulation. The microstructure was made up of a dispersion of strongly texture grains (13%) embedded in a matrix of grains with a random texture. The cyclic stress-strain curves showed limited tension-compression anisotropy because of the limited texture. Cyclic hardening under compression and cyclic softening under tension occurred due to the presence of twinning. Moreover, the twin volume fraction of the broken samples depended on whether the sample was broken in tension or compression, indicating that twining-detwinning occurs during the whole fatigue life. The mechanical response of the polycrystalline alloy was simulated by means of computational homogenization. The behavior of the Mg grains was modelled using a phenomenological crystal plasticity model that accounted for basal, prismatic and pyramidal slip (including isotropic and kinematic hardening) as well as twining and detwinning. The model parameters were calibrated from the cyclic stress-strain curves at different cyclic strain amplitudes. Numerical simulations were used to understand the dominant deformation mechanisms and to predict the fatigue life by means of a fatigue indicator parameter based on the accumulated plastic shear strain in each fatigue cycle.
keywords:
A. magnesiumm , A. rare earth , A. fatigue , B. crystal plasticity , B. fatigue indicator parameter , slip , twin , back stress1 Introduction
Mg alloys present low density, good castability, high specific stiffness and reasonable cost and they are being considered for different structural applications in transportation (aerospace, automotive) (Mordike and Ebert, 2001; Li et al., 2020) as well as in health care (biodegradable implants) due to their excellent biocompatibility (Zheng et al., 2014; Echeverry-Rendon et al., 2019). These driving forces have impulsed the investigation on the deformation and fracture mechanisms of Mg alloys to improve the mechanical properties (Agnew and Nie, 2010; Nie, 2012). Mg has a HCP lattice with = 1.624 which leads to a negligible critical resolved shear stress (CRSS) for basal slip that cannot be easily increased through either solution (Wang et al., 2019) or precipitation hardening (Cepeda-Jiménez et al., 2019; Alizadeh and LLorca, 2020). Moreover, the CRSS for pyramidal slip is very high in most Mg alloys and plastic deformation along the axis has to be accommodated by twinning, leading to a strong plastic anisotropy that limits the ductility (Lloyd and Priddy, 2017). So far, the Mg alloys with best properties in terms of strength, ductility and limited plastic anisotropy have been obtained through the addition of rare earths (Y, Gd, Nd, Ce) which enhance pyramidal slip and reduce the strong basal texture generated during deformation processing (Bohlen et al., 2007; Stanford and Barnett, 2008).
While the relationship between microstructure and mechanical properties of Mg and Mg alloys under monotonic deformation has been analyzed extensively in recent years, the information about the mechanical behavior under cyclic deformation is more limited. Ogarevic and Stephens (1990) summarized the data available in the literature up to 1990, which was focused in the experimental determination of the S-N curves and fatigue crack growth rates under different loading conditions. More recent investigations in strongly textured Mg-Zn and Mg-Al alloy subjected to fully-reversed cyclic deformation showed that these alloys presented a strong tension-compression asymmetry due to continuous activation of twinning-detwinning in grains suitably oriented (Wu et al., 2008; Yu et al., 2011; Dong et al., 2014; Xiong et al., 2014). The strength in compression was controlled by the stress required to activate twinning, while the strength in tension was determined by the harder, non-basal slip mechanisms. The tension-compression asymmetry was smaller at low cyclic strain amplitudes because twinning was limited. Most of the twins formed during compression were removed when the load was reversed but the residual twin volume fraction gradually increased with the number of cycles. Moreover, in situ cyclic deformation tests have been carried out in synchrotron beams lines to determine accurately the critical stress for twinning an detwinning (Zhang et al., 2019; Murphy-Leonard et al., 2019b) and this information has been used within the framework of crystal plasticity finite element simulations to predict the cyclic stress-strain behavior (Zhang et al., 2019; Briffod et al., 2019). They showed that the information provided by the simulations is critical to assess the dominant deformation mechanisms in terms of slip and twinning which will determine the fatigue life of Mg alloys.
Previous investigations were focused in strongly textured Mg alloys and there is very limited experiment-simulation coupled studies on low cyclic fatigue of Mg-RE alloys. The cyclic deformation behavior of a Mg-Gd-Y alloy was studied by (Wang et al., 2013), who reported the cyclic stress-strain curves and the fatigue life as a function of the cyclic strain amplitude. In a follow-up paper, Wang et al. (2014) reported from fractographic observations the mechanisms of microcrack initiation during fatigue. They found that that microcracks were nucleated at grain boundaries at high strain amplitudes and along persistent slip bands at low strain amplitudes. However, their results were purely phenomenological and did not analyze the dominant deformation mechanisms neither included any theoretical or numerical modelling. Zhu et al. (2014) studied the fatigue deformation of Mg-RE alloys experimentally and numerically, while linear fracture mechanics model was used to study fatigue life and microstructure was not considered. Chen et al. (2017) reported experimental result of fatigue of Mg-RE alloys but they did not make modelling and simulation. In this investigation, the mechanical properties under monotonic (tension and compression) and fully-reversed cyclic deformation were determined in an extruded Mg - 1Mn - 0.5Nd (wt. %) alloy along the extrusion direction. The fatigue life was determined as a function of the cyclic strain amplitude and the deformation mechanisms were analyzed by means of computational homogenization using a phenomenological crystal-plasticity model. Finally, the fatigue life as a function of the cyclic strain amplitude was predicted from a fatigue indicator parameter based on the accumulated plastic shear strain in each slip system in each fatigue cycle
2 Material and Experimental Techniques
The Mg alloy containing 1 wt. % of Mn and 0.5 wt. % of Nd was manufactured by gravity casting, followed by homogenization at 623 K during 15 hours and extrusion at 573 K and 8.3 mm/s to produce round bars of 17 mm in diameter. The extrusion ratio was 1:30 and more details can be found in Hidalgo-Manrique et al. (2013). Longitudinal sections of the bars were prepared using standard techniques and analyzed by electron backscatter diffraction (EBSD) to determine the grain size and shape in a dual-beam field emission gun scanning electron microscope (Helios Nanolab 600i FEI) equipped with an Oxford-HKL electron back scattered system. In addition, the texture was measured by means of X-ray diffraction in the central region of the bars in sections perpendicular to the extrusion direction. The (0001), , , , and pole figures were measured using Cu Kα radiation in an Empyrean Panalytical diffractometer.
Monotonic (tension and compression) and fully-reversed, constant strain amplitude fatigue tests were carried out in cylindrical samples machined parallel to the extrusion direction. The dimensions of the samples are depicted in Fig. 1. All the mechanical tests were carried out in a servo-hydraulic mechanical testing machine. The deformation in the central section of the cylindrical specimens was measured (and controlled in the case of the cyclic tests) with an extensometer. Monotonic tests were carried out at an approximate strain rate of 10-3 s-1 under stroke control. Fatigue tests were carried out at three different cyclic strain semi-amplitudes of = 0.8%, 2.0 % and 4.0% at constant strain rate of 0.001 s-1
The specimens were initially deformed in tension in some cases and in compression in other cases. The load and the deformation were recorded during the tests, which finished when the sample failed. Longitudinal sections were prepared from the fractured specimens, polished and analyzed by EBSD at different distances from the fracture surface to determine the fraction of twinned material.

3 Experimental results
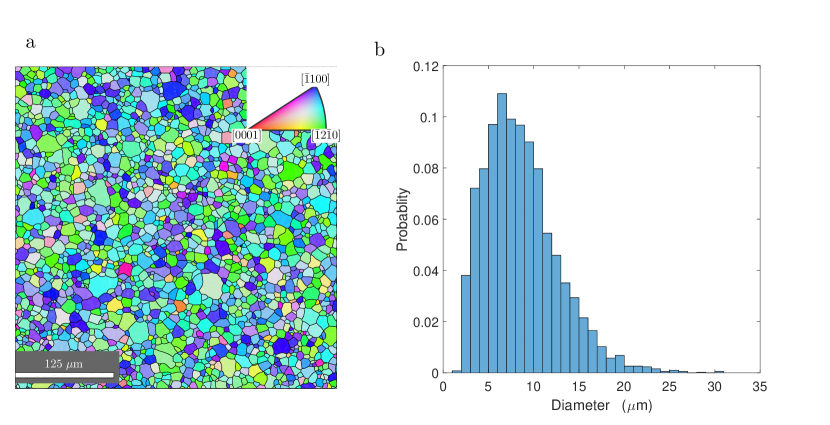
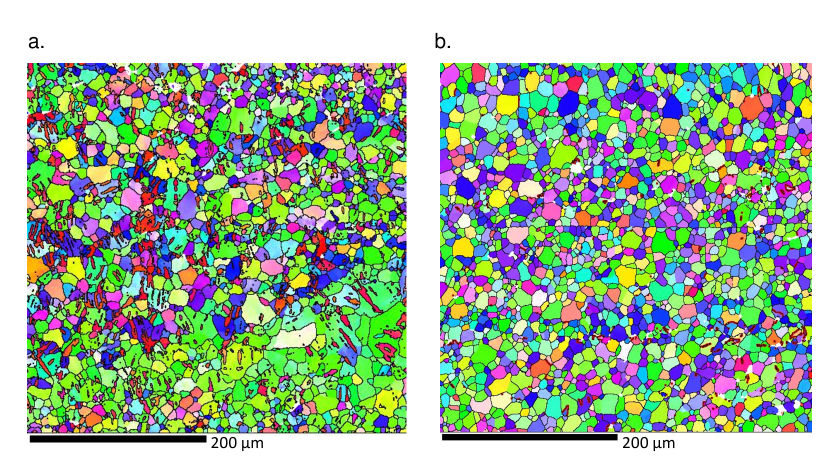
The microstructure of the material was analyzed by EBSD in a section perpendicular to the extrusion direction and the corresponding inverse pole figure map is shown in Fig. 2a. It shows a fully recrystallized microstructure containing fine equiaxed grains. The grain size distribution (determined from the area of each grain assuming that the grain shape was circular) is shown in Fig. 2b and the average grain size was 8.6 4.0 m.
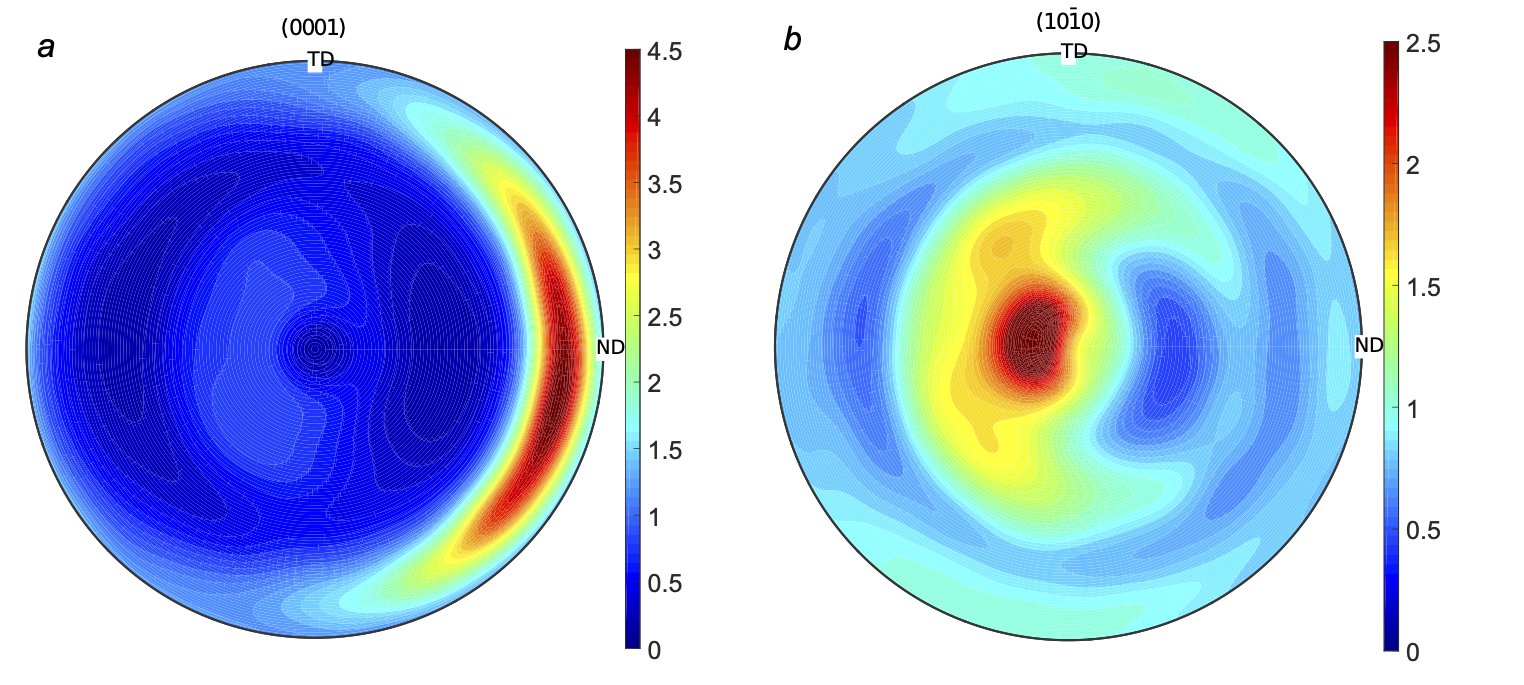
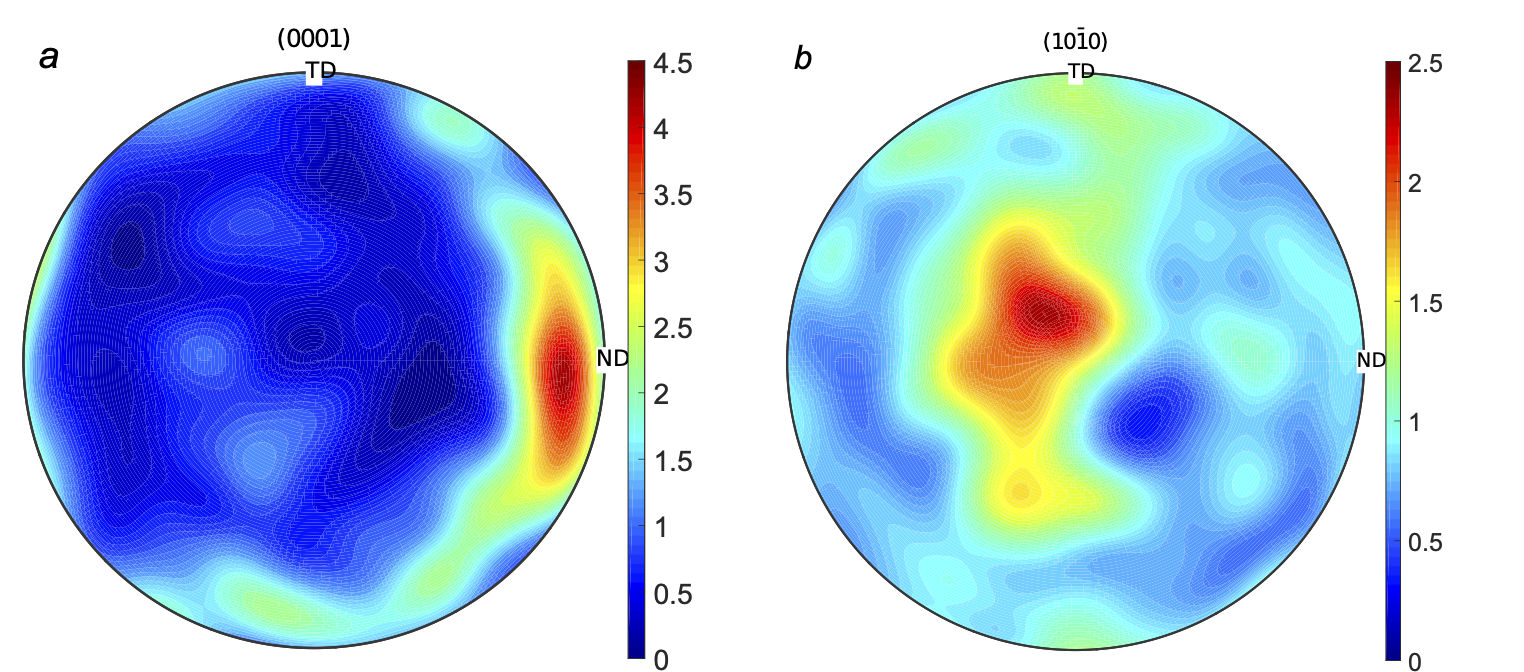
The texture of the material obtained by X-ray diffraction is given by the pole figures, indicating the orientation of basal (0001) and prismatic (100]) planes (Fig. 3). They show that the alloy has a noticeable fiber texture component (very likely because the Nd content was limited to 0.5 wt. %. Assuming a criterion of a misorientation angle 5∘, this microstructure can be approximated by a ”matrix” of Mg grains with random orientations (that occupies 87% of the volume fraction) which encompasses many ”inclusions” with volume fraction of made up by Mg grains with the basal plane practically parallel to the extrusion axis.
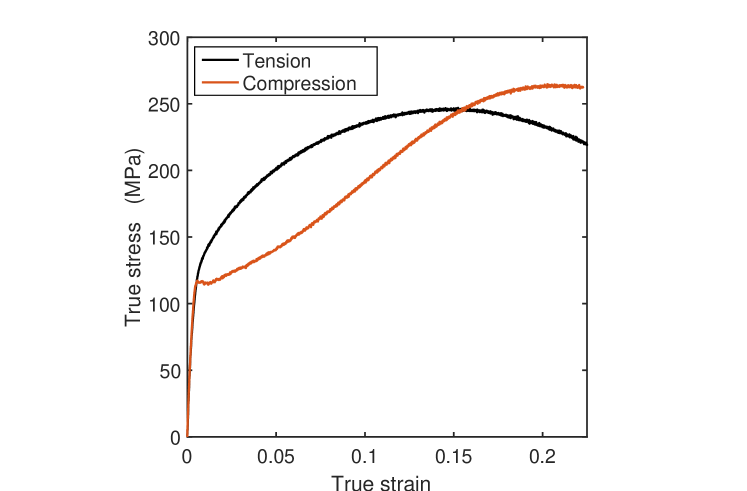
The mechanical properties of the alloy in tension and compression along the extrusion axis are plotted in Fig. 4. They are typical of a textured Mg alloy. The orientation of the basal planes parallel to the extrusion axis facilitates twinning deformation in compression, leading to the concave shape of the stress-strain curve after yielding. However, extension twining is not favored by texture during tensile deformation and deformation along the axis of the Mg lattice has to be accommodated by pyramidal slip, leading to the parabolic hardening in the stress-strain curves. Of course, basal slip will be activated both in tension and compression (although the Schmid factor in most basal planes will be low due to the texture) because of the low values of the critical resolved shear stress for basal slip.
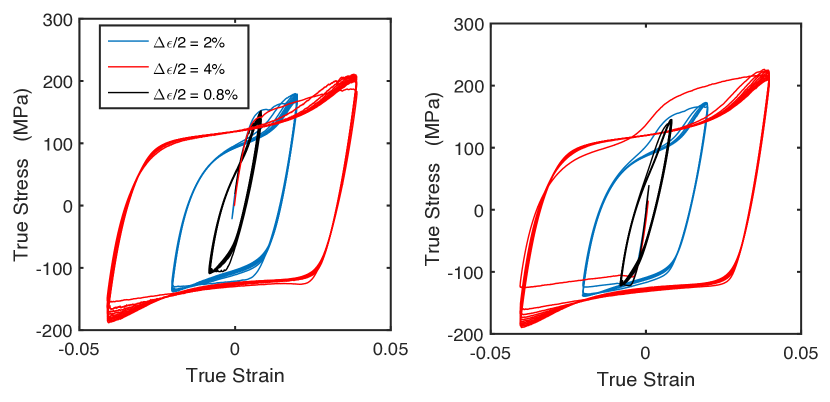
The cyclic stress-strain curves for different values of the applied cyclic strain amplitude are plotted in Figs. 5a and b. The curves of the former figure correspond to fatigue tests in which the specimen was initially deformed in tension and those in the latter to the specimens initially deformed in compression. In general, the cyclic stress-strain curves reached a steady-state condition after a few cycles and presented similar features to those reported by (Wu et al., 2008; Yu et al., 2011; Dong et al., 2014; Xiong et al., 2014) in Mg and Mg alloys. The specimens deformed initially in tension (Fig. 5a) showed parabolic hardening which was followed by twinning when the load was reversed. The initial shape of the stress-strain curve in the second load cycle in tension was not parabolic shape but presented an S-shape because of the activation of detwinning. Afterwords, the cyclic stress-strain curves did not change significantly with the number of cycles until failure. Similar differences in the stress-strain curves between the stress-strain curves of the first and following cycles were found in the samples deformed initially in compression (Fig. 5b) although the sequence of events was different: twinning developed during the initial deformation in compression and detwinning appeared in the second part of the first cycle, when the sample was loaded in tension.
The evolution of the maximum () and minimum () stress with the number of fatigue cycles is plotted in Fig. 6a) and b) for the specimens initially deformed in tension or in compression, respectively. for any given cyclic strain amplitude because twinning took place during the compressive part of the fatigue cycle. Moreover, the differences between the absolute values of and increased with because the contribution of twinning also increased. Both and remained practically constant throughout the test at = 0.8%, while strain softening in tension and strain hardening in compression with the number of cycles was observed in the specimens deformed at = 4%. The specimens deformed at = 2% also showed slight softening in tension. The progressive hardening under compression can be rationalized by the presence of twins, which act as obstacles to dislocation motion, and increased with the cyclic strain amplitude because together with the volume fraction of twins. On the contrary, detwinning took place during the tensile part of the fatigue cycle, leading to a reduction in the stress necessary to move dislocations.
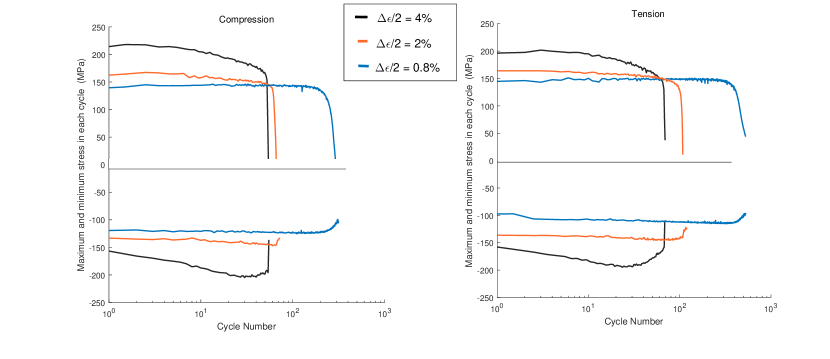
The fatigue life of the tested specimens was plotted in Fig. 7 as a function of the applied cyclic strain semi-amplitude, . It should be noted that the cyclic stress-strain curves in Figs. 5 and 6 were very similar for both tests.
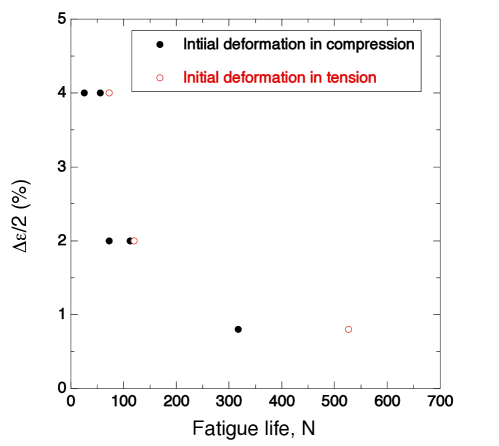
Selected specimens were sliced parallel to the loading direction after fracture and the microstructure was analyzed with EBSD close and far-away from the fracture surface. The EBSD images were analyzed using the HKL Channel 5 software and the tension twin regions were determined from the misorientation angle of between the Mg matrix and the twinned regions (Fig. 8). The twin volume fraction was determined close and far-away from the fracture surfaces and is depicted in Table 1. It should be noted that the fraction of twinned material is always higher near to the fracture surface indicating that the localization of damage in this region influenced the development of twins. In addition, twinning took place during the compressive part of the cycle while detwinning occurred in tension. Thus, the twin area fraction was much larger in the specimens that failed in compression as compared with those that failed in tension for . Unfortunately, all the specimens deformed at failed in compression and those tested at failed in tension.
| initial | TAF near fracture | TAF center | failure | |
| (%) | loading | (%) | (%) | point |
| 4% | Compression | not measured | 36.45 | compression |
| 4% | Tension | not measured | 26.56 | compression |
| 2% | Compression | 35.5 | 19.6 | compression |
| 2% | Tension | 9.8 | 0.3 | tension |
| 0.8% | Compression | 5.9 | 0.2 | tension |
| 0.8% | Tension | 8.8 | 1.5 | tension |
4 Computational homogenization
In literature the cyclic stress strain curves as well as twin volume fraction evolutions of Mg alloys were widely simulated by crystal plasticity models based on finite element, fast Fourier transformation and self consistent approaches (H.Wang et al., 2013; Segurado et al., 2018; Paramatmuni and Kanjarla, 2019; Tang et al., 2019; Indurkar et al., 2020). Most of these CP models adopted phenomenological type flow and hardening laws where twinning was modeled by as a pseudo-slip deformation mode (Kalidindi, 1998; Herrera-Solaz et al., 2014b, a).
4.1 Crystal plasticity framework
The crystal plasticity model followed the standard multiplicative decomposition of the deformation gradient into the elastic () and plastic () components according to (Kalidindi et al., 1992)
| (1) |
In the intermediate configuration, the plastic velocity gradient is the sum of the contributions due to slip () and twinning () as
| (2) |
and plastic slip in the twinned regions of the crystal was not included in the model because it is unlikely to occur due to the continuous twinning-detwinning during cyclic deformation (Murphy-Leonard et al., 2019a).
Plastic deformation in Mg alloys is known to occur in 3 (0001) [110] basal, 3 (100) [110] prismatic and 12 (101) [113] pyramidal slip systems, while tensile twinning takes place along 6 (012) [011] twins variants. The contribution of plastic slip to the plastic velocity gradient is expressed as
| (3) |
where and stand for the number of slip and twin systems, respectively. and are unit vectors parallel to the slip direction and slip plane normal, respectively, of slip system in the reference configuration and is the volume fraction of twins corresponding to the twin system .
The contribution of twining to the plastic velocity gradient can be expressed as
| (4) |
where and are unit vectors parallel to the twin direction and twin plane normal, respectively, of twin system in the reference configuration and (= 0.129 in Mg) (Herrera-Solaz et al., 2014b) is the eigenstrain associated to extension twinning which only takes place when the deformation leads to an extension of the axis of the HCP lattice.
The slip rate in a slip system is defined by a power-law dependency according to
| (5) |
where is the reference shear rate parameter, the strain rate sensitivity exponent and and stand for the isotropic and kinematic hardening contributions, respectively. is the resolved shear stress on the slip system that can be expressed as the projection of the second Piola-Kirchhoff stress, , on the current slip system , which is given by
| (6) |
The evolution law of the isotropic hardening can be expressed as (Kalidindi, 1998)
| (7) |
where is the latent hardening parameter between slip system and slip system . Parameter stands for the latent hardening parameter between slip system and twin system . Parameters and stand for the saturation critical resolved shear stress and the hardening modulus, respectively, of the slip system while and are the corresponding values for the twin system . is the slip-slip hardening exponent, while is the twin-slip hardening exponent.
The evolution of the backstress which determines the kinematic hardening during cyclic deformation is a simplification of the Ohno-Wang macroscopic model (Ohno and Wang, 1993), which is able to reproduce the complex cyclic behavior of a polycrystal. Mathematically,
| (8) |
where the parameter indicates the stabilized scalar back-stress for slip system , stands for the absolute value of the shear when the back-stress stabilizes and accounts for the non-linearity of the back stress evolution. This model was successfully applied to simulate the evolution of kinematic hardening in Ni-based superalloys during computational homogenization of polycrystals (Cruzado et al., 2017, 2018).
As twinning systems were treated as pseudo-slip systems, the evolution of the twin volume fraction in each twin variant, , also follows a power-law but the peculiarities of twinning have to be taken into account. In particular, tension twinning can only occur when the resolved shear stress on the twin plane leads to an extension of the axis and cannot progress anymore in any twin system if the whole region associated to the Gauss point is completely twinned (i.e. = 1). In addition, the twinned region can detwin when the resolved shear stress is opposed to the one required for twinning and reaches a critical value (Zhang et al., 2019; Murphy-Leonard et al., 2019b; Briffod et al., 2019; Yaghoobi et al., 2020). This means that can be negative or positive, but the resistance for twin boundary motion under both scenarios can be different. Mathematically, these conditions can be taken into account as
| (9) |
where is the reference twin volume fraction rate, represents the resolved shear stress on twin system, which can be calculated as in eq. (6) for the corresponding twin system, and are the stresses necessary to activate twining or detwinning. They do not have to be equal, following recent experimental observations (Zhang et al., 2019; Murphy-Leonard et al., 2019b).
The hardening law for twin boundary motion is expressed as
| (10) |
where – similar to equation (7) — stands for the twin/twin latent hardening parameter, the corresponding hardening modulus, the saturated critical resolved shear stress for twinning or de-twinning, and the twin-to-twin hardening exponent. It is assumed that plastic slip does not influence the hardening of twinning.
4.2 Homogenization strategy
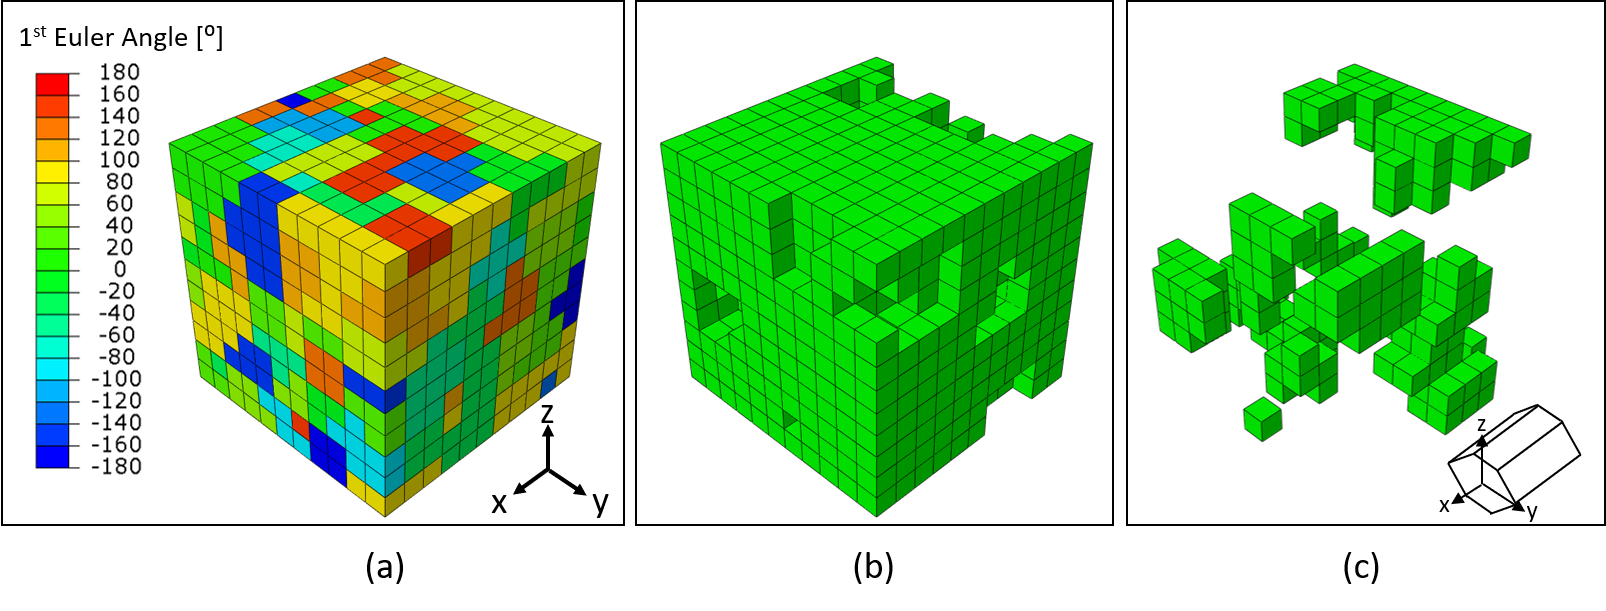
The mechanical response of the polycrystalline Mg alloys was determined by means of the finite element simulation of a Representative Volume Element (RVE) of the microstructure. The RVE was created using NEPER (Neper, 2020) included 200 grains which followed the grain size distribution in Figure 2b). The polycrystal was represented by a cubic domain, which was discretized with a regular mesh of 11 x 11 x 11 cubic C3D8R finite elements where each crystal is represented by about 7 elements. The orientation of the grains was obtained from the experimental orientation distribution function obtained by X-ray diffraction (Fig. 3). The actual pole figures of the grains in the RVE indicating the orientation of basal (0001) and (100) planes are shown in Fig. 9. This RVE was used in section 5.1 to identify the parameters of the crystal plasticity model and in section 5.2 to identify the cyclic deformation mechanisms.
The mechanical response of the aforementioned RVE under uniaxial cyclic deformation was simulated using Abaqus/Standard (Abaqus, 2018) within the framework of the finite deformations theory with the initial unstressed state as reference. The behavior of each crystal followed the crystal plasticity model presented above that was implemented as User Material subroutine (UMAT) in Abaqus. Periodic boundary conditions were applied along the three directions of the RVE. Uniaxial cyclic deformation was obtained by applying an alternating cyclic displacement in one direction while the total stresses in both perpendicular directions were 0. The applied strain rate was 10-3 s-1. More details about the numerical homogenization strategy can be found elsewhere (Herrera-Solaz et al., 2015)
5 Numerical results and discussion
5.1 Parameter identification
The elastic constants of the Mg single crystals for the simulations were obtained from the literature (Zhang and Joshi, 2012) and can be found in Table 2. The main parameters of the crystal plasticity model were adjusted by comparison of experimental and simulated cyclic stress-strain curves. They were the initial and saturated critical resolved shear stress of each slip system as well as of twinning and de-twinning, the corresponding strain hardening moduli and the parameters for kinematic hardening for each slip system. They are depicted in Table 3. Some model parameters were adopted from the literature (Fernández et al., 2011; Herrera-Solaz et al., 2014a). They are included in Table 4.
| 59.4 | 25.6 | 61.6 | 21.4 | 16.4 |
| Slip/twin mode | basal | prismatic | pyramidal | twinning | detwinning |
|---|---|---|---|---|---|
| (MPa) | 8 | 78 | 165 | 30 | 23.7 |
| (MPa) | 19 | 90 | 180 | 31 | 24.5 |
| (MPa) | 25 | 150 | 450 | 600 | 600 |
| (MPa) | 40 | 390 | 825 | ||
| 5 | 5 | 5 | |||
| 10 | 10 | 10 |
| 0.001 s-1 | |
|---|---|
| 0.001 s-1 | |
| 0.1 | |
| (coplanar slip systems) | 1 |
| (non coplanar slip systems) | 1.4 |
| 2.0 | |
| 1.0 | |
| 1.1 | |
| 2.0 | |
| 1.0 |
The experimental cyclic stress-strain curves are plotted together with those obtained by computational homogenization in Fig. 10 for the specimens deformed initially in either tension or compression at different cyclic strain semi-amplitudes. Overall, the simulated cyclic stress-strain curves are in good agreement with the experimental results and capture the anisotropy in the curves associated with the successive development of twinning and detwinning during cyclic loading. It is worth noting that the experimental and predicted values of the saturated maximum (tension) and minimum (compression) stresses were similar in the case of the samples deformed initially in tension or in compression for each cyclic strain amplitude. Moreover, the stabilization of the simulated cyclic stress-strain curves occurred by rapidly (in a few cycles) while there was some variation during the fatigue life in the experimental results, particularly in the specimens deformed at = 4% (Fig. 6).
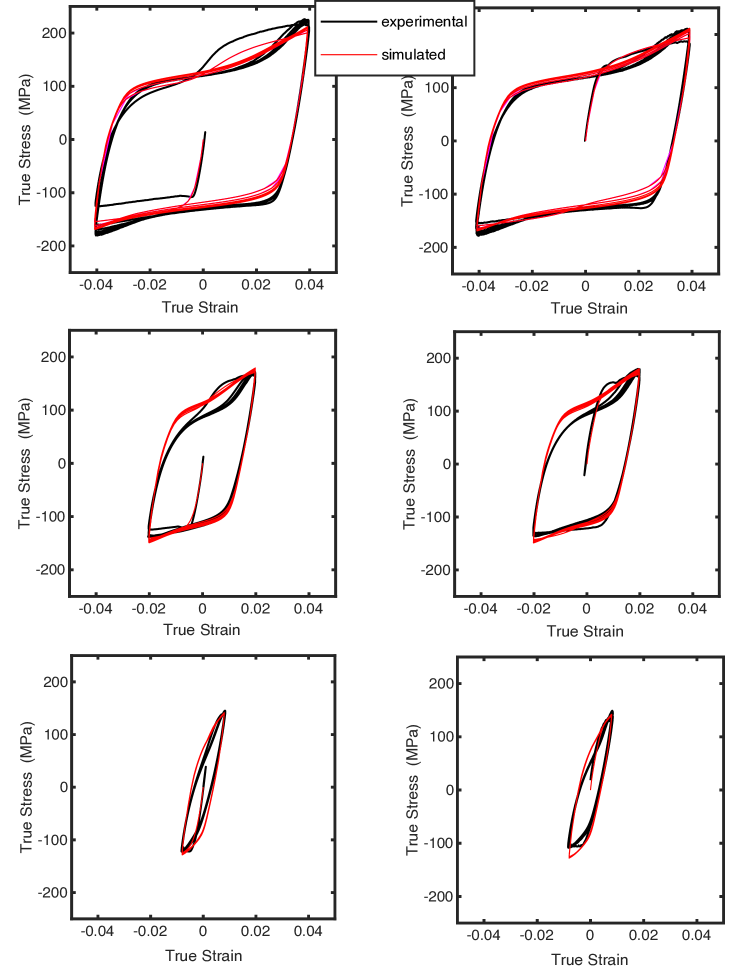
In addition to the stress-strain curves, the fraction of twinned material predicted by the computational homogenization strategy is compared in Table 5 with the experimental measurements of the twin area fraction far away from the fracture surfaces. It is important to notice that the fraction of twinned material was much larger when the sample failed in compression than in tension in the sample deformed at = 2% because twinning developed during the compressive part of the fatigue cycle and detwinning in the tensile one. The numerical model was able to capture accurately this phenomenon particular for the specimens deformed at =2%, as shown by the results in Table 5. Unfortunately, the same result could not be ascertained in the samples deformed at = 4% and 0.8% because the former always failed in compression and the latter in tension.
| Experimental | Simulated | Failure point | |
|---|---|---|---|
| (%) | (%) | (%) | |
| 4% | 36.45 | 30.2 | compression |
| 4% | 26.56 | 30.1 | compression |
| 2% | 19.6 | 19.13 | compression |
| 2% | 0.3 | 7.2 | tension |
| 0.8% | 0.2 | 2.4 | tension |
| 0.8% | 1.5 | 2.5 | tension |
5.2 Deformation mechanisms
The extruded Mg-1Mn-0.5Nd alloy presented a peculiar texture (Fig. 3) which could be approximated by a composite material formed by Mg inclusions with the basal plane practically parallel to the extrusion axis ( 5∘) embedded in a matrix of Mg crystals with random texture. This texture was assigned to the the aforementioned RVE shown in Fig. 11 and it is expected that the deformation mechanisms in the matrix and inclusion regions of the RVE should be different.
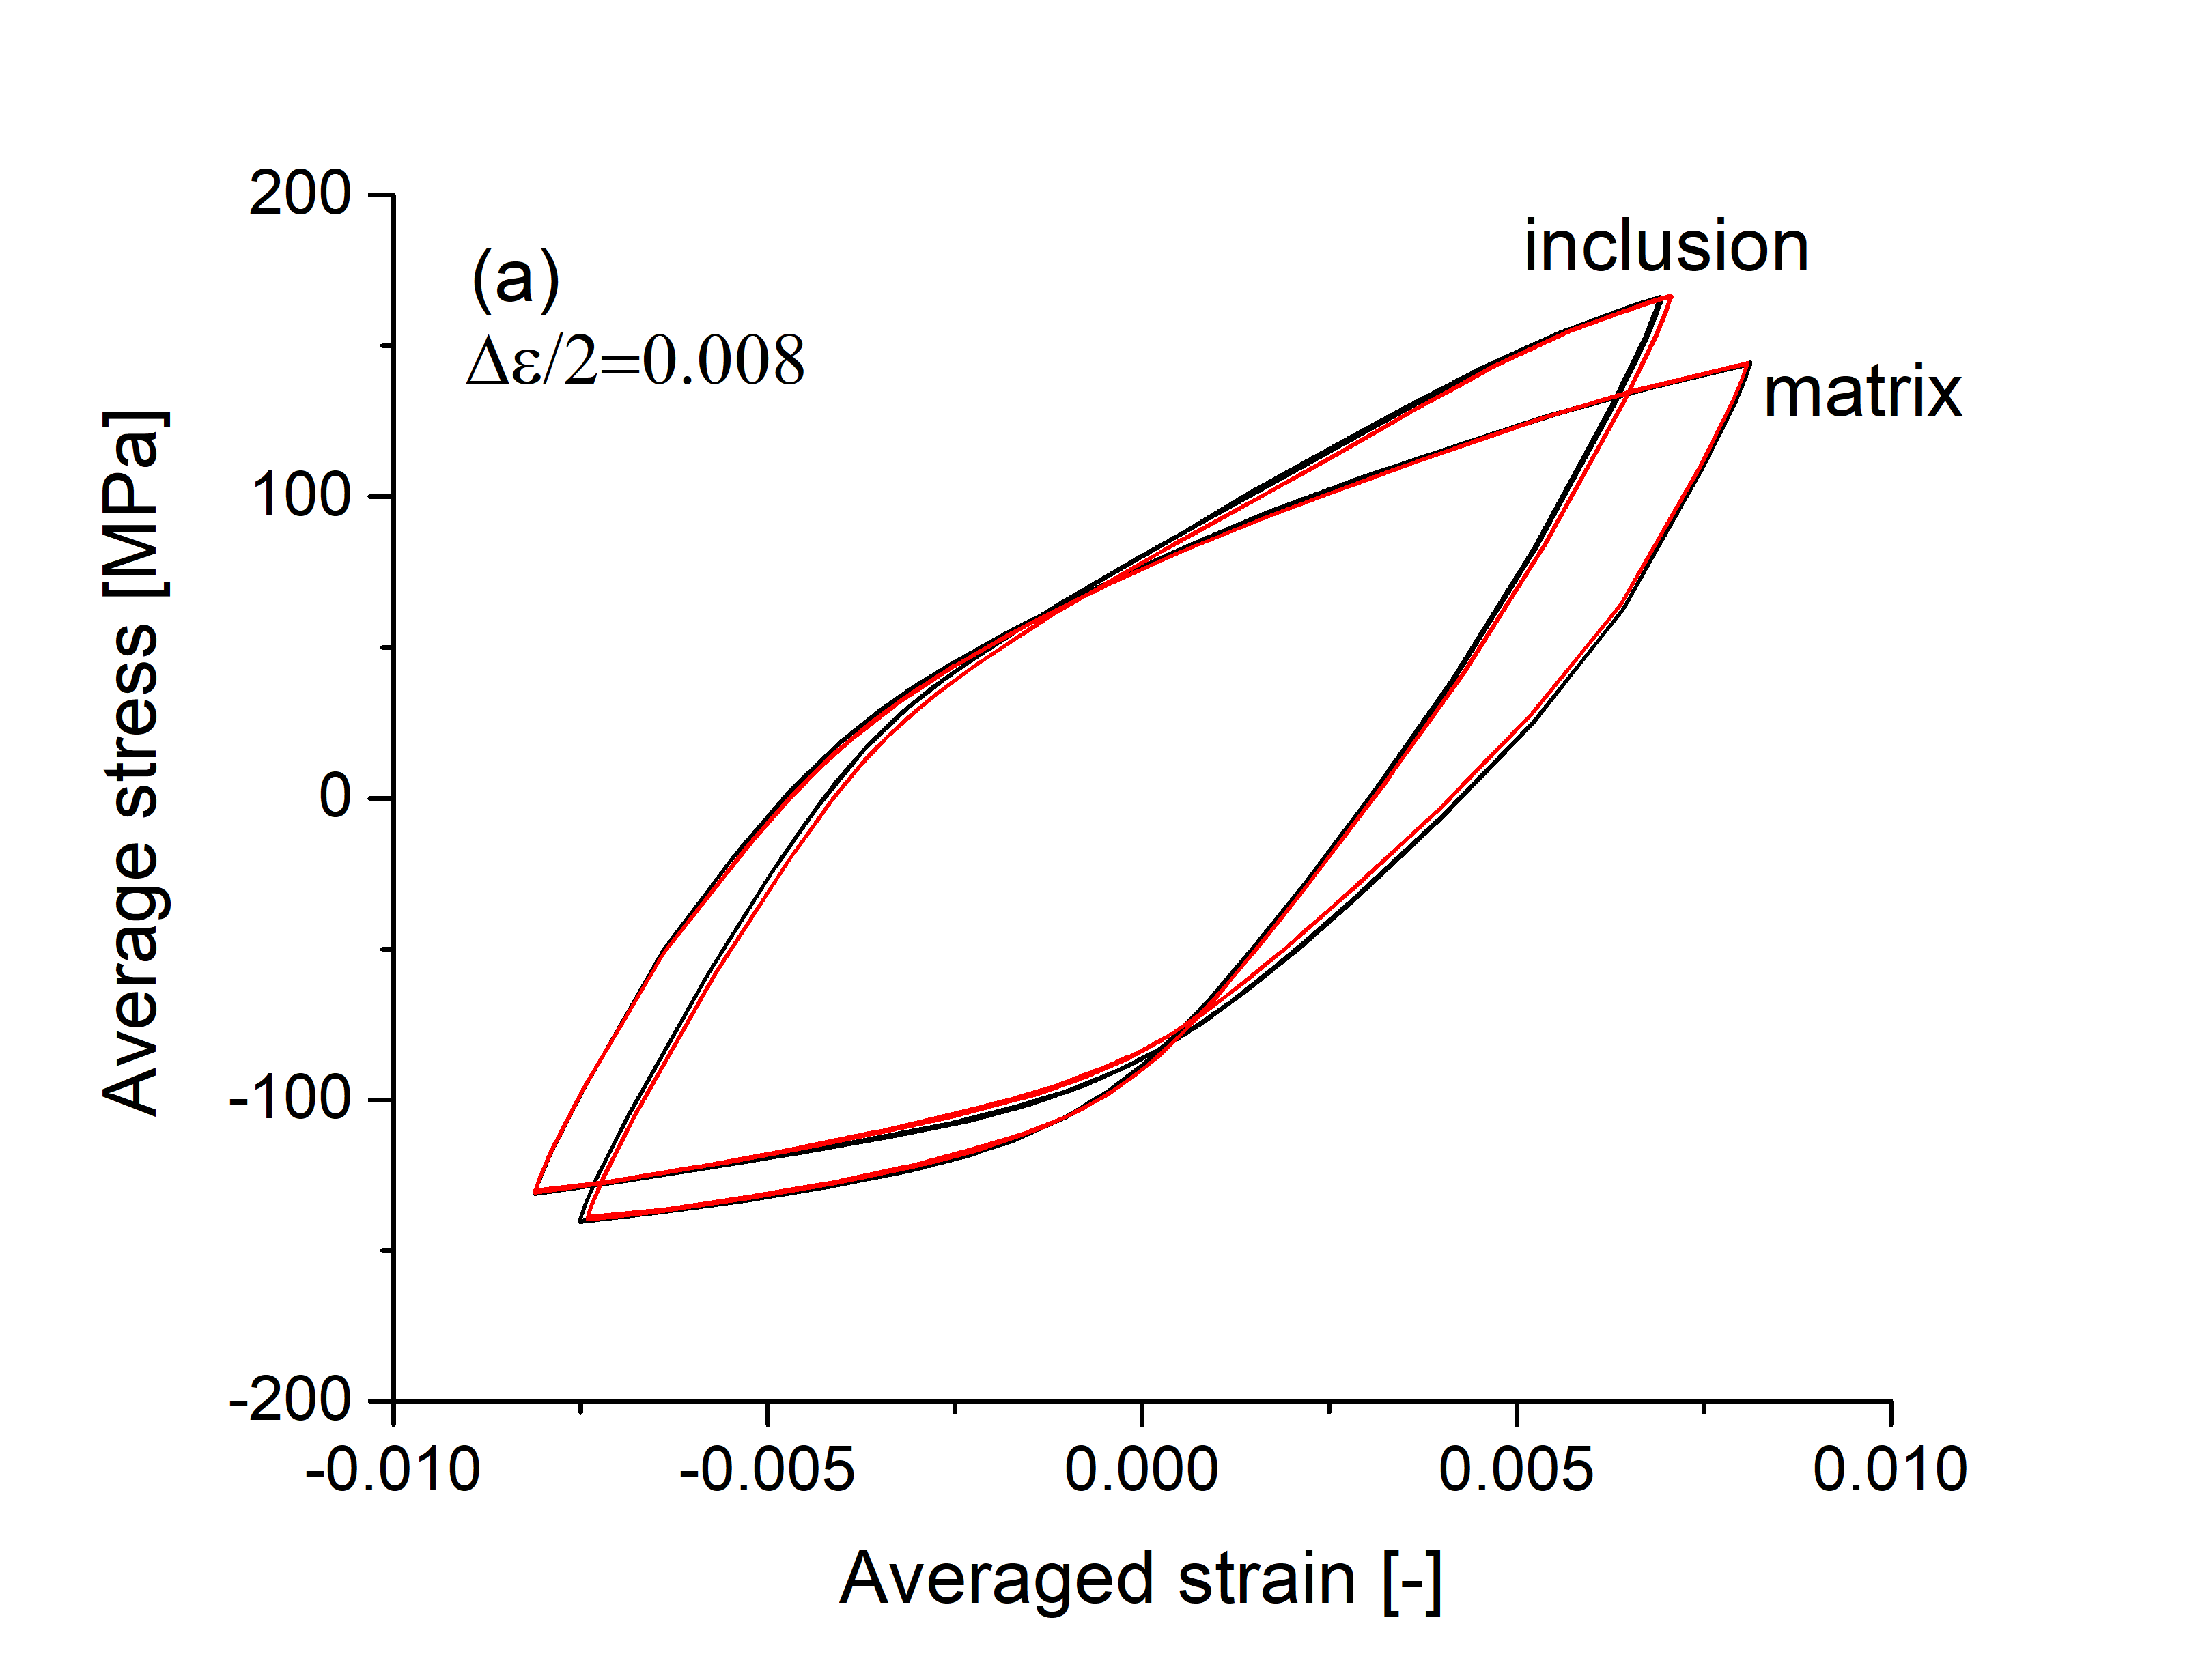
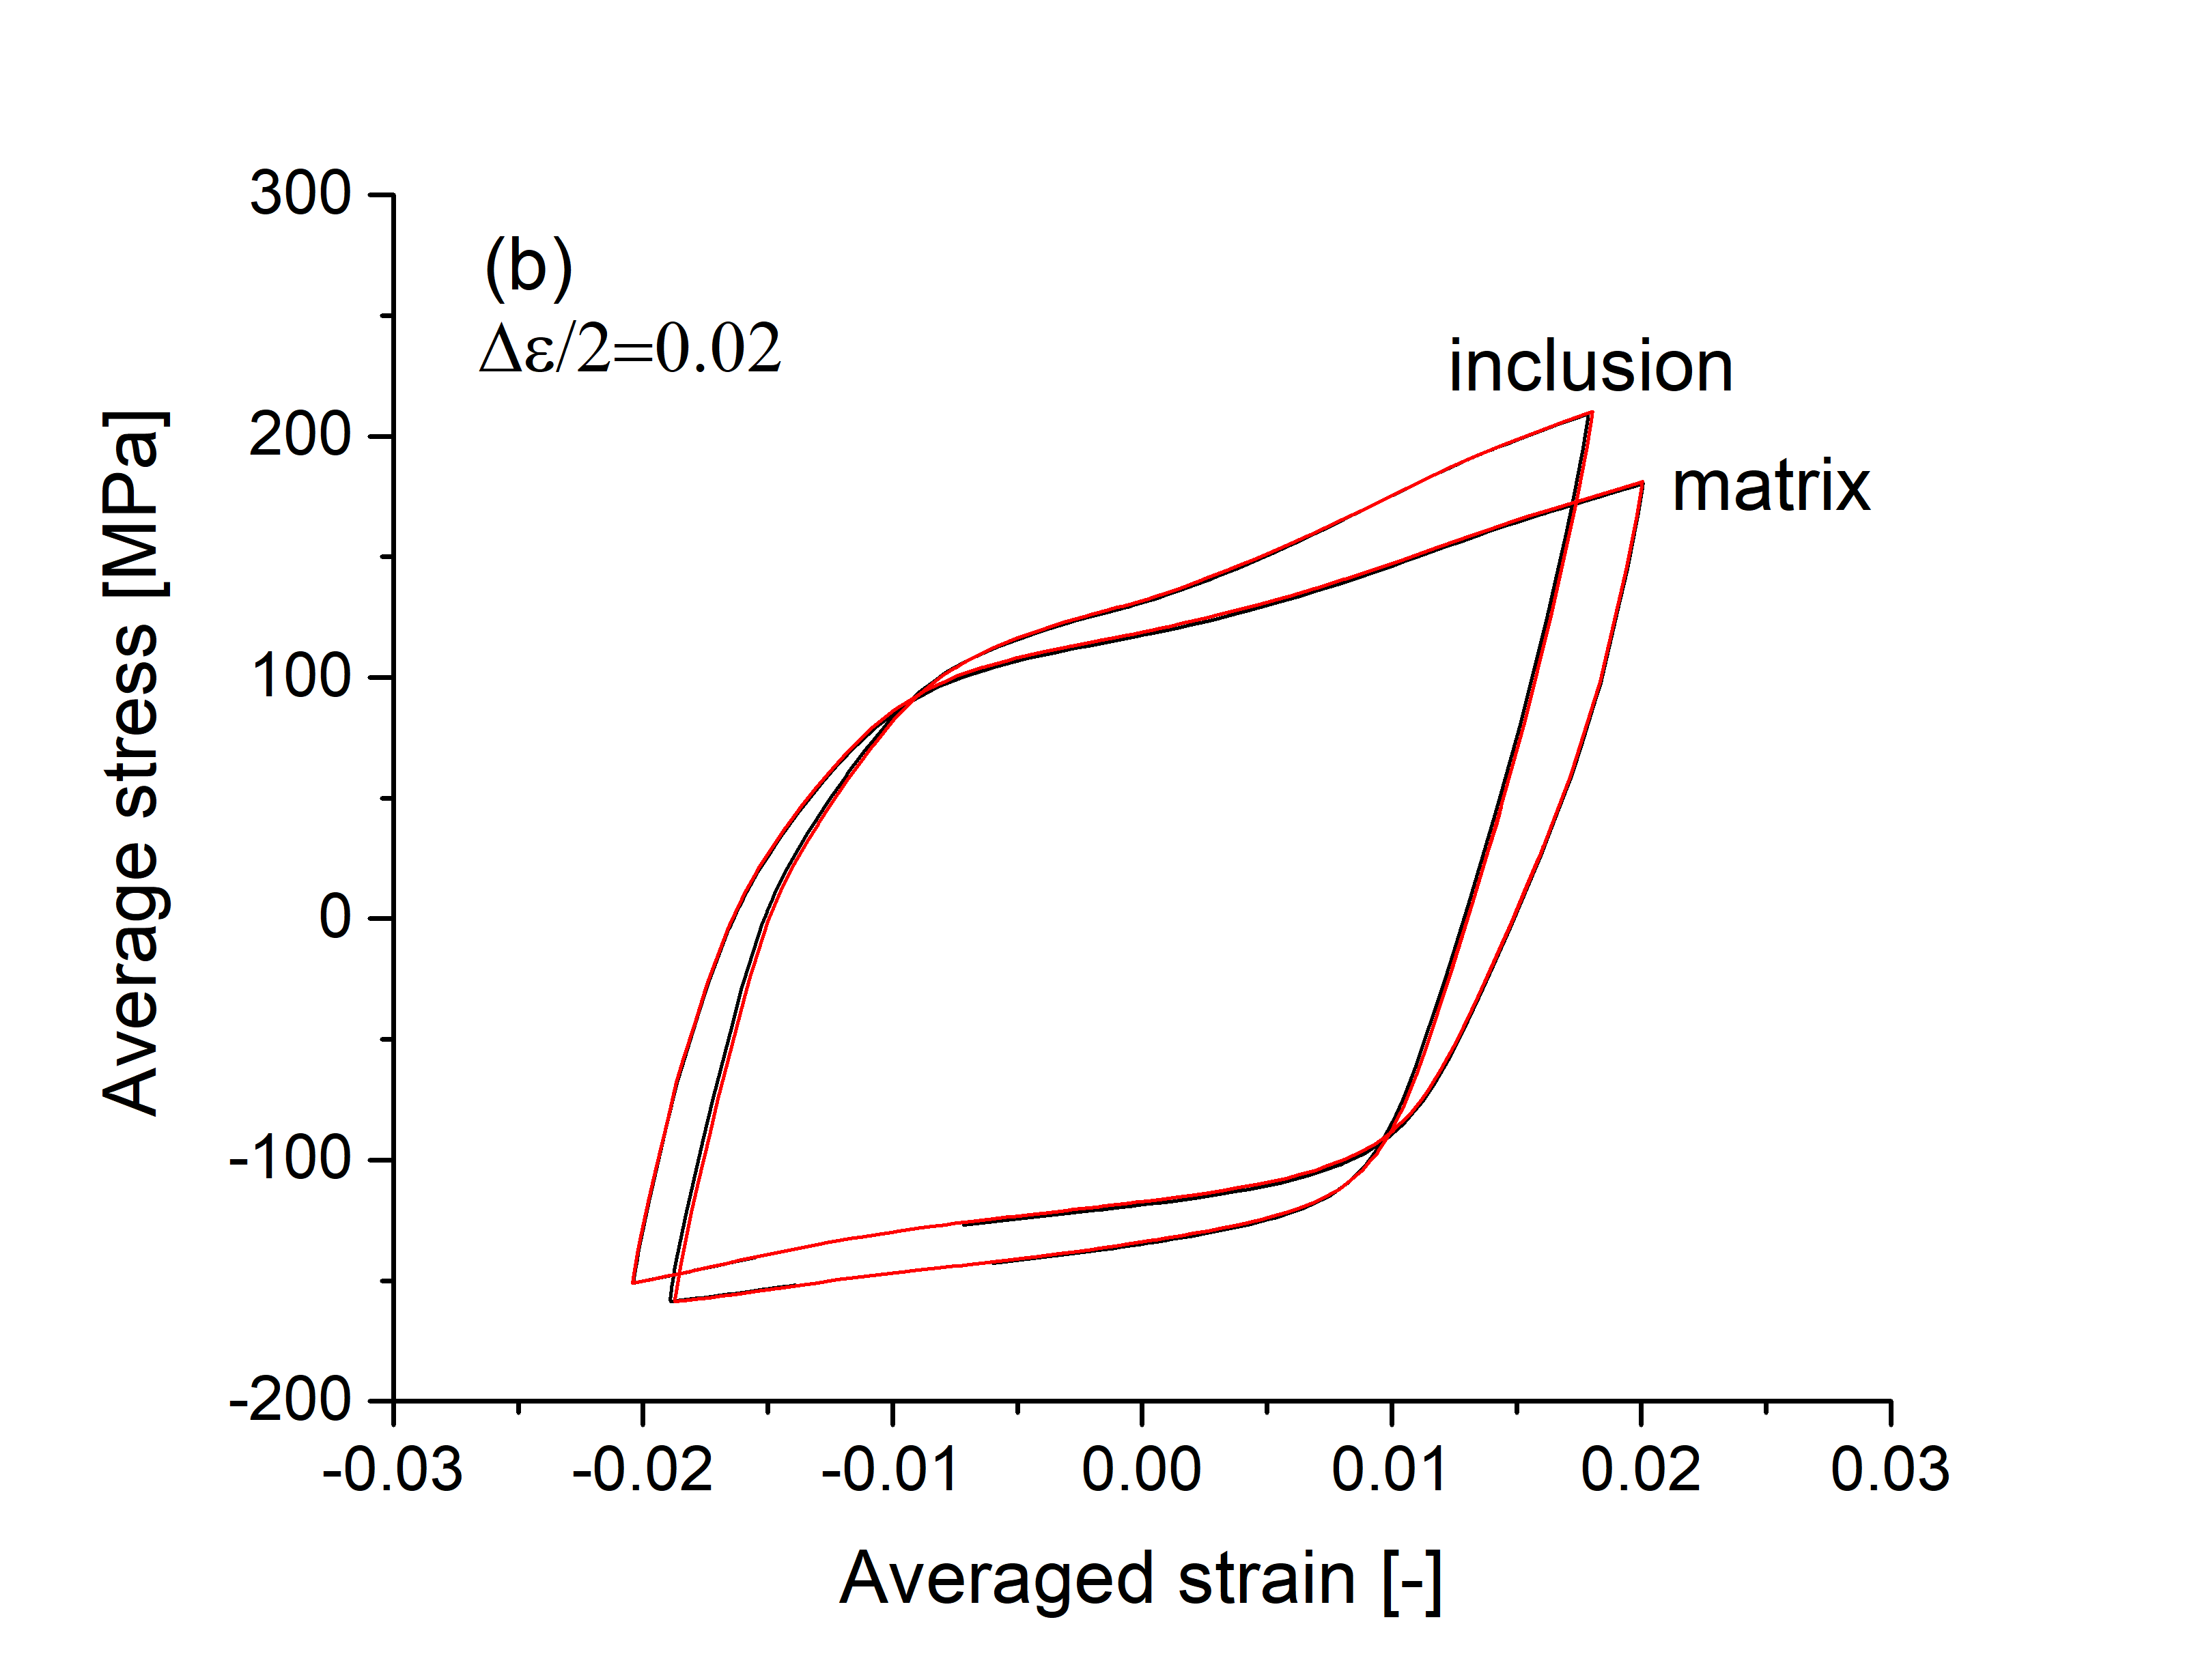
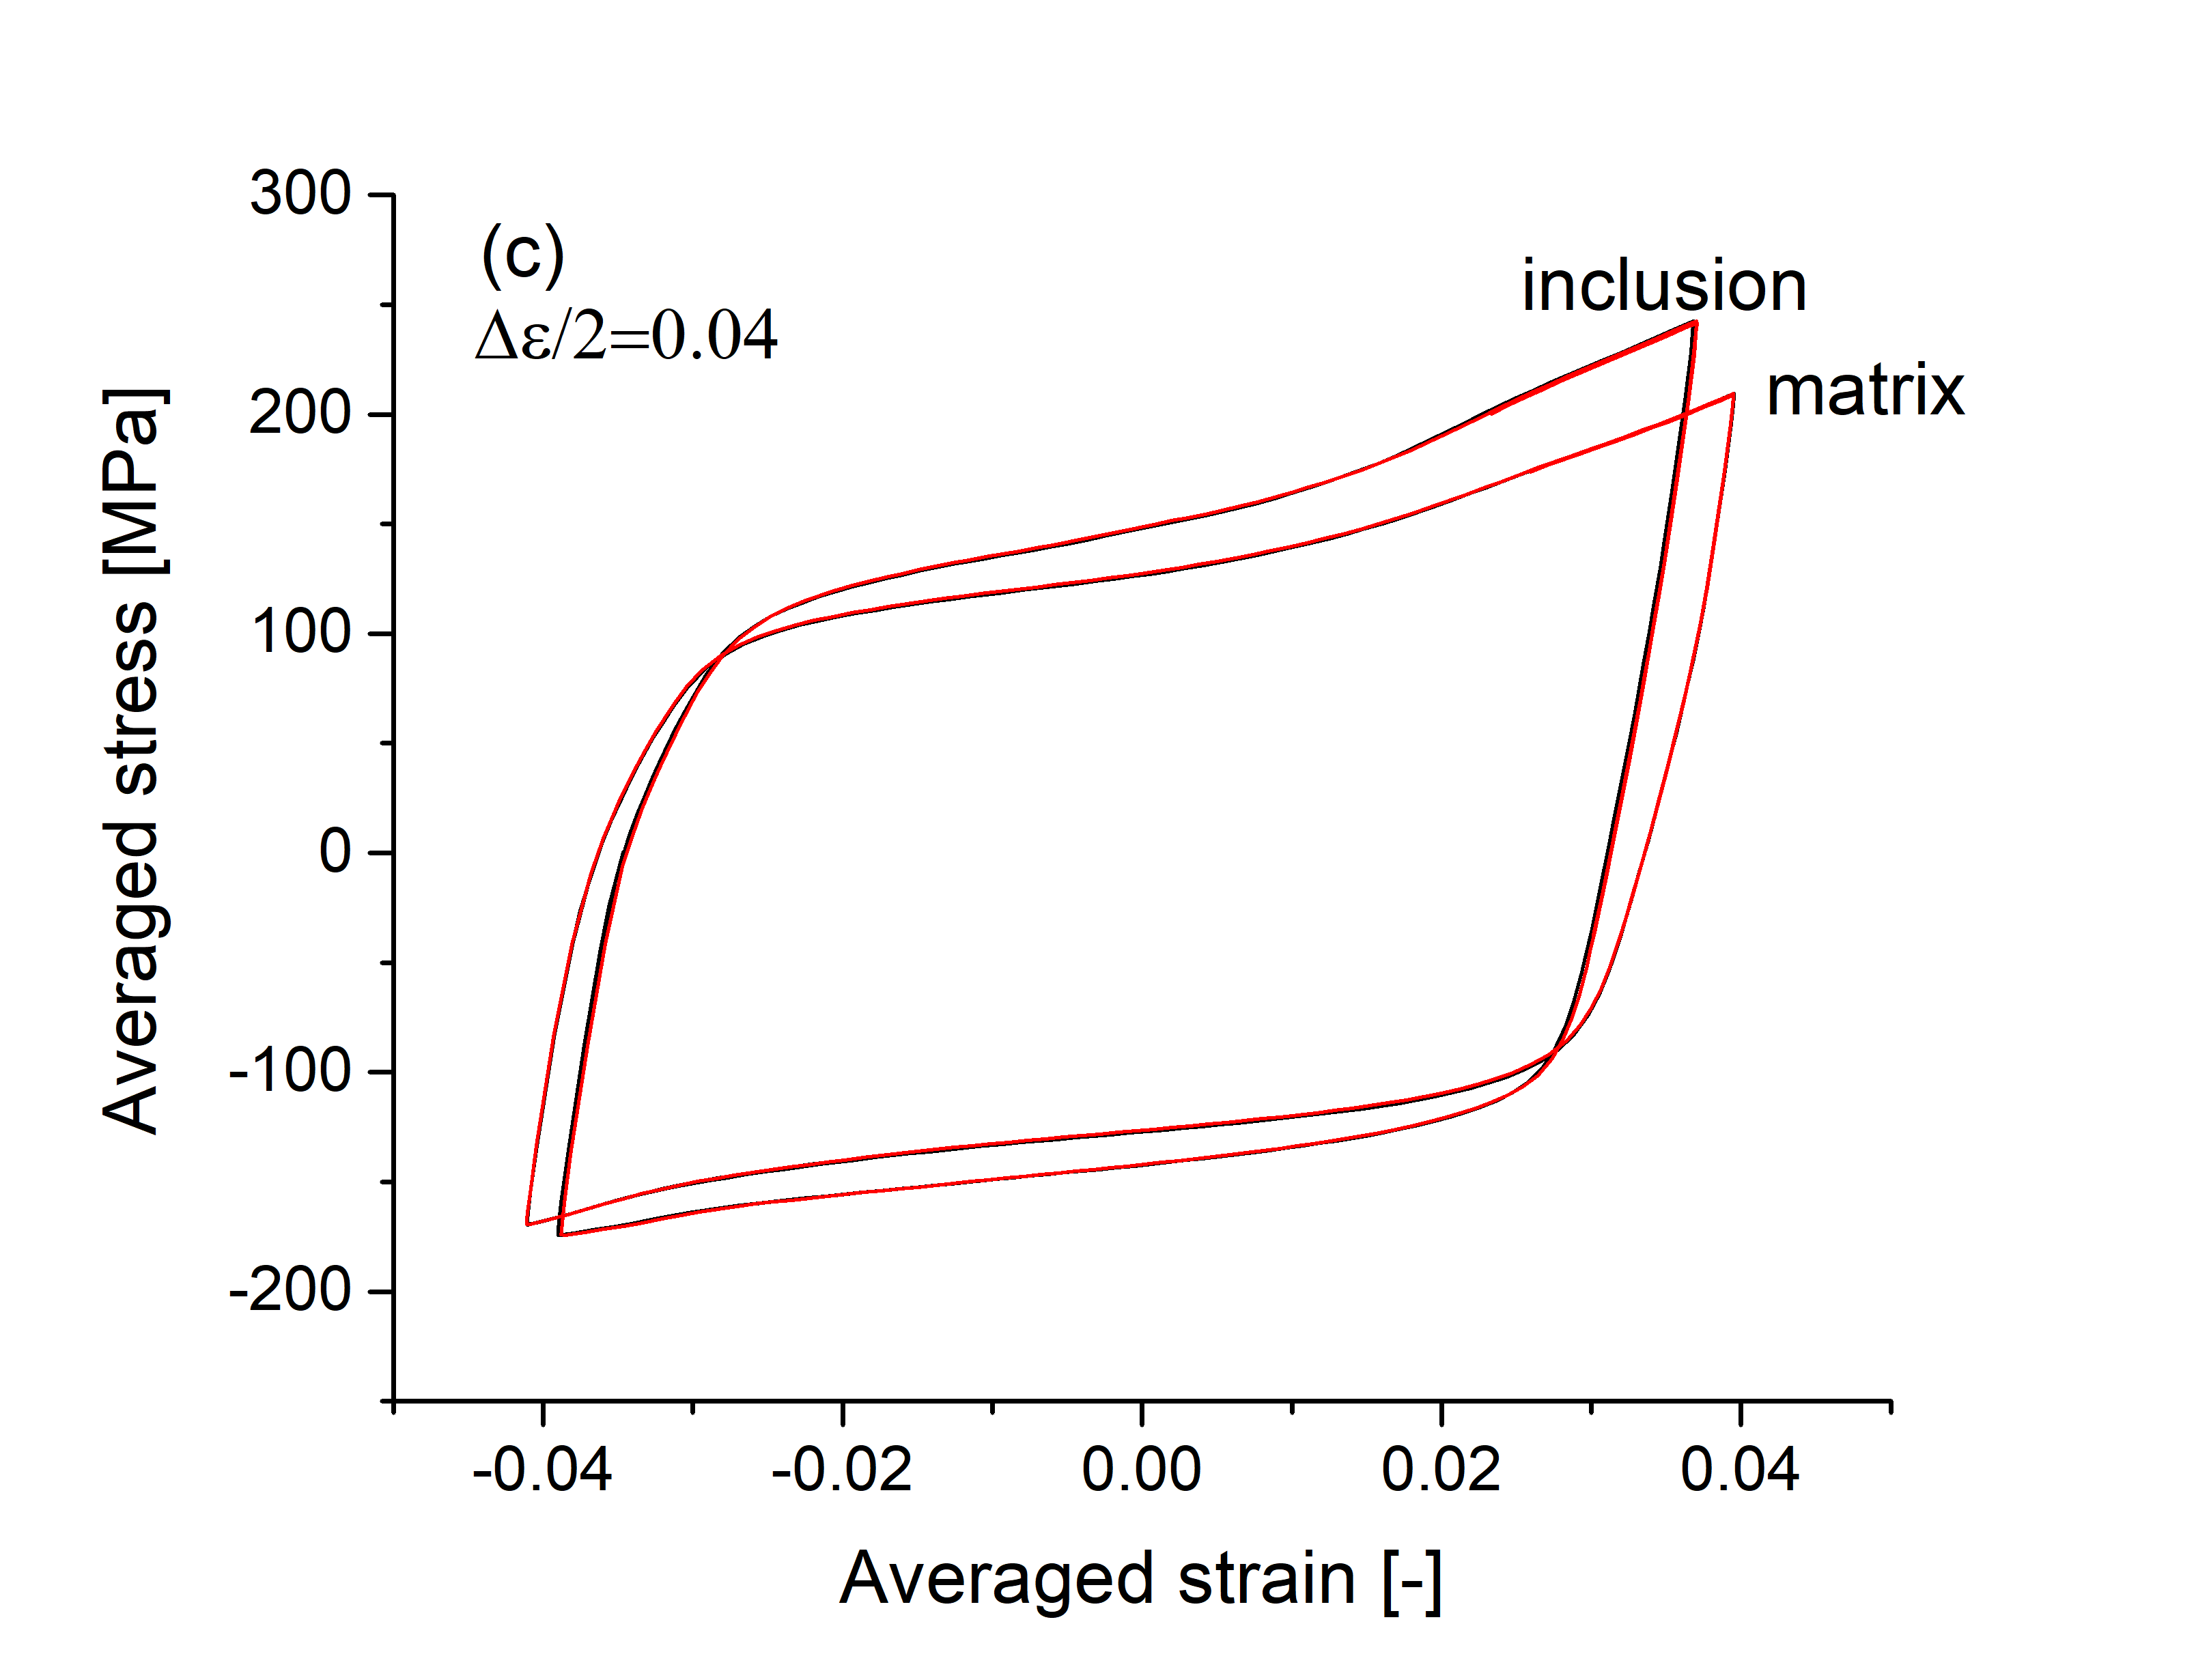
The average cyclic stress-strain curves corresponding to the matrix and the inclusions obtained by the simulation of the RVE are plotted in Figs. 12a, b and c for the specimens deformed at = 0.8%, 2% and 4%. The curves correspond to the saturated cyclic-strain curves and include the curves when the RVE was initially deformed in tension or compression, which were superposed in all cases. These curves show that the strain hardening rate in the inclusions during tensile part of the fatigue cycle was higher than that in the matrix while similar hardening rates were found in both regions in compression.
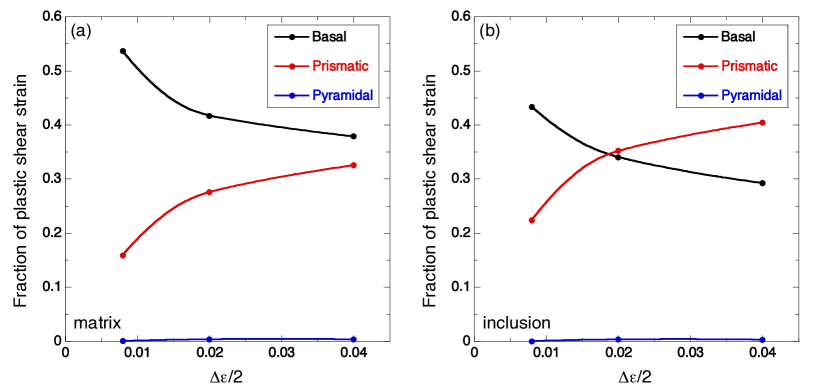
The differences in the hardening rates in tension and compression between the matrix and inclusion regions can be understood from the activities of the different deformation mechanisms in each region during one fatigue cycle. The relative contribution of basal, prismatic and pyramidal slip to the plastic shear strain during one fatigue cycle is plotted as a function of the applied cyclic strain semi-amplitude, in Figs. 13a and b, for the matrix and inclusion regions of the RVE, respectively. At low cyclic strain amplitudes (and, thus, small applied stress), basal slip is the dominant deformation mechanism in the matrix and in the inclusions because the stresses are low and is more difficult to activate prismatic slip, which requires higher stresses. The differences in the relative contributions of basal and prismatic slip between the matrix and the inclusions reflect the strong texture in the inclusions which are not suitably oriented for basal slip. The fraction of plastic strain accommodated by prismatic slip increased in both regions with the because of the higher stresses and, in fact, prismatic slip becomes dominant in the inclusions when = 4%. Overall, the fraction of shear strain accommodated by prismatic slip in the inclusions was higher that that in the matrix, and this difference explained the higher strain hardening rate during the tensile part of the fatigue cycle in the inclusions (Fig. 12)
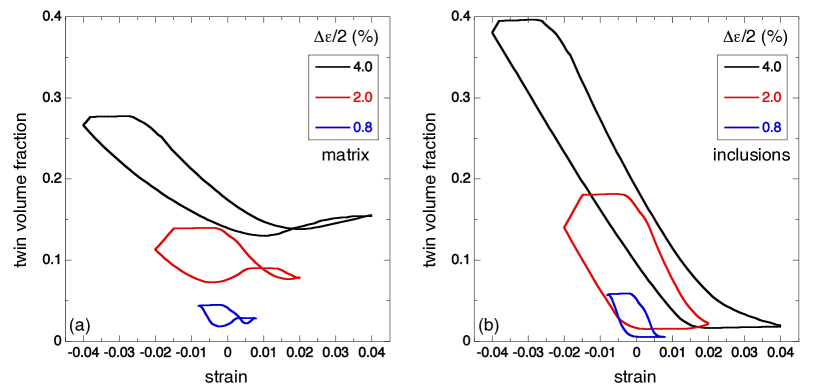
The results of the simulations in Fig. 13 also show that pyramidal slip was not active during cyclic deformation and, thus, deformation of the Mg grains along the was accommodated by means of twinning. The evolution of the twin volume fraction in the matrix and inclusion regions of the RVE during each fatigue cycle is plotted in Figs. 14a and b, respectively, for different values of the applied cyclic strain amplitude. The twin volume fraction increases rapidly during the compressive part of the fatigue cycle, particularly in the inclusions while detwinning is activated during the tensile part of the fatigue cycle. Full detwinning occurs in each fatigue cycle in the inclusion regions while some residual twinning is found in the matrix and the magnitude of this residual twin volume fraction increased with the applied cyclic strain amplitude. Full detwinning of the inclusions and partial detwinning of the matrix regions is also related to the differences in texture between both regions.
5.3 Prediction of fatigue life
Current strategies to predict the fatigue life of polycrystalline materials are based on the use of Fatigue Indicator Parameters (FIPs) (Shenoy et al., 2007). The FIPs are are associated to the main driving force that controls crack formation and can obtained from the evolution of mechanical fields and internal variables at the local level within the RVE in each fatigue cycle (Segurado et al., 2018). The most common ones are based exclusively on the local plastic strain fields such as the plastic shear strain accumulated in one fatigue cycle (McDowell et al., 2003; Manonukul and Dunne, 2004). It should be noted that most of the fatigue life during low-cycle fatigue is dominated by the growth of small in cracks. Nevertheless, most of models to predict the fatigue life based on computational homogenization assume that the fatigue life can be predicted from FIPs obtained from RVEs without cracks (Shenoy et al., 2007; Segurado et al., 2018). This hypothesis is supported by the fact that many FIPs, such as the accumulated plastic strain or the energy dissipated in each fatigue, are good indicators of the driving force for both fatigue crack initiation and fatigue crack propagation of small cracks.
In the case of a hcp Mg crystal with 3 basal, 3 prismatic and 12 pyramidal slip systems, the plastic shear strain accumulated in the slip system of the voxel in each fatigue cycle can be determined as
| (11) |
where the contribution of twinning/detwinning to the plastic shear strain has not been included because this is a reversible process that does not contribute to the accumulation of damage. It might be that twinning-detwinning influences the nucleation of cracks during fatigue but this phenomenon is not clearly established. For instance, Wang et al. (2014) reported the mechanisms of microcrack initiation during fatigue of a Mg-G-Y alloy. They found that microcracks were nucleated at grain boundaries at high strain amplitudes and along persistent slip bands at low strain amplitudes. Twin boundaries were not identified as loci for fatigue crack initiation.
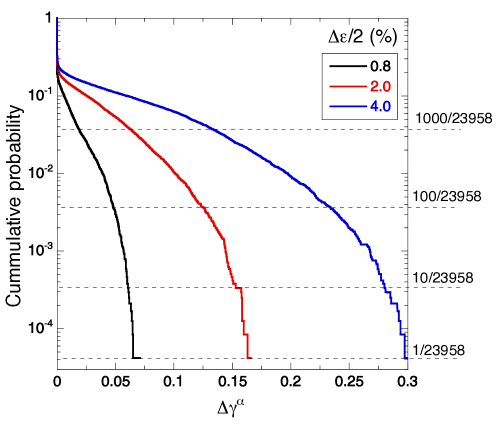
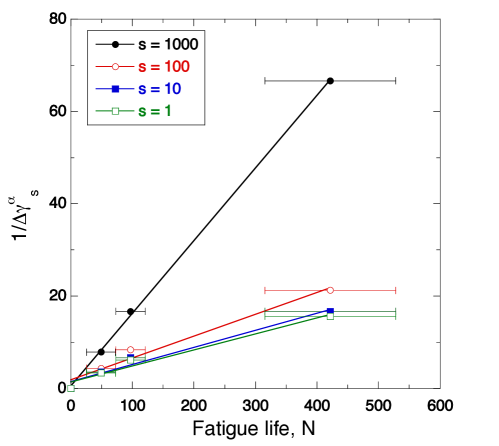
Obviously, varies throughout the microstructure of the RVE and fatigue damage will be nucleated in the voxel with the highest accumulated plastic shear strain in stable fatigue cycles, which stands for the FIP. Nevertheless, it has been noticed that the maximum value of FIP may depend on the details of the finite element discretization. Various of averaging approaches were proposed to avoid spurious stress concentrations and minimize mesh size effects (Castelluccio and McDowell, 2015). One possibility is to determine the FIP by volume averaging over a region representative of the crack incubation zone (Shenoy et al., 2007; Castelluccio and McDowell, 2015; Cruzado et al., 2018) but the mesh dependency can also be partially removed by extracting the FIP from the statistical distribution of throughout the RVE. There are 23958 slip systems in the RVE taking into account there are 1331 integration points and 18 slip systems (3 basal, 3 prismatic and 12 pyramidal) in each integration point. The cumulative probability of is plotted in Fig. 15 for the RVE deformed at = 0.8%, 2.0% and 4.0%. The highest plastic shear strain accumulated in one slip system in each fatigue cycle, , corresponds to a cumulative probability of 1/23958 while the values of which are attained in 10 (), 100 () and 1000 () slips systems of the RVE during one fatigue cycle are given by the corresponding cumulative probabilities, as shown in Fig. 15. The highest values of were found within the matrix regions of the RVE.
The plastic shear strain accumulated that is attained in = 1, 10, 100 or 1000 slip systems during one fatigue cycle can be used to estimate the fatigue life according to
| (12) |
where is a model parameter whose value depends on the chosen as the FIP. The experimental results of the fatigue life in Fig. 7 can be fitted to eq. (12) using different values of for each FIP, which can be found in Table 6. They were obtained by the least squares fitting of the experimental results to eq. (12). The four FIPs used in eq. (12) to estimate the fatigue life led to reasonable predictions and none of them can be selected as the best one because of the experimental scatter and the limited number of tests. These results seem to indicate that the fatigue life of Mg alloys containing rare earths is controlled by the localization of plastic strain in each fatigue cycle. Due to the limited texture of these alloys, basal slip is the dominant deformation mechanism and, thus, controls the nucleation of fatigue cracks during cyclic deformation. The current study explicitly addresses the influence of the crystallographic texture on the fatigue life of Mg alloys and could be helpful to design Mg alloys with longer fatigue life.
| Fatigue indicator parameters | |
|---|---|
| 28.0 | |
| 26.0 | |
| 20.5 | |
| 6.35 |
6 Conclusions
The fatigue behavior under fully-reversed cyclic deformation was studied in an extruded Mg-1Mn-0.5Nd alloy. An advanced CP-FEM model was developed by considering important deformation mechanisms, i.e. basal slip, prismatic slip, and pyramidal slip, twinning and detwinning and back stress. At the same time, the computational homogenization was carried out using a 3D representative volume element. Although the pole figure of extruded Mg-1Mn-0.5Nd shew a typical extrusion texture, the magnitude of the texture is much smaller than the typical texture of Mg alloys without rare earth elements. Thus, the current paper reported the first detailed experiment-simulation-coupled study of the fatigue deformation mechanisms of Mg-RE alloy with weak texture. The main conclusion of our paper was the following:
-
1.
Cyclic hardening under compression and cyclic softening under tension was observed due to the presence of twinning and detwinning. Moreover, the twin volume fraction of the broken samples depended on whether the sample was broken in tension or compression, indicating that twining-detwinning occurs during the whole fatigue life.
-
2.
The cyclic deformation was mainly accommodated by basal slip, prismatic slip and continuous twinning-detwinning. As full detwinning occurred in the inclusion regions but not in the matrix regions, texture influences fatigue life explicitly.
-
3.
For the first time the fatigue life of the Mg-RE alloy was predicted from a fatigue indicator parameter based on the accumulated shear in a stable hysteresis loop.
7 Acknowledgements
This investigation was supported by the European Union Horizon 2020 research and innovation programme (Marie Sklodowska-Curie Individual Fellowships, Grant Agreement 795658) and the Comunidad de Madrid Talento-Mod1 programme (Grant Agreement PR-00096). Additional support from the European Research Council under the European Union’s Horizon 2020 research and innovation programme (Advanced Grant VIRMETAL, grant agreement No. 669141) and by the HexaGB project of the Spanish Ministry of Science (reference RTI2018-098245) is also gratefully acknowledged. The authors thank to Dr. M. T. Pérez-Prado who supplied the Mg alloy used in this investigation.
References
- Abaqus (2018) Abaqus, 2018. Analysis User’s manual. Dassault Systèmes .
- Agnew and Nie (2010) Agnew, S.R., Nie, J.F., 2010. The current state of magnesium alloy science and technology. Scripta Materialia 63, 671–673.
- Alizadeh and LLorca (2020) Alizadeh, R., LLorca, J., 2020. Interaction between basal dislocations and precipitates in Mg-4Zn alloy: Mechanisms and strengthening. Acta Materialia 186, 475–486.
- Bohlen et al. (2007) Bohlen, J., Nürnberg, M.R., Senn, J.W., Letzig, D., Agnew, S.R., 2007. The texture and anisotropy of magnesium–zinc–rare earth alloy sheets. Acta Materialia 55, 2101 – 2112.
- Briffod et al. (2019) Briffod, F., Shiraiwa, T., Enoki, M., 2019. Numerical investigation of the influence of twinning/detwinning on fatigue crack initiation in az31 magnesium alloy. Materials Science and Engineering: A 753, 79–90.
- Castelluccio and McDowell (2015) Castelluccio, G.M., McDowell, D.L., 2015. Microstructure and mesh sensitivities of mesoscale surrogate driving force measures for transgranular fatigue cracks in polycrystals. Materials Science and Engineering: A 639, 626 – 639.
- Cepeda-Jiménez et al. (2019) Cepeda-Jiménez, C.M., Castillo-Rodríguez, M., Pérez-Prado, M.T., 2019. Origin of the low precipitation hardening in magnesium alloys. Acta Materialia 165, 164 – 176.
- Chen et al. (2017) Chen, G., Ren, J., Gao, H., Cui, Y., Chen, X., 2017. Pseudoelastic and corrosion behaviors of mg zek100 alloy under cyclic loading. International Journal of Fatigue 103, 466–477.
- Cruzado et al. (2017) Cruzado, A., LLorca, J., Segurado, J., 2017. Modeling cyclic deformation of inconel 718 superalloy by means of crystal plasticity and computational homogenization. International Journal of Solids and Structures 122-123, 148 – 161.
- Cruzado et al. (2018) Cruzado, A., Lucarini, S., LLorca, J., Segurado, J., 2018. Microstructure-based fatigue life model of metallic alloys with bilinear coffin-manson behavior. International Journal of Fatigue 107, 40–48.
- Dong et al. (2014) Dong, S., Jiang, Y., Dong, J., Wang, F., W.Ding, 2014. Cyclic deformation and fatigue of extruded zk60 magnesium alloy with aging effects. Materials Science and Engineering A 615, 262–272.
- Echeverry-Rendon et al. (2019) Echeverry-Rendon, M., Allain, J., Robledo, S.M., Echeverria, F., Harmsen, M., 2019. Coatings for biodegradable magnesium-based supports for therapy of vascular disease: A general view. Materials Science and Engineering C 102, 150–163.
- Fernández et al. (2011) Fernández, A., Pérez-Prado, M.T., Wei, Y., Jerusalem, A., 2011. Continuum modeling of the response of a Mg alloy AZ31 rolled sheet during uniaxial deformation. International Journal of Plasticity 27, 1739–1757.
- Herrera-Solaz et al. (2014a) Herrera-Solaz, V., Hidalgo-Manrique, P., Perez-Prado, M., Letzig, D., Llorca, J., Segurado, J., 2014a. Effect of rare earth additions on the critical resolved shear stresses of magnesium alloys. Materials Letters 128, 199–203.
- Herrera-Solaz et al. (2014b) Herrera-Solaz, V., LLorca, J., Dogan, E., Karaman, I., Segurado, J., 2014b. An inverse optimization strategy to determine single crystal mechanical behavior from polycrystal tests: Application to az31 mg alloy. International Journal of Plasticity 57, 1–15.
- Herrera-Solaz et al. (2015) Herrera-Solaz, V., Segurado, J., LLorca, J., 2015. On the robustness of an inverse optimization approach based on the Levenberg-Marquardt method for the mechanical behavior of polycrystals. European Journal of Mechanics/A 53, 220 – 228.
- Hidalgo-Manrique et al. (2013) Hidalgo-Manrique, P., S.B. Yi, J.B., Letzig, D., Prez-Prado, M., 2013. Effect of nd additions on extrusion texture development and on slip activity in a mg-mn alloy. Metallurgical and Materials Transactions A 44A, 4819–4829.
- H.Wang et al. (2013) H.Wang, P.D.Wu, J.Wang, C.N.Tomé, 2013. A crystal plasticity model for hexagonal close packed (hcp) crystals including twinning and de-twinning mechanisms. International Journal of Plasticity 49, 36–52.
- Indurkar et al. (2020) Indurkar, P., Baweja, S., Perez, R., Shailendr, Joshi, P., 2020. Predicting textural variability effects in the anisotropic plasticity and stability of hexagonal metals: Application to magnesium and its alloys. International Journal of Plasticity 132, 102762.
- Kalidindi (1998) Kalidindi, S., 1998. Incorporation of deformation twinning in crystal plasticity models. Journal of the Mechanics and Physics of Solids 46, 267–290.
- Kalidindi et al. (1992) Kalidindi, S., Bronkhorst, C., Anand, L., 1992. Crystallographic texture evolution in bulk deformation processing of fcc metals. Journal of the Mechanics and Physics of Solids 40, 537–569.
- Li et al. (2020) Li, H., Wen, J., He, J., Shi, H., Tian, P., 2020. Progress in research on biodegradable magnesium alloys: a review. Advanced Engineering Materials 22, 2000213.
- Lloyd and Priddy (2017) Lloyd, J.T., Priddy, M.W., 2017. Simulating strain localization in rolled magnesium. Acta Materialia 129, 149 – 158.
- Manonukul and Dunne (2004) Manonukul, A., Dunne, F., 2004. High- and low-cycle fatigue crack initiation using polycrystal plasticity. Proceedings of the Royal Society of London A: Mathematical, Physical and Engineering Sciences 460, 1881–1903.
- McDowell et al. (2003) McDowell, D., Gall, K., Horstemeyer, M., Fan, J., 2003. Microstructure-based fatigue modeling of cast a356-t6 alloy. Engineering Fracture Mechanics 70, 49–80.
- Mordike and Ebert (2001) Mordike, B., Ebert, T., 2001. Magnesium: Properties - applications - potential. Materials Science and Engineering: A 302, 37–45.
- Murphy-Leonard et al. (2019a) Murphy-Leonard, A., D.C. Pagan, A., Miller, M., 2019a. Quantification of cyclic twinning-de-twinning behavior during low-cycle fatigue of pure magnesium using energy x-ray diffraction. International Journal of Fatigue 125, 314–323.
- Murphy-Leonard et al. (2019b) Murphy-Leonard, A.D., Pagan, D.C., Beaudoin, A., Miller, M.P., Allison, J.E., 2019b. Quantification of cyclic twinning-detwinning behavior during low-cycle fatigue of pure magnesium using high energy X-ray diffraction. International Journal of Fatigue 125, 314 – 323.
- Neper (2020) Neper, 2020. http://www.neper.info.
- Nie (2012) Nie, J.F., 2012. Precipitation and hardening in magnesium alloys. Metallurgical and Materials Transactions 43A, 3891–3939.
- Ogarevic and Stephens (1990) Ogarevic, V.V., Stephens, R.I., 1990. Fatigue of magnesium alloys. Annual Review on Materials Science 20, 141–177.
- Ohno and Wang (1993) Ohno, N., Wang, J., 1993. Kinematic hardening rules with critical state of dynamic recovery, part i: Formulation and basic features for ratchetting behavior. International Journal of Plasticity 9, 375–390.
- Paramatmuni and Kanjarla (2019) Paramatmuni, C., Kanjarla, A., 2019. A crystal plasticity fft based study of deformation twinning, anisotropy and micromechanics in hcp materials: Application to az31 alloy. International Journal of Plasticity 113, 269–290.
- Segurado et al. (2018) Segurado, J., Lebensohn, R., LLorca, J., 2018. Computational homogenization of polycrystals. Advances in Applied Mechanics 51, 1–114.
- Shenoy et al. (2007) Shenoy, M., Zhang, J., McDowell, D., 2007. Estimating fatigue sensitivity to polycrystalline Ni-base superalloy microstructures using a computational approach. Fatigue and Fracture of Engineering Materials and Structures 30, 889–904.
- Stanford and Barnett (2008) Stanford, N., Barnett, M., 2008. The origin of “rare earth” texture development in extruded mg-based alloys and its effect on tensile ductility. Materials Science and Engineering: A 496, 399 – 408.
- Tang et al. (2019) Tang, T., Zhou, G., Li, Z., Li, D., Peng, L., Peng, Y., Wu, P., Wang, H., Lee, M., 2019. A polycrystal plasticity based thermo-mechanical-dynamic recrystallization coupled modeling method and its application to light weight alloys. International Journal of Plasticity 116, 159–191.
- Wang et al. (2014) Wang, F., Dong, J., Feng, M., Sun, J., Ding, W., Jiang, Y., 2014. A study of fatigue damage development in extruded mg-gd-y magnesium alloy. Materials Science and Engineering: A 589, 209–216.
- Wang et al. (2013) Wang, F., Dong, J., Jiang, Y., Ding, W., 2013. Cyclic deformation and fatigue of extruded mg-gd-y magnesium alloy. Materials Science and Engineering: A 561, 403–410.
- Wang et al. (2019) Wang, J.Y., Li, N., Alizadeh, R., Monclús, M.A., Cui, Y.W., Molina-Aldareguía, J.M., LLorca, J., 2019. Effect of solute content and temperature on the deformation mechanisms and critical resolved shear stress in Mg-Al and Mg-Zn alloys. Acta Materialia 170, 155–165.
- Wu et al. (2008) Wu, L., Jain, A., Brown, D., Stoica, G., Agnew, S., Clausen, B., Fielden, D., Liaw, P., 2008. Twinning–detwinning behavior during the strain-controlled low-cycle fatigue testing of a wrought magnesium alloy, ZK60A. Acta Materialia 56, 688 – 695.
- Xiong et al. (2014) Xiong, Y., Yu, Q., Jiang, Y., 2014. An experimental study of cyclic plastic deformation of extruded zk60 magnesium alloy under uniaxial loading at room temperature. International Journal of Plasticity 53, 107–124.
- Yaghoobi et al. (2020) Yaghoobi, M., Allison, J., Sundararaghavan, V., 2020. Multiscale modeling of twinning and detwinning behavior of hcp polycrystals. International Journal of Plasticity 127, 102653.
- Yu et al. (2011) Yu, Q., Zhang, J., Jiang, Y., 2011. Direct observation of twinning-detwinning-retwinning on magnesium single crystal subjected to strain-controlled cyclic tension-compression in [0001] direction. Philosophical Magazine Letters 91, 757 – 765.
- Zhang et al. (2019) Zhang, H., Jérusalem, A., Salvati, E., Papadaki, C., Fong, K.S., Song, X., Korsunsky, A.M., 2019. Multi-scale mechanisms of twinning-detwinning in magnesium alloy AZ31B simulated by crystal plasticity modeling and validated via in situ synchrotron XRD and in situ SEM-EBSD. International Journal of Plasticity 119, 43 – 56.
- Zhang and Joshi (2012) Zhang, J., Joshi, S., 2012. Phenomenological crystal plasticity modeling an detailed micromechanical investigations of pure magnesium. Journal of the Mechanics and Physics of Solids 60, 945–972.
- Zheng et al. (2014) Zheng, Y.F., Gua, X.N., Witte, F., 2014. Biodegradable metals. Materials Science and Engineering R 77, 1 – 34.
- Zhu et al. (2014) Zhu, R., Cai, X., Wu, Y., Liu, L., Ji, W., Hua, B., 2014. Low-cycle fatigue behavior of extruded mg–10gd–2y–0.5zr alloys. Materials and Design 53, 992–997.