Evidence for sulfur-bearing species on Callisto’s leading hemisphere:
Sourced from Jupiter’s irregular satellites or Io?
Abstract
We investigated whether sulfur-bearing species are present on the icy Galilean moon Callisto by analyzing eight near-infrared reflectance spectra collected over a wide range of sub-observer longitudes. We measured the band areas and depths of a 4- feature in these spectra, which has been attributed to sulfur dioxide (SO2), as well as carbonates, in previously collected datasets of this moon. All eight spectra we collected display the 4- band. The four spectra collected over Callisto’s leading hemisphere display significantly stronger 4- bands compared to the four trailing hemisphere spectra (3 difference). We compared the central wavelength position and shape of Callisto’s 4- band to laboratory spectra of various sulfur-bearing species and carbonates. Our comparison demonstrates that Callisto’s 4- band has a spectral signature similar to thermally-altered sulfur, as well as a 4.025 feature attributed to disulfanide (HS2). Our analysis therefore supports the presence of S-bearing species on Callisto but is not consistent with the presence of SO2. The significantly stronger 4- band detected on Callisto’s leading hemisphere could result from collisions with H2S-rich dust grains that originate on Jupiter’s retrograde irregular satellites or implantation of magnetospheric S ions that originate from volcanic activity on Io. Alternatively, S-bearing species could be native to Callisto and are exposed by dust collisions and larger impacts that drive regolith overturn, primarily on its leading side.
1 Introduction
Sulfur is one of the key elements required for life as we know it. Measuring the abundance, distribution, and spectral signature of sulfur on ocean worlds like the icy Galilean moons Callisto, Ganymede, and Europa is therefore important for assessing their astrobiological potential (e.g., Hendrix et al., 2019). The innermost Galilean moon Io erupts substantial quantities of S-bearing neutrals into orbit, which are ionized and subsequently trapped in Jupiter’s magnetosphere (e.g., Schneider & Bagenal, 2007). These sulfur ions are delivered primarily to the trailing hemispheres of Europa and Ganymede by Jupiter’s co-rotating plasma, spurring a cascade of radiolytic surface chemistry (e.g., Johnson et al., 2004). The flux of magnetospheric S ions is lower at the orbit of Callisto but is still sufficient to drive radiolytic modification of its surface.
Analysis of spectra collected by the Near Infrared Mapping Spectrometer (NIMS) on the Galileo spacecraft has revealed the presence of an absorption band centered near 4.25 , which likely results from carbon dioxide (CO2) (e.g., Carlson et al., 1996; McCord et al., 1997, 1998). This 4.25- CO2 band is distributed across Callisto’s trailing hemisphere, producing a ‘bullseye’ shaped pattern centered around 270 longitude (i.e., the center of its trailing hemisphere) (e.g., Hibbitts et al., 2000) and is likely formed by Jupiter’s co-rotating plasma flowing onto Callisto’s trailing side. CO2 is also present on Callisto’s leading hemisphere, but displays a different distribution, with concentrated deposits of CO2 spatially associated with impact craters and their ejecta blankets (Hibbitts et al., 2000, 2002).
Other prominent absorption bands are present in NIMS spectra of Callisto, including a feature centered between 4.02 - 4.05 (hereafter referred to as the ‘4-’ band), which was originally attributed to sulfur dioxide (SO2) on Europa and Ganymede, as well as on Callisto (e.g., Carlson et al., 1996; McCord et al., 1997, 1998; Hibbitts et al., 2000). Analysis of NIMS spectra demonstrated that the 4- band is strongest on the trailing hemispheres of Europa and Ganymede, consistent with implantation of S ions from Io. In contrast, Callisto’s 4- band appears to be stronger on its leading hemisphere, hinting at a possibly different origin from the 4- band detected on Europa and Ganymede (Hibbitts et al., 2000). The 4- band has a mottled distribution across Callisto’s leading hemisphere, without clear association with impact features or other landforms, unlike CO2 (e.g., Hibbitts et al., 2000), suggesting that the 4- feature could have a different origin from CO2 on this moon.
In contrast to the sharp shape and strong absorption exhibited by the 4.07- SO2 frost combination band (1 + 3) (e.g., Nash & Betts, 1995) detected on Io (e.g., Fanale et al., 1979; Cruikshank, 1980), Callisto’s 4- band is more subtle, has a rounded shape, and is shifted to shorter wavelengths (4.02 - 4.05 ). These spectral differences have led some studies to cast doubt on the presence of S-bearing species like SO2 on Callisto, suggesting instead that C-rich species like calcium carbonate (CaCO3) or sodium carbonate (Na2CO3) might be better candidates to explain the 4- band (Johnson et al., 2004). Similarly, analysis of data collected by the Ultraviolet Spectrometer (UVS) onboard Galileo indicates that the 0.28- feature detected on Callisto’s leading side is more consistent with the spectral slope of C-rich material (Hendrix & Johnson, 2008), as opposed to an SO2 band suggested by prior work (e.g., Lane & Domingue, 1997; Noll et al., 1997).
Therefore, the origin and composition of Callisto’s 4- band, and the possible presence of sulfur on this moon, remain uncertain. Complicating matters, the often low signal-to-noise (S/N) and low resolving power (R 200) of NIMS spectra has made assessment of the spectral signature and distribution of Callisto’s 4- band more challenging. To investigate the 4- band further, we collected new near-infrared (NIR) reflectance spectra of Callisto. We detected the 4- band in these new ground-based spectra, along with other absorption bands between 2.8 - 5.0 . We used these data to characterize the spectral signature and longitudinal distribution of Callisto’s 4- band, providing new constraints on the presence and origin of S-bearing species.
2 Data and Methods
2.1 Observations and Data Reduction
We observed Callisto on eight different nights in May and June, 2020 using the NIR SpeX spectrograph/imager (e.g., Rayner et al., 2003) on NASA’s Infrared Telescope Facility (IRTF), operating in long cross-dispersed mode, spanning 1.98 - 5.3 over seven spectral orders (‘LXDlong’ mode). All LXDlong observations were made with a 0.3” wide by 1” long slit, providing an average resolving power of 2500 in each spectral order. Prior to each observation, the SpeX slit was oriented parallel to Callisto’s poles, and then placed over the center of Callisto’s disk, thereby ensuring that the sub-observer longitude was fully covered by the slit. These spectra were collected using ‘AB’ nodding, where all targets are observed in two different positions, separated by 7.5”. Each ‘A’ and ‘B’ frame had a maximum exposure length of 3 s to prevent saturation at wavelengths 4.1 . During data reduction, these ‘A’ and ‘B’ frames were separated into sequential pairs, and the ‘B’ frames were subtracted from the ‘A’ frames, thereby performing first order sky emission correction.
Flatfield frames were generated with an internal quartz lamp to correct for pixel variations across the chip. To perform wavelength calibration of these data, we collected arc lamp frames, using an internal argon lamp. Because argon emission lines are weak in L/L’ and M bands (2.8 - 5.3 ), we utilized night sky emission lines to calibrate the longer wavelength data. Data extraction, flatfielding, wavelength calibration, and spectral order merging were conducted using the Spextool data reduction suite (Cushing et al., 2004), as well as custom programs. All extracted spectra were divided by standard star spectra, observed on the same night immediately before and after observations of Callisto (within airmass), to provide additional telluric correction and remove the solar spectrum. The standard stars we observed were HD 189893 (G0V) and SA 112 1333 (F8). After dividing each spectrum by the standard star, all Callisto frames collected on the same night were co-added to boost S/N. The observation details are summarized in Table 1.
2.2 Band Parameter Analyses
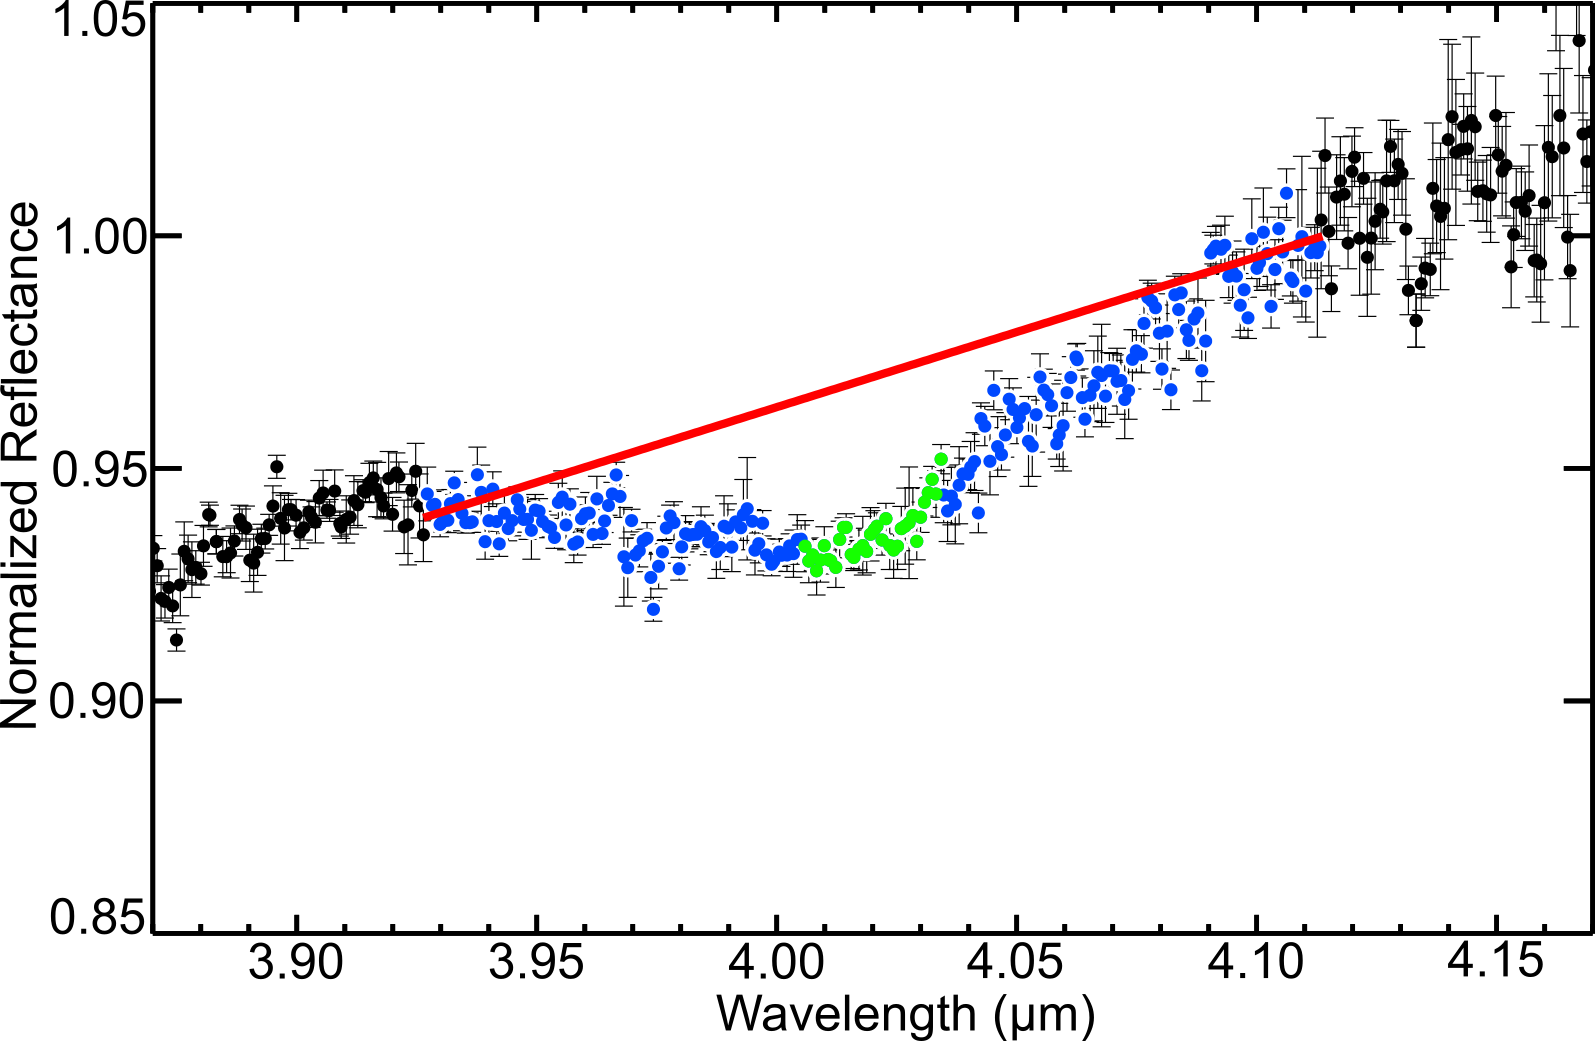
To assess the spectral signature and longitudinal distribution of the 4- band, we measured its center, area, and depth in each collected spectrum with a custom band parameter analysis program that our team has used previously to analyze reflectance data of icy moons (e.g., Cartwright et al., 2015, 2020a, 2020b). After reading in the data, the program fit the continuum of each spectrum between 3.926 and 4.114 to measure the 4- band. Next, the program divided each 4- band by its continuum, and measured the area of the resulting continuum-divided band using the trapezoidal rule. The program then used Monte Carlo simulations to estimate the uncertainties for these band area measurements by resampling the 1 errors of each spectral channel within each band (iterated 20,000 times). To measure the depth of each spectrum’s 4- band, the program identified the spectral channel closest to 4.02 as the band center, and then calculated the mean reflectance using all spectral channels within . To calculate the band depth, the program subtracted these mean reflectances from 1. To estimate measurement errors, the program added the 1 uncertainties of all spectral channels included in the mean reflectance measurement, in quadrature, and then divided by the number of channels (n) to calculate the mean uncertainty (). To estimate the point-to-point variation in each band, the program calculated the standard deviation of the mean ( = /). The program then calculated the final uncertainty for each band depth measurement by adding and in quadrature. An example of our band measurement procedure is shown in Figure A1.
|
|
|
|
|
UT Date |
|
|
|
||||||||||||||||
|---|---|---|---|---|---|---|---|---|---|---|---|---|---|---|---|---|---|---|---|---|---|---|---|---|
| 1 | 20.7 | -1.0 | 1.56 | 5.78 | 20/06/15 | 13:00 | 24 | 1.33 - 1.39 | ||||||||||||||||
| 2 | 64.0 | -1.0 | 1.56 | 5.45 | 20/06/17 | 13:00 | 25 | 1.33 - 1.46 | ||||||||||||||||
| 3 | 120.6 | -1.1 | 1.52 | 7.75 | 20/06/03 | 12:45 | 26 | 1.32 - 1.49 | ||||||||||||||||
| 4 | 164.7 | -1.1 | 1.53 | 7.44 | 20/06/05 | 13:30 | 25 | 1.31 - 1.39 | ||||||||||||||||
| 5 | 200.7 | -1.1 | 1.47 | 9.37 | 20/05/21 | 13:45 | 24 | 1.32 - 1.40 | ||||||||||||||||
| 6 | 244.0 | -1.1 | 1.47 | 9.13 | 20/05/23 | 13:45 | 25 | 1.32 - 1.39 | ||||||||||||||||
| 7 | 287.2 | -1.1 | 1.48 | 8.88 | 20/05/25 | 13:45 | 28 | 1.33 - 1.41 | ||||||||||||||||
| 8 | 337.8 | -1.0 | 1.55 | 6.11 | 20/06/13 | 13:15 | 26 | 1.33 - 1.42 |
3 Results and Analysis
3.1 IRTF/SpeX Spectra of Callisto
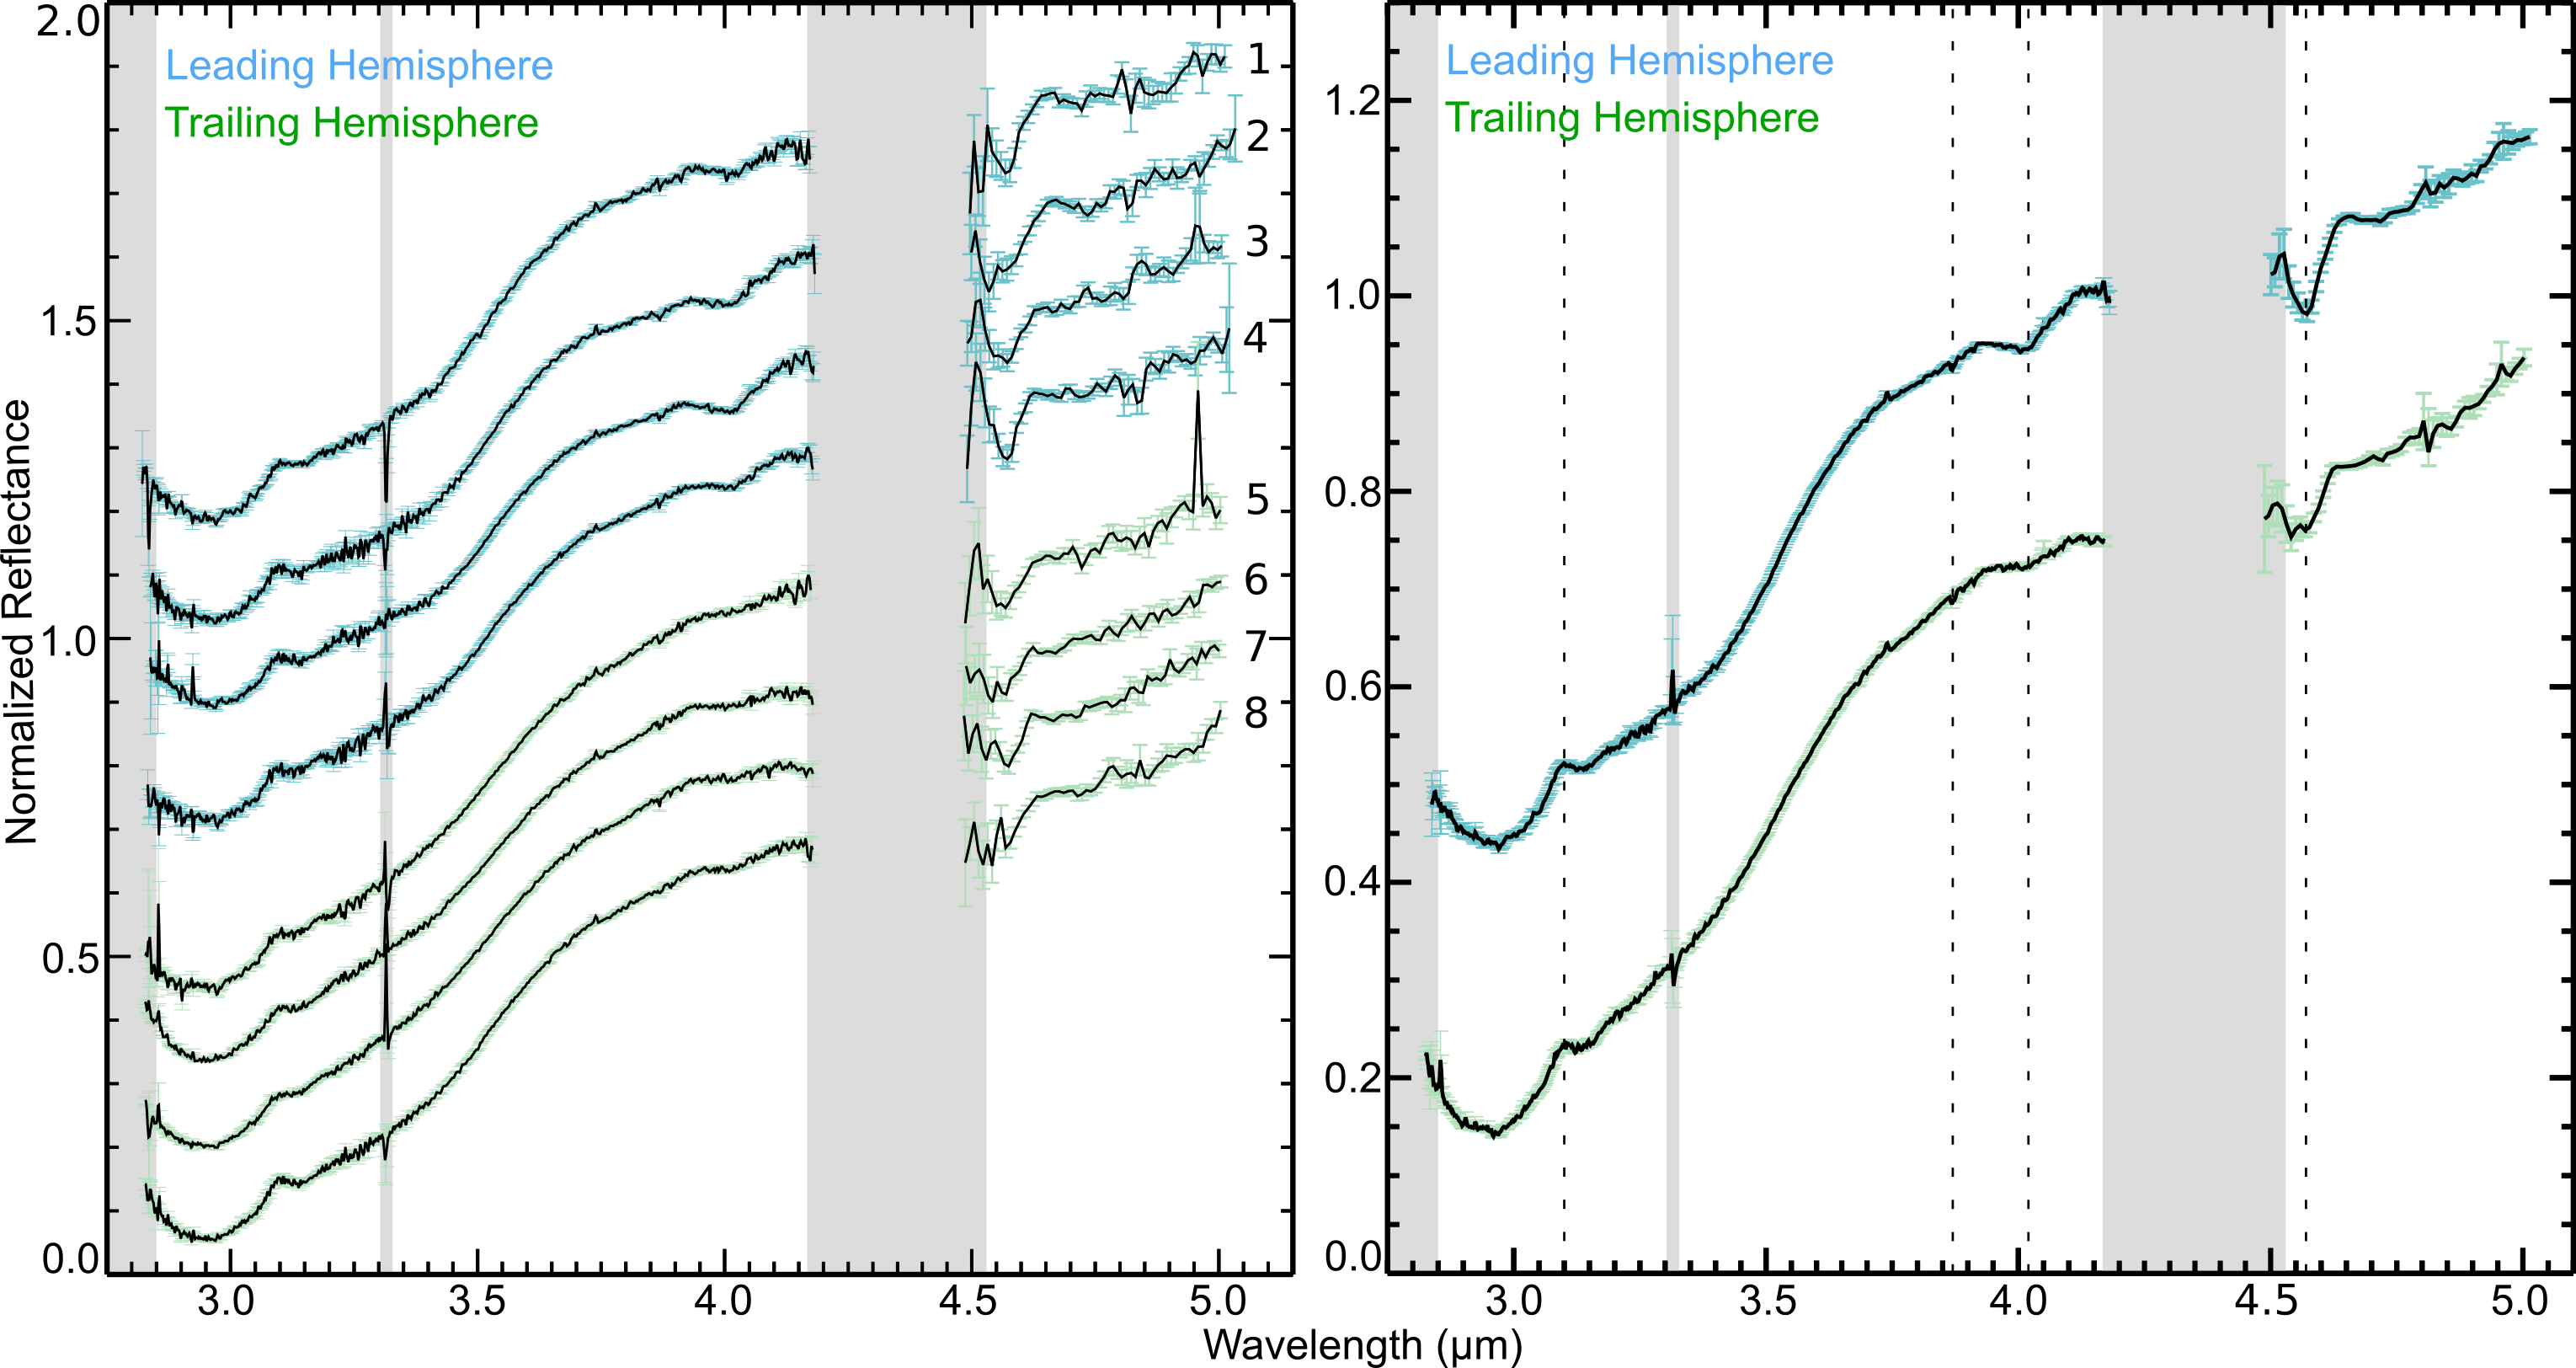
All eight of the SpeX spectra we collected display evidence for the 4- band, centered near 4.02 (Figures 1, A2). Our 4- band area and depth measurements are reported in Table 2 (along with their 1 uncertainties). These measurements confirm the presence of the 4- band in all eight spectra, demonstrating that this feature is present across Callisto’s surface. Furthermore, the four spectra collected over Callisto’s leading hemisphere (1 - 180 longitude) show significantly stronger 4- bands compared to the four spectra collected over its trailing hemisphere (181 - 360 longitude), which is consistent with previous analyses (e.g., Hibbitts et al., 2000) (Figure A3). We further investigate the spatial distribution of the 4- band in the following subsection 3.2.
The SpeX spectra we collected display other spectral features that we briefly describe here. All collected SpeX spectra display the strong 3- H2O ice band, as well as a subtle 3.1 Fresnel peak (e.g., Mastrapa et al., 2009). These H2O ice features were detected previously in ground-based (e.g., Pollack et al., 1978; Calvin & Clark, 1993) and NIMS (e.g., Carlson et al., 1996) spectra. The SpeX data display a wide band centered near 4.57 , hereafter referred to as the ‘4.6-’ band, which was originally detected by NIMS and attributed to CN-bearing species (e.g., McCord et al., 1998), or alternatively, carbon suboxide (C3O2, Johnson et al. 2004). Similar to the 4- band, the SpeX spectra we collected indicate that the 4.6- band is stronger on Callisto’s leading hemisphere. The SpeX spectra also display a band centered near 3.87 , hereafter referred to as the ‘3.9-’ band. This band was previously detected by NIMS and attributed to SH-bearing materials (e.g., McCord et al., 1998), as well as carbonic acid (H2CO3, e.g., Hage et al. 1998). The 3.9- band in our SpeX spectra does not appear to display strong leading/trailing asymmetries in its distribution, and it is notably weaker than the 3.9- band detected by NIMS. Hints of other, more subtle bands are present in these spectra as well, which we discuss in Appendix A4 (Figure A4). Although of great interest, quantitative analysis of these other absorption features is beyond the scope of this paper and will be included in future work.
|
|
|
|
|
|
|||||||||||
|---|---|---|---|---|---|---|---|---|---|---|---|---|---|---|---|---|
| 1 | 20.7 | -1.0 | Sub-Jupiter (Valhalla) | 26.0 0.7 | 0.027 0.002 | |||||||||||
| 2 | 64.0 | -1.0 | Leading (Valhalla) | 33.3 0.5 | 0.033 0.001 | |||||||||||
| 3 | 120.6 | -1.1 | Leading (Asgard) | 39.5 0.5 | 0.039 0.001 | |||||||||||
| 4 | 164.7 | -1.1 | Anti-Jupiter (Asgard) | 18.9 0.5 | 0.021 0.001 | |||||||||||
| 5 | 200.7 | -1.1 | Anti-Jupiter | 5.5 0.5 | 0.007 0.001 | |||||||||||
| 6 | 244.0 | -1.1 | Trailing | 6.0 0.4 | 0.008 0.001 | |||||||||||
| 7 | 287.2 | -1.1 | Trailing | 1.7 0.4 | 0.007 0.001 | |||||||||||
| 8 | 337.8 | -1.0 | Sub-Jupiter | 8.4 0.5 | 0.012 0.001 |
3.2 Longitudinal distribution of the 4- band
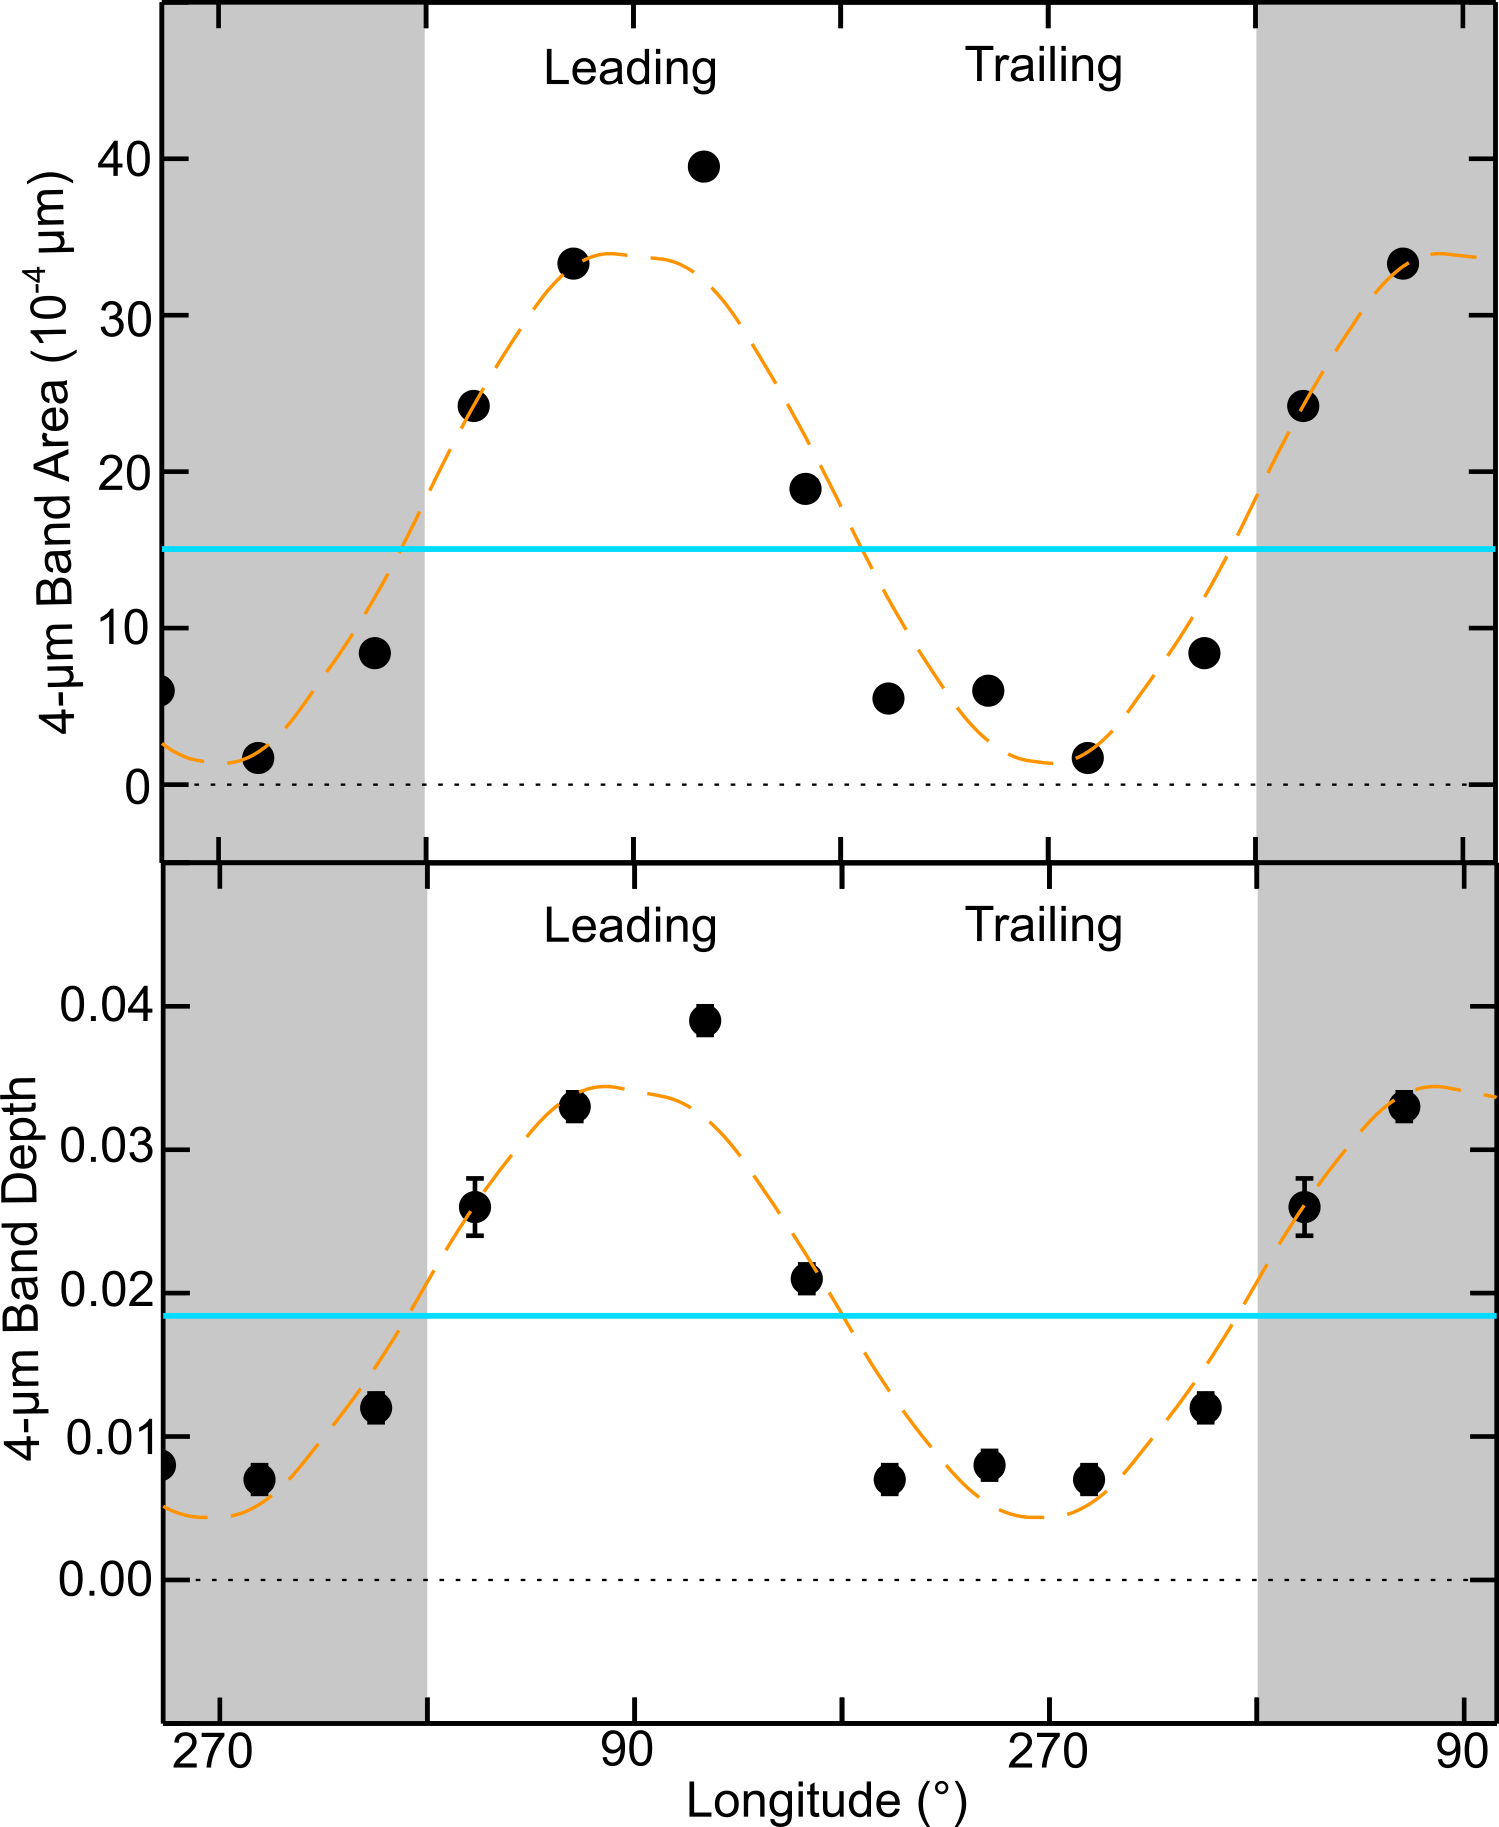
Previous work has demonstrated that Callisto displays longitudinal trends in its surface composition, with weaker H2O ice bands and more red material on its leading hemisphere (e.g., Morrison et al., 1974), and more CO2 on its trailing hemisphere (e.g., Hibbitts et al., 2000). Consequently, we searched for longitudinal trends in the distribution of the 4- band on Callisto by calculating the mean 4- band areas for Callisto’s leading and trailing hemispheres and comparing them: 29.43 4.46 -4 and 5.40 1.39 -4, respectively. We also calculated and compared the mean 4- band depths for Callisto’s leading and trailing hemispheres: 0.030 0.004 and 0.007 0.001 , respectively. Comparison of these values demonstrates that the mean 4- band is significantly stronger on Callisto’s leading hemisphere compared to its trailing hemisphere (4 difference).
To further investigate the distribution of the 4- band, we plotted the eight individual band area and depth measurements as a function of longitude (Figure 2). We fit the band area and depth measurements with a sinusoidal model, representing a surface displaying longitudinal trends in the distribution of the 4- band, and a mean model, representing a surface without leading/trailing trends in the distribution of this feature. We used an F-test (e.g., Lomax & Hahs-Vaughn, 2013) to compare these two models. Our null hypothesis was that there is no difference between these two model fits, indicating that there is no meaningful longitudinal difference in the distribution of the 4- band. Our F-test analysis demonstrates that there is a 3 difference between the mean and sinusoidal models for both the 4- band area and depth measurements (p 0.002, Table A1).
Thus, the mean 4- band areas and depths, as well as the results of our F-test analysis, demonstrates that the 4- band is significantly stronger on Callisto’s leading hemisphere. The 4- band is strongest in Spectrum 3 (mid-observation, sub-observer longitude 120.6), which is located between the center of the Callisto’s leading hemisphere (longitude 90) and the Asgard impact basin (centered near 140 longitude). Conversely, the 4- band is weakest in Spectrum 7 (mid-observation, sub-observer longitude of 287.2), which is proximal to the center of Callisto’s trailing side (longitude 270). We consider the implications of the longitudinal distribution of the 4- band in Section 4.
3.3 Comparing Callisto spectra to laboratory spectra of candidate species
To investigate the constituents contributing to the 4- band, we compared Callisto’s grand average leading and trailing hemisphere spectra to laboratory reflectance spectra of candidate species (Figure 3). We first focused on sulfur-bearing materials that have been previously suggested (summarized in Moore et al. 2004), including: SO2 mixed with H2O ice (1:1 ratio, Moore et al. 2002), SO2 adsorbed on cabosil (Nash & Betts, 1995), and thermally-altered sulfur (Fanale et al., 1979). We also compared Callisto’s 4- band to a spectral feature identified near 4.025 , formed by irradiation of substrates composed of H2O ice and hydrogen sulfide (H2S) (Salama et al., 1990; Moore et al., 2007; Jiménez-Escobar & Muñoz Caro, 2011), which has been attributed to disulfanide (HS2, Jiménez-Escobar & Muñoz Caro 2011). The 4.025 feature was extracted from a transmission (T) spectrum calculated from absorbance (a): T = 10-a, measured at a temperature of 133 K (Jiménez-Escobar & Muñoz Caro, 2011). Additionally, we compared Callisto’s 4- band to laboratory reflectance spectra of the carbonates Na2CO3 and CaCO3 (Nyquist et al., 1997), which have prominent 4- bands (Johnson et al., 2004). Previous studies have also considered carbonic acid, methanol, and other species, finding that these constituents do not provide good matches to the 4- band (e.g., Hudson & Moore, 2001; Hand et al., 2007).
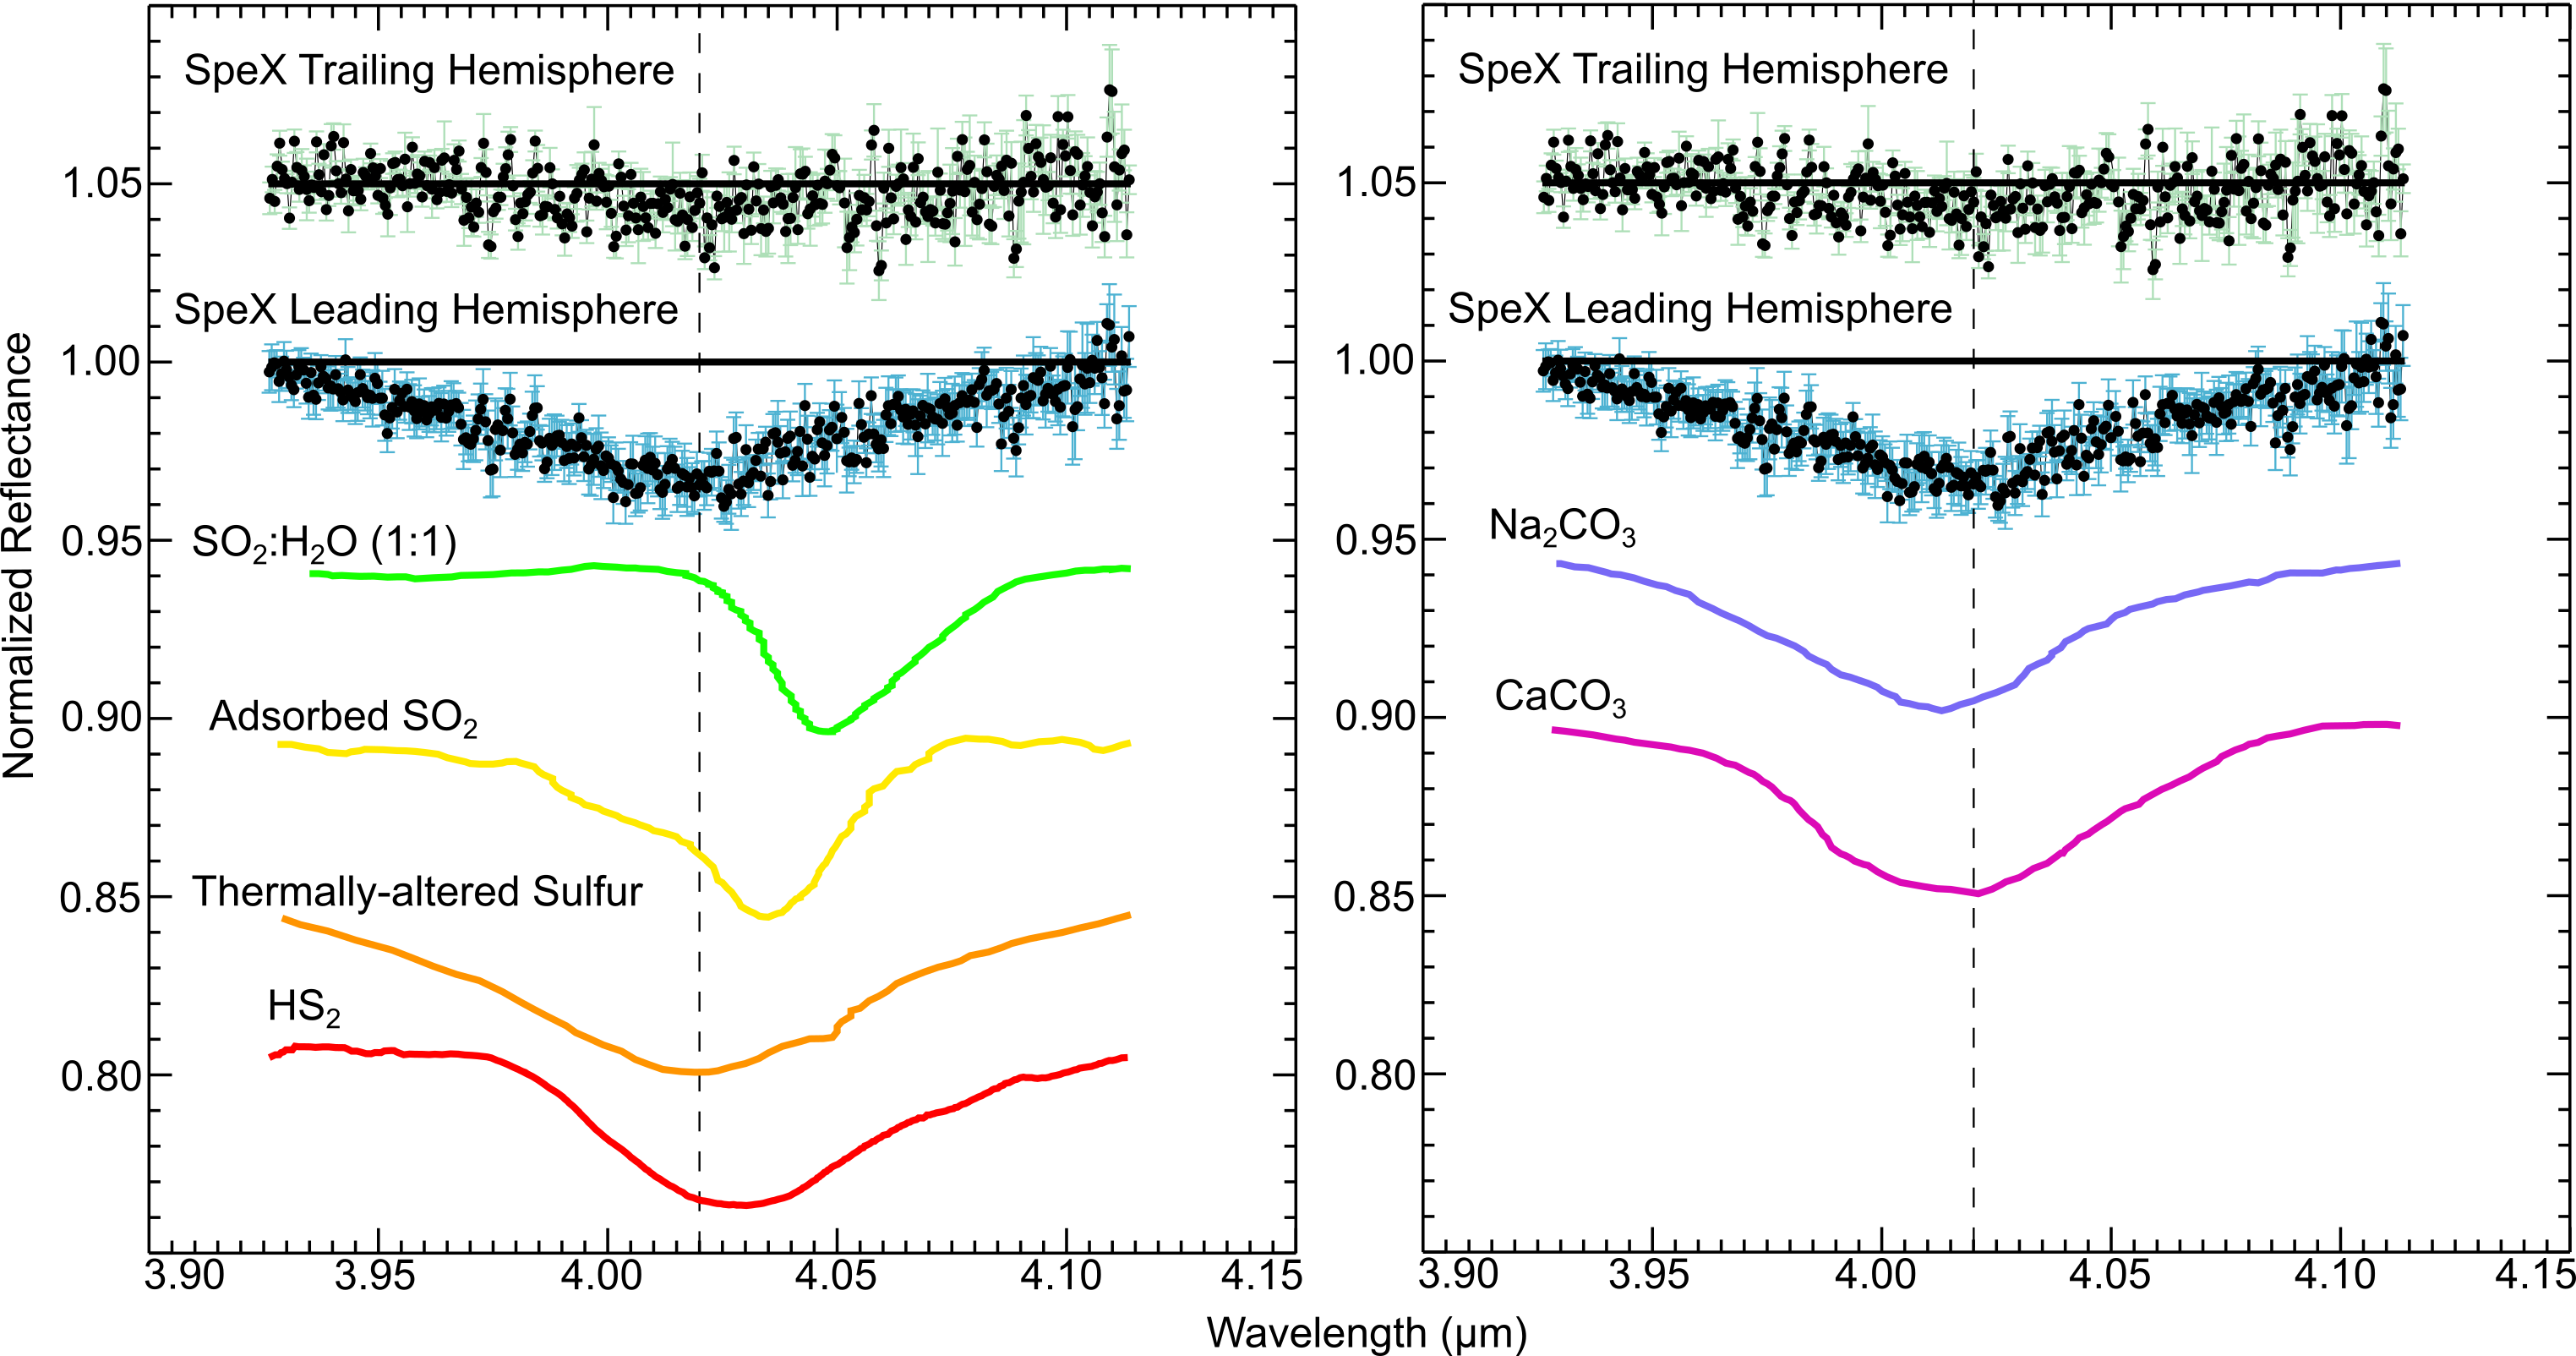
Our comparison demonstrates that SO2-bearing materials are poor matches to Callisto’s 4- band, both in terms of band center and shape (Figure 3). In contrast, thermally-altered sulfur provides a reasonable match in terms of band center and shape. The spectrum shown in Figure 3 is from a sample heated to 473 K to produce polymeric sulfur, which likely includes S2, S3, or other S allotropes (Fanale et al., 1979). Although this laboratory sample was formed at substantially higher temperatures than Callisto’s estimated peak surface temperature (165 K, Spencer 1987), S allotropes could also be formed by radiolytic modification of Callisto surface. For example, Iogenic S ions delivered to Callisto in Jupiter’s magnetosphere should react with its surface constituents, spurring a radiolytic production cycle that could generate S allotropes, similar to the sulfur cycle operating on Europa (e.g., Carlson et al., 2002).
The 4.025 feature, attributed to HS2, also provides a reasonable match to the band center and shape of Callisto’s 4- band. This 4.025 feature was formed in the laboratory by irradiating mixtures of H2O ice and H2S at cryogenic temperatures ( 90 K). After irradiation, these samples were warmed up to 224 K, and the 4.025 feature persisted over the entire temperature range, whereas the H2S frost fundamental band centered near 3.9 (1) started to decrease once the sample chamber reached temperatures 100 K (see Figure 6 in Jiménez-Escobar & Muñoz Caro 2011). Therefore, at Callisto’s peak surface temperature (165 K), H2S should sublimate, thereby weakening the 3.9- H2S fundamental band, whereas the 4.025 feature attributed to HS2 should persist, possibly explaining the weakness of the 3.9- band and stronger 4- band we detected with SpeX. Of note, UV irradiation of H2S ice should also lead to the formation of S allotropes like S2 and S3 (Jiménez-Escobar & Muñoz Caro, 2011).
Carbonates like Na2CO3 and CaCO3 also provide good matches to the 4- feature in terms of central wavelength position and band shape, as previously demonstrated (Johnson et al., 2004). However, carbonates display prominent absorption features at shorter wavelengths (between 2.2 - 2.4 and 3.3 - 3.5 ), which we do not detect in the SpeX spectra of Callisto (Figures 1 and A2) and were not detected by NIMS, reducing the likelihood that carbonates are the primary contributors to the 4- band. Nevertheless, the surface of Callisto has a vigorous carbon system, and perhaps C- and S-bearing species, along with H2O ice, participate in a shared radiolytic cycle, similar to sulfur and H2O ice on Europa (e.g., Carlson et al., 2002). Such a C-S-H2O radiolytic cycle might produce species like carbonyl sulfide (OCS) and carbon disulfide (CS2), which display absorption features at 3.4 and 4.6 , respectively (Coblentz-Society-Inc., 1964), possibly explaining the presence of these two features in NIMS and SpeX spectra of Callisto.
In summary, we find that thermally-altered sulfur provides a good match to the spectral signature of Callisto’s 4- band. The 4.025 feature attributed to HS2 can also explain the presence of the 4- band. Thus, our analysis supports the presence of S-bearing constituents on Callisto, but we do not find strong evidence for the previously suggested SO2.
4 Discussion and Conclusions
We analyzed eight SpeX spectra of Callisto, gaining new knowledge on the spectral signature and distribution of the 4- band. We identified a leading/trailing hemispherical trend in the distribution of the 4- band, with significantly stronger band measurements on Callisto’s leading side. Our analysis suggests that the spectral signature of Callisto’s 4- band is consistent with thermally-altered sulfur and a feature centered near 4.025 , which has been attributed to HS2 (Jiménez-Escobar & Muñoz Caro, 2011). Below, we consider possible origin scenarios to explain the presence of the 4- band on Callisto.
Delivery of S-bearing dust from the irregular satellites: Dust grains (10 - 1000 diameters) ejected from the giant planets’ retrograde irregular satellites should experience Poynting-Robertson drag and slowly migrate inward on decaying orbits (e.g., Burns et al., 1979). Eventually, the orbits of these dust grains overlap the orbital zone of the classical satellites, and they subsequently collide with the leading hemispheres of the outermost moons (e.g., Bottke et al., 2013; Tamayo et al., 2013). The irregular satellites of the giant planets are darker and spectrally redder than the classical moons (e.g., Graykowski & Jewitt, 2018). The accumulation of irregular satellite dust can therefore explain why the leading hemispheres of the outer classical moons Callisto (e.g., Pollack et al., 1978), Iapetus (e.g. Cruikshank et al., 1983), and Titania and Oberon (e.g., Cartwright et al., 2018) are spectrally redder and darker than their trailing hemispheres.
Similar to the irregular satellites, Jupiter’s trojan asteroid population includes a group of objects with reddish surfaces (e.g., Szabó et al., 2007; Emery et al., 2010). It has been hypothesized that this red-colored trojan asteroid group is populated by captured Kuiper Belt Objects (KBOs) that formed beyond an H2S ‘snow line’ in the primordial Kuiper Belt (Wong & Brown, 2016). Dynamical simulations indicate that giant planet migration in the early Solar System scattered large numbers of KBOs into the giant planet zone, and some of these objects were likely captured by Jupiter into its trojan asteroid and irregular satellite populations (e.g., Morbidelli & Nesvornỳ, 2020). Along with capture of H2S-rich KBOs in Jupiter’s L4 and L5 Lagrange points, perhaps H2S-bearing KBOs were captured into Jupiter’s irregular satellite population, providing a source of H2S and other S-bearing species that could be delivered to Callisto’s leading hemisphere within dust grains. Although sublimation and space weathering should remove volatile-rich deposits from the surfaces of Jovian irregular satellites, H2S and other volatiles could be retained beneath their regoliths and subsequently excavated and ejected in dust grains by impact events. Albeit, it is uncertain how long H2S could survive within dust grains before colliding with Callisto, nor whether H2S delivered to Callisto would survive long enough to be radiolytically modified into other S-bearing species. Laboratory work that explores the longevity of H2S under conditions relevant to the surface of Callisto are needed to further investigate this scenario.
Delivery of magnetospheric S ions: Volcanoes on Io erupt large volumes of S-rich material into orbit. Much of the erupted sulfur is then ionized and gets trapped in Jupiter’s magnetosphere (e.g., Schneider & Bagenal, 2007). These trapped S ions are delivered to the more distant icy Galilean moons, primarily bombarding the trailing hemispheres of Europa and Ganymede (e.g., Johnson et al., 2004). In contrast, recent numerical modeling work shows that energetic O and S ions (1 - 100 KeV) trapped in Jupiter’s magnetosphere might preferentially bombard Callisto’s leading hemisphere (Liuzzo et al., 2019). This hemispherical dichotomy results from interactions between Jupiter’s magnetosphere and Callisto’s intense ionosphere (Kliore et al., 2002), which largely blocks these lower energy O and S ions from accessing its trailing side, unlike Europa and Ganymede, which do not have substantial ionospheres. Radiolytic sulfur chemistry, induced by implanted S ions, could therefore be operating across Callisto’s leading hemisphere, explaining the stronger 4- band we detected on this hemisphere.
Exposure of native S-rich deposits: Alternatively, the species contributing to the 4- band could be native to Callisto and are exposed by dust-driven regolith overturn, which should preferentially operate on the leading hemispheres of tidally-locked moons (e.g., Bennett et al., 2013). In this scenario, native deposits of S-bearing species exposed by dust collisions could be modified by UV photolysis and charged particle radiolysis, forming new S-rich constituents, such as S2-bearing species and perhaps CS-bearing species as well. Larger impact events might also excavate S-rich deposits from greater depths in Callisto’s subsurface, albeit, analysis of NIMS data indicates that the 4- band is not spatially associated with craters on Callisto’s leading hemisphere, unlike CO2 (Hibbitts et al., 2000).
To further test these different origin hypotheses, follow up ground-based observations of the 4- band at complementary sub-observer longitudes are needed. Furthermore, new laboratory experiments that measure the spectral signature of substrates composed of H2O ice, S-bearing, and C-bearing species, performed under temperature and irradiation conditions relevant to the surface of Callisto, could provide key insight into origin and composition of the 4- band. These new experiments could also provide insight into whether a radiolytic cycle involving S, C, and H2O ice is occurring on Callisto, spurring the formation of species like OCS and CS2.
5 Acknowledgments
The observations reported here were made from the summit of Maunakea, and we thank the people of Hawaii for the opportunity to observe from this special mountain. Kevin Hand and Tom Nordheim acknowledge the support of the Jet Propulsion Laboratory, California Institute of Technology, under contract with NASA. Kevin Hand also acknowledges the support of NASA’s ‘Exploring Ocean Worlds’ Research Coordinated Network, managed by the Woods Hole Oceanographic Institution.
References
- Bennett et al. (2013) Bennett, C. J., Pirim, C., & Orlando, T. M. 2013, Chemical reviews, 113, 9086
- Bottke et al. (2013) Bottke, W. F., Vokrouhlickỳ, D., Nesvornỳ, D., & Moore, J. M. 2013, Icarus, 223, 775
- Burns et al. (1979) Burns, J. A., Lamy, P. L., & Soter, S. 1979, Icarus, 40, 1
- Calvin & Clark (1993) Calvin, W. M., & Clark, R. N. 1993, Icarus, 104, 69
- Carlson et al. (2002) Carlson, R., Anderson, M., Johnson, R., Schulman, M., & Yavrouian, A. 2002, Icarus, 157, 456
- Carlson et al. (1996) Carlson, R., Smythe, W., Baines, K., et al. 1996, Science, 274, 385
- Cartwright et al. (2020a) Cartwright, R. J., Emery, J. P., Grundy, W. M., et al. 2020a, Icarus, 338, 113513
- Cartwright et al. (2018) Cartwright, R. J., Emery, J. P., Pinilla-Alonso, N., et al. 2018, Icarus, 314, 210
- Cartwright et al. (2015) Cartwright, R. J., Emery, J. P., Rivkin, A. S., Trilling, D. E., & Pinilla-Alonso, N. 2015, Icarus, 257, 428
- Cartwright et al. (2020b) Cartwright, R. J., Beddingfield, C. B., Nordheim, T. A., et al. 2020b, The Astrophysical Journal Letters, 898, L22
- Coblentz-Society-Inc. (1964) Coblentz-Society-Inc. 1964, NIST Chemistry WebBook, NIST Standard Reference Database, SRD 69
- Cruikshank et al. (1983) Cruikshank, D., Bell, J., Gaffey, M., et al. 1983, Icarus, 53, 90
- Cruikshank (1980) Cruikshank, D. P. 1980, Icarus, 41, 240
- Cushing et al. (2004) Cushing, M. C., Vacca, W. D., & Rayner, J. T. 2004, Publications of the Astronomical Society of the Pacific, 116, 362
- Emery et al. (2010) Emery, J. P., Burr, D. M., & Cruikshank, D. P. 2010, The Astronomical Journal, 141, 25
- Fanale et al. (1979) Fanale, F. P., Brown, R. H., Cruikshank, D. P., & Clake, R. N. 1979, Nature, 280, 761
- Graykowski & Jewitt (2018) Graykowski, A., & Jewitt, D. 2018, The Astronomical Journal, 155, 184
- Hage et al. (1998) Hage, W., Liedl, K. R., Hallbrucker, A., & Mayer, E. 1998, Science, 279, 1332
- Hand et al. (2007) Hand, K. P., Carlson, R. W., & Chyba, C. F. 2007, Astrobiology, 7, 1006
- Hendrix & Johnson (2008) Hendrix, A. R., & Johnson, R. E. 2008, The Astrophysical Journal, 687, 706
- Hendrix et al. (2019) Hendrix, A. R., Hurford, T. A., Barge, L. M., et al. 2019, Astrobiology, 19, 1
- Hibbitts et al. (2002) Hibbitts, C., Klemaszewski, J., McCord, T., Hansen, G., & Greeley, R. 2002, Journal of Geophysical Research: Planets, 107, 14
- Hibbitts et al. (2000) Hibbitts, C., McCord, T., & Hansen, G. 2000, Journal of Geophysical Research: Planets, 105, 22541
- Hudson & Moore (2001) Hudson, R., & Moore, M. 2001, Journal of Geophysical Research: Planets, 106, 33275
- Jiménez-Escobar & Muñoz Caro (2011) Jiménez-Escobar, A., & Muñoz Caro, G. 2011, Astronomy & Astrophysics, 536, A91
- Johnson et al. (2004) Johnson, R., Carlson, R., Cooper, J., et al. 2004, Jupiter: The Planet, Satellites and Magnetosphere, 485
- Kliore et al. (2002) Kliore, A., Anabtawi, A., Herrera, R., et al. 2002, Journal of Geophysical Research: Space Physics, 107, SIA
- Lane & Domingue (1997) Lane, A. L., & Domingue, D. L. 1997, Geophysical research letters, 24, 1143
- Liuzzo et al. (2019) Liuzzo, L., Simon, S., & Regoli, L. 2019, Planetary and Space Science, 166, 23
- Lomax & Hahs-Vaughn (2013) Lomax, R. G., & Hahs-Vaughn, D. L. 2013, An introduction to statistical concepts (Routledge)
- Mastrapa et al. (2009) Mastrapa, R., Sandford, S., Roush, T., Cruikshank, D., & Dalle Ore, C. 2009, The Astrophysical Journal, 701, 1347
- McCord et al. (1997) McCord, T. a., Carlson, R., Smythe, W., et al. 1997, Science, 278, 271
- McCord et al. (1998) McCord, T. a., Hansen, G., Clark, R., et al. 1998, Journal of Geophysical Research: Planets, 103, 8603
- Moore et al. (2004) Moore, J. M., Chapman, C. R., Bierhaus, E. B., et al. 2004, jpsm, 1, 397
- Moore et al. (2002) Moore, M., Hudson, R., & Carlson, R. 2002, in DPS, Vol. 34, 35–02
- Moore et al. (2007) Moore, M., Hudson, R., & Carlson, R. 2007, Icarus, 189, 409
- Morbidelli & Nesvornỳ (2020) Morbidelli, A., & Nesvornỳ, D. 2020, in The Trans-Neptunian Solar System (Elsevier), 25–59
- Morrison et al. (1974) Morrison, D., Morrison, N. D., & Lazarewicz, A. R. 1974, Icarus, 23, 399
- Nash & Betts (1995) Nash, D. B., & Betts, B. H. 1995, Icarus, 117, 402
- Noll et al. (1997) Noll, K. S., Johnson, R. E., McGrath, M. A., & Caldwell, J. J. 1997, Geophysical research letters, 24, 1139
- Nyquist et al. (1997) Nyquist, R. A., Leugers, M. A., & Putzig, C. L. 1997, The handbook of infrared and raman spectra of inorganic compounds and organic salts:(a 4-volume set), Acad. Press
- Pollack et al. (1978) Pollack, J. B., Witteborn, F. C., Erickson, E. F., et al. 1978, Icarus, 36, 271
- Rayner et al. (2003) Rayner, J., Toomey, D., Onaka, P., et al. 2003, Publications of the Astronomical Society of the Pacific, 115, 362
- Salama et al. (1990) Salama, F., Allamandola, L., Witteborn, F., et al. 1990, Icarus, 83, 66
- Schneider & Bagenal (2007) Schneider, N. M., & Bagenal, F. 2007, in Io After Galileo (Springer), 265–286
- Spencer (1987) Spencer, J. R. 1987, Retrieved from: https://repository.arizona.edu/handle/10150/184098
- Szabó et al. (2007) Szabó, G. M., Ivezić, Ž., Jurić, M., & Lupton, R. 2007, Monthly Notices of the Royal Astronomical Society, 377, 1393
- Tamayo et al. (2013) Tamayo, D., Burns, J. A., & Hamilton, D. P. 2013, Icarus, 226, 655
- Trumbo et al. (2017) Trumbo, S. K., Brown, M. E., Fischer, P. D., & Hand, K. P. 2017, The Astronomical Journal, 153, 250
- Wong & Brown (2016) Wong, I., & Brown, M. E. 2016, The Astronomical Journal, 152, 90
Appendix
A1 Methods: Band parameter measurements
In this appendix, we show an example of our band parameter measurement technique (Figure A1).
A2 Results: IRTF/SpeX spectra
In this appendix, we present eight near-infrared reflectance spectra of the Galilean moon Callisto at their native spectral resolution (Figure A2).

A3 Results: Comparison of 4- bands in SpeX and NIMS spectra
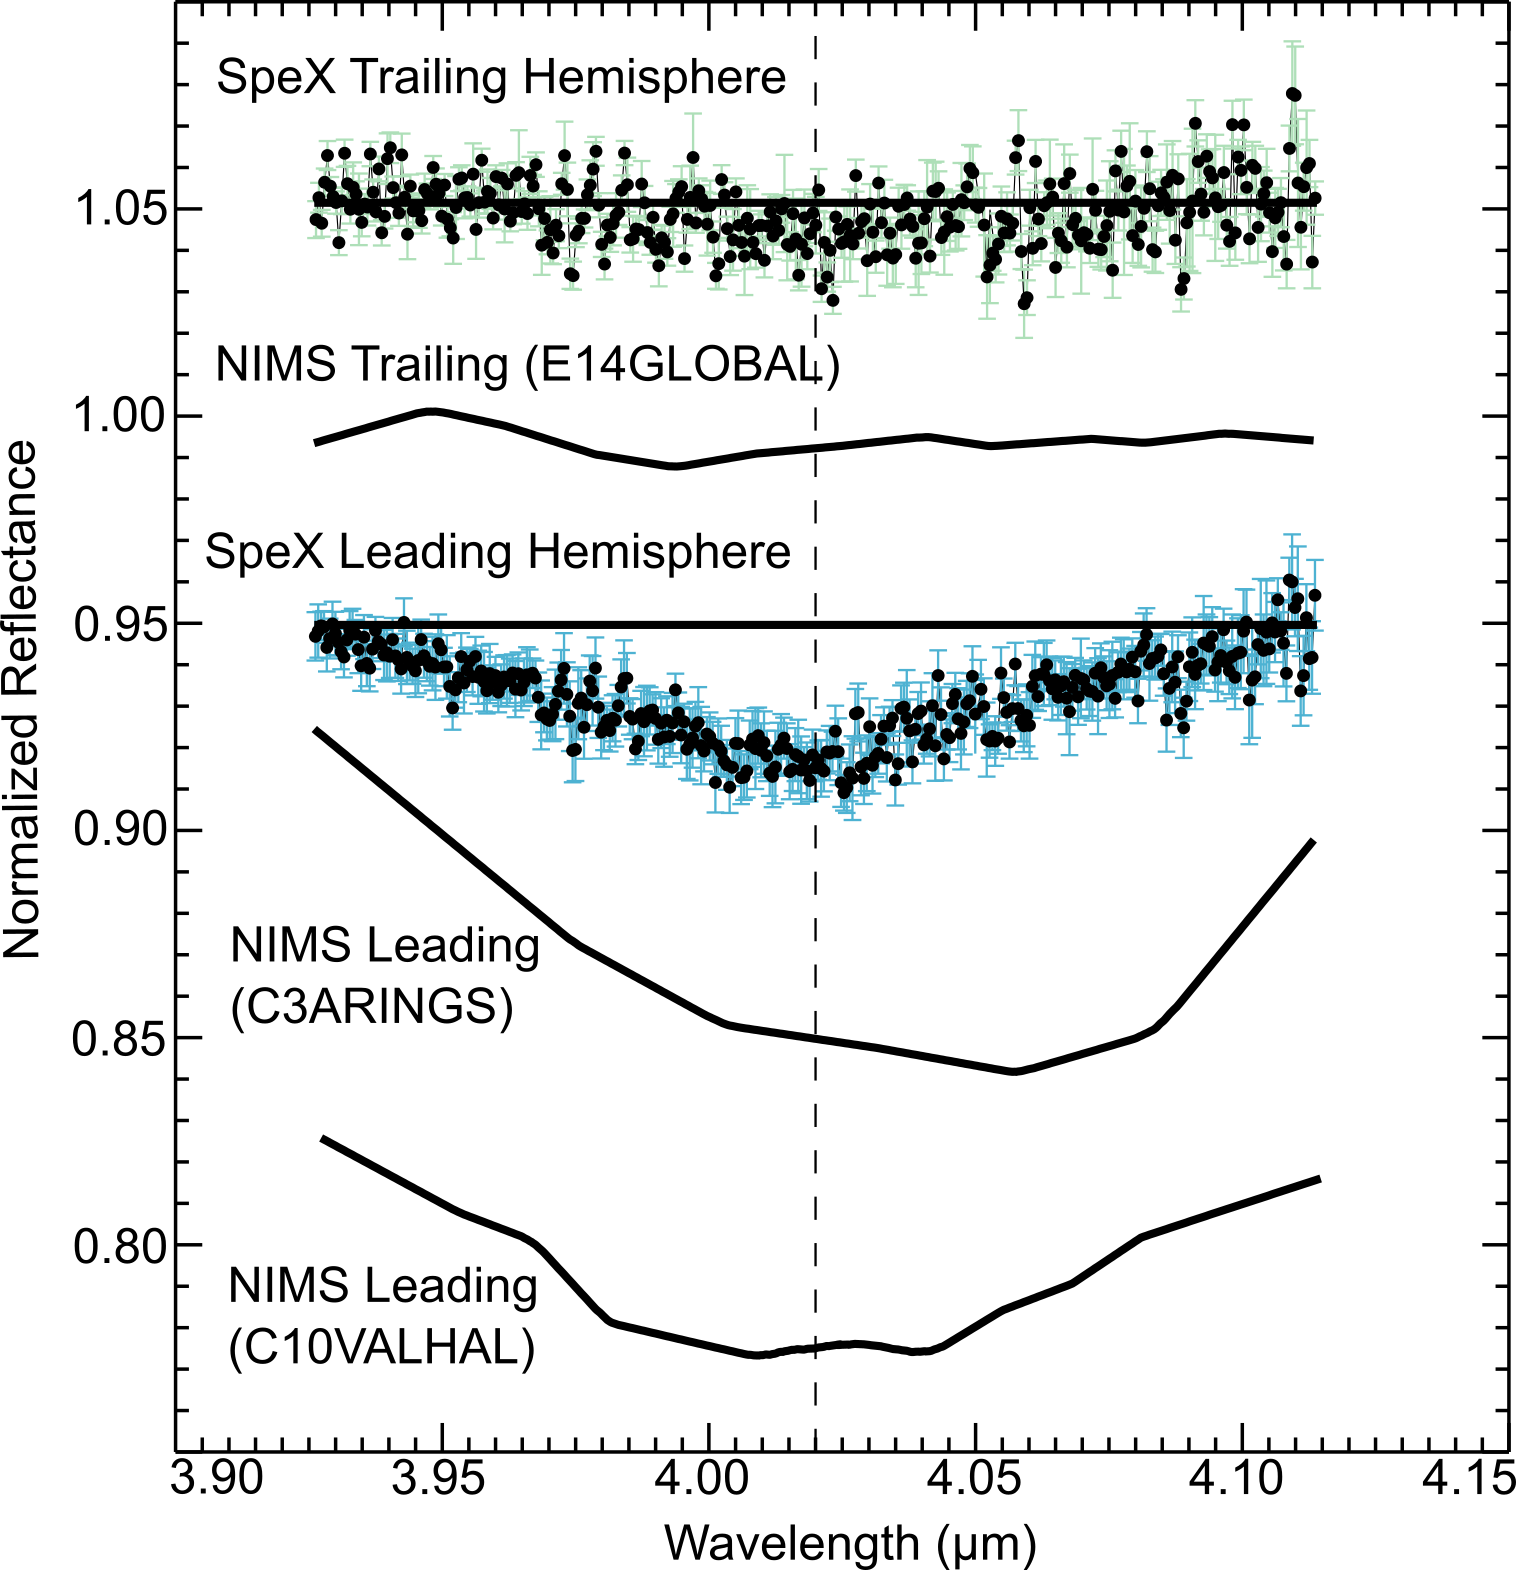
In this appendix, we compare continuum-divided 4- bands detected in the grand average leading and trailing hemisphere SpeX spectra to average spectra extracted from three different NIMS observations of Callisto (Figure A3).
A4 Results: Subtle absorption bands in the grand average IRTF/SpeX spectra
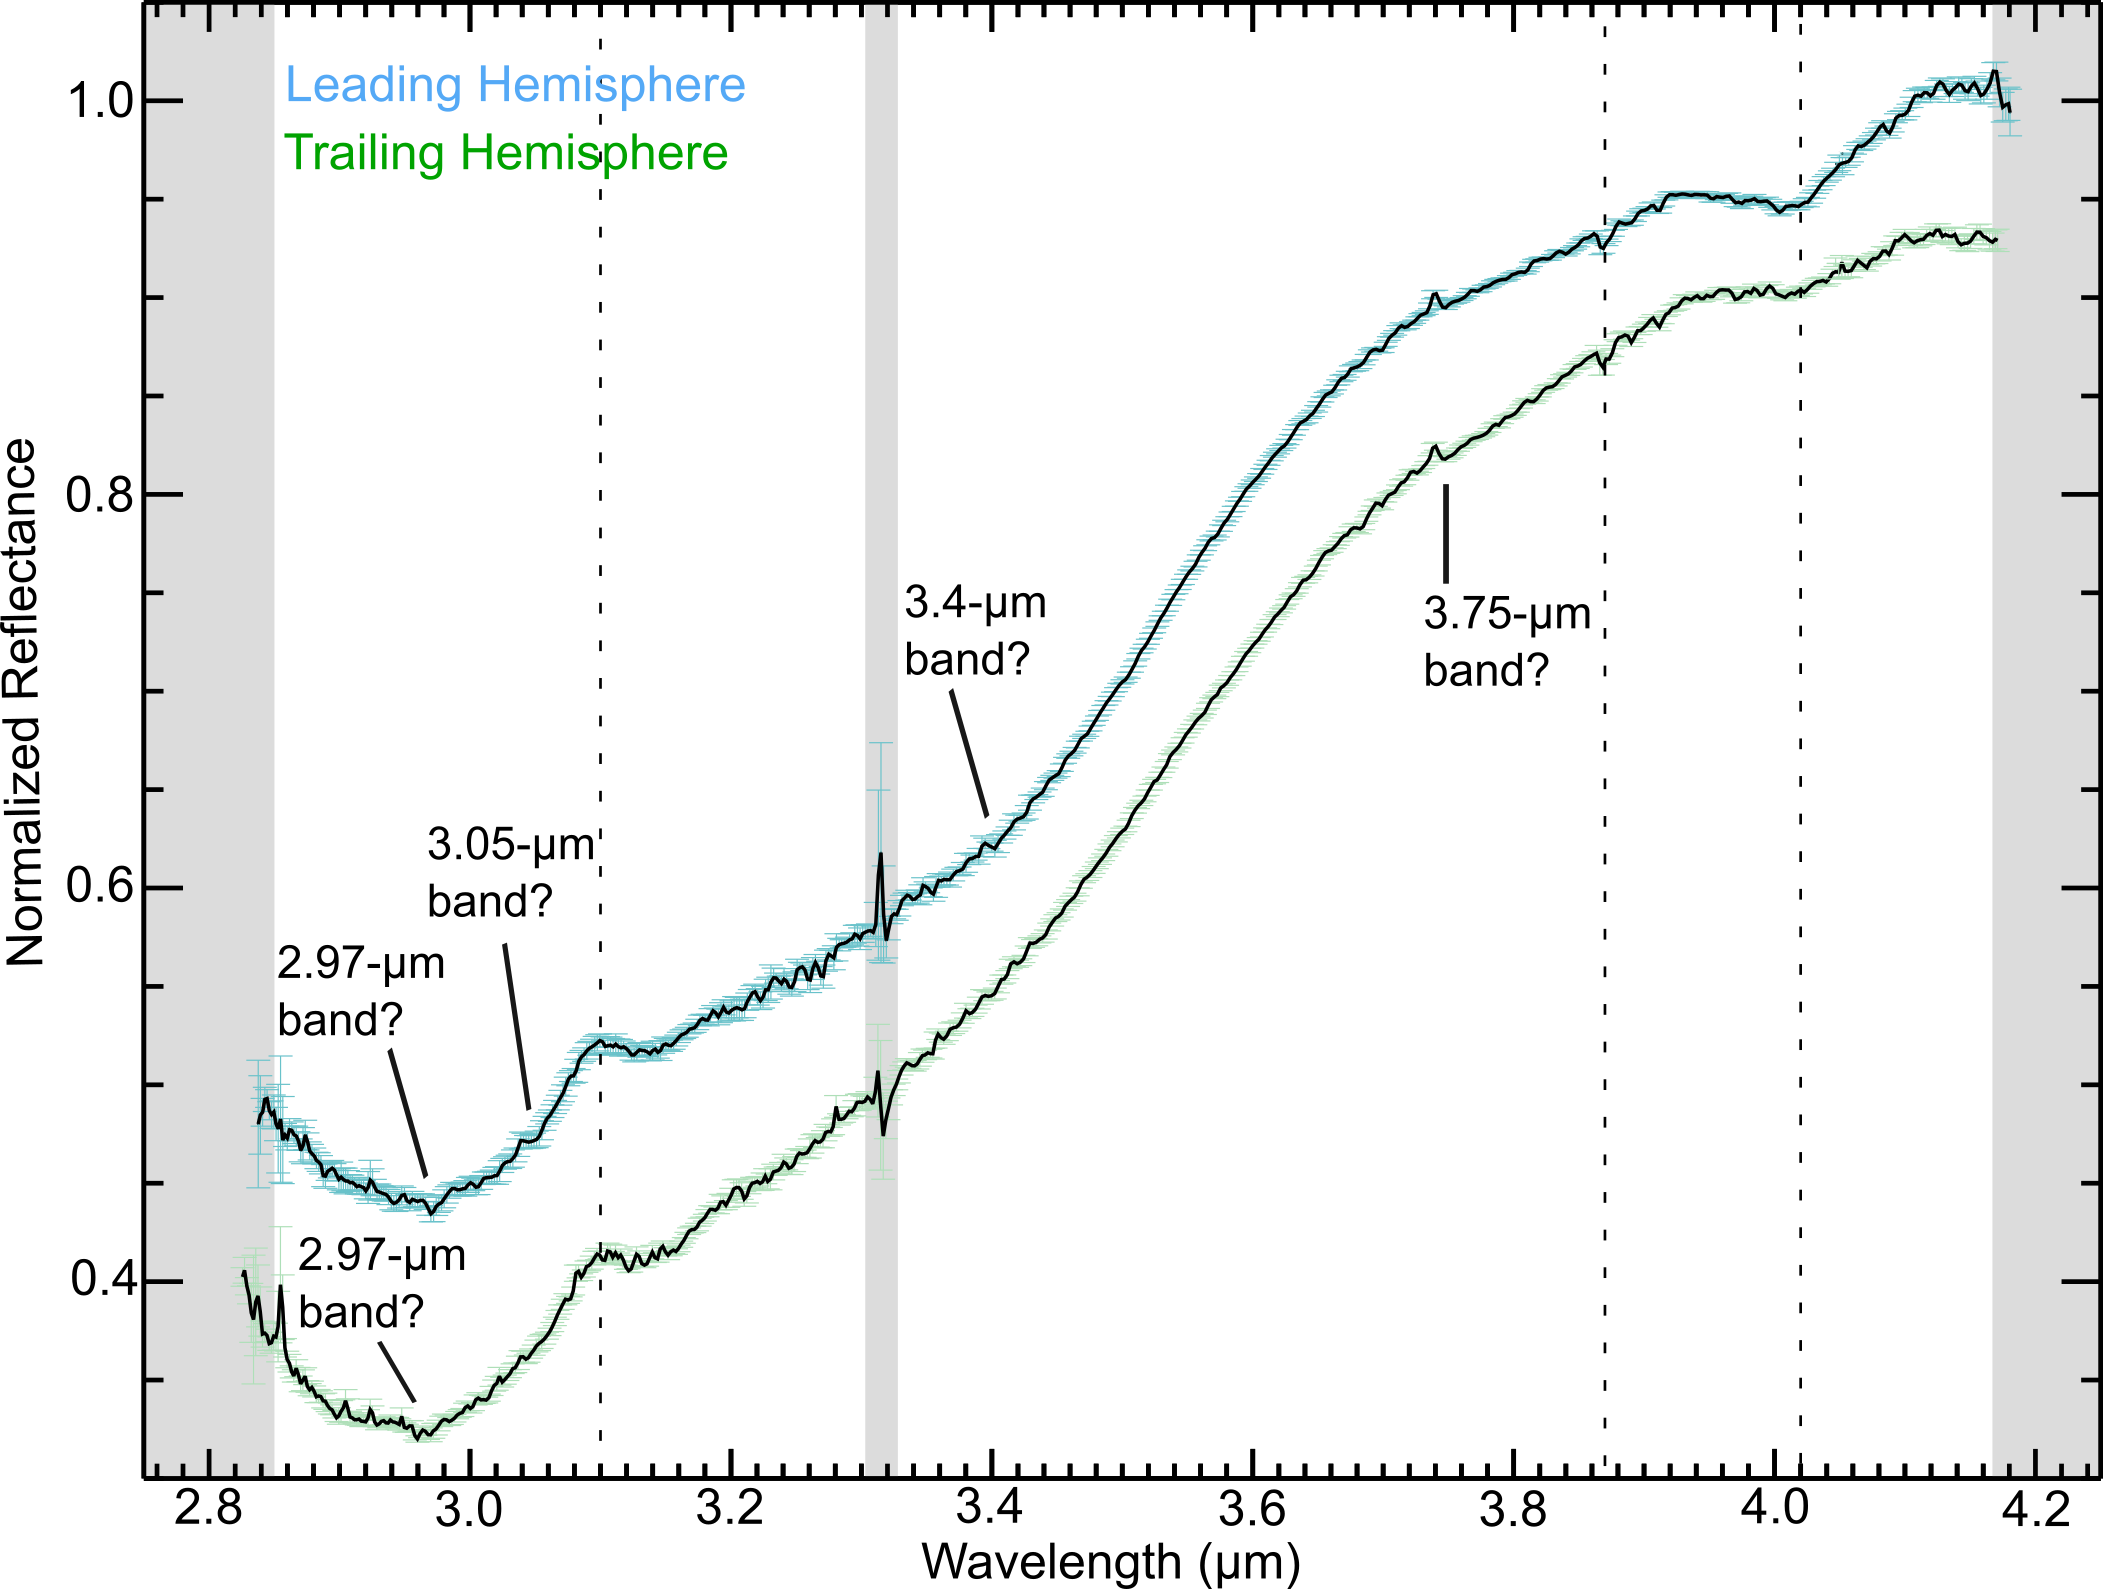
In this appendix, we present grand average Callisto spectra, zoomed in to the 2.85 - 4.15 wavelength region, to highlight some of the subtle absorption features hinted at in these data (Figure A4). The grand average spectra display subtle bands centered near 2.97 , which appears to be stronger in the mean leading hemisphere spectrum. This band was previously detected by NIMS, and attributed to trapped OH (e.g., Moore et al., 2004). Alternatively, the N-H asymmetric stretch fundamental band (3) is centered near 2.97 and could explain the presence of this feature as well. The leading hemisphere spectrum also displays a subtle band at 3.05 , which was originally detected by prior ground-based observations and attributed to the presence of ammonium-bearing clays (e.g., Calvin & Clark, 1993). We also note a weak band at 3.4 on Callisto’s leading hemisphere, which was detected previously by ground-based observers and attributed to the presence of small H2O ice grains (e.g., Calvin & Clark, 1993), as well as by NIMS, attributed to the presence of organics (e.g., McCord et al., 1998). This subtle 3.4 feature could also result from carbonyl sulfide (OCS, Coblentz-Society-Inc. 1964). The detection of these possible N-bearing features at 2.97 and 3.05 , and a possible C- and S-bearing band at 3.4 , primarily on Callisto’s leading hemisphere, is consistent with the stronger 4.6- band on Callisto’s leading side (Figure 1). The 4.6- band has been attributed to CN-bearing species by some studies (e.g., McCord et al., 1998), and we suggest that it could also stem from carbon disulfide (CS2, Coblentz-Society-Inc. 1964). Similar to our preferred hypotheses for the origin of the 4- band, perhaps the features centered near 2.97, 3.05, 3.4, and 4.6 result from constituents delivered in dust grains from the retrograde irregular satellites. Alternatively, perhaps the features near 3.4 and 4.6 result from radiolytic products that are formed by magnetospheric charged particles bombarding Callisto’s surface.
We also note the presence of a subtle band centered near 3.75 , which is slightly stronger on Callisto’s trailing side. This band has not been previously noted on Callisto in either ground-based or NIMS spectra. Although a 3.78- band has been detected on Europa (Trumbo et al., 2017), the 3.75- band we have detected on Callisto is much narrower and weaker, and it is uncertain whether these two bands might share a common origin.
A5 Results: 4- band parameter measurements
In this appendix, we report the results of our F-test analysis (Table A1).
|
|
|
|
|
|
|
|
||||||||||||||||
| 4- | Area | 29.08 | 8 | 7 | 5 | 0.0001 | Yes | ||||||||||||||||
| Depth | 24.21 | 8 | 7 | 5 | 0.0014 | Yes |