Neon Cluster Formation and Phase Separation During White Dwarf Cooling
Abstract
Recent observations of Galactic white dwarfs (WDs) with Gaia suggest there is a population of massive crystallizing WDs exhibiting anomalous cooling – the Q branch. While single-particle 22Ne sedimentation has long been considered a possible heat source, recent work suggests that 22Ne must separate into clusters, enhancing diffusion, in order for sedimentation to provide heating on the observed timescale. We show definitively that 22Ne cannot separate to form clusters in C/O WDs using molecular dynamics simulations, and we further present a general C/O/Ne phase diagram showing that strong 22Ne enrichment is not achievable for 22Ne abundance . We conclude that the anomalous heating cannot be due to 22Ne cluster sedimentation and that Q branch WDs may have an unusual composition, possibly rich with heavier elements.
1 Introduction
The Gaia space observatory has determined parallax distances to large numbers of Galactic stars (Babusiaux et al., 2018), which allow for unprecedented tests of white dwarf (WD) models and evolution. Massive WDs have high central densities and strong gravities. Furthermore, some of them may have formed via mergers (Hollands et al., 2020) and they may have interesting compositions. Recently, Cheng et al. (2019) found that the population of massive WD known as the ‘Q branch’ appear to have an additional heat source that maintains a luminosity of order for Gyrs. Latent heat from crystallization (Tremblay et al., 2019; Winget et al., 2009; Horowitz et al., 2010) and gravitational energy released from conventional 22Ne sedimentation (Bildsten & Hall, 2001a; Deloye & Bildsten, 2002; García-Berro et al., 2008; Hughto et al., 2010b) do not appear to be large enough to explain this luminosity (Camisassa et al., 2020; Cheng et al., 2019). Heating from conventional electron capture and pycnonuclear (or density driven) fusion (Salpeter & van Horn, 1969; Yakovlev et al., 2006; Horowitz et al., 2008) reactions appear to need even higher densities and may depend too strongly on the density and or temperature (Horowitz, 2020). There are many works discussing dark matter interactions in WD, see for example (Bertone & Fairbairn, 2008; Graham et al., 2018; Hurst et al., 2015; Graham et al., 2015; Bramante, 2015; Acevedo & Bramante, 2019). However, WD may be too small to capture enough dark matter for its annihilation to produce the necessary heat (Horowitz, 2020).
The gravitational potential of a WD is large. Therefore, there is possibly enough energy available from sedimentation of neutron rich 22Ne to provide the necessary heating (Bildsten & Hall, 2001b). However the expected diffusion constant for 22Ne in a C/O mixture (Hughto et al., 2010a) is too small to allow enough sedimentation before the C/O mixture freezes. In addition, 22Ne sedimentation is significantly slowed down by C/O crystallization. Therefore, even though sedimentation is a large enough energy source, in practice, sedimentation is likely slow and most of this energy may remain untapped by the time the star freezes (Deloye & Bildsten, 2002; García-Berro et al., 2008; Hughto et al., 2012, 2011).
It is possible that the 22Ne sedimentation rate is enhanced because of the formation of mesoscopic 22Ne clusters. Recently, Blouin et al. (2020) speculate that Ne phase separation produces mesoscopic clusters that could enhance the heating from conventional Ne sedimentation. Numerical calculations by Bauer et al. (2020) consider this possibility in more detail, showing that clustering of nuclei enhances the downward drift rate proportional to . This suggest that the appropriate diffusion timescale is achievable with long lived clusters of only few hundred to a few thousand 22Ne ions, and is validated with MESA models.
In this letter we directly address this possibility with molecular dynamics (MD) simulations of Ne microcrystals in C/O mixtures and new calculations of the C/O/Ne phase diagram. We find that our Ne microcrystals are unstable in C/O liquid mixtures. Therefore enhanced heating from cluster formation or phase separation is unlikely to be important in conventional C/O/Ne mixtures.
2 Molecular Dynamics Simulations
IUMD is a CUDA-Fortran classical molecular dynamics code and has been extensively used to model astromaterials in WDs and neutron stars (Caplan & Horowitz, 2017). In our model nuclei are fully ionized and treated as point particles of charge which interact via a screened two-body potential
| (1) |
with periodic separation and screening length using . The screening assumes relativistic electrons, which is not the case in WDs. At g/cm3, MeV so we slightly overestimate ; the true is 21% smaller. At g/cm3, the true is 7% smaller. This is expected to have little impact on our MD (see Hughto et al. 2011; Hamaguchi et al. 1997). We use for our mixture (consistent with Hughto et al. 2010a) which forms a bcc lattice at low temperature (Vaulina et al., 2002).
The mixture we consider has number abundances and is well motivated astrophysically. The and reactions set , with order 10% variation due to reaction rates and WD mass (Lauffer et al., 2018). During helium burning the remaining CNO elements are thought to burn via ; assuming solar metallicity, in the WD (Bildsten & Hall, 2001c).
The crystallization of a one-component plasma (OCP) depends on the dimensionless parameter with ion charge , electron separation , and thermal energy . The OCP is solid (liquid) above (below) (Potekhin & Chabrier, 2000). Screening may raise to about 178 (Vaulina et al., 2002). Averaging over mixture components for the multi-component plasma (MCP) gives ; crystallization is more complicated and sensitive to the exact mixture. A binary C/O mixture has , while C/O/Ne mixtures with have been found with MD to have (Hughto et al., 2011). If Ne clusters are unstable then we expect that the we find will be closer to 300 than 230, as the region of the phase diagram probed will be that of high Ne concentration at the C/O liquid-Ne cluster surface.
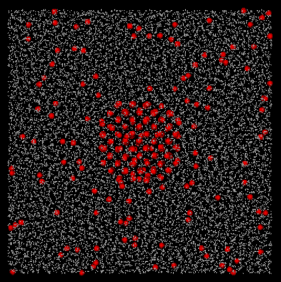
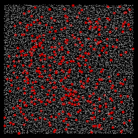
Our MD mixture contains 8000 12C, 8000 12O, and 384 22Ne ions (, for GPU threading). Our initial configuration is shown in Fig. 1 and consists of a neon microcrystal embedded in a C/O liquid in a cubic volume with periodic boundaries. The neon crystal is prepared by trimming ions from the edges and corners of a cubic bcc crystal to produce a truncated cuboctahedron containing 253 ions, on its longest diameter. The C/O fluid and the remaining 22Ne have random initial positions around the microcrystal; if the microcrystal is stable we expect it to grow by adsorption of the remaining 131 22Ne.
We run isothermal simulations to resolve and study the stability of the neon cluster at a range of temperatures. Constant temperature is approximately achieved by rescaling the velocities to a Maxwell-Boltzmann distribution with the desired temperature every 100 timesteps. Our simulations therefore do not conserve energy; instead, in the long time limit our simulations trend toward equilibrium so allows us to resolve melting or freezing (e.g. heats of fusion). Our simulations differ from past work (e.g. Hughto et al. 2011) and our asymptotic states may not be true equilibrium (i.e. they may be superheated/cooled) because we only run as long as needed to verify stability or instability of the neon cluster.
| Outcome | ||||
|---|---|---|---|---|
| 296 | (222,359,520) | C/O Crystallization around Ne | ||
| 291 | (219,353,513) | C/O Crystallization around Ne | ||
| 289 | (217,351,509) | C/O Crystallization around Ne | ||
| 287 | (215,348,505) | Ne cluster dissolves into C/O | ||
| 285 | (214,346,501) | Ne cluster dissolves into C/O | ||
| 244 | (183,296,429) | Ne cluster dissolves into C/O |
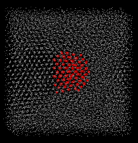
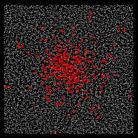
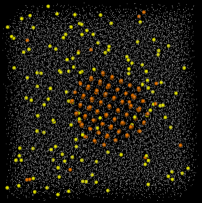
In Tab. 1 we list isothermal simulations run using the initial configuration shown in Fig. 1. These simulations were run for between and MD timesteps with with ion plasma frequency . We clearly resolve a first order transition between . At the C/O liquid is supercooled and quickly begins crystallizing, first nucleating around the Ne cluster (Fig. 2 top left) before growing to fill the volume (top right). At we find that the Ne microcrystal dissolves into the liquid (bottom left) and in the long time limit is fully mixed in the volume (bottom right). At the microcrystal immediately melts to a liquid and mixes, while at higher the cluster seems to sublimate as the core remains solid while ions slowly desorb into the liquid. When the configuration with solid C/O is evolved for longer times we also resolve slow diffusion on the lattice which seems to disperse the Ne enriched core. We have thus shown that our initial condition is unstable, suggesting that 22Ne microcrystals are not expected in C/O WDs.
Our is high compared to past work for C/O/Ne mixtures, which find (see Tab. 1 in Hughto et al. 2012). Our system may be finding the melting point of a very Ne rich system. Furthermore, the simulation does not have enough time for diffusion to bring the composition of the solid phase into equilibrium with the composition of the liquid phase. Both finite size and finite time effects may be important in comparing to an equilibrium phase diagram (computed below).
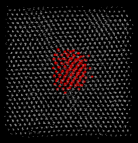
We now consider what impurities might form stable microcrystals. Generally speaking, stronger separation is observed in mixtures with greater contrast in charge . While 23Na or an isotope of Mg may be present in comparable abundances to 22Ne they may not have large enough to strongly separate. Simulations with Mg in place of the Ne at also show a slow sublimation of the cluster into the liquid, though on slightly longer timescales than the Ne. In simulations with Fe run at 240, 262, and 289 the microcrystal persists after a few times timesteps. A configuration evolved for timesteps at is shown in Fig. 3. In all three simulations the microcrystal shows exchange with the Fe in the background and evolution in morphology. Ions on raised facets seem more likely to escape or migrate to adjacent faces to produce larger smooth surfaces, possibly an octahedron (stability, growth, and diffusion of various microcrystal morphologies may be of interest to future authors). Thus, while 22Ne does not form stable microcrystals, higher impurities are viable candidates for phase separation and clustering.
3 C-O-Ne Phase Diagram
Although mixtures with cannot form stable microcrystals, mixtures with larger Ne abundances could. Therefore, we compute the ternary phase diagram to determine what Ne abundance may be required for such strong phase separation. We use the code111The code is available at https://github.com/andrewcumming/phase_diagram_3CP. developed in Caplan et al. (2018) which implements the semi-analytic method of Medin & Cumming (2010). This method identifies pairs of points on the minimum free energy surfaces which share a tangent plane (i.e. the double tangent construction); these points correspond to coexisting solid and liquid compositions. Compositions lying on the tangent line connecting them are therefore unstable and phase separate. For a detailed discussion see Medin & Cumming (2010); Caplan et al. (2018).
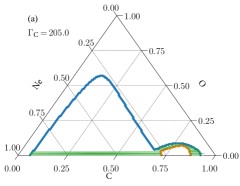
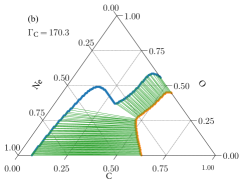
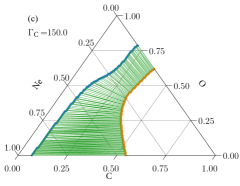
In Fig. 4 we show C/O/Ne phase diagrams for three . We report temperature in . Orange liquidus points are connected to corresponding blue solidus by green tie lines corresponding to the tangent in free energy. Below (above) the orange (blue) curve is stable liquid (solid), while the green tie lines span the unstable region.
At the lowest temperature (Fig. 4a), it is possible to form solid particles that are substantially enriched in Ne. The phase diagram shows solid-solid coexistence with strongly Ne enriched mixtures, where both the Ne-enriched and Ne-depleted crystals show (for readability we exclude solid-solid tie lines). We see the emergence of stable liquid near the C/Ne axis (bottom), found in the white region under the liquidus near . Along the C/Ne axis we see solid-liquid phase coexistence with strong separation; given we resolve eutectic separation.
At intermediate temperature (Fig. 4b) we reach for our mixture, , which is found near the middle of the RHS axis. In the unstable region we find separation largely consistent with the known C/O phase diagram from MD (see Fig. 5 in Hughto et al. 2012). Separation is approximately independent of Ne fraction for . Observe that the coexistence lines are approximately parallel to the C/O axis, which implies they fall on lines of constant Ne. Therefore, the Ne fraction in the solid and liquid are nearly equal which suggests that any C/O/Ne mixture with is incapable of separating to form any Ne rich components which could then preferentially settle out. This is qualitatively consistent with past MD (see Hughto et al. 2011) which studied mixtures of .
We also resolve a small set of mixtures which undergo three-component eutectic separation at intermediate , similar to the mixtures with large and studied by Caplan et al. (2018). The central ‘wedge’ between the break in tie lines contains unstable mixtures which do not fall on a single coexistence line so they cannot separate into a single solid and single liquid composition, but they can separate by forming appropriate amounts of the two solids and one liquid at the corners of this region.
At high temperature (Fig. 4c) the solidus and liquidus curves are continuous and the region for the eutectic separation has closed. Though mixtures with now show weak enhancement in solidus Ne, those with are still largely consistent with two-component C/O separation without any Ne enrichment or depletion.
Even if there is factor of 2 variation in it only translates our mixture parallel to the O axis, which does not move our mixture into a region where it achieves strong Ne purification at any . We conclude that the behavior of 22Ne microcrystals in MD is fully consistent with the known C/O/Ne phase diagram, and that no mesoscopic effects exist that make 22Ne cluster formation likely.
As past MD has only studied phase coexistence up to 20% Ne, we also perform a few MD simulations to validate the behavior around 30% Ne. Similar to Hughto et al. 2012; Caplan et al. 2018, configurations are prepared by joining a cubic bcc crystal on one face with a cubic volume of liquid (as in Fig. 1 in Hughto et al. 2012 and Fig. 1 in Caplan et al. 2018). Compositions for the solid and liquid are chosen to approximately match predictions from the phase diagram at , allowing us to verify the strong break in the center of Fig. 4b. Our first mixture has low Ne, , which separates to a solid and a liquid . Our second mixture has high Ne, , and strongly separates to and . These simulations were evolved for timesteps with little observed evolution. Runs varying up and down respectively find quenching of diffusion in the liquid and melting of the crystal, suggesting these temperature variations have moved our mixtures into the region of stable liquid and stable solid. Taken together, these simulations have qualitative agreement with our phase diagram, and we conclude that the separation behavior near 30% Ne concentration is likely physical. Future work may be interested in performing a more thorough survey at high Ne concentration with MD, though this may have limited astrophysical relevance.
4 Discussion
We find that 22Ne microcrystals are always unstable in a C/O liquid. Either the temperature is high enough that the crystal melts and the Ne dissolves into the liquid, or the whole system including the C/O mixture freezes. Note that even at temperatures below the melting point of pure Ne, but above the C/O melting point, a large entropy of mixing causes the small concentration of Ne to dissolve into the bulk liquid. The C/O/Ne phase diagram suggests that very much more Ne is necessary before it phase separates. One needs not 2% but 30% or more. As a result, a conventional C/O WD with is not expected to form stable neon clusters with enhanced sedimentation. In summary, we find that there are no conditions where a 22Ne-enriched cluster is stable in a C/O WD, and therefore, enhanced diffusion of 22Ne cannot explain the Q branch.
What compositions could then explain the heating that Cheng et al. infer? As seen in our phase diagram, unless the C/O ratio or 22Ne abundance is tuned to extremes we don’t expect strong 22Ne separation, so we suggest that Q branch WDs may have an anomalous composition. For example, Camisassa et al. (2020) have suggested that can provide heating on the desired timescale considering only single-particle diffusive settling rather than clusters. Another possibility is abundance of another impurity, besides 22Ne, with an even larger charge which would allow it to phase separate even when Ne does not. This impurity would need to be neutron rich () to be a sedimentary heat source and have an abundance of a percent or more for there to be enough gravitational energy available. Our MD with a high purity microcrystal shows that Na and Mg should not strongly separate in a C/O mixture. Phase diagrams of C/O/Na and C/O/Mg mixtures produced using our semi-analytic method (omitted for length) are similar to the C/O/Ne in that they do not separate to form a solid enriched in the high impurity when it is only abundant at the percent level, so isotopes such as 23Na or 26Mg are poor candidates for clustering.
Iron-group elements provide another possibility, as we readily observe long lived Fe microcrystals in MD. As , Fe in C/O will phase separate and likely does not require fine tuning of the mixture. While sedimentation of 0.1% Fe by mass may produce some notable heating, if some astrophysical process enriches Q branch WDs up to mass fraction then settling out of Fe could provide heating for several Gyr as an otherwise conventional C/O WD cools. Thus, this work motivates including Fe in WD cooling models. This will require new phase diagrams of Fe and a survey with MD of the clustering and the characteristic sizes of Fe clusters, which will be the subject of future work.
References
- Acevedo & Bramante (2019) Acevedo, J. F., & Bramante, J. 2019, Phys. Rev. D, 100, 043020, doi: 10.1103/PhysRevD.100.043020
- Babusiaux et al. (2018) Babusiaux, C., van Leeuwen, F., Barstow, M. A., et al. 2018, A&A, 616, A10, doi: 10.1051/0004-6361/201832843
- Bauer et al. (2020) Bauer, E. B., Schwab, J., Bildsten, L., & Cheng, S. 2020, arXiv e-prints, arXiv:2009.04025. https://arxiv.org/abs/2009.04025
- Bertone & Fairbairn (2008) Bertone, G., & Fairbairn, M. 2008, Phys. Rev. D, 77, 043515, doi: 10.1103/PhysRevD.77.043515
- Bildsten & Hall (2001a) Bildsten, L., & Hall, D. M. 2001a, The Astrophysical Journal, 549, L219, doi: 10.1086/319169
- Bildsten & Hall (2001b) —. 2001b, The Astrophysical Journal, 549, L219, doi: 10.1086/319169
- Bildsten & Hall (2001c) —. 2001c, The Astrophysical Journal Letters, 549, L219
- Blouin et al. (2020) Blouin, S., Daligault, J., Saumon, D., Bédard, A., & Brassard, P. 2020, arXiv e-prints, arXiv:2007.13669. https://arxiv.org/abs/2007.13669
- Bramante (2015) Bramante, J. 2015, Phys. Rev. Lett., 115, 141301, doi: 10.1103/PhysRevLett.115.141301
- Camisassa et al. (2020) Camisassa, M. E., Althaus, L. G., Torres, S., et al. 2020, arXiv e-prints, arXiv:2008.03028. https://arxiv.org/abs/2008.03028
- Caplan et al. (2018) Caplan, M. E., Cumming, A., Berry, D. K., Horowitz, C. J., & Mckinven, R. 2018, The Astrophysical Journal, 860, 148, doi: 10.3847/1538-4357/aac2d2
- Caplan & Horowitz (2017) Caplan, M. E., & Horowitz, C. J. 2017, Rev. Mod. Phys., 89, 041002, doi: 10.1103/RevModPhys.89.041002
- Cheng et al. (2019) Cheng, S., Cummings, J. D., & Ménard, B. 2019, The Astrophysical Journal, 886, 100, doi: 10.3847/1538-4357/ab4989
- Deloye & Bildsten (2002) Deloye, C. J., & Bildsten, L. 2002, ApJ, 580, 1077, doi: 10.1086/343800
- García-Berro et al. (2008) García-Berro, E., Althaus, L. G., Córsico, A. H., & Isern, J. 2008, ApJ, 677, 473, doi: 10.1086/527536
- Graham et al. (2018) Graham, P. W., Janish, R., Narayan, V., Rajendran, S., & Riggins, P. 2018, Phys. Rev. D, 98, 115027, doi: 10.1103/PhysRevD.98.115027
- Graham et al. (2015) Graham, P. W., Rajendran, S., & Varela, J. 2015, Phys. Rev. D, 92, 063007, doi: 10.1103/PhysRevD.92.063007
- Hamaguchi et al. (1997) Hamaguchi, S., Farouki, R. T., & Dubin, D. H. E. 1997, Phys. Rev. E, 56, 4671, doi: 10.1103/PhysRevE.56.4671
- Hollands et al. (2020) Hollands, M. A., Tremblay, P. E., Gänsicke, B. T., et al. 2020, Nature Astronomy, 4, 663, doi: 10.1038/s41550-020-1028-0
- Horowitz (2020) Horowitz, C. J. 2020, Nuclear and dark matter heating in massive white dwarf stars. https://arxiv.org/abs/2008.03291
- Horowitz et al. (2008) Horowitz, C. J., Dussan, H., & Berry, D. K. 2008, Phys. Rev. C, 77, 045807, doi: 10.1103/PhysRevC.77.045807
- Horowitz et al. (2010) Horowitz, C. J., Schneider, A. S., & Berry, D. K. 2010, Phys. Rev. Lett., 104, 231101, doi: 10.1103/PhysRevLett.104.231101
- Hughto et al. (2012) Hughto, J., Horowitz, C. J., Schneider, A. S., et al. 2012, Phys. Rev. E, 86, 066413, doi: 10.1103/PhysRevE.86.066413
- Hughto et al. (2010a) Hughto, J., Schneider, A., Horowitz, C., & Berry, D. 2010a, Physical Review E, 82, 066401
- Hughto et al. (2010b) Hughto, J., Schneider, A. S., Horowitz, C. J., & Berry, D. K. 2010b, Phys. Rev. E, 82, 066401, doi: 10.1103/PhysRevE.82.066401
- Hughto et al. (2011) —. 2011, Phys. Rev. E, 84, 016401, doi: 10.1103/PhysRevE.84.016401
- Hughto et al. (2011) Hughto, J., Schneider, A. S., Horowitz, C. J., & Berry, D. K. 2011, Phys. Rev. E, 84, 016401, doi: 10.1103/PhysRevE.84.016401
- Hurst et al. (2015) Hurst, T. J., Zentner, A. R., Natarajan, A., & Badenes, C. 2015, Phys. Rev. D, 91, 103514, doi: 10.1103/PhysRevD.91.103514
- Lauffer et al. (2018) Lauffer, G., Romero, A., & Kepler, S. 2018, Monthly Notices of the Royal Astronomical Society, 480, 1547
- Medin & Cumming (2010) Medin, Z., & Cumming, A. 2010, Phys. Rev. E, 81, 036107, doi: 10.1103/PhysRevE.81.036107
- Potekhin & Chabrier (2000) Potekhin, A. Y., & Chabrier, G. 2000, Phys. Rev. E, 62, 8554, doi: 10.1103/PhysRevE.62.8554
- Salpeter & van Horn (1969) Salpeter, E. E., & van Horn, H. M. 1969, ApJ, 155, 183, doi: 10.1086/149858
- Tremblay et al. (2019) Tremblay, P.-E., Fontaine, G., Fusillo, N. P. G., et al. 2019, Nature, 565, 202, doi: 10.1038/s41586-018-0791-x
- Vaulina et al. (2002) Vaulina, O., Khrapak, S., & Morfill, G. 2002, Phys. Rev. E, 66, 016404, doi: 10.1103/PhysRevE.66.016404
- Winget et al. (2009) Winget, D. E., Kepler, S. O., Campos, F., et al. 2009, The Astrophysical Journal, 693, L6, doi: 10.1088/0004-637x/693/1/l6
- Yakovlev et al. (2006) Yakovlev, D. G., Gasques, L. R., Afanasjev, A. V., Beard, M., & Wiescher, M. 2006, Phys. Rev. C, 74, 035803, doi: 10.1103/PhysRevC.74.035803