Noise induced effects at nano-structured thin films growth during deposition in plasma-condensate devices
Abstract
We perform a comprehensive study of noise-induced effects in a stochastic model of reaction-diffusion type, describing nano-structured thin films growth at condensation. We introduce an external flux of adsorbate between neighbour monoatomic layers caused by the electrical field presence near substrate in plasma-condensate devices. We take into account that the strength of the electric field fluctuates around its mean value. We discuss a competing influence of the regular and stochastic parts of the external flux onto the dynamics of adsorptive system. It will be shown that the introduced fluctuations induce first-order phase transition in a homogeneous system, govern the pattern formation in a spatially extended system; these parts of the flux control the dynamics of the patterning, spatial order, morphology of the surface, growth law of the mean size of adsorbate islands, type and linear size of surface structures. The influence of the intensity of fluctuations onto scaling and statistical properties of the nano-structured surface is analysed in detail. This study provides an insight into the details of noise induced effects at pattern formation processes in anisotropic adsorptive systems.
Key words: stochastic systems, non-linear dynamics, pattern formation, fluctuation induced effects
Abstract
Ó äàíié ðîáîòi ïðîâîäèòüñÿ âñåáiчíå äîñëiäæåííÿ iíäóêîâàíèõ øóìîì åôåêòiâ ó ñòîõàñòèчíié ìîäåëi ðåàêöiéíî-äèôóçiéíîãî òèïó, ùî îïèñóє ïðîöåñ çðîñòàííÿ íàíîñòðóêòóðîâàíèõ òîíêèõ ïëiâîê ïðè êîíäåíñàöi¿ â ñèñòåìi ïëàçìà-êîíäåíñàò. Ââîäèòüñÿ çîâíiøíié ïîòiê àäñîðáàòó ìiæ ñóñiäíiìè øàðàìè, ñïðèчèíåíèé íàÿâíiñòþ åëåêòðèчíîãî ïîëÿ áiëÿ ïiäêëàäêè. Âðàõîâóєòüñÿ, ùî íàïðóæåíiñòü åëåêòðèчíîãî ïîëÿ ôëóêòóþє íàâêîëî éîãî ñåðåäíüîãî çíàчåííÿ. Îáãîâîðþєòüñÿ êîíêóðóþчèé âïëèâ ðåãóëÿðíî¿ òà ñòîõàñòèчíî¿ чàñòèí çîâíiøíüîãî ïîòîêó íà äèíàìiêó ñèñòåìè. Ïîêàçàíî, ùî ââåäåíi çîâíiøíi ôëóêòóàöi¿ çäàòíi iíäóêóâàòè ôàçîâèé ïåðåõiä ïåðøîãî ïîðÿäêó â îäíîðiäíié ñèñòåìi, êåðóâàòè ôîðìóâàííÿì ñòðóêòóð ó ïðîñòîðîâî-ðîçïîäiëåíié ñèñòåìi. Òàêi ôëóêòóàöi¿ êîíòðîëþþòü äèíàìiêó ôîðìóâàííÿ ïîâåðõíåâèõ ñòðóêòóð, ïðîñòîðîâèé ïîðÿäîê, ìîðôîëîãiþ ïîâåðõíi, çàêîí çðîñòàííÿ ñåðåäíüîãî ðîçìiðó îñòðîâiâ àäñîðáàòó, òèï òà ëiíiéíèé ðîçìið ïîâåðõíåâèõ ñòðóêòóð. Äåòàëüíî ïðîàíàëiçîâàíî âïëèâ iíòåíñèâíîñòi ââåäåíèõ ôëóêòóàöié íà ñêåéëiíãîâi òà ñòàòèñòèчíi âëàñòèâîñòi íàíîñòðóêòóðîâàíî¿ ïîâåðõíi. Îòðèìàíi ðåçóëüòàòè çàáåçïåчóþòü ðîçóìiííÿ äåòàëåé iíäóêîâàíèõ øóìîì åôåêòiâ ïðè ôîðìóâàííi ïîâåðõíåâèõ íàíîðîçìiðíèõ ñòðóêòóð ó ïðîöåñàõ êîíäåíñàöi¿ â ñèñòåìàõ ïëàçìà-êîíäåíñàò.
Ключовi слова: ñòîõàñòèчíi ñèñòåìè, íåëiíiéíà äèíàìiêà, ñòðóêòóðîóòâîðåííÿ, iíäóêîâàíi øóìîì åôåêòè
1 Introduction
Spatial patterns are widely present in different natural dynamical systems. Their occurrence has been studied for quite a long time with several applications in different fields, from hydrodynamic systems, plant ecosystems to biochemical and neural systems. The study of patterns can offer useful information on the underlying processes causing possible changes of the system. Deterministic mechanisms in pattern formation have been widely studied (see, for example, [1]). Spontaneous pattern formation and instabilities have been discovered in many physical, chemical and biological systems, such as thin liquid films [2], sand ripples and dunes [3, 4], crystal growth [5], water waves [6], electroconvection in liquid crystals [7].
Nonlinear systems usually exhibit a disordered behaviour in the absence of fluctuations. The influence of noise on spatial extended systems has received lots of attention [8, 9, 10, 11, 12, 13, 14] in the recent decades. It was shown that noise may give rise to an ordered behaviour and to new dynamical states [15, 16]. In recent decades, many studies have focused on investigations of noise-induced phenomena which demonstrate a counter-intuitive role for fluctuations leading to self-organization effects. Much of the early work dealt with noise-induced phenomena in zero-dimensional systems. More recently, it has become widely recognized that the effects of fluctuations on systems with a large number of degrees of freedom, the so-called spatially extended systems, play a major role. The most interesting effects in spatially extended systems are noise-induced spatial patterns and phase transitions [17, 18, 19, 20]. The ordering phase transition is associated with the ordered phase (in a thermodynamic sense) realization, when a randomly fluctuating source is introduced into the dynamical system [21, 22, 23, 24]. From a fundamental point of view, such effects are of the dynamic origin: in the short-time limit, fluctuations destabilize the disordered homogeneous state. The noise plays an organizing role if its amplitude depends on the field variable [15, 16]. Moreover, the ordered phase can exist for a particular range of the noise intensities. These effects are known as reentrant phase transitions, when an increase in the noise intensity leads to the formation of an ordered state at a fixed range of the noise intensity. The above reentrance appears as a result of the combined effect of the nonlinearity of the system and the spatial coupling.
Among mathematical models used to perform theoretical studies of noise induced effects in spatially extended systems one can issue reaction-diffusion systems. These systems play an important role in the study of the generic spatio-temporal behaviour of non-equilibrium systems. Various theoretical analyses and computer simulations have demonstrated a possibility of spatio-temporal pattern formation in such systems. However, this was not experimentally verified until 1990, when the stationary pattern was first observed experimentally in the reaction-diffusion process [25]. Reaction-diffusion systems are naturally applied in chemistry, biology, geology, ecology and physics [26, 27, 28]. They also were exploited in studying the pattern formation at deposition from gaseous phase [30, 31, 29]. In such systems, fluctuations are usually assumed to be negligibly small and are taken into account as an additive noise. At the same time, it was previously shown that internal multiplicative noise satisfying fluctuation-dissipation relation is capable of controlling the dynamics of pattern formation and statistical properties of the spatial structures (see [32]).
In this paper we are aimed at performing a detailed study of the external noise influence onto the dynamics of the reaction-diffusion system, describing nano-structured thin films growth in plasma-condensate devices. We discuss the noise-induced first-order phase transitions and noise-induced pattern formation. We show a possibility of the noise-sustained reentrant pattern formation and transformation in the surface morphology with variation in the intensity of the external fluctuations. We provide statistical analysis of the surface patterns and discuss an influence of the noise-over-signal ratio onto the scaling dynamics of the mean size growth of separated nanosized adsorbate islands at deposition.
The work is organized in the following manner. In the next section we derive the stochastic model of anisotropic plasma-condensate system by taking into account the stochastic nature of the external flux caused by the electrical field presence near the substrate. In section 3 we discuss noise-induced first-order phase transition in a homogeneous system and noise induced effects in a spatially extended system in the framework of stability analysis and numerical simulations. We conclude in the last section.
2 Mathematical model
During deposition at condensation from gaseous phase or plasma, an evolution of the local coverage of adsorbate on a substrate is caused by the main processes: adsorption, desorption, isotropic transference of adatoms between neighbour layers (for multilayer deposition), lateral diffusion of adatoms on any adsorbate layer and possible anisotropic motion induced by external fields. A competition of these mechanisms results in spatio-temporal change in the local adsorbate concentration and pattern formation on the growing thin film. The schematic presentation of the basic mechanisms describing the deposition of a monoatomic film on a substrate is shown in figure 1.
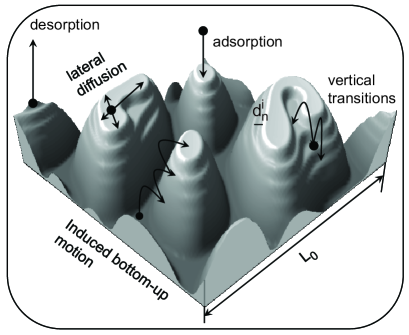
In this article we study the processes of separated surface structures formation at condensation. To this end, we consider two types of the growth of thin films namely the Volmer-Weber type of the growth of separated islands of a thin film when interface energy is relatively large and separated adsorbate islands form and grow before a layer is completed by infilling; and Stranski-Krastanov type when interface energy is comparable to the island interaction energy, and hence layer formation competes with the formation of islands. During these growth processes, the morphology of the current layer inherits the morphology of the precursor layer as it is shown in figure 1.
To perform analytical description of the adsorbate concentration evolution in adsorptive multilayer system, we exploit the mesoscopic approach by monitoring the coverage field on any -th layer; is the space coordinate and is the deposition time; , where is the total number of layers. The whole layer with the linear size is divided into unit cells with the linear size . The local coverage in each unit cell on the -th layer is defined as the ratio between the number of adatoms and the number of possible free sites, which yields with being the substrate. In such mesoscale approach, the local distribution of the concentration in each cell is not taken into account. This approach allows one to construct the reaction-diffusion model for adsorbate concentration evolution in each unit cell of a standard form:
| (2.1) |
where the term is responsible for the quasi-chemical reactions on the -th layer, including adsorption, desorption and transfer of adatoms between layers; the flux relates to the mass transport.
During deposition, an atom (or ion) from gaseous phase (or plasma) can attract the growing surface and become adatom with the rate . An adsorption rate is defined as , where is the pressure inside a chamber, is the activation energy for adsorption, is the temperature measured here in energetic units, and sets the frequency factor. Adsorption is possible if there are free sites on the current -th layer for adsorption; the occupied sites on the precursor -th layer, serving a substrate for adsorption, and free sites on the next -th layer. Hence, the adsorption processes are described by the term . Adsorbed particles (adatoms) can desorb from the -th layer back to the gaseous phase (plasma) with the rate , which includes desorption rate for noninteracting particles , where is the activation energy for desorption, and the contribution caused by the strong local bond (substratum-mediated interactions) , defined by the interaction potential . The desorption rate relates to the life time scale of adatoms as . For the multilayer system, the desorption processes require occupied sites on the precursor -th layer and free sites on the next -th layer and are described by the term . For the multilayer adsorptive system, one should include into the model the term related to the transference of adatoms between neighbour layers, representing standard vertical diffusion in the form , where is the frequency of such transitions, which defines the life time of the adatom on the current layer [33].
The lateral diffusion flux on any -th layer is defined as a combination of the free lateral diffusion and diffusion caused by the interaction potential in the form ; is the lateral diffusion coefficient and indicates that this diffusion is possible on free sites only. By exploiting self-consistence approximation, the interaction potential can be defined through the binary attractive potential for adatoms separated by a distance in the form [36, 37, 29, 30, 31, 32, 38, 35, 34, 33]. In the simplest case, we use in the Gaussian form , where and are interaction energy and interaction radius, respectively. By taking into account that adsorbate concentration varies slowly within the interaction radius, we expand the integral :
| (2.2) |
By considering the multilayer system, we assume that these lateral interactions are mediated by the precursor layer with the concentration . By substituting into equation (2.2) and taking into account that at we get an expression for the interaction potential for the -th layer in the following form [35, 34, 33]:
| (2.3) |
where the multiplier denotes the interactions mediated by the precursor layer; , , . If the lattice misfit between film and substrate is large then the bonding between adatoms on the first layer and substrate is strong [36]. In such a case, the interaction potential (2.3) should be generalized by taking into account the elastic effects coming from attractive interaction between the substrate and adsorbed particles in the form [36, 37]. In such systems, both elasticity and stress effects make desorption negligible during the growth of the first layer. For sufficiently small lattice misfit between film and substrate, elasticity and stress effects even for the first growing layer may be neglected [39]. If the deposited atoms are of the same type, then on the -th layer with there are no elastic effects. They affect onto spatial rearrangement of adatoms on the first layer only. We assume that spatial configuration of adsorbate on any -th layer with repeats the configuration on the precursor layer. The corresponding explanations were given by independent modelling of multilayer growth discussed in [35, 34, 40]. Therefore, next, without loss of generality we neglect the elastic effects.
In special kind of devices used for fabrication of nano-structured thin films, one operates with external fields to produce surface patterns of a different type. The typical example is the effect of electromigration, when ionic transport in the reverse direction of an electrical field is caused by the momentum transfer from free electrons to metal ions. This method is used to fabricate line-type structures [41, 42]. In accumulative ion-plasma devices, the patterning of adsorbate is sustained by the electrical field near the substrate. In this kind of systems, the adsorbed particles can desorb back into plasma to be additionally ionized and adsorbed onto higher levels of the adsorbate structure of multi-layers [43, 44]. In order to describe this induced vertical motion of adatoms from the lower layers towards the upper ones, we introduce an additional contribution , where is proportional to the strength of the electrical field near the substrate ; is the coordination number and is the electron charge [34, 40].
To describe an evolution of the growing surface in more realistic conditions, one should take into account the stochastic nature of the electrical field. It means that the strength of the electric field can be considered as a fluctuating parameter of the model. Considering small deviations from the fixed strength we can expand the reaction term in equation (2.1) in the vicinity of , which yields: , where is assumed to be the stochastic field, , that in the simplest case represents zero-mean white Gaussian noise with correlation , where is the intensity of fluctuations of the electrical field strength, proportional to .
In [33] by studying the two-layer model, the authors showed that in a multi-layer system the occupation of each layer affects the one in the immediate neighbor layers. In order to perform numerics for the -layer system, one needs to solve differential equations (2.1). In order to characterize the influence of the introduced fluctuations onto the dynamics of pattern formation in the studied system, we pass to the effective 1-layer model, by considering the spatio-temporal evolution of adsorbate concentration on the intermediate -th layer. To that end, we define the adsorbate concentration on both precursor -th and the next -th layers through one on the current -th layer. Let us consider the mean adsorbate concentration on any -th layer as the ratio between square covered by adsorbate on the -th layer and square of the substrate , as : , where is the linear size of the substrate; , where is the square of the -th structure on the -th layer; sum is taken over all structures. Following the principle of minimization of the surface energy, we take into account that the linear size of each -th multi-layer structure decreases with the layer number growth by the terrace width , averaged over all structures and over all layers (see figure 1). Formally, we can combine all areas covered by the adsorbate on the -th layer into one structure with the linear size , which yields . In such a case, decreases with the layer number by the value , representing the terrace width for the constructed multi-layers structure. From a naive consideration it follows that and . In the simplest case, we can put . This expression gives the relation between the area covered by adsorbate on any -th and first layers: . Hence, for the mean adsorbate concentration on the -th layer, nearest -th and -th layers, we get:
| (2.4) | |||||
After a simple algebra for the averaged concentrations on the precursor layer one finds: , where . From the naive consideration it follows that for the formation of adsorbate islands, the relation should be satisfied. This gives . Physically, the terrace widths and depend on the material properties, temperature and deposition conditions and can be defined in real experiments [45, 46, 47, 48]. Finally, by taking into account that the morphology of any ()-th layer inherits the morphology of the -th layer the same relation is realized with the spatial distribution of the adsorbate concentration. This allows us to use, for the local concentration of adsorbate in each unit cell on the neighbor ()-th and ()-th layers, the following relations:
| (2.5) |
Next, it is more convenient to scale time in dimensionless units , and introduce dimensionless parameters , , , . By introducing the diffusion length , the evolution equation for the adsorbate concentration on the intermediate layer of the multi-layer plasma-condensate system in the Stratonovich interpretation reads:
| (2.6) |
where the reaction term becomes of the form:
| (2.7) | |||||
with and . The total lateral adsorbate flux reads:
| (2.8) |
where . In the further study we assume that the time scales and are approximately the same, which yields . For the parameter we put meaning that for the terrace width of the pyramidal structure, combined from all separated pyramidal-like adsorbate islands.
The main goal of this work is to perform a detailed study of the influence of the introduced multiplicative external noise onto the dynamics of pattern formation in the system studied and statistical properties of the surface morphology.
3 Results and discussions
By considering the homogeneous system equation (2.6) with , we pay most of our attention to the study of the noise induced phase transitions of the first order. Next, in the framework of stability analysis, we discuss the possibility of introducing noise to induce ordering/disordering in a spatially extended system. Finally, by exploiting numerical simulations we analyse the influence of fluctuations of the external field onto the dynamics of pattern formation and statistical properties of the surface structures formed at deposition.
3.1 Noise induced phase transitions
It is known that either internal fluctuations, corresponding to the fluctuation-dissipation relation, or external fluctuations can induce phase transitions in complex systems (see, for example [49, 15, 16]). In this section we discuss the influence of the introduced external fluctuations on stability of the homogeneous state , defined from the equation
| (3.1) |
In the inset in figure 2 we show the bifurcation diagram of the homogeneous system (2.6) at , and . It follows that with an increase in the noise intensity , one gets the first order phase transition at . By varying the adsorption coefficient , we have calculated the critical value of the noise intensity responsible for the corresponding bifurcation.
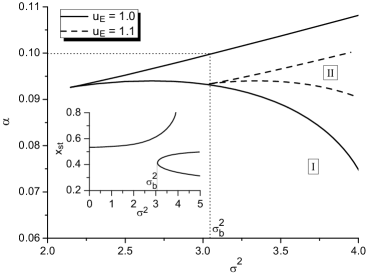
The phase diagram is shown as the main plot in figure 2 for different values of the anisotropy strength . Here, in the domain I, the system is characterized by the single stationary state ; in the domain II (inside the corresponding cusp), the system is bistable. It is seen that an increase in the anisotropy strength requires elevated values of its fluctuation intensity for the first-order transition. Hence, the competition of deterministic and stochastic parts of the external flux, induced by the electric field near the substrate, controls phase transitions of the first order in the system.
In the next sections we consider a spatially extended system to define the influence of fluctuations of the external flux competing with its deterministic part onto the pattern formation.
3.2 Stability analysis
Let us analyse the stability of homogeneous stationary states to inhomogeneous perturbations in the framework of the standard stability analysis. According to this procedure, the deviation of the adsorbate concentration from the stationary value is assumed in the form , where is the wave number and is the stability exponent. Assuming to be a small parameter, we can expand the left-hand side of the equation (3.1) in the vicinity of . In such a case, from the evolution equation (2.6) one immediately gets the dispersion relation:
| (3.2) |
where notations , are used and the limit is considered. The stability exponent can be associated with the order parameter for spatial instability in the system studied. If , then the system is stable, meaning that all spatial instabilities will disappear in time. In such a case, the adsorbate will cover the substrate homogeneously without any stable separated structures (islands). The existence of positive values of the stability exponent means that spatial perturbation will grow in time, leading to spatial ordering of the coverage field with the formation of separated surface structures. Here, one has at and the period of spatial modulations corresponds to the maximal value of the stability exponent, which can be defined from the relation .
Next, we refer to the field that exhibits an ordered state with organized spatial structures as patterned (i.e., ordered). This general definition, including both periodic and multiscale patterns, is often adopted in the environmental sciences, where the number of different processes can prevent the organization of a system with a clear dominant wavelength.
From the stability exponent equation (3.2) it follows that the term with will stabilize the system due to . On the other hand, the first term in the right-hand side in equation (3.2) should be negative to enforce the condition . Instability of the system equation (2.6) is caused by the term with . Hence, one can expect that the variation in the noise intensity at other fixed parameters can induce ordering/disordering of the system.
The provided linear stability analysis allows one to define the domains of the main system parameters, where the pattern formation is possible. The calculated stability diagram in coordinates at different values of and is shown in the left-hand panel in figure 3.
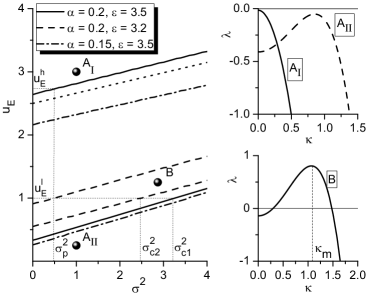
Here, inside the domains AI and AII, stability exponent is negative for all [see typical dependence in the right-hand panel in the top in figure 3]. In the domain B bounded by curves of the same type the stability exponent becomes positive in the interval . Typical dependencies of the stability exponent on the reduced wave-number inside the domain B is shown in the right-hand panel in the bottom in figure 3.
It follows that in the deterministic quasi-equilibrium system with and (weak electrical field near substrate) no spatial instabilities can be realized (domain AII). Here, only the layer-by-layer growth of the thin film is possible without any separated structures [50]. Let us discuss, initially, the influence of the competition of regular and stochastic parts of the external flux, and onto the stability of the stationary homogeneous state to inhomogeneous perturbations at and (see solid curves in left-hand panel in figure 3). It follows that in the case of a strong anisotropy () in quasi deterministic system (), a rapid bottom-up motion of adatoms leads to a decrease in the adsorbate concentration on the layer, and thus the required saturation of the adsorbate concentration needed for patterning is not achieved. An increase in the noise intensity induces the pattern formation in the system at (transition from the domain AI towards domain B). With a further growth in , the growing surface remains structured. At intermediate values of the anisotropy strength even in a deterministic system, surface structures are stable. Here, an increase in the noise intensity provides stabilization of the homogeneous state at .
A decrease in the interaction strength at a fixed adsorption coefficient leads to a shrink in the domain B, where the pattern formation is possible (see dash curves in left-hand panel in figure 3). Here, at fixed values of the deterministic part of the external flux one gets noise induced reentrant ordering in the system: in the cases and , no spatial instability is realized; if , stable surface structures will be formed on the growing surface during deposition. A decrease in the adsorption coefficient leads to a decrease in the critical values of the anisotropy strength , when patterning is possible (compare solid and dash-dot curves in the left-hand panel in figure 3). The dot curve in the left-hand panel in figure 3 corresponds to the relation at , and will be discussed later.
Dependence of the maximal value of the stability exponent, corresponding to the most unstable mode (see right-hand bottom panel in figure 3) versus anisotropy strength and noise intensity at fixed and (solid curves in figure 3) is shown in figure 4. It follows that with an increase in either deterministic or stochastic part of the external flux, the maximal value of the stability exponent is characterized by the maximal value. It means that the spatial order of the system increases, attains the maximal value and then decreases with the growth in either or . The value , that corresponds to the maximal value of the stability exponent , increases with , which is shown in the inset in figure 4. Moreover, with an increase in the anisotropy strength with from the inset in figure 4, the maximal value of the stability exponent increases. Hence, an increase in both stochastic and deterministic parts of the external flux promotes the formation of a well ordered surface during deposition in plasma-condensate system.
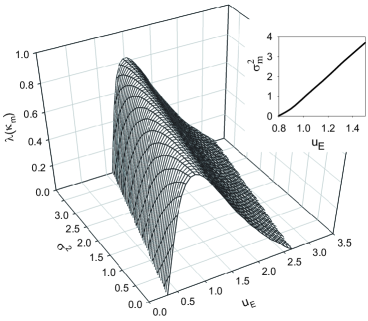
Such non-monotonous dependence of the maximal value of the stability exponent on the deterministic and stochastic parts of the external flux means a change in the type of the surface structures realized during deposition. It was previously shown that an increase in in a deterministic system leads to the change in the surface morphology from separated nano-holes inside an adsorbate matrix towards separated multilayer nano-dots on the substrate [34]. Therefore, one can expect that the introduced fluctuations will lead to the morphological transformation of the surface pattern with an increase in the noise intensity .
Hence, from the provided stability analysis it follows that a competition of the deterministic and stochastic parts of the external flux of adatoms, caused by the electrical field near the substrate, leads to the noise induced reentrant scenario of pattern formation in an adsorptive plasma-condensate system.
3.3 Numerical simulations
To perform a detailed study of an influence of the introduced fluctuations of the external flux onto the dynamics of pattern formation and possibility to control both the morphology of the surface and the size of islands in derived stochastic plasma-condensate systems, in this section we perform numerical simulations of the processes of pattern formation during deposition. To this end, we solve the Langevin equation equation (2.6) on two-dimensional hexagonal grid with linear size and periodic boundary conditions. To solve the multiplicative noise Langevin equation treated in the Stratonovich sense, we use the Milstein scheme [51]. The white noise source was generated with the help of the Box-Muller algorithm, satisfying generation of random numbers with the Gaussian distribution [52]. In the case of triangular or hexagonal symmetry, there are three wave vectors separated by angles. Spatial derivatives of the second and fourth orders were computed according to the standard finite-difference scheme for the hexagonal grid. The time step was , the spatial integration step was . As initial conditions we use Gaussian distribution with . In the computational scheme, the total size of the system is .
An evolution of the morphology of the growing surface is shown in figures 5 a,b from left to right at , , and different values of the noise intensity : and , respectively.
a) 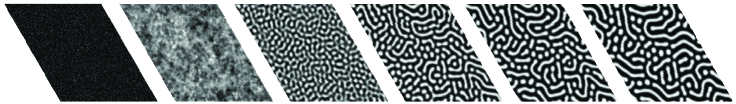
b) 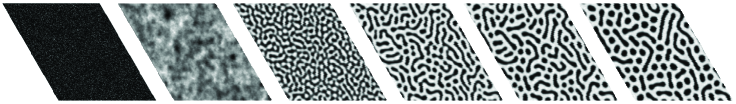
Here, with the help of the shades of the grey color, we show the adsorbate concentration in each site of the hexagonal grid: black color corresponds to the spatial configuration without adsorbate on the layer; white color means that the current cite is filled with adsorbate. It follows that during the deposition after some incubation period an interaction of adsorbate leads to pattern formation on the layer: formation of a large amount of small adsorbate clusters. These clusters interact and, depending on the deposition conditions, form a stationary picture of the surface morphology, shown in the last column in figure 5. At small values of the noise intensity (see figure 5 a), the initially formed small adsorbate clusters grow, while at large times one gets a fixed number of adsorbate islands of different forms (spherical and elongated clusters). At elevated values of the noise intensity, fluctuations result in an increase of the adsorbate concentration on the layer, leading to the formation of separated holes of different forms inside the adsorbate matrix (see figure 5 b). Hence, an increase of the noise intensity controls the type of the surface patterns leading to a morphological transformation of the growing surface from separated adsorbate islands on the substrate towards separated holes inside the adsorbate matrix.
The dynamics of pattern formation in spatially extended systems can be effectively studied by monitoring the mean concentration , averaged over the whole computational grid, and the dispersion of the coverage field . The latter quantity plays the role of an effective order parameter in problems of pattern formation. In the case , there is no essential difference in concentration of adsorbate in different cells of the computational grid. The growing-up temporal dependence indicates the ordering processes with the formation of dense (enriched by adsorbate) and diluted (depleted by adsorbate) phases: the larger is , the lager is the order of spatial configuration of adsorbate. If the order parameter attains stationary non-zero value, then the spatial configuration becomes stable and no further changes in distribution of adsorbate appear.
Temporal dependencies of both the mean adsorbate concentration and the order parameter are shown in figure 6 at fixed values of the adsorption coefficient , interaction strength , deterministic part of the external flux (anisotropy strength) and different values of the intensity of the fluctuating part of the external field.
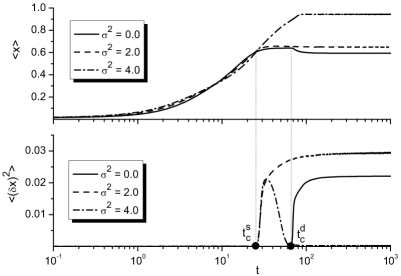
Here, the mean concentration in shown in the top panel; dispersion is presented in the bottom panel. First, let us discuss the reference deterministic case with , shown by solid curves. It follows that during deposition the mean adsorbate concentration grows in time and the dispersion of the coverage field equals zero. After some incubation period , the quantity drops a little and the dispersion starts to grow, meaning rearrangement of adsorbate on the layer with the formation of diluted and dense phases. With further deposition, both and attain their stationary non-zero values and , respectively, indicating the formation of a well structured surface.
The introduced fluctuations of the external flux influence the dynamics of the mean adsorbate concentration and its dispersion and their stationary values (see dash curves in figure 6 at ). Here, one should indicate a noise induced acceleration of the ordering processes: the incubation period becomes smaller compared to in the deterministic case. Moreover, at , there is no decreasing dynamics of the mean adsorbate concentration. It slowly goes to a stationary value which is a little larger than in the deterministic case. Noise action also increases the stationary value of the order parameter, leading to the formation of a more ordered film. At large values of the noise intensity (see curves at in figure 6), the situation changes crucially. Here, noise does not affect the incubation time , which determines the start of the ordering processes (see dash-dot curve in the bottom panel in figure 6). With a further exposing, the mean adsorbate concentration continuously grows in time, whereas the dispersion attains a maximal value and then drops towards zero, meaning homogenization of adsorbate distribution on the layer. Hence, at large intensity of fluctuations, only transient patterns are possible. In the stationary limit, when the mean concentration does not vary with time, adsorbate with high concentration covers the whole layer and no surface structures can be formed.
In order to provide a detailed study of the influence of the noise intensity onto stationary picture of adsorbate distribution on the layer, next we analyse the dependencies of both the stationary value on the mean adsorbate concentration on the layer and the stationary value of the order parameter on the noise intensity . In figures 7 a, b, the corresponding dependencies are shown for and different values of the interaction strength with the typical quasi-stationary snapshots at different values of the noise intensity in the top.
a) 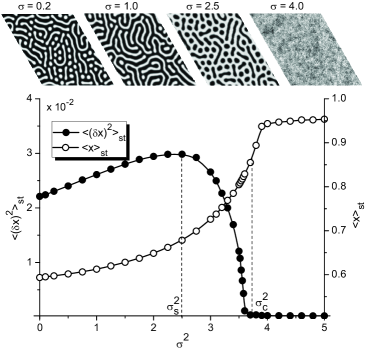 b)
b)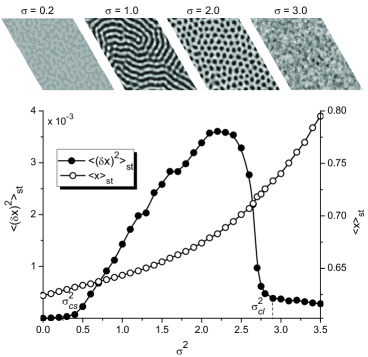
Initially, let us discuss the case , shown in figure 7 a. As was shown in figures 3 and 6, in such a case, even in deterministic case, one gets a nano-structured thin film during deposition. Here, with an increase of the noise intensity , both and the stationary value of the order parameter initially grow. At the order parameter attains maximal value and then decreases until (see filled circles in figure 7 a). In the case , one gets , whereas the stationary value of the adsorbate concentration continues to grow (empty circles in figure 7 b). At large values of the noise intensity, its growth does not affect the quantity . In the top panel in figure 7, a typical snapshots for the stationary picture of the spatial adsorbate distribution on the layer show a change in the surface morphology with an increase of the noise intensity . By comparing the results of the stability analysis and numerical simulations, one has (see insertion in figure 4). It means that the maximal value of the stability exponent , that corresponds to the , relates with critical value of the noise intensity when the morphological transformation of the surface is realized, and at , one gets labyrinthine-like structure with percolating clusters of adsorbate. The maximal spatial order is observed at , when separated holes are formed inside the adsorbate matrix (see snapshot at in the top panel in figure 7 a).
Next, let us consider the case of small interaction strength , shown in figure 7 b. In such a case, the stationary value of the adsorbate concentration continuously grows with the noise intensity (see empty circles in figure 7 b). The dependence of the stationary value of the order parameter on the noise intensity, discussed in the previous section, shows a reentrant picture of ordering. In the case of deterministic system and weak fluctuations, , one has , meaning homogeneous distribution of adsorbate over the layer without any spatial structures (see snapshot at in the top in figure 7 b). At , the stationary value of the order parameter increases with the noise intensity growth, attains maximal value and decreases; the morphology of the surface transforms from separated adsorbate islands towards separated holes (see filled circles in figure 7 b and typical snapshots in the top panel). At elevated values of the noise intensity (), noise acts in the same manner as in the case of large values of the interaction strength leading to the homogenisation of the adsorbate distribution on the layer (see snapshot at in figure 7 b). Hence, the performed numerics confirm the results of the stability analysis regarding the noise induced reentrant ordering in the system studied.
The found transformation in the surface morphology can be effectively studied by considering the correlation properties of the coverage field in the quasi-stationary limit . To perform this analysis, we consider the stationary two-point correlation function , which can be represented in the form: . Here, and are the correlation radius and the mean distance between structures (period of spatial modulations), respectively. Both quantities are sensitive to changes in morphology of the growing surface [32, 34, 53]. The dependencies of the period of spatial modulations and the correlation radius versus noise intensity are shown in figures 8 a, b, respectively with the typical quasi-stationary snapshots in figure 8 c at , and .
a) 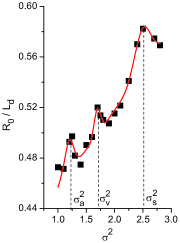 b)
b) 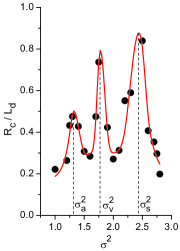 c)
c) 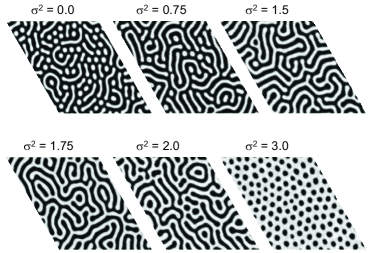
It follows that with the fluctuation intensity growth, the period increases in a non-monotonous manner, having three peaks, located at , and (see figure 8 a). The dependence is also characterized by the three peaks with the same location. The last peak at is related to the maximal value of the stationary order parameter (compare with figure 7 a). By analysing the dependencies and with the snapshots in figure 8, one can argue that at the labyrinthine structure of percolating adsorbate clusters is realized (see snapshots at and in figure 8 c), whereas at , separated spherical holes inside the adsorbate matrix start to organize (see snapshots at and in figure 8 c). The critical value corresponding to the change in the surface morphology from the separated adsorbate islands on the substrate through the labyrinthine structure towards separated holes inside the adsorbate matrix relates well to , obtained in the framework of the stability analysis (see inset in figure 4), when the stability exponent has the maximal value.
To perform a statistical analysis of a change in the surface morphology in quasi-stationary limit with the noise intensity growth, we calculated the mean area of both adsorbate structures and vacancy structures (holes) and their number for different values of the noise intensity . The obtained results are shown in figures 9 a, b, respectively.
a) 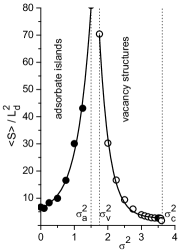 b)
b) 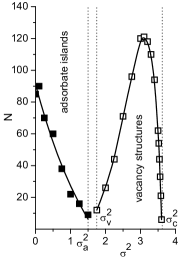
First, let us consider the case of small values of the noise intensity when separated adsorbate islands are realized (see curves with filled circles and with filled squares in figures 9 a, b, respectively). It follows that with the noise intensity growth, the mean area of the adsorbate island monotonously increases and their number drops. It means that fluctuations induce interactions between adsorbate islands, leading to the formation of elongated structures of adsorbate, i.e., transition to the labyrinthine-like pattern. Such type of the surface morphology can be observed if the fluctuation intensity lies in the interval . At , separated holes inside the adsorbate matrix are realized. Their mean area decreases with the noise intensity growth meaning the formation of spherical-shaped vacancy structures (see empty circles in figure 9 a). The number of vacancy islands grows with , attains maximal value and then drops to zero at (see empty squares in figure 9 b). A decrease in a number of of the vacancy structures relates with an increase in the stationary mean adsorbate concentration with the noise intensity growth (see dependence in figure 7 a).
We have just studied the influence of the intensity of external field fluctuations onto the dynamics of pattern formation at fixed system parameters. At the same time, according to the constructed model of nano-structured thin films growth during deposition in plasma-condensate systems, the intensity of fluctuations of the external (electrical) field is proportional to the mean value of this strength . Hence, in real experiment, an increase in the mean strength of the external field results in the growth of intensity of its fluctuations. The stability analysis provided in the previous section and the performed numerics show that an increase in both and inside domain B in figure 3 provides the formation of stable surface structures during deposition. The found noise induced morphological transformation of the surface pattern from separated adsorbate structures towards separated holes indicates that separated compact nano-dots are realized at values of both and near the top curve inside domain B (see left-hand panel in figure 3). Next, we fix and and focus our attention on studying the influence of the noise-over-signal ratio (NOSr) onto the change of the statistical properties of separated nano-dots by taking into account the functional dependence with (see dot curve in left-hand panel in figure 3 with and ).
First, we analyse the influence of the NOSr onto the dynamics of pattern formation and onto the order in spatial distribution of the coverage field in the plasma-condensate system studied. In figure 10 a we show typical quasi-stationary snapshots of the surface morphology at different values of the NOSr . It follows that in the case of the functional dependence of the intensity of fluctuations of the external flux on its strength , the morphology of the surface remains the same: separated adsorbate clusters. In figure 10 b we present the dependence of the time instant , indicating a start of formation of the islands on the ratio . It follows that compared to the deterministic case with , an increase in the NOSr leads to an extreme decrease of the time instant , meaning acceleration of the ordering processes. At large values of , time instant slightly decreases with the NOSr growth. A similar result was found at fixed by increasing the noise intensity (see figure 6). However, in that case such an acceleration was related to the fluctuations induced transformation of the surface morphology from separated adsorbate clusters towards separated holes inside the adsorbate matrix. In the actual case of functional dependence of the noise intensity on the mean value of anisotropy strength , the morphology of the surface remains the same (see figure 10 a). Hence, the acceleration of the ordering processes shown in figure 10 b is related to an increasing influence of both deterministic and stochastic parts of the external flux, caused by the electrical field presence near the substrate.
a)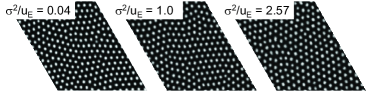
b)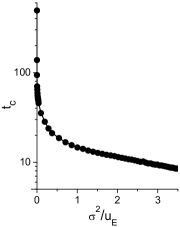 c)
c)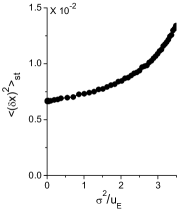
In figure 10 c we show the dependence of the stationary value of the order parameter on the NOSr . It follows that the order parameter continuously grows with increasing, meaning realization of a more ordered surface. Again, this effect is caused by a simultaneous influence of anisotropy strength and its fluctuations, rather than the morphological transformation of the growing surface discussed before (see figures 7 a, b).
One of the intriguing problems in the formation of separated islands (nucleation processes, grains and voids growth, etc.) is the growth law of the mean size of these structures. We have calculated the linear size of each adsorbate cluster assuming . The dynamics of the averaged linear size over all adsorbate structures for deterministic (empty squares) and stochastic (filled squares) systems is shown in figure 11. Here, time is counted from the corresponding value , which drops with ratio (see figure 10 b).
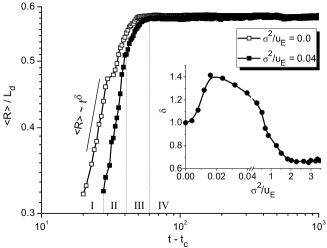
One can issue four different stages of the mean radius evolution (see curve with filled squares in figure 11). The first stage corresponds to the formation of adsorbate islands. At this stage, the concentration of adsorbate grows in time and interacting adatoms tend to organize separated adsorbate clusters. At the stage , the formed small separated adsorbate clusters start to grow (growth stage). When growing stage is finished, the coarsening stage starts (stage ). Finally, the quasi-stationary regime of the mean size evolution is realized (stage ). It follows that the growth stage is characterized by the power-law asymptotic with the growth exponent . The dependence of the growth exponent on the NOSr is shown in the inset in figure 11. It follows that the NOSr affects the growth exponent. In the pure deterministic system at , one gets a normal law of the linear size of adsorbate islands. An increase of the ratio provides an increase of the growth exponent up to meaning the acceleration of the linear size growth. With a further growth in , the growth exponent drops, attaining quasi-stationary value at (see inset in figure 11).
Next, let us discuss the influence of the external flux caused by the electrical field onto the mean size of separated adsorbate islands in the quasi-stationary regime. The corresponding results are shown in figure 12. Here, in figure 12 a we show the distribution of adsorbate islands over sizes at small () and large () values of the NOSr. Here, symbols correspond to the numerical data, which are fitted well by Lorenz distribution, shown by curves. It is seen that an increase in the ratio leads to the spreading of the distribution , meaning that adsorbate islands are characterized by different sizes. Moreover, the most probable value of the size of the adsorbate island, corresponding to the maximal value of the (shown by dash lines in figure 12 a), increases with the ratio growth. A detailed analysis of the influence of the ratio onto the mean size of adsorbate islands allows us to obtain the dependence , shown in figure 12 b. It is seen that with the growth of the NOSr, the quantity decreases, attains the minimal value at and then monotonously increases.
a)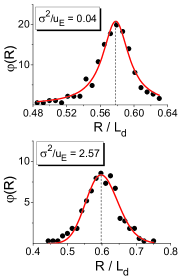 b)
b)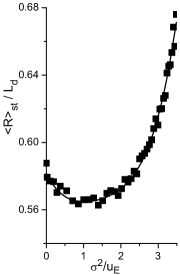
Hence, the combined influence of the deterministic and stochastic parts of the external flux at the regime of separated adsorbate islands formation controls the dynamics of the pattern formation, the ordering of the growing surface, the growth law of the mean size of adsorbate islands and its stationary value.
4 Discussions
The results presented correspond to pattern formation on the intermediate -th layer of the -layers system. According to the constructed model, the terrace width of the multi-layer pyramidal-like structure constructed from all separated structures is defined by the parameter , which for the actual case of computational grid linear size and fixed becomes in units of the grid. To define the value of the terrace width for each pyramidal-like multi-layer structure (see figure 1) in units of the computational grid cites, we proceed in the following way. According to the definition of the total area, occupied by adsorbate on the -th layer , for the corresponding total area on the precursor -th layer, one gets , with . This yields:
| (4.1) |
On the other hand, the linear size of each -th pyramidal-like structure decreases with the layer number growth by the terrace width : (see figure 1). Hence, the area of each -th structure on the -th layer is: . Taking a sum over all structures, one gets:
| (4.2) |
By solving equations (4.1,4.2) we get the terrace width for each pyramidal-like structure as a solution of the quadratic equation in the form:
| (4.3) |
Hence, by using the calculated area of each structure and total number of structures , we can get the size of the terrace width in units of the size of the computational grid and construct a multi-layer system of layers, where the linear size of each -th structure decreases by with the layer number growth. For the actual case of and from equation (4.3), we get . We take into account that the first layer is fully occupied by adsorbate and the highest layer is characterized by adsorbate structures with linear size, which equals the terrace width . Results for the constructed 3-dimensional -layer structures with the terrace width at different values of the anisotropy strength are shown in figure 13.
a)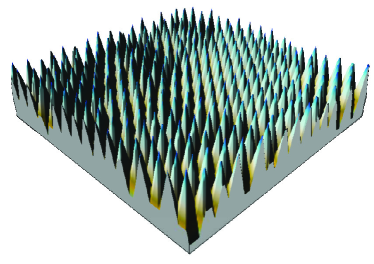 b)
b)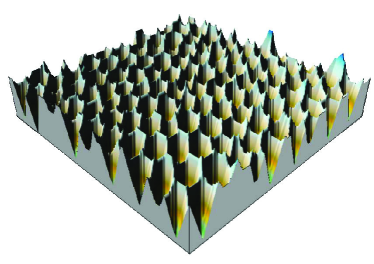
To provide the estimation of the obtained data for the linear size of the separated holes and adsorbate structures, we exploit the formula for the diffusion length and use the typical data for semiconductors (Ge/Si(100)): the activation energy of adatom formation eV; the activation energy for desorption eV, the activation energy for diffusion eV and the lattice oscillation frequency . By taking lattice constant m for Ge and adatoms interaction strength eV, for the actual values of the temperature inside the chamber K, one gets m. Hence, for the linear size of the unit cell, one gets nm and for the terrace width of each pyramidal structure, one gets nm which is in good agreement with the experimental results [45, 46, 47, 48]. Therefore, from the data for linear size of the spherically shaped adsorbate islands shown in figure 12 b, one has nm on the approximately half-height of the multi-layer system. These results correspond well with experimentally observed data for nano-structured thin films growth at condensation [54, 55, 56, 57].
5 Conclusions
In this article we have studied the combined influence of both deterministic and stochastic parts of the external flux onto the dynamics and statistical properties of pattern formation in plasma-condensate devices. By summarizing all obtained results, one can highlight the main conclusions.
1. Fluctuations of the strength of the external field induce first-order phase transition in a homogeneous system.
2. At fixed values of the mean intensity of the strength of electrical field near the substrate, the fluctuations of strength induce the ordering of the adsorbate on the substrate, leading to the formation of separated nano-sized adsorbate islands. An increase in the fluctuation intensity leads to: (i) a morphological transformation of the surface from separated adsorbate islands through the percolating structure of adsorbate towards separated nano-holes inside the adsorbate matrix; (ii) an acceleration of the ordering processes; (iii) an increase in the spatial order of the growing surface. Strong fluctuations stabilize the system resulting in homogenization of the coverage field.
3. In the case of correlations between the mean value of the strength of the electrical field and its fluctuation intensity in the regime of nano-dots formation, an increase in the noise-over-signal ratio results in acceleration of the pattern formation; provides the formation of well ordered patterns; leads to anomalous dynamics of the mean size of adsorbate islands. The stationary value of the mean adsorbate islands can be minimized with variation in the noise-over-signal ratio and varies in the interval nm for the prototype systems: semiconductor on silicate.
The derived effective one-layer model can be used to modelize nano-structured thin films growth at deposition in 3-dimensional space with the formation of separated cone-like adsorbate structures and smooth multi-layer holes inside the adsorbate matrix.
The results obtained within this work extend the existing knowledge about controlling the dynamics of pattern formation and statistical properties of surface structures and show a constructive role of the external fluctuations, which is capable of controlling the patterning and the scaling behaviour of the system.
We expect that our non-trivial findings will stimulate further theoretical and experimental studies in the field of nano-structured thin film growth in plasma-condensate devices.
Acknowledgements
Support of this research by the Ministry of Education and Science of Ukraine, project No. 0117U003927, is gratefully acknowledged.
References
- [1] Cross M.C., Hohenberg P.C., Rev. Mod. Phys., 1993, 65, 851, doi:10.1103/RevModPhys.65.851.
- [2] Sharma A., Khanna R., Phys. Rev. Lett., 1998, 81, 3463, doi:10.1103/PhysRevLett.81.3463.
- [3] Hansen J.L., van Hecke M., Haaning A., Ellegaard C., Andersen K.H., Bohr T., Sams T., Nature, 2001, 410, 324, doi:10.1038/35066631.
- [4] Elbelrhiti H., Claudin P., Andreotti B., Nature, 2005, 437, 720, doi:10.1038/nature04058.
- [5] Langer J.S., Rev. Mod. Phys., 1980, 52, 1, doi:10.1103/RevModPhys.52.1.
-
[6]
Onorato M., Osborne A.R., Serio M., Bertone S., Phys. Rev. Lett., 2001, 86, 5831,
doi:10.1103/PhysRevLett.86.5831. - [7] Treiber M., Kramer L., Phys. Rev. E, 1994, 49, 3184, doi:10.1103/PhysRevE.49.3184.
- [8] Jung P., Mayer-Kress G., Phys. Rev. Lett., 1995, 74, 2130, doi:10.1103/PhysRevLett.74.2130.
- [9] Wang J., Kadar S., Jung P., Showalter K., Phys. Rev. Lett., 1999, 82, 855, doi:10.1103/PhysRevLett.82.855.
- [10] Hou Z., Xin H., Phys. Rev. Lett., 2002, 89, 280601, doi:10.1103/PhysRevLett.89.280601.
-
[11]
Hempel H., Schimansky-Geier L., García-Ojalvo J., Phys. Rev. Lett., 1999, 82, 3713,
doi:10.1103/PhysRevLett.82.3713. -
[12]
Biancalani T., Dyson L., McKane A.J., Phys. Rev. Lett., 2014, 112, 038101,
doi:10.1103/PhysRevLett.112.038101. - [13] Weiss T., Kronwald A., Marquardt F., New J. Phys., 2016, 18, 1, doi:10.1088/1367-2630/18/1/013043.
-
[14]
Kharchenko D.O., Kharchenko V.O., Lysenko I.O., Physica Scripta, 2011, 83, 045802,
doi:10.1088/0031-8949/83/04/045802. - [15] Horsthemke W., Lefever R., Noise-Induced Transitions, Springer-Verlag, Berlin, 1984.
- [16] Garcia-Ojalvo J., Sancho J.M., Noise in Spatially Extended System, Springer-Verlag, New York, 1999.
-
[17]
Van den Broeck C., Parrondo J.M.R., Toral R., Phys. Rev. Lett., 1994, 73, 3395,
doi:10.1103/PhysRevLett.73.3395. -
[18]
Van den Broeck C., Parrondo J.M.R., Toral R., Kawai R., Phys. Rev. E, 1997, 55, 4084,
doi:10.1103/PhysRevE.55.4084. - [19] Elder K.R., Grant M., Phys. Rev. E., 2004, 70, 051605, doi:10.1103/PhysRevE.70.051605.
- [20] Kharchenko D., Lysenko I., Kharchenko V., Physica A, 2010, 389, 3356, doi:10.1016/j.physa.2010.04.027.
-
[21]
Garcia-Ojalvo J., Hernandez-Machado A., Sancho J.M., Phys. Rev. Lett., 1993, 71, 1542,
doi:10.1103/PhysRevLett.71.1542. - [22] Becker A., Kramer L., Phys. Rev. Lett., 1994, 73, 955, doi:10.1103/PhysRevLett.73.955.
-
[23]
Parrondo J.M.R., Van den Broeck C., Buceta J., De la Rubia F.J., Physica A, 1996, 224, 153,
doi:10.1016/0378-4371(95)00350-9. - [24] Zaikin A.A., Schimansky-Geier L., Phys. Rev. E, 1998, 58, 4355, doi:10.1103/PhysRevE.58.4355.
-
[25]
Castets V.V., Dulos E., Boissonade J., de Kepper P., Phys. Rev. Lett., 1990, 64, 2953,
doi:10.1103/PhysRevLett.64.2953. - [26] Nicolis G., Prigogine I., Self-Organization in Nonequilibrium Systems, Wiley, New York, 1977.
- [27] Kuramoto Y., Chemical Oscillations, Waves and Turbulence, Springer, Berlin, 1984.
- [28] Epstein I., Pojman J., An Introduction to Nonlinear Chemical Dynamics, Oxford University press, Oxford, 1998.
- [29] Kharchenko V.O., Kharchenko D.O., Kokhan S.V., Vernyhora I.V., Yanovsky V.V., Phys. Scr., 2012, 86, 055401, doi:10.1088/0031-8949/86/05/055401.
- [30] Hildebrand M., Mikhailov A.S., Ertl G., Phys. Rev. Lett., 1998, 81, 2602, doi:10.1103/PhysRevLett.81.2602.
- [31] Hildebrand M., Mikhailov A.S., Ertl G., Phys. Rev. E, 1998, 58, 5483, doi:10.1103/PhysRevE.58.5483.
- [32] Kharchenko V.O., Kharchenko D.O., Phys. Rev. E, 2012, 86, 041143, doi:10.1103/PhysRevE.86.041143.
- [33] Casal S.B., Wio H.S., Mangioni S., Physica A, 2002, 311, 443, doi:10.1016/S0378-4371(02)00828-2.
-
[34]
Kharchenko V.O., Kharchenko D.O., Yanovsky V.V., Nanoscale Res. Lett., 2017, 12, 337,
doi:10.1186/s11671-017-2096-7. - [35] Kharchenko V.O., Kharchenko D.O., Surf. Sci., 2015, 637–638, 90, doi:10.1016/j.susc.2015.03.025.
- [36] Walgraef D., Physica E, 2003, 18, 393, doi:10.1016/S1386-9477(02)01104-9.
- [37] Walgraef D., Int. J. Quant. Chem., 2004, 98, 248, doi:10.1002/qua.10877.
-
[38]
Kharchenko V.O., Kharchenko D.O., Dvornichenko A.V., Surface Science, 2014, 630, 158,
doi:10.1016/j.susc.2014.08.008. -
[39]
Mishin Y., Farkas D., Mehl M.J., Papaconstantopoulos D.A., Phys. Rev. B, 1999, 59, 3393,
doi:10.1103/PhysRevB.59.3393. - [40] Dvornichenko A.V., Kharchenko D.O., Lysenko I.O., Kharchenko V.O., J. Cryst. Growth, 2019, 514, 1, doi:10.1016/j.jcrysgro.2019.02.048.
- [41] Wei S., Ma H.C., Chen J.Q., Guo J.D., J. Alloys Compd., 2016, 687, 999, doi:10.1016/j.jallcom.2016.06.253.
-
[42]
Oh Y.-H., Kim S.-I., Kim M., Lee S.-Y., Kim Y-W., Ultramicroscopy, 2017, 181, 160,
doi:10.1016/j.ultramic.2017.05.018. -
[43]
Perekrestov V.I., Olemskoi A.I., Kosminska Yu.O., Mokrenko A.A., Phys. Lett. A, 2009, 373, 3386,
doi:10.1016/j.physleta.2009.07.032. -
[44]
Kosminska Y.A., Mokrenko A.A., Perekrestov V.I., Tech. Phys. Lett., 2011, 37, 538,
doi:10.1134/S1063785011060083. - [45] Miccio L.A., Setvin M., Müller M., Abadía M., Piquero I., Lobo-Checa J., Schiller F., Rogero C., Schmid M., Sánchez-Portal D., Diebold U., Ortega J.I., Nano Lett., 2016, 16, 2017, doi:10.1021/acs.nanolett.5b05286.
-
[46]
Ortega J., Corso M., Abd El-Fattah Z., Goiri E.A., Schiller F., Phys. Rev. B, 2011, 83, 085411,
doi:10.1103/PhysRevB.83.085411. -
[47]
Neel N., Maroutian T., Douillard L., Ernst H-J., Phys. Rev. Lett., 2003, 91, 226103,
doi:10.1103/PhysRevLett.91.226103. -
[48]
Czubanowski M., Schuster A., Akbari S., Pfnür H., Tegenkamp C., New J. Phys., 2007, 9, 338,
doi:10.1088/1367-2630/9/9/338. - [49] Van Kampen N.G., Stochastic Processes in Physics and Chemistry, North–Holland, Amsterdam, 1992.
-
[50]
Kharchenko V.O., Dvornichenko A.V., Borysiuk V.N., Eur. Phys. J. B, 2018, 91, 93,
doi:10.1140/epjb/e2018-80730-8. -
[51]
Sancho J.M., San Miguel M., Katz S.L., Gunton J.D., Phys. Rev. A, 1982, 26, 1589,
doi:10.1103/PhysRevA.26.1589. - [52] Box G.E.P., Muller M.E., Ann. Math. Stat., 1958, 29, 610, doi:10.1214/aoms/1177706645.
- [53] Kharchenko V.O., Dvornichenko A.V., Eur. Phys. J. B, 2019, 92, 57, doi:10.1140/epjb/e2019-90588-9.
- [54] Leonhardt D., Han S.M., Surface Science, 2009, 603, 2624, doi:10.1016/j.susc.2009.06.015.
-
[55]
Hunter K.I., Held J.T., Mkhoyan K.A., Kortshagen U.R., ACS Appl. Mater. Interfaces, 2017, 9, 8263,
doi:10.1021/acsami.6b16170. -
[56]
Perekrestov V.I., Kosminska Yu.O., Kornyushchenko A.S., Latyshev V.M., Physica B, 2013, 411, 140,
doi:10.1016/j.physb.2012.11.036. -
[57]
Kornyushchenko A.S., Natalich V.V., Perekrestov V.I., J. Cryst. Growth, 2016, 442, 68,
doi:10.1016/j.jcrysgro.2016.02.033.
Ukrainian \adddialect\l@ukrainian0 \l@ukrainian
Iíäóêîâàíi øóìîì åôåêòè ó ïðîöåñàõ ðîñòó íàíîñòðóêòóðîâàíèõ òîíêèõ ïëiâîê ïðè îñàäæåííi â ñèñòåìàõ ïëàçìà-êîíäåíñàòÂ.Î. Õàðчåíêî, À.Â. Äâîðíèчåíêî, Ä.Î. Õàðчåíêî
Iíñòèòóò ïðèêëàäíî¿ ôiçèêè ÍÀÍ Óêðà¿íè, âóë. Ïåòðîïàâëiâñüêà 58, 40000 Ñóìè, Óêðà¿íà
Ñóìñüêèé äåðæàâíèé óíiâåðñèòåò, âóë. Ðèìñüêîãî-Êîðñàêîâà 2, 40007 Ñóìè, Óêðà¿íà