Frequency fluctuations in nanomechanical silicon nitride string resonators
Abstract
High quality factor () nanomechanical resonators have received a lot of attention for sensor applications with unprecedented sensitivity. Despite the large interest, few investigations into the frequency stability of high- resonators have been reported. Such resonators are characterized by a linewidth significantly smaller than typically employed measurement bandwidths, which is the opposite regime to what is normally considered for sensors. Here, the frequency stability of high- silicon nitride string resonators is investigated both in open-loop and closed-loop configurations. The stability is here characterized using the Allan deviation. For open-loop tracking, it is found that the Allan deviation gets separated into two regimes, one limited by the thermomechanical noise of the resonator and the other by the detection noise of the optical transduction system. The point of transition between the two regimes is the resonator response time, which can be shown to have a linear dependence on . Laser power fluctuations from the optical readout is found to present a fundamental limit to the frequency stability. Finally, for closed-loop measurements, the response time is shown to no longer be intrinsically limited but instead given by the bandwidth of the closed-loop tracking system. Computed Allan deviations based on theory are given as well and found to agree well with the measurements. These results are of importance for the understanding of fundamental limitations of high- resonators and their application as high performance sensors.
I Introduction
As the size of a mechanical resonator is minimized, the responsivity towards changes in the resonator environment is increased Schmid et al. (2016); Ekinci and Roukes (2005). This has led to a tremendous amount of research in the field of nanomechanical resonators, with devices being employed to detect mass Ekinci et al. (2004a); Naik et al. (2009); Chaste et al. (2012), force Kozinsky et al. (2006); Moser et al. (2013), and temperature Pandey et al. (2010); Larsen et al. (2011); Zhang et al. (2013); Piller et al. (2019). Most studies have employed changes in the resonance frequency as the detection principle.
For sensing applications, the minimum detectable frequency shift is determined by the precision of the resonance frequency measurement scheme. Quantifying any noise that presents a limit to the frequency stability of a resonator is thus crucial when designing sensors. Various intrinsic noise sources influence the stability of a device, including thermomechanical noise Ekinci et al. (2004b), adsorption-desorption noise Vig and Yoonkee Kim (1999), defect motion Cleland and Roukes (2002), surface diffusion Atalaya et al. (2011), and damping fluctuations Maillet et al. (2018). If the underlying limiting noise source is white, the average relative frequency noise can be quantified by Ekinci et al. (2004b); Robins (1984)
| (1) |
where is the quality factor and SNR is the signal-to-noise ratio (ratio of the maximum driven signal to the noise floor). From equation 1, it is apparent that minimizing the system noise results in optimal frequency stability. This would imply that thermomechanical noise, arising from a coupling between the resonator and a thermal bath of randomly distributed phonons, presents an intrinsic limit to the frequency stability in the regime where it can be resolved Albrecht et al. (1991); Cleland (2005); Gavartin et al. (2013).
An important factor when measuring the displacement of a nanomechanical resonator is the relation between the resolution bandwidth (BW) of the readout electronics, typically on the order of kHz, and the resonance linewidth () of the resonator. Most fundamental studies thus far have operated in the regime where Sansa et al. (2016). For high- resonators, s on the order of 1 Hz are routinely achieved and can even be on the order of a few mHz Tsaturyan et al. (2017); Ghadimi et al. (2018). Various studies have been published investigating the frequency stability of high- resonators with different conclusions. Fong et al. investigated the frequency and phase noise of high- silicon nitride resonators, and found that frequency fluctuations were a result of defect motion with a broad distribution of relaxation times Fong et al. (2012). Furthermore, it was concluded that increasing results in an increased susceptibility to the intrinsic frequency fluctuations in the sample. Roy et al. reported enhanced frequency stability in resonators made from silicon, when is lowered as the SNR is increased, operating at the onset of Duffing nonlinearity in a thermomechanically limited regime Roy et al. (2018). This was attributed to a flattening of the phase noise spectrum at low frequencies. A thorough theoretical investigation of the same scenario by Demir et al. however found no -dependence of the frequency stability Demir and Hanay (2020).
In this report, we investigate the frequency stability of high- nanomechanical string resonators made from silicon nitride (SiN). Such resonators routinely achieve large s as a result of the dissipation dilution effect Verbridge et al. (2006); Schmid et al. (2011); Unterreithmeier et al. (2010). All measurements are performed in the thermomechanically resolved regime and BWs on the order of a kHz are chosen similar to previous investigations. In the first part, open-loop tracking of the frequency is performed using the phase of the resonator and the Allan deviation is employed to quantify the frequency noise. As a result of the setup with , both thermomechanical noise and detection noise of the measurement system are captured in the Allan deviation. The two regimes are separated at the integration time , which is the response time of the resonator.
We find that for lower vibrational amplitudes, the resonator is always thermomechanically limited. At larger amplitudes, however, the laser power fluctuations of the optical readout presents a lower limit to the frequency stability. A systematic reduction of results in faster response times, but the lower limit from the laser remains regardless of the . Finally, closed-loop measurements are performed, where it can be shown that can be increased through variation of the loop bandwidth. All Allan deviation measurements are corroborated by computations based on a theoretical model Demir and Hanay (2020) and good agreement is observed both for open-loop and closed-loop.
II Methods
II.1 Measurement setup
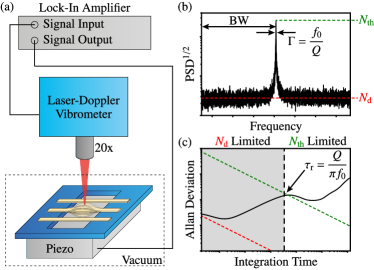
The fabrication process of the nanomechanical string resonators is provided elsewhere Schmid et al. (2010). A schematic of the measurement setup is given in Fig. 1(a). Resonators are actuated using a piezo (NAC2003 from CTS Corporation or a custom-sized plate of piezo ceramic type PIC252 from PI Ceramic GmbH) and the out-of-plane motion detected using a laser-Doppler vibrometer (MSA-500 from Polytec GmbH) equipped with a helium-neon laser ( nm). All measurements are performed in a vacuum chamber at various pressures, controlled using a needle valve (8LVM-10KF-VV-A from VACOM). The analog signal of the vibrometer is sent to a lock-in amplifier (HF2LI from Zurich Instruments) equipped with a phase-locked loop (PLL), where the frequency stability is investigated.
II.2 Allan deviation
In this report, the frequency stability is quantified through the Allan deviation, defined as Allan (1966):
| (2) |
where is the number of samples of the resonance frequency , each averaged over an integration time . Measurements of the frequency fluctuations are made either in an open-loop or closed-loop configuration. For open-loop measurements, the sample is actuated at the resonance frequency and the phase is recorded for a certain amount of time. Conversion from phase to frequency is then made using the phase response of the resonator. In the linear driving regime, the phase shift caused by a frequency shift close to resonance is given as Schmid et al. (2016). s of the resonators are measured using the ring-down method. In the closed-loop configuration, the PLL of the lock-in amplifier is employed to track the frequency directly. Various harmonics appearing in the recorded signals, either from the mains supply (100 Hz), turbomolecular pump (1500 Hz), and aliasing (2000 Hz), are filtered out during post-processing.
Theory based Allan deviation curves are generated by first computing the spectrum of fractional frequency fluctuations, , using experimental data for , , thermomechanical and detection noise levels, driven vibrational amplitude of the resonator and the demodulation filter characteristics of the lock-in amplifier, in conjunction with a theoretical model Demir and Hanay (2020). Then, the Allan variance (the Allan deviation squared) can be estimated through numerical evaluation of the following integral:
| (3) |
II.3 Sources of noise
An exemplary scan of the noise of a resonator over a region of size twice the BW is shown in Fig. 1(b). From this plot, the two noise sources can be defined: (1) Thermomechanical noise from the resonator, , and (2) background, or detection, noise, . How these noise sources manifest themselves in the Allan deviation can be seen in Fig. 1(c). For this purpose, we define the resonator response time, or time constant, . For integration times , is mainly limited by thermomechanical noise (white-shaded region in Fig. 1(c)). At larger , however, thermal drift typically increases . When , falls continuously until limited by background noise of the system (grey-shaded region in Fig. 1(c)).
The investigated string sample is of length , width , thickness nm, tensile stress GPa, and on the order of at high vacuum. Only the fundamental out-of-plane mode is considered, which has a resonance frequency kHz. The BW was set to 3598 Hz and the sampling rate to 28784 Sa/s. The SNR is controlled through variation of the vibrometer laser power , which decreases detection noise for increasing , and the piezo driving voltage , which increases the vibrational amplitude, or signal, for larger . For the integral given in equation 3, the white noise asymptote for the Allan deviation can be shown to be Demir and Hanay (2020):
| (4) |
Here, is the noise level, defined as the square root of the one-sided noise spectral density (in units of ) resulting from thermomechanical () or detection () noise and is the peak driven amplitude (in X). X represents units of voltage, displacement, etc. In the case of thermomechanically limited noise, the noise level (in ) is analytically defined as Schmid et al. (2016):
| (5) |
where is the Boltzmann constant, is the temperature, and is the effective mass of the resonator. Calculations of the Allan deviation based on equation 4 are shown in Fig. 1(c) as well.
III Results and Discussion
III.1 Influence of signal-to-noise ratio in open-loop configuration
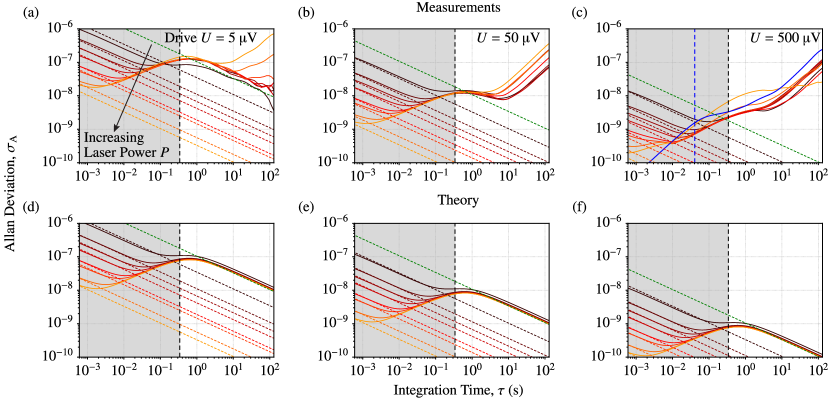
First, the influence of SNR on the Allan deviation is studied. On the one hand, the detection noise level is controlled by tuning the laser power of the optical readout. On the other hand, the vibrational amplitude, the signal, of the nanomechanical string is controlled via the piezo driving voltage. Fig. 2 presents measured and theory-based ’s for various SNRs. The vibrational amplitudes measured in the electrical domain are converted from volts to metres using the decoders of the vibrometer, and used in theory-based computations of the Allan deviation. In addition, values calculated using equation 4 are presented as well both for detection noise limits (red-colored dashed lines) and the thermomechanical limit (green dashed line). The vertical dashed lines highlight s. These measurements are performed under a high vacuum ( mbar) in order to keep the maximized. In each individual plot, is kept fixed, while is varied from 1.5 to 270 .
Fig. 2(a)-(c) shows measured curves for the cases of V, , and . For the first case, , the resonator is well in the linear regime. The laser power can be observed to decrease in the case of , which is the regime limited by detection noise, while the thermomechanically limited regime () displays no reduction. This is to be expected, as only the detection noise gets altered by the laser power. Thermal drifts appear to play a larger role for higher laser powers, which will be discussed further below.
Upon increasing the actuation voltage to V, an order of magnitude reduction of is observed, indicating that the sample is still in the linear regime. Finally, in the case of , the decrease in is no longer linear in the regime. In this case, the Allan deviation is no longer thermomechanically limited and appears to deteriorate with increasing laser power. Since the sample was still driven in the linear regime, Duffing nonlinearity can be ruled out as a limit to frequency stability in our measurements. Instead, the limit is attributed to laser power fluctuations resulting from the optical readout.
An additional measurement (blue curve) representing the frequency noise resulting from laser power fluctuations is plotted in Fig. 2(c). This curve is generated by first measuring the laser power over time with similar demodulation settings as for the other curves. The particular measurement shown in Fig. 2(c) was for a laser power . Then, the laser power fluctuations, , can be converted to frequency fluctuations using the relative thermal responsivity, , of the string using the relation: . Based on the shift of the resonance frequency versus laser power, a -1 can be extracted. The frequency response of the resonator to laser power noise is based on the photothermal heating Larsen et al. (2013), and the string resonator acts as a low-pass filter with a time constant equal to the thermal time constant . Hence, during post-processing, the raw frequency fluctuations data is low-pass filtered with a pass frequency . The thermal time constant was measured at high vacuum in a similar way as described by Piller et al. Piller et al. (2020). A blue vertical dashed line in Fig. 2(c) shows for clarity. The blue Allan deviation curve due to laser noise explains the increasing slopes for longer ’s well. The slight offset can be attributed to sample or laser aging due to the fact that the laser noise was measured two years after the Allan deviation data was measured. These findings strongly support that laser power fluctuations cause the limit in Allan deviation observed in this study.
Theory based computations corresponding to the measured data presented above can be seen in Figs. 2(d)-(f) Demir and Hanay (2020). The effect of reducing detection noise is well reproduced by the theory. Since laser power fluctuations are not captured in the model, thermal drift effects cannot be observed in the computed curves. Hence, in the case of , the frequency stability for is still thermomechanically limited for the model.
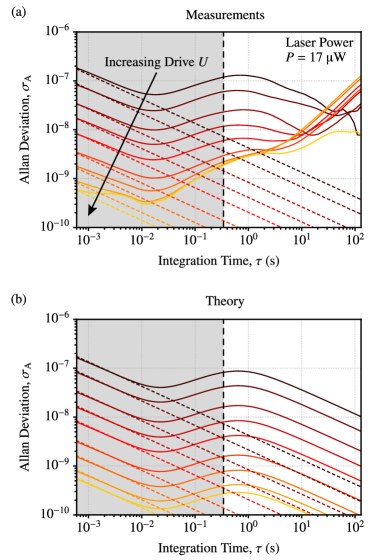
The effect of varying piezo drive from to for a fixed laser power can be seen in Fig. 3(a). In this case, is improved for all -values, since the noise remains unchanged, while the driven signal increases. Initially, a linear dependence on driving amplitude is observed, but for larger values of , reaches a limit in the thermomechanical regime and does not reduce further with increasing . This hard limit again is attributed to the laser power fluctuations as observed in Fig. 2(c). Computed Allan deviation curves based on theory are given in Fig. 3(b), displaying good agreement for lower -values, but deviate for larger values due to the fact that the model does not incorporate laser power fluctuations.
From the data presented in Fig. 2 and Fig. 3, some comments can be made on the Allan deviation in open-loop configuration. In general, thermomechanical noise presents a fundamental limit to the frequency stability of nanomechanical resonators. Even though the Allan deviation for is limited by detection noise, possibly below the thermomechanical limit, this does not represent the actual performance limit of the resonant sensor. The resonator itself acts as a filter on the phase response and thus is reduced as a result for . However, the resonator phase can not respond to resonance frequency shifts at those short time scales Demir and Hanay (2020). Finally, the limit of appearing for larger drive amplitudes is argued to be a result of the optical readout, as discussed in Fig. 2(c).
III.2 Influence of quality factor in open-loop configuration
The next step is to investigate the influence of the quality factor on the frequency stability of the resonators in open-loop configuration. Using a needle valve, the pressure in the vacuum chamber is increased from mbar up to 20 mbar, which reduces the quality factor due to gas damping Verbridge et al. (2008). Measured and simulated curves for various pressures are shown in Fig. 4. Each curve is recorded for a fixed laser power and varying drive amplitudes. As a result of large drifts in the power of the laser over time, a laser power W was used for the data at mbar, while the maximum available was employed at all other pressures, in order to ensure that the thermomechanical noise could be resolved. On each measured plot, the pressure at which the measurement was recorded is given, along with the linewidth of the resonance.
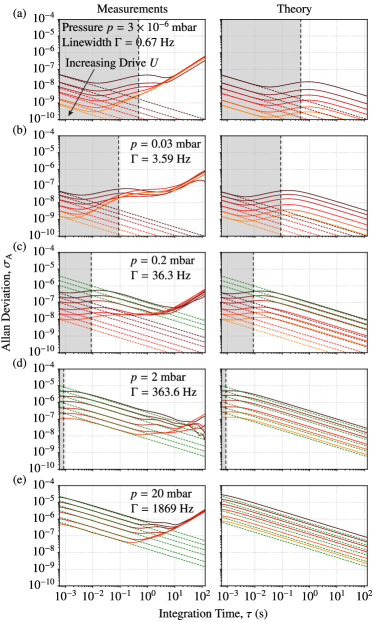
Experimental ’s are shown in the left column of Figs. 4(a)-(e), while theoretical curves are shown in the right column. A clear shift in the transition region between thermomechanical and detection noise limits to lower integration times can be observed. The point of transition consistently lies around and a linear dependence on is found for this transition time, as is expected from the definition of . Furthermore, as approaches the BW, the frequency stability is thermomechanically limited for all (neglecting thermal drift). These findings indicate that the response time of a resonator is fundamentally limited by the in open-loop configuration. Similar response times can be found by investigating the transient response of the phase in open-loop, as presented in Supplementary Fig. S1. For the measured data shown in Figs. 4(a)-(e), again is limited for long integration times due to laser power fluctuations as discussed above.
III.3 Closed-loop tracking
Investigation into the limits of frequency stability and response time for closed-loop tracking have also been performed. For these experiments, a PLL is employed to track the frequency. For the lock-in amplifier used here, an additional BW, i.e. the PLL loop bandwidth Demir and Hanay (2020), needs to be set, which is called the target BW (from here on called TBW in order to distinguish it from the filter BW). This is the bandwidth for the entire closed-loop system, and typically smaller than the BW of the filter in the demodulator. TBW can be set to a desired value by choosing the controller parameters appropriately Demir and Hanay (2020). The effect of varying TBW from 0.25 Hz to 719.6 Hz on is shown based on measurements and theory in Figs. 5(a) and (b), respectively. Similar to the open-loop measurements, a demodulator filter BW of 3598 Hz is chosen, while the sampling rate is set to 28784 Sa/s. A curve recorded in open-loop is shown as well for comparison. In addition, calculations using equation 4 are given both for thermomechanical and detection noise limits.
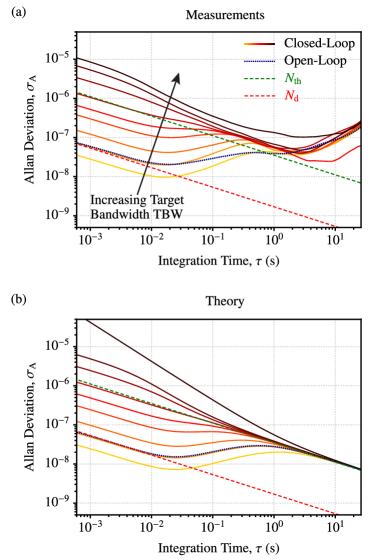
From the closed-loop data, it can be observed that the closed-loop response time is determined by the TBW of the system instead of the intrinsic response time of the resonator, as opposed to the open-loop measurements. As the TBW is increased, the point of transition between thermomechanical and detection noise shifts to lower -values. An additional effect of the PLL is the change in detection noise for different TBWs, e.g. for the smallest TBW satisfying , the detection noise limit is even lower than the one in the open-loop case. With , the filtering provided by the loop, in addition to the filtering by the intrinsic response of the resonator and the demodulator filter, reduces the of the system. However, in this case, the response time of the system is even slower than the intrinsic of the resonator.
Similar to the open-loop Allan deviations, the smaller values for less than the system response time are merely resulting from the chosen bandwidths for the system relative to the linewidth of the resonator. As evident from the data in Fig. 5, remains thermomechanically limited for larger , regardless of the TBW. If frequency shifts are happening at faster time scales in the detection noise limited regime, the loop will not be able to respond as fast. By increasing the TBW beyond and much further, the system will be able to follow faster changes, but at the expense of increased noise.
IV Conclusion
We have presented experimental and theoretical results for the limitations in frequency stability of high- nanomechanical SiN resonators both in open-loop and closed-loop configurations. Through open-loop tracking of the resonator frequency, it was found that the Allan deviation gets separated into two regimes, one limited by thermomechanical noise of the resonator and the other by detection noise of the optical transduction scheme. These regimes could be clearly observed and quantified through variation of both the detection noise floor and the vibrational amplitude. The point of transition between the regimes could be characterized as the response time, , of the resonator in the open-loop case. Through variation of , a linear dependence of on could be observed. Furthermore, for the open-loop measurements, laser power fluctuations resulting from the optical readout presented a lower limit to the Allan deviation at higher integration times. Finally, closed-loop tracking was investigated experimentally and theoretically, and it was shown that the closed-loop scheme can be tailored to offer a faster response at the expense of increased noise, when compared to the intrinsic limits of open-loop tracking. Computed Allan deviations based on a theoretical model for both open-loop and closed-loop showed good agreement with measurements. The findings presented here show the limitations of open-loop measurements of the frequency fluctuations and that the method is inadequate for assessing the frequency stability of high- resonators. Given that the presented results are not limited to SiN strings but applicable to all types of high- resonators, they are of interest for future designs of nanomechanical sensors and fundamental investigations into the ultimate frequency fluctuation limits of such resonators in general.
Acknowledgements.
The authors would like to thank Miao-Hsuan Chien and Markus Piller for many helpful discussions. This work is supported by the European Research Council under the European Unions Horizon 2020 research and innovation program (Grant Agreement-716087-PLASMECS).Appendix A Transient response of phase
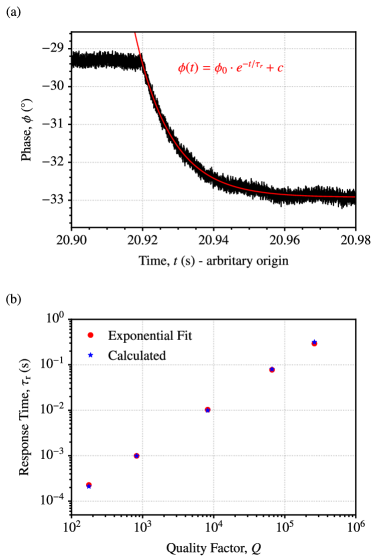
The -dependence of observed in Fig. 4, indirectly through , can also be quantified directly through the response of the phase to external stimuli, be it mass, force, or temperature. In fact, not only the amplitude, but also the phase of a resonator responds to stimuli with a response time determined by the intrinsic resonator time constant Demir and Hanay (2020); Olcum et al. (2015). This response can be measured experimentally in open-loop configuration by varying the piezo drive frequency and seeing how fast the phase responds, as is shown in Fig. S1 for various -values. The response time was extracted by fitting an exponential decay to the phase data of the type . By varying the piezo drive frequency within the linear phase regime, a step response could be recorded with an example given in Fig. S1(a) along with an exponential fit. Fig. S1(b) shows measured versus and the results are compared to values calculated using . Good agreement can be observed, showing that the phase has a transient response in open-loop with a -dependent response time .
References
- Schmid et al. (2016) S. Schmid, L. G. Villanueva, and M. L. Roukes, Fundamentals of nanomechanical resonators, 1st ed. (Springer International Edition, 2016).
- Ekinci and Roukes (2005) K. L. Ekinci and M. L. Roukes, “Nanoelectromechanical systems,” Review of Scientific Instruments 76, 061101 (2005).
- Ekinci et al. (2004a) K. L. Ekinci, X. M. H. Huang, and M. L. Roukes, “Ultrasensitive nanoelectromechanical mass detection,” Applied Physics Letters 84, 4469–4471 (2004a).
- Naik et al. (2009) A. K. Naik, M. S. Hanay, W. K. Hiebert, X. L. Feng, and M. L. Roukes, “Towards single-molecule nanomechanical mass spectrometry,” Nature Nanotechnology 4, 445–450 (2009).
- Chaste et al. (2012) J. Chaste, A. Eichler, J. Moser, G. Ceballos, R. Rurali, and A. Bachtold, “A nanomechanical mass sensor with yoctogram resolution,” Nature Nanotechnology 7, 301–304 (2012).
- Kozinsky et al. (2006) I. Kozinsky, H. W. C. Postma, I. Bargatin, and M. L. Roukes, “Tuning nonlinearity, dynamic range, and frequency of nanomechanical resonators,” Applied Physics Letters 88, 253101 (2006).
- Moser et al. (2013) J. Moser, J. Güttinger, A. Eichler, M. J. Esplandiu, D. E. Liu, M. I. Dykman, and A. Bachtold, “Ultrasensitive force detection with a nanotube mechanical resonator,” Nature Nanotechnology 8, 493–496 (2013).
- Pandey et al. (2010) A. K. Pandey, O. Gottlieb, O. Shtempluck, and E. Buks, “Performance of an AuPd micromechanical resonator as a temperature sensor,” Applied Physics Letters 96, 203105 (2010).
- Larsen et al. (2011) T. Larsen, S. Schmid, L. Grönberg, A. O. Niskanen, J. Hassel, S. Dohn, and A. Boisen, “Ultrasensitive string-based temperature sensors,” Applied Physics Letters 98, 121901 (2011).
- Zhang et al. (2013) X. C. Zhang, E. B. Myers, J. E. Sader, and M. L. Roukes, “Nanomechanical torsional resonators for frequency-shift infrared thermal sensing,” Nano Letters 13, 1528–1534 (2013).
- Piller et al. (2019) M. Piller, N. Luhmann, M.-H. Chien, and S. Schmid, “Nanoelectromechanical infrared detector,” in Optical Sensing, Imaging, and Photon Counting: From X-Rays to THz 2019, Vol. 11088, edited by O. Mitrofanov, International Society for Optics and Photonics (SPIE, 2019) pp. 9 – 15.
- Ekinci et al. (2004b) K. L. Ekinci, Y. T. Yang, and M. L. Roukes, “Ultimate limits to inertial mass sensing based upon nanoelectromechanical systems,” Journal of Applied Physics 95, 2682–2689 (2004b).
- Vig and Yoonkee Kim (1999) J. R. Vig and Yoonkee Kim, “Noise in microelectromechanical system resonators,” IEEE Transactions on Ultrasonics, Ferroelectrics, and Frequency Control 46, 1558–1565 (1999).
- Cleland and Roukes (2002) A. N. Cleland and M. L. Roukes, “Noise processes in nanomechanical resonators,” Journal of Applied Physics 92, 2758–2769 (2002).
- Atalaya et al. (2011) J. Atalaya, A. Isacsson, and M. I. Dykman, “Diffusion-induced dephasing in nanomechanical resonators,” Physical Review B 83, 045419 (2011).
- Maillet et al. (2018) O. Maillet, X. Zhou, R. R. Gazizulin, R. Ilic, J. M. Parpia, O. Bourgeois, A. D. Fefferman, and E. Collin, “Measuring frequency fluctuations in nonlinear nanomechanical resonators,” ACS Nano 12, 5753–5760 (2018).
- Robins (1984) W. Robins, Phase noise in signal sources: theory and applications, Vol. 9 (IET, 1984).
- Albrecht et al. (1991) T. R. Albrecht, P. Grütter, D. Horne, and D. Rugar, “Frequency modulation detection using high‐ cantilevers for enhanced force microscope sensitivity,” Journal of Applied Physics 69, 668–673 (1991).
- Cleland (2005) A. N. Cleland, “Thermomechanical noise limits on parametric sensing with nanomechanical resonators,” New Journal of Physics 7, 235–235 (2005).
- Gavartin et al. (2013) E. Gavartin, P. Verlot, and T. J. Kippenberg, “Stabilization of a linear nanomechanical oscillator to its thermodynamic limit,” Nature Communications 4, 2860 (2013).
- Sansa et al. (2016) M. Sansa, E. Sage, E. C. Bullard, M. Gély, T. Alava, E. Colinet, A. K. Naik, L. G. Villanueva, L. Duraffourg, M. L. Roukes, G. Jourdan, and S. Hentz, “Frequency fluctuations in silicon nanoresonators,” Nature Nanotechnology 11, 552–558 (2016).
- Tsaturyan et al. (2017) Y. Tsaturyan, A. Barg, E. S. Polzik, and A. Schliesser, “Ultracoherent nanomechanical resonators via soft clamping and dissipation dilution,” Nature Nanotechnology 12, 776–783 (2017).
- Ghadimi et al. (2018) A. H. Ghadimi, S. A. Fedorov, N. J. Engelsen, M. J. Bereyhi, R. Schilling, D. J. Wilson, and T. J. Kippenberg, “Elastic strain engineering for ultralow mechanical dissipation,” Science 360, 764–768 (2018).
- Fong et al. (2012) K. Y. Fong, W. H. P. Pernice, and H. X. Tang, “Frequency and phase noise of ultrahigh silicon nitride nanomechanical resonators,” Physical Review B 85, 161410(R) (2012).
- Roy et al. (2018) S. K. Roy, V. T. K. Sauer, J. N. Westwood-Bachman, A. Venkatasubramanian, and W. K. Hiebert, “Improving mechanical sensor performance through larger damping,” Science 360, eaar5220 (2018).
- Demir and Hanay (2020) A. Demir and M. S. Hanay, “Fundamental sensitivity limitations of nanomechanical resonant sensors due to thermomechanical noise,” IEEE Sensors Journal 20, 1947–1961 (2020).
- Verbridge et al. (2006) S. S. Verbridge, J. M. Parpia, R. B. Reichenbach, L. M. Bellan, and H. G. Craighead, “High quality factor resonance at room temperature with nanostrings under high tensile stress,” Journal of Applied Physics 99, 124304 (2006).
- Schmid et al. (2011) S. Schmid, K. D. Jensen, K. H. Nielsen, and A. Boisen, “Damping mechanisms in high- micro and nanomechanical string resonators,” Physical Review B 84, 165307 (2011).
- Unterreithmeier et al. (2010) Q. P. Unterreithmeier, T. Faust, and J. P. Kotthaus, “Damping of nanomechanical resonators,” Physical Review Letters 105, 027205 (2010).
- Schmid et al. (2010) S. Schmid, S. Dohn, and A. Boisen, “Real-time particle mass spectrometry based on resonant micro strings,” Sensors 10, 8092–8100 (2010).
- Allan (1966) D. W. Allan, “Statistics of atomic frequency standards,” Proceedings of the IEEE 54, 221–230 (1966).
- Larsen et al. (2013) T. Larsen, S. Schmid, L. G. Villanueva, and A. Boisen, “Photothermal analysis of individual nanoparticulate samples using micromechanical resonators.” ACS Nano 7, 6188–6193 (2013).
- Piller et al. (2020) M. Piller, P. Sadeghi, R. G. West, N. Luhmann, P. Martini, O. Hansen, and S. Schmid, “Thermal radiation dominated heat transfer in nanomechanical silicon nitride drum resonators,” Applied Physics Letters 117, 034101 (2020).
- Verbridge et al. (2008) S. S. Verbridge, R. Ilic, H. G. Craighead, and J. M. Parpia, “Size and frequency dependent gas damping of nanomechanical resonators,” Applied Physics Letters 93, 013101 (2008).
- Olcum et al. (2015) S. Olcum, N. Cermak, S. C. Wasserman, and S. R. Manalis, “High-speed multiple-mode mass-sensing resolves dynamic nanoscale mass distributions,” Nature Communications 6, 7070 (2015).