Long Tidal Tails in Merging Galaxies and Their Implications
Abstract
We investigate the properties of long tidal tails using the largest to date sample of 461 merging galaxies with within 0.2 from the COSMOS survey in combination with Hubble Space Telescope imaging data. Long tidal tails can be briefly divided into three shape types: straight (41 per cent), curved (47 per cent) and plume (12 per cent). Their host galaxies are mostly at late stages of merging, although 31 per cent are galaxy pairs with projected separations kpc. The high formation rate of straight tidal tails needs to be understood as the projection of curved tidal tails accounts for only a small fraction of the straight tails. We identify 165 tidal dwarf galaxies (TDGs), yielding a TDG production rate of 0.36 per merger. Combined with a galaxy merger fraction and a TDG survival rate from the literature, we estimate that 5 per cent of local dwarf galaxies are of tidal origin, suggesting the tidal formation is not an important formation channel for the dwarf galaxies. More than half of TDGs are located at the tip of their host tails. These TDGs have stellar masses in the range of and appear compact with half-light radii following the - relation of low-mass elliptical galaxies. However, their surface brightness profiles are generally flatter than those of local disc galaxies. Only 10 out of 165 TDGs have effective radii larger than 1.5 kpc and would qualify as unusually bright ultra-diffuse galaxies.
keywords:
galaxies: evolution – galaxies: interactions – galaxies: tidal tails – galaxies: dwarf1 Introduction
In the Cold Dark Matter (CDM) cosmological model, cosmic structure and dark matter haloes grow in a hierarchical manner, placing galaxy mergers as major drivers of galaxy formation and evolution (e.g. Hopkins et al., 2006). The mergers of galaxies not only drive the ex situ mass growth to form more massive galaxies (e.g. Bundy et al., 2009; Fakhouri, Ma & Boylan-Kolchin, 2010; Oser et al., 2010; Moustakas et al., 2013; Rodriguez-Gomez et al., 2016; Martin et al., 2017), but also invoke gravitational torques/disruption to shape the kinematic and physical properties of the merger remnants (e.g. Hopkins et al., 2007; Ellison et al., 2013; De Propris et al., 2014; Thorp et al., 2019). The past two decades have witnessed significant progress in our understanding of galaxy merger rate across cosmic age both observationally (Patton et al., 2002; Conselice et al., 2003b; Lin et al., 2004; Lotz et al., 2008a; Jogee et al., 2009; Robaina et al., 2009; Lotz et al., 2011; Xu et al., 2012; Man, Zirm & Toft, 2016; Wen & Zheng, 2016; Mantha et al., 2018) and theoretically (Stewart et al., 2009; Hopkins et al., 2010b; Fakhouri, Ma & Boylan-Kolchin, 2010; Rodriguez-Gomez et al., 2015). Recently, more efforts have turned to characterizing galaxy mergers of different types and their essential roles in regulating the evolution of galaxies over a wide range of properties.
Galaxy mergers are often classified into different types in terms of the properties of the merging galaxies, such as their mass ratio (major versus minor; Bournaud, Jog & Combes 2005; Lotz et al. 2010, 2011; Ownsworth et al. 2014) and gas fraction (wet versus dry; Bell et al. 2006; Lin et al. 2008). Major mergers, often defined by a mass ratio of , have been widely studied in both simulations and observations. As the most violent process of galaxy interactions, major mergers trigger intense star formation (Sanders & Mirabel, 1996; Mihos & Hernquist, 1996; Teyssier, Chapon & Bournaud, 2010), in at least some cases ignite active galactic nuclei (AGNs) (Sanders et al., 1988; Bahcall et al., 1997; Treister et al., 2012; Barrows et al., 2017; Ricci et al., 2017) and induce morphological transformation from discs into spheroids (e.g. Barnes, 1992; Genzel et al., 2001; Naab & Burkert, 2003; Lotz et al., 2008b; Bournaud et al., 2011).
In contrast, minor mergers occur more often than major mergers and supply stars and gas into the primary galaxies. Observational evidence suggests that minor mergers are dominantly responsible for the size growth of massive galaxies (e.g. Newman et al., 2012; Bluck et al., 2012; Hilz, Naab & Ostriker, 2013) and for triggering star formation in at least the nearby universe (Kaviraj, 2014). The minor mergers might even induce morphological transformation through disc instabilities for galaxies (e.g. Welker et al., 2014).
Gas-rich mergers behave very differently from gas-poor mergers. At least some mergers drive gas inflows which fuel star formation and can trigger AGN activity. These gas inflows are expected to be important in influencing the growth of bulges (Hopkins et al., 2009, 2010a), but the relationship between merger parameters and bulge growth is far from straightforward (Bell et al., 2017; Gargiulo et al., 2019). Disc survival and regrowth is expected to be impacted by gas content also, where even gas-rich major mergers are predicted to lead to disc-dominated remnants (Robertson et al., 2006).
On the contrary, dry mergers of gas-poor galaxies proceed with dissipationless processes and sustain little star formation, being a key driver of the mass growth and structural evolution of massive elliptical galaxies (van Dokkum, 2005; Bell et al., 2006) and the Brightest Cluster Galaxies (BCGs) at (e.g. Lin et al., 2013). Moreover, the internal structure and orbital parameters (prograde versus retrograde) of the merging galaxies also influence the properties of the post-merger galaxies (Darg et al., 2010; Martin et al., 2018). A comprehensive picture of shaping the detailed properties of present-day galaxies is still lacking.
Indeed, tidal features generated in a galaxy merger strongly depend on the mass ratio, gas fraction, internal structure and orbital parameters of the merging galaxies, and thus can be used to characterize the merger (Duc & Renaud, 2013; Barnes, 2016). For instance, bridges and long tidal tails can be generated in major mergers between equal-mass discs (Toomre & Toomre, 1972; Barnes, 1992), and tidal streams are often produced in the minor merger events such that satellite galaxies fall into a more massive galaxy (Martínez-Delgado et al., 2010). Such tidal features are frequently detected around massive galaxies, tracing the merger events happened in the recent past (Duc et al., 2015; Morales et al., 2018; Hood et al., 2018; Kado-Fong et al., 2018). In particular, long tidal tails are exclusively created in the major mergers involving disc galaxies with preferentially prograde orbits (Struck & Smith, 2012; Duc & Renaud, 2013). The shape of tidal tails may be influenced by the shape of the gravitational potential wells and underlying dark matter haloes. Dubinski, Mihos & Hernquist (1996) showed through simulations that galaxies with a low halo-to-disc mass ratio can produce long tidal tails in the merging process. Springel & White (1999) further pointed out that long tidal tails can be generated when the halo spin in sufficiently large for merging galaxies with a high halo-to-disc ratio. Moreover, using TDGs on tidal tails, Bournaud, Duc & Masset (2003) found that dark matter haloes around spiral galaxies are at least ten times larger than the stellar discs. Therefore, long tidal tails are useful probes for dark matter halo parameters and galaxy structures. The characteristics of tidal tails are affected by the orbital parameters, disc orientations as well as stellar and gas masses and the specific angular momentum of the merging galaxies (Struck & Smith, 2012; Ploeckinger et al., 2018). Long tidal tails from mergers of disc galaxies thus provide hints on the orientation between their spin and orbital parameters.
Moreover, star clusters and tidal dwarf galaxies (TDGs) can be formed in tidal tails (Barnes & Hernquist, 1992; Bournaud & Duc, 2006; Wetzstein, Naab & Burkert, 2007). Previous observational studies of TDGs focused on individual objects or small samples (Duc et al., 2000; Duc & Mirabel, 1998; Hancock et al., 2009; Mohamed, Reshetnikov & Sotnikova, 2011; Kaviraj et al., 2012). A systematic investigation of tidal tails using a sufficiently large sample of merging galaxies is required to address how the tidal tails are created in reality, draw constraints on how spiral galaxies merge with each other in the cosmic web, and examine the formation of TDGs and star formation under these extreme conditions.
Although there have been many simulations to study the morphology of merging galaxies and tidal tails. However, it is not clear how many shapes real tidal tails have, how do they relate to the merger parameters and how they are formed. At the same time, solving the problem of the relationship between the TDG formed in the tidal tail and the shape of the tidal tail will help understanding merging processes and star formation in tidal tails.
In this work, we analyse a sample of 461 merging galaxies with long tidal tails (defined as having sizes comparable to the effective radii of the host galaxy, Wen & Zheng 2016) to characterize tidal tails as well as their parent galaxies. We briefly introduce the sample and data in Section 2. Section 3 presents our analysis and results and we discuss the implications in Section 4. Through out this paper, we adopt a concordance cosmology of km s-1 Mpc-1 , and . All photometric magnitudes are given in the AB system.
2 SAMPLE AND DATA
We adopt the sample of 461 long-tidal-tail merging galaxies (LTTGs) in the COSMOS field from Wen & Zheng (2016). They identified these LTTGs using Hubble Space Telescope (HST)/ACS F814W () imaging data and multi-band deep survey data and catalogs in COSMOS (e.g. Leauthaud et al., 2007; Capak et al., 2007). The HST/ACS F814W science images have a scale of 003 per pixel and reach a limiting magnitude limit of 25.6 mag for extended sources within a circular aperture radius of 03. The Full Width at Half Maximum (FWHM) of the point-spread function (PSF) of the F814W images is 009, corresponding to a physical size of 297 pc at and of 723 pc at (Koekemoer et al., 2007). The HST imaging data cover an area of 1.64 deg2 and provide high-resolution morphological information in the rest-frame optical for galaxies at . The stellar mass and photometric redshift catalogs come from Muzzin et al. (2013), based on the UltraVISTA survey, providing a total of 154,803 -band-detected sources down to 5 mag with a 90 per cent completeness for point sources.
In Wen & Zheng (2016), a morphological classification method, namely the - method, was used to select LTTGs. As a non-parametric method for galaxy morphology, the - method is dedicated to probing asymmetric structures in the outskirts of a galaxy (Wen, Zheng & An, 2014). In the method, the image of a galaxy is divided into two parts, the inner half-light region (IHR) and the outer half-light region (OHR). Each region contains half the total flux of the galaxy. Two parameters are used: the outer asymmetry, , measures the asymmetry of OHR and the outer centroid deviation, , measures the deviation (or offset) between the flux-weighted centroids of the IHR and the OHR. The parameters are sensitive to the asymmetric structures in the outskirts such as long tidal tails. Galaxies with more disturbed morphologies tend to have higher and . In practice, is calculated using the formula:
| (1) |
where refers to the light distribution of OHR of an image; represents the -rotation version of ; - yields the residual image; and are corrections for the noise contributions to the flux image and the residual image -, respectively. The outer centroid deviation is measured as below:
| (2) |
where (, ) and (,) refer to the flux-weighted centroid position of the IHR and of the OHR in pixels, respectively, and is the normalized effective radius in pixels estimated using . Here is the area in pixels of the IHR. More details about the method can be found in Wen, Zheng & An (2014).
Two steps were adopted for identifying LTTGs in Wen & Zheng (2016). Firstly, they pre-selected 13,227 galaxies with morphologies showing a certain degree of disturbance using the - method from 35,076 galaxies with within in the COSMOS field. Secondly, the 13,227 candidates were visually examined using the HST/ACS F814W science images. A total of 461 merging galaxies were identified with long tidal tails. See Wen & Zheng (2016) for more details about the sample selection. We use this sample to analyse their morphologies and the substructures of their tidal tails.
3 Analysis and Results
Using HST/ACS F814W imaging data, we characterize the morphological properties of our sample LTTGs, including the nuclear separation distance, the shape and length of tidal tails and substructures of tidal tails such as clumps, TDGs and gaps.
3.1 Nuclear Separation Distance of Merging Galaxies
Simulations show that the growth of tidal tails is closely coupled with the orbital parameters and the merging stage of a galaxy merger (Toomre & Toomre, 1972; Barnes, 1992). In a general merging process, two galaxies approach each other, pass their pericentre, and undergo a damped oscillation with dynamical friction allowing the galaxies to lose energy and angular momentum, while violent relaxation happening in the final stages as they merge into a single remnant. A close passage of one galaxy next to the other would lead to varying gravitational forces across the extended galaxies. The sides of the galaxies facing each other are more attracted than the opposite sides (Duc & Renaud, 2013). This effect allows galaxies to produce a long tidal tail and a short counter tail during the merging process. The nuclear separation distance is a crude tracer of the merging stage, although the separation oscillates a bit before the final collision. In particular, after the first pass the nuclear separation distance increases but the two galaxies appear different from the approaching pair before the first pass. The merging galaxies after the first pass are strongly disturbed and thus can be distinguished from the galaxy pair in the beginning of merging without apparent tidal features (e.g., tidal tails).
If tidal tails are associated with the remnant of a previous merger event, the nuclear separation distance in the ongoing merger is irrelevant with the status of the tidal tails. We argue that such cases should be rare and have marginal effects on our analysis, considering that massive galaxies statistically underwent even less than one major merger event over 8 Gyrs (e.g., Jogee et al., 2009).
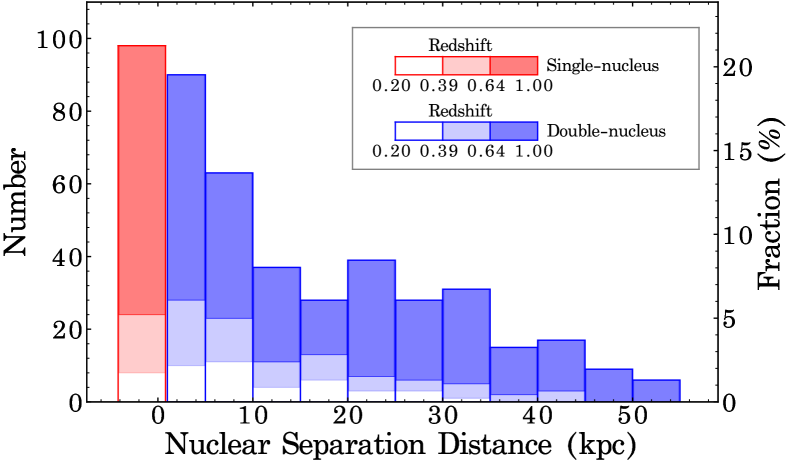
We measure the nuclear separation distance () from the HST images of our sample galaxies. For galaxy pairs, it is easy to find the centre of merging galaxies. For galaxies in their late merger phase, we use the method from Cui et al. (2001) to find galactic nuclei. We visually examine the light distribution of a merging system to find the core of the merging galaxies. If there is a dust lane, the single nucleus of a galaxy could be mistaken as a double-nucleus galaxy. In this sample, dust lanes are found in only a few merging galaxies in the final stage. If a galactic core is obscured by a dust lane, then we count it as a single core. Note that some sample galaxies contain only a single galactic nucleus, being most likely in the final stage of the merging process. We set for these single-nucleus mergers. In contrast, two nuclei are distinguishable even in a merger remnant with disturbed morphology. We refer such systems to as merger remnants with kpc. On the other hand, 8 per cent of our sample merging systems contain more than two galaxies (or galactic nuclei) with kpc. For these multiple-galaxy merging systems, the smallest separation distance to the galaxy with long tidal tails is taken as the nuclear separation distance.
Figure 1 shows the distribution of the measured nuclear separation distance for our 461 sample LTTGs. The uncertainties of our measurements of the nuclear separation distance are typically 10 per cent, and increase at decreasing separation. The typical phot- error ( at ) induces negligible uncertainties in size measurement (0.05 kpc in the transverse distance at 1" at ). Our sample consists of 98 (21 per cent) single-nucleus mergers, and 90 (20 per cent) mergers with kpc, 128 (28 per cent) close pairs with kpc, and 145 (31 per cent) galaxy pairs with kpc. It is clear that the long tidal tails are mostly associated with the merging galaxies in the later stages ( kpc). This is not surprising because long tidal tails are caused by strong interactions. For the galaxy pairs with kpc, we suspect that these galaxy pairs have undergone the first pass as the long tidal tails can be seen as a sign of violent interaction. Simulations indicate that long tidal tails can be visible over 1 Gyr, mostly between the first pass and the final coalescence in the observations similar to these adopted here (Barnes, 1992; Lotz et al., 2008b; Ji, Peirani & Yi, 2014). Roughly speaking, the phase with kpc accounts for 50 per cent of the time-scale, while the phase with kpc represents 35 per cent (Ji, Peirani & Yi, 2014). Considering the projection effect, a large fraction of widely-separated merger pairs ( kpc) may appear as kpc. The three bins of kpc, kpc and kpc account for roughly 30, 30 and 40 per cent of the long-tail-visible time-scale. We thus conclude that the results shown in Figure 1 are globally consistent with the time-scales given by the simulations, although the uncertainties of time-scales are large.
3.2 The Shape of Tidal Tails
We visually examine the shapes of long tidal tails in our sample galaxies. A pair of tidal tails is often generated by one disc galaxy while merging. Due to the projection effect and low surface brightness of counter tails, only one tidal tail is visible in some cases. Moreover, we note that the shape of a tidal tail seen from the HST image is not the same as the configuration in the real space. Three of us (J.R., M.Q. and R.W.) independently classified the morphologies of the long tidal tails. The agreed classification by at least two of us is adopted. Controversial results were obtained for about 10 per cent targets. We were re-examined to set classification. Our visual examination of all long tidal tails in our sample shows that these long tidal tails can be roughly classified into three shapes.
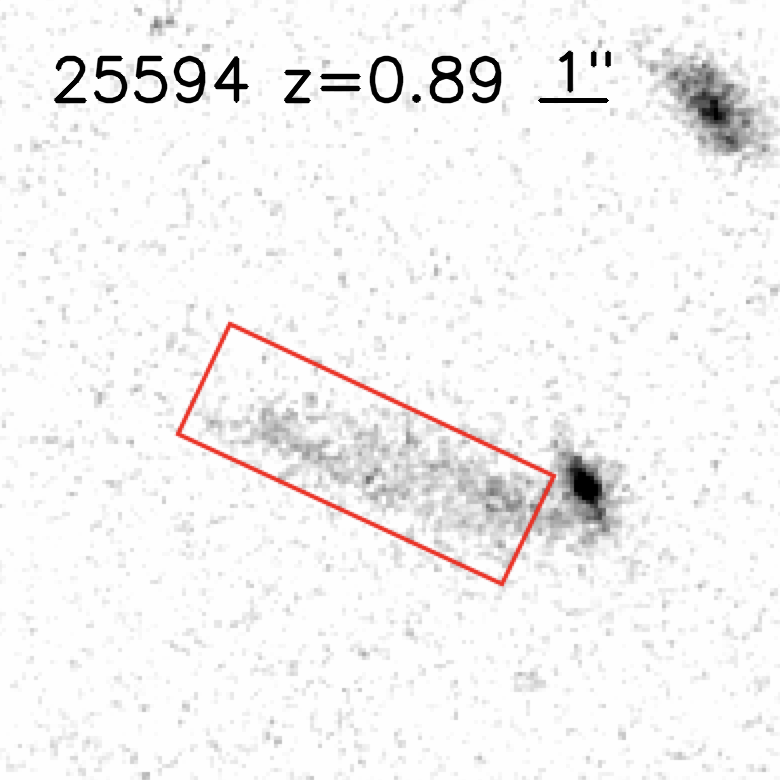
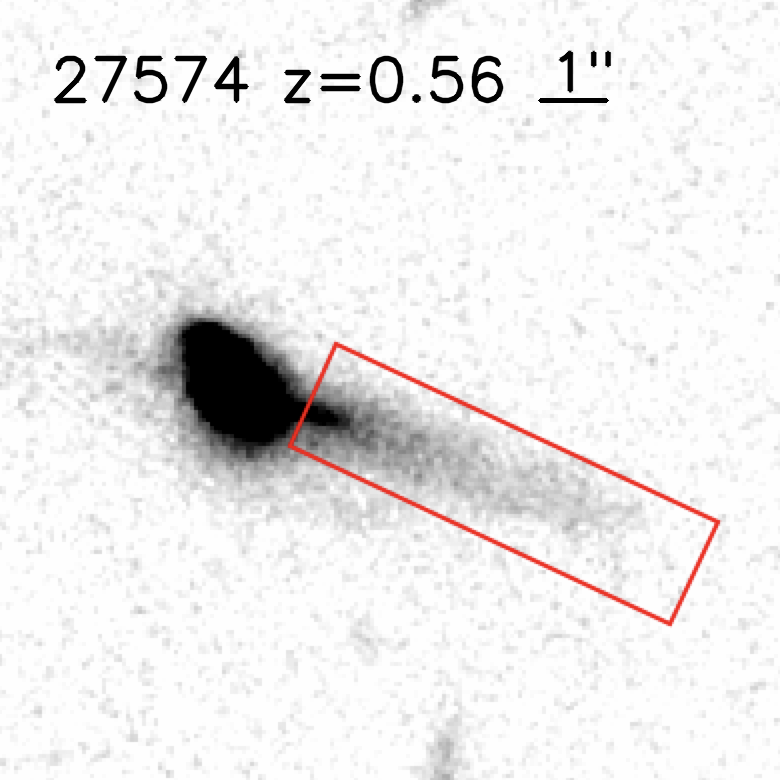
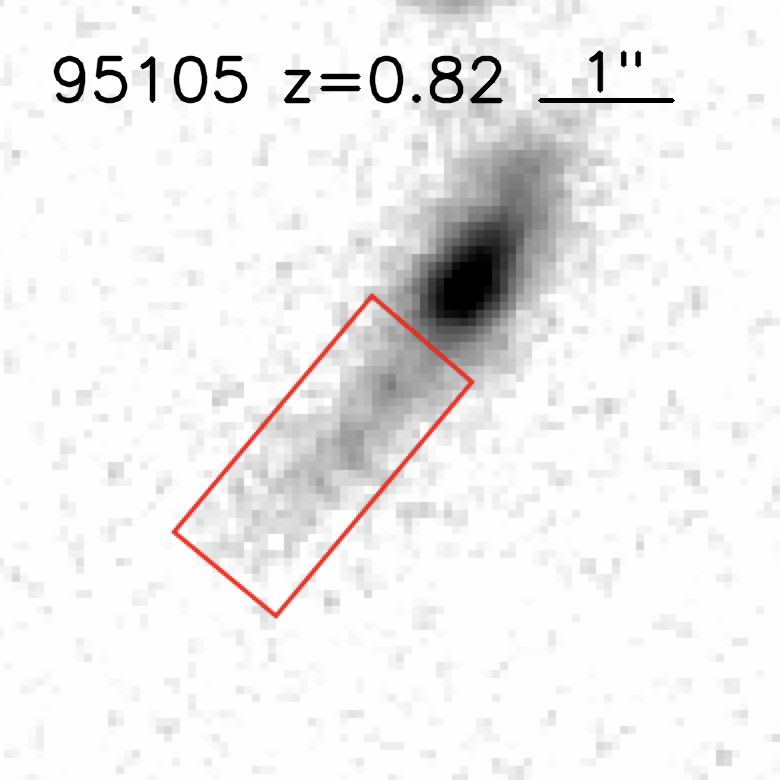
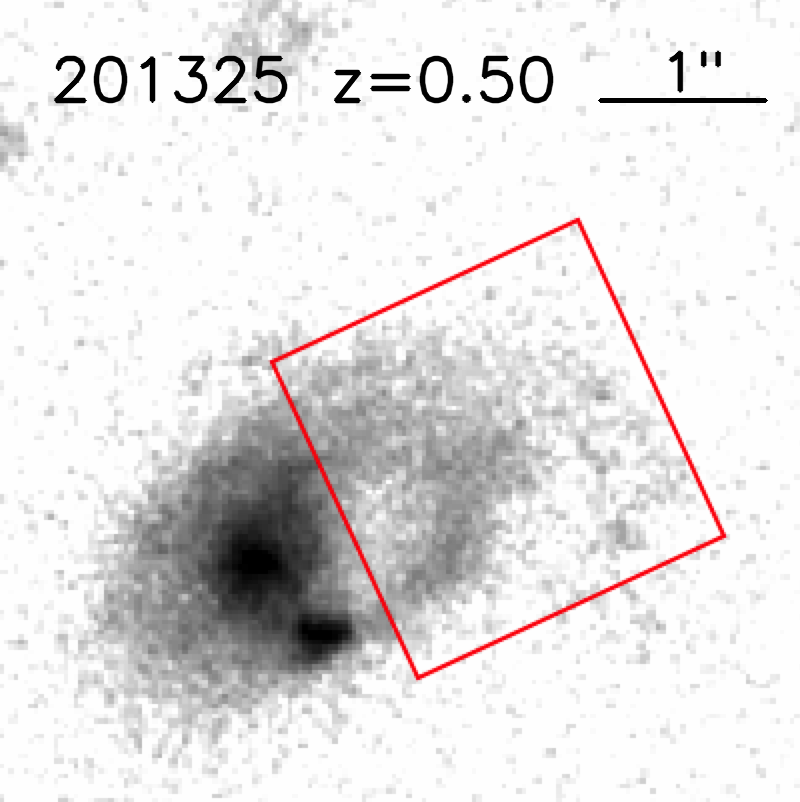
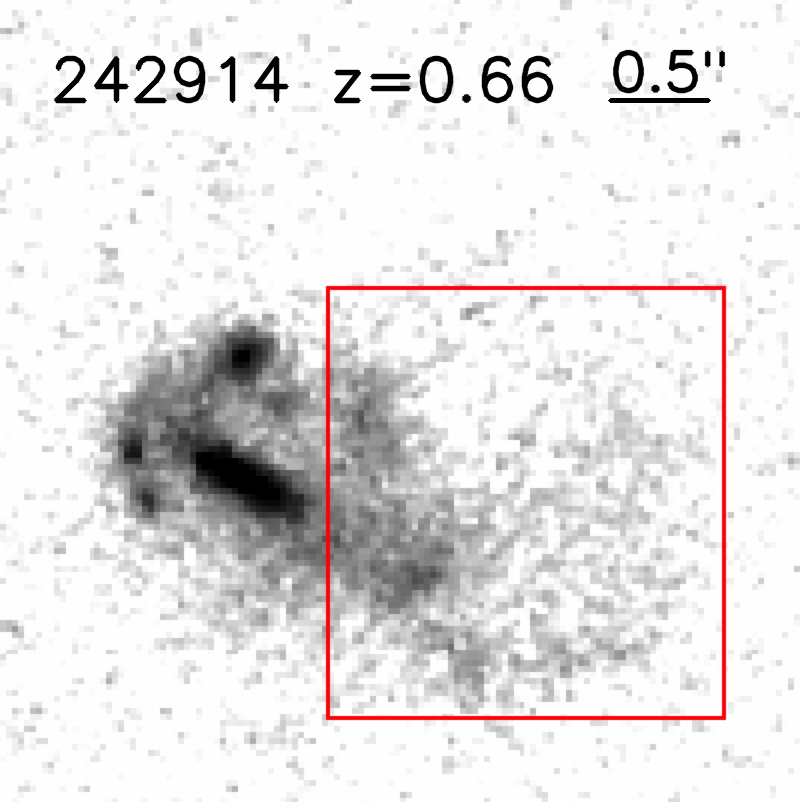
Figure 2 presents example images of the three types of tidal tails, defined as straight, curved, and plume. The key features of the three shape types are as follows:
- Straight
-
— the tidal tails are straight or slightly curved. The width of the tails is usually significantly smaller than their length and the size of their host galaxies.
- Curved
-
— the tidal tails are strongly curved with a shape like “S”, “U” or “V”. The tails are relatively thin and their width is much smaller than their length. We also include ring-shape tails into this type.
- Plume
-
— the tidal tails spread widely in a form without a certain figure. Such tails usually have low surface brightness (SB), sticking to the outskirts of the host galaxies.
In interacting galaxies with two tidal tails, one is a long tail and the other is usually shorter. The long tail is often curved or straight, and the counter tail sometimes appears to be a plume tail. In our classification, we count a merging system with a plume tail as the plume type if the plume tail is the major one or comparable to the other tail in size. If there is no plume tail, we use the longest tail to identify the shape type, even though the shorter tails might have a different type.
The number of our sample LTTGs with straight, curved or plume tails is 192 (41 per cent), 213 (47 per cent) and 56 (12 per cent), respectively. It is clear that the long tidal tails in our sample mostly have straight and curved shapes. The plume tails are relatively rare. We notice that the number of the straight tails is comparable to that of the curved tails. This is inconsistent with the idea that the straight tails are the projected curved tails as curved tails seen edge-on should account for only a small fraction of all viewing angles. A quantitative analysis on the separation of the two kinds of straight tails would need a larger sample limited in stellar mass and redshift in order to eliminate various effects. The future wide and deep imaging surveys (e.g., EUCLID, Laureijs et al. 2011; China Space Station Telescope, Gong et al. 2019; and MESSIER, Valls-Gabaud et al. 2017) will provide sufficiently large data sets to address this issue.
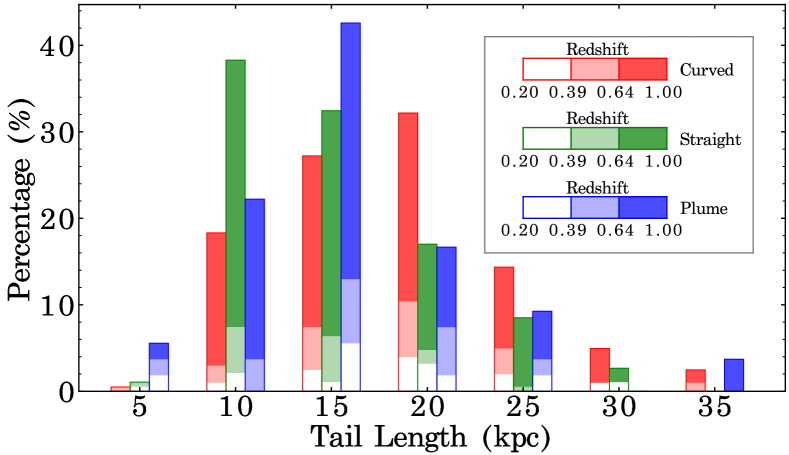
We measure the length of tidal tails based on the optical brightness of the stellar component of a tail. The H I gas of the tail may extend to much longer distances (e.g., Duc et al., 2000). A surface brightness threshold to 0.5 of background noise level is adopted to draw the boundaries of the tail. For the straight tails, we enclose the entire tail within a rectangle, and the length of the long side of the rectangle is taken as the length of the tail. For the curved tails, we draw a curved line along the ridge of the tail and measure its length. For plume tails, we use an ellipse to fit the boundaries of a tail and adopt as the length of the tail the major axis of the ellipse. We point out that the cosmic dimming effect may influence the tail length measurements. Our sample LTTGs span over a wide redshift range of and tail lengths tend to be underestimated at higher . We will address this issue in Section 3.3.3.
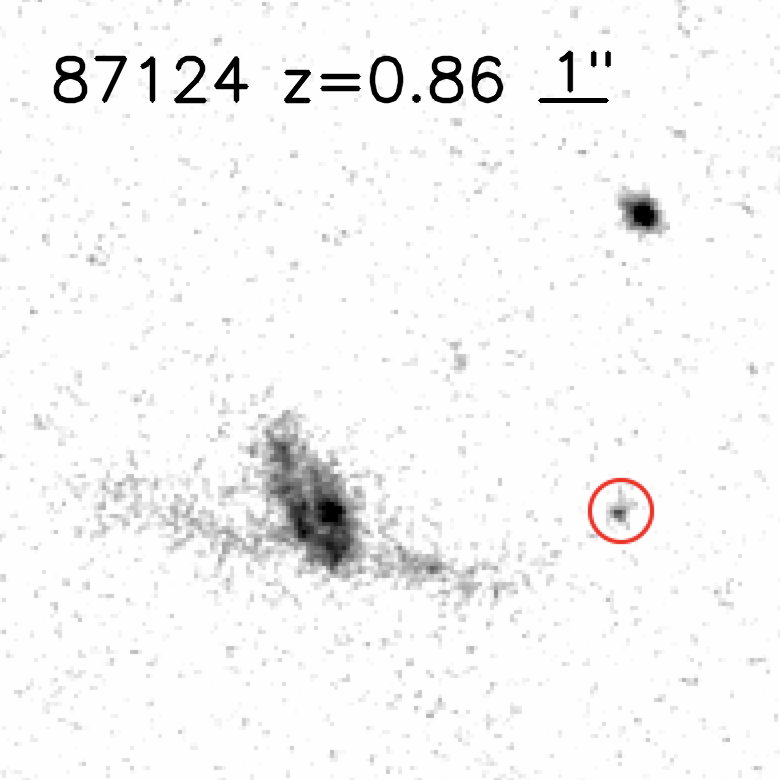
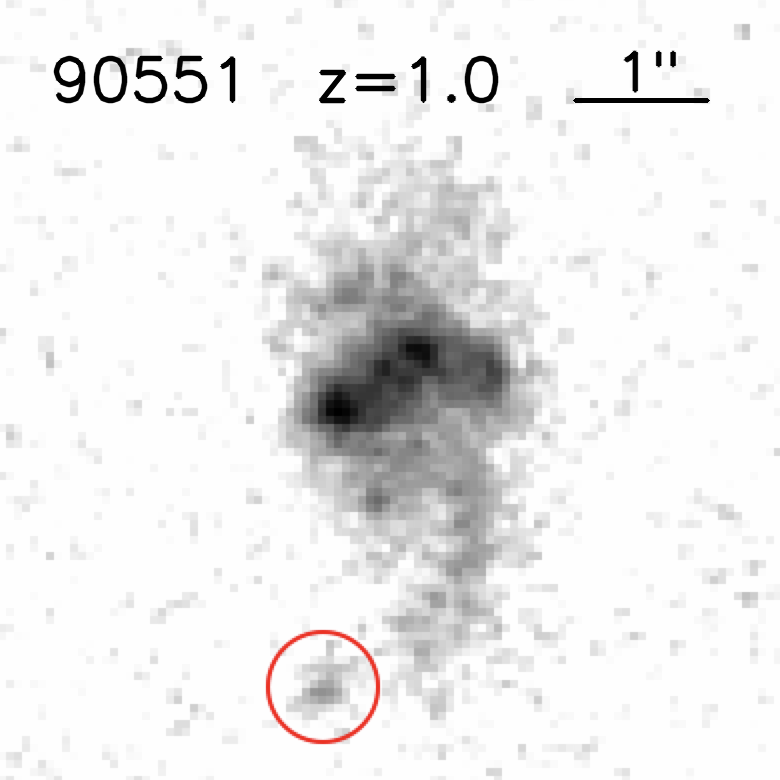
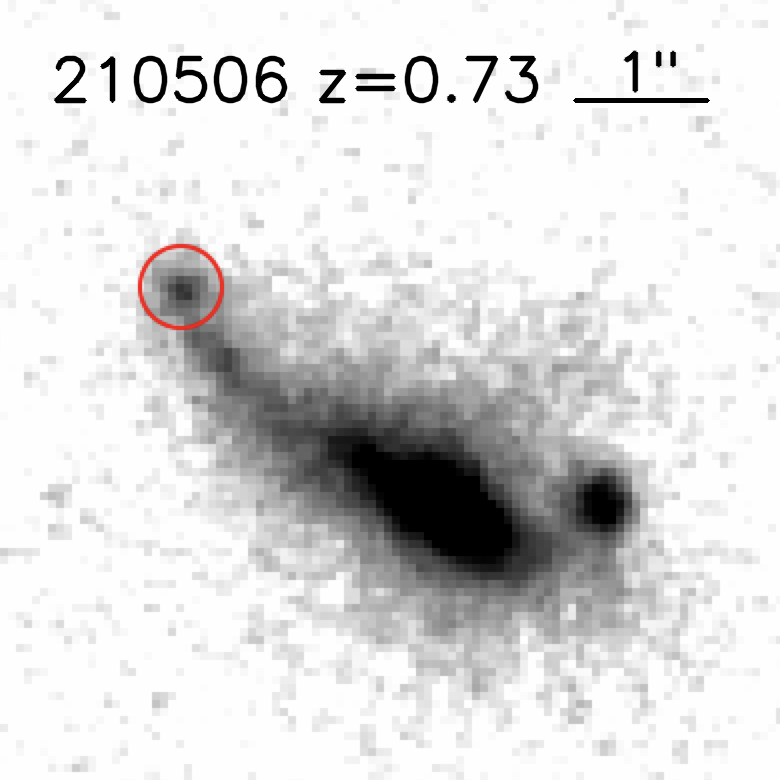
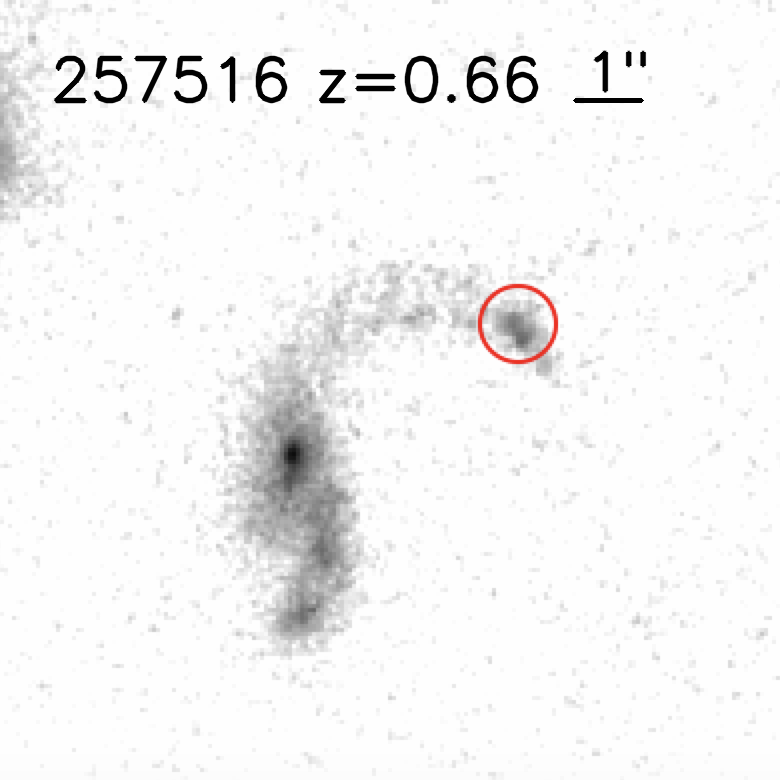
Figure 3 shows the histogram of the tail length for the straight, curved and plume tails. We can see that the optically-detected tails in our sample mostly distribute in the length range of kpc. Assuming a rotating velocity of 200 km s-1, it would take Gyr to produce these lengths, a time-scale much shorter than the typical merger time-scale of 1 Gyr (Lotz et al., 2008b; Ji, Peirani & Yi, 2014). The three types of tails are similar in the length distribution, although the straight tails tend to be slightly shorter.
| ID | R. A. | Dec | Nucleus Numbera | Nuclear Distance | Shape Typeb | Tail Length | LP | |||
| (J2000.0) | (J2000.0) | (kpc) | (kpc) | |||||||
| 218 | 150.4096792 | 1.6409722 | 0.94 | 10.20 | S | - | L | 15.54 | 1 | 1 |
| 708 | 150.3942292 | 1.6660750 | 0.60 | 9.66 | D | 2.52 | L | 4.46 | 0 | 0 |
| 737 | 150.6348000 | 1.6665639 | 0.85 | 10.10 | S | - | C | 17.50 | 1 | 1 |
| 939 | 150.5893583 | 1.6727472 | 1.00 | 10.40 | M | 3.40 | C | 11.04 | 0 | 0 |
| 1646 | 150.3790417 | 1.6888722 | 0.32 | 10.80 | D | 6.68 | P | 22.29 | 0 | 0 |
| 1658 | 150.6933292 | 1.6939667 | 0.97 | 10.70 | D | 13.23 | L | 21.22 | 0 | 0 |
| 1692 | 150.3774917 | 1.6955000 | 0.88 | 9.65 | D | 35.08 | C | 12.32 | 1 | 1 |
| 3042 | 150.4835500 | 1.7334778 | 0.71 | 10.30 | M | 13.51 | C | 32.39 | 0 | 0 |
| 3362 | 150.6746708 | 1.7463167 | 0.96 | 9.82 | S | - | L | 14.19 | 0 | 0 |
| 4335 | 150.4133292 | 1.7678472 | 0.91 | 9.79 | D | 11.07 | P | 12.15 | 0 | 0 |
| … | … | … | … | … | … | … | … | … | … | |
| (The machine-readable and complete version of this table is available online.) | ||||||||||
| aNucleus Number — S: single; D: double; M: multiple. bShape Type — L: straight, C: curved, P: plume. – Number of TDGs on tidal tail. | ||||||||||
| dLPTDG – Location Parameter, 0: no TDG; 1: TDGs at the tip of tidal tails; 2: TDGs on tidal tails; 3: TDGs at the tip and on the tidal tails. | ||||||||||
3.3 Substructures of Tidal Tails
Gravitational collapse drives gas to form clumps in a tidal tail. The clumps can form Super Star Clusters (SSCs) or TDGs within a relatively short time-scale. In contrast, the stellar component in low surface brightness along the tidal tail is not often bounded into these clumps. A detailed investigation of the substructures of tidal tails enables to shed light into the formation of the clumps (Barnes & Hernquist, 1992; Bournaud & Duc, 2006; Wetzstein, Naab & Burkert, 2007).
3.3.1 Clumps
We visually examine the substructures of all tidal tails and identify clumps formed on the tails. We identify a clump from the knot with the largest closed contour with encircled area large than 28 pixels2 (=FWHM) and the central surface brightness higher than 1.2 times the surface brightness of the surrounding tidal tail (Wen et al., 2012). This criterion allows us to pick up clumps of PSF-corrected size kpc at and smaller clumps at , indicating to our identified clumps are only complete at kpc over . Figure 4 shows the examples of clumps identified on tidal tails of four merging galaxies. In total, we identify 177 clumps from our sample of 461 LTTGs. Clumps are often present in curved and straight tails especially at the tip of tidal tails. Plume tails usually have smooth surface brightness and barely contain clumps in this sample.
It is challenging to determine the background in conducting photometry on a clump and its boundaries from the host tidal tail. The mean surface brightness of the surrounding area of the host tidal tail is estimated first and taken as the background for the clump photometry. At the tip of the tails, the background is directly derived from an annulus close to the clump. We use a set of evenly increasing apertures to measure fluxes for the clump and draw the growth curve to pinpoint the turnover radius where the curve turns flat. The radial light profile is converted from the growth curve. The outer part of the profile, where the surface brightness is lower than that of the tidal tails, is fitted with a power-law function = + and we derive the missing flux out of the turnover radius using the light-weighted best-fitting radial profile. The total flux and the half-light radius (i.e., effective radius ) are derived from the composite radial profile (inner observed + outer best-fitting) of the clump after correcting for the PSF effect using an empirical PSF radial profile derived from stars. We also measure the radius within which 90 per cent of light is enclosed from the radial profile. The central surface brightness, i.e., the mean surface brightness within , is also calculated. We use the stellar mass-to-light ratio () of the host galaxy to estimate stellar mass for the clump. We caution that this may lead to a slight overestimate of stellar mass as clumps usually have younger stellar populations than their host galaxies.
Table 1 presents the catalog of 461 LTTGs and their measured tail parameters. The table columns include ID, R.A., Dec, redshift, stellar mass, number of nuclei, nuclear separation distance, shape type of tidal tail, tail length, number of TDG, and the location parameter.
3.3.2 TDGs
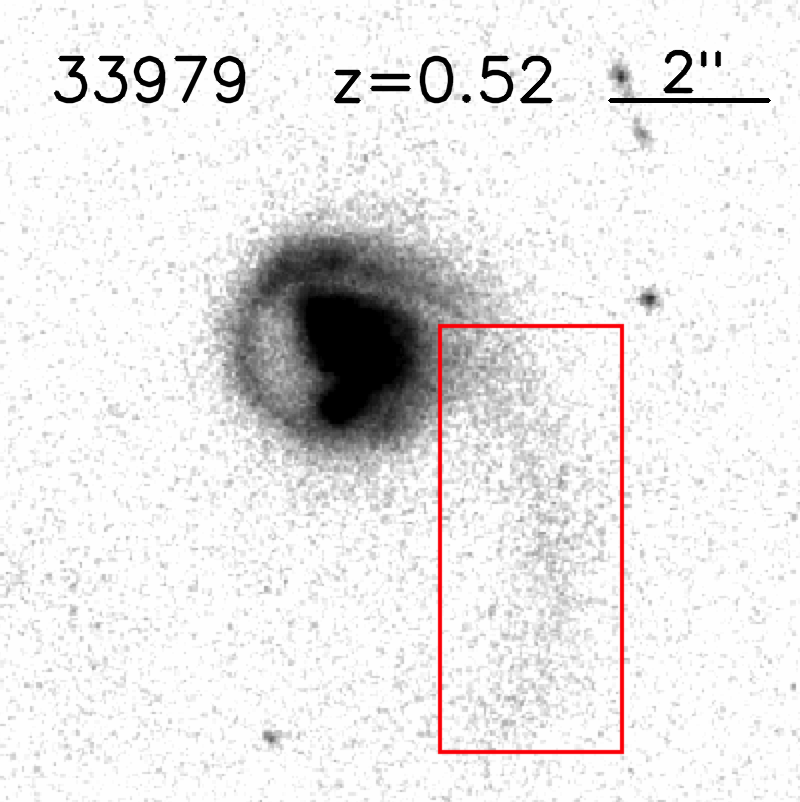
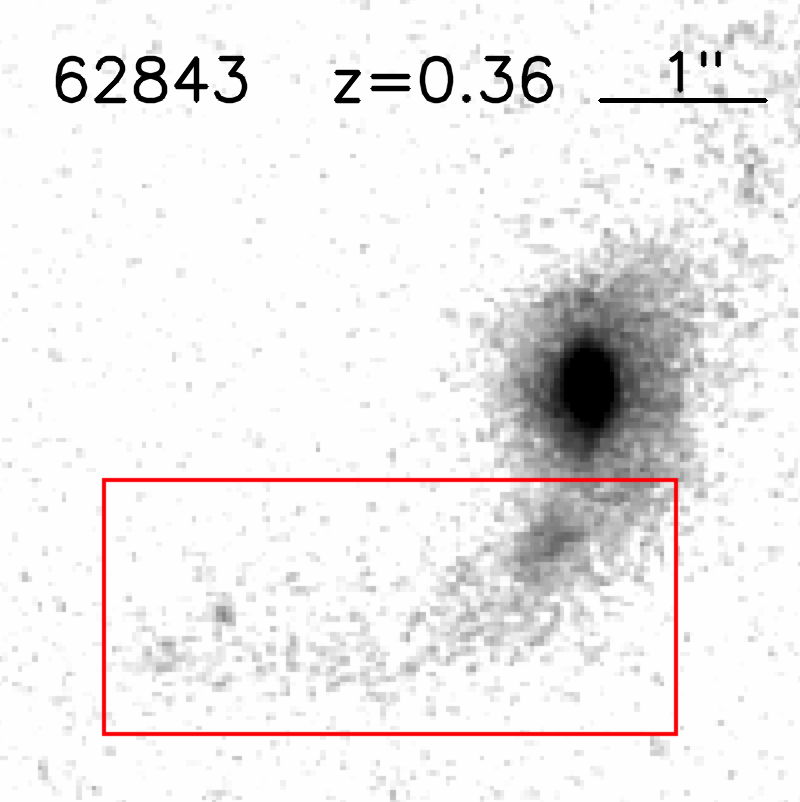
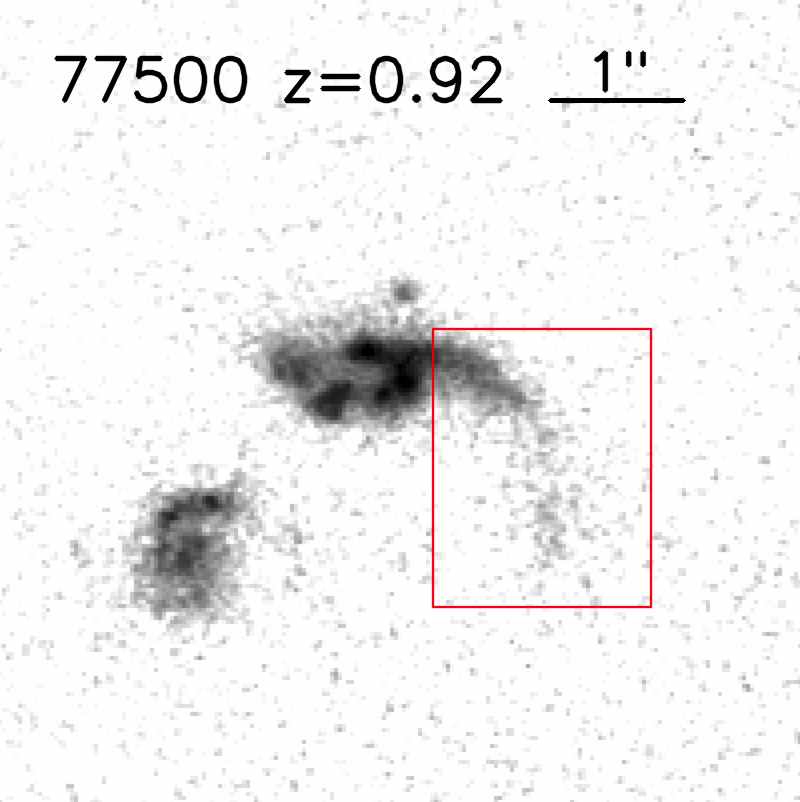
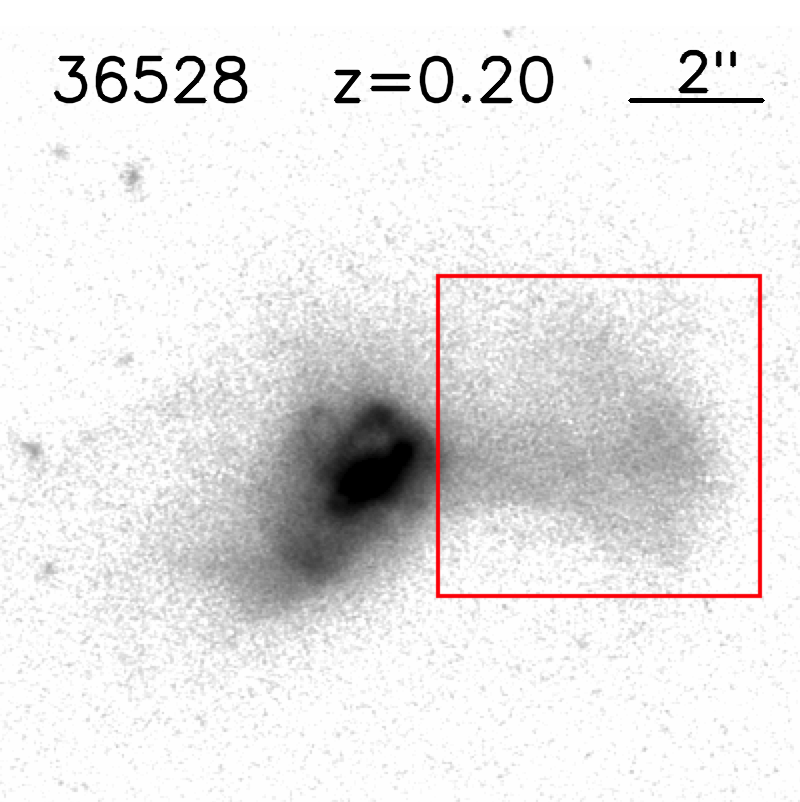
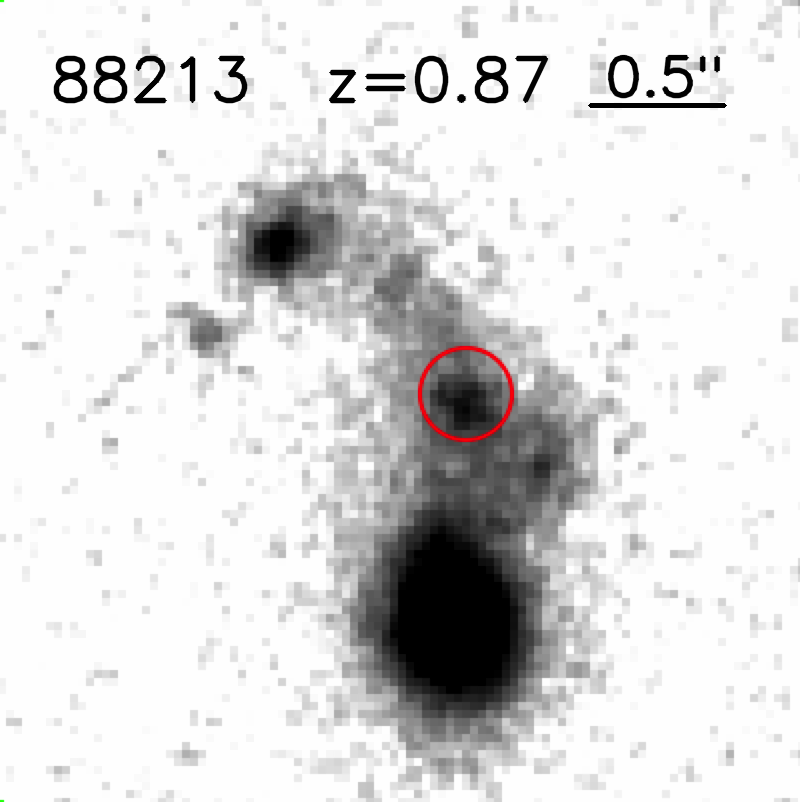
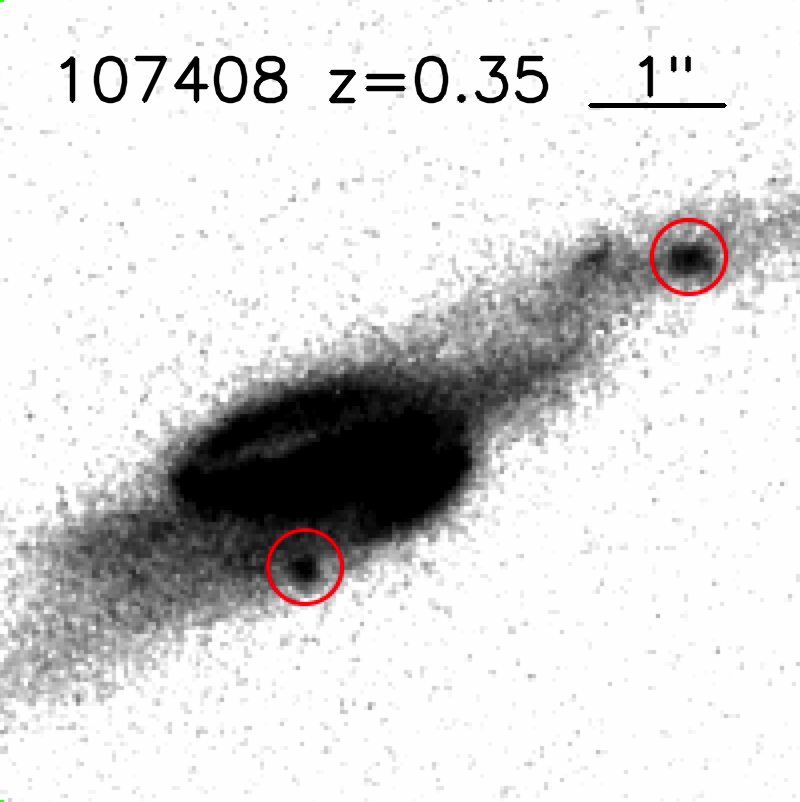
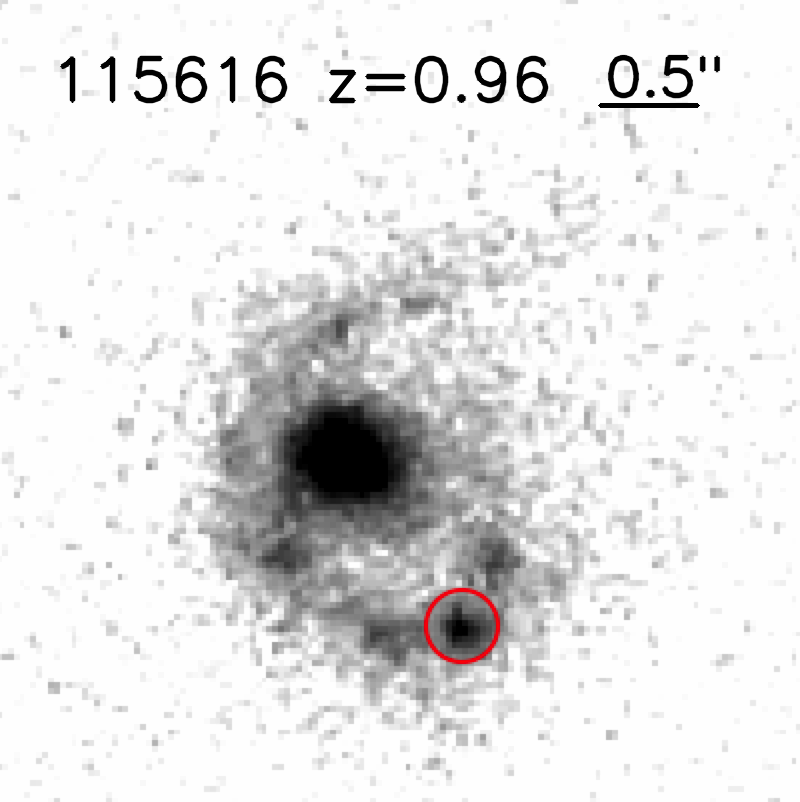
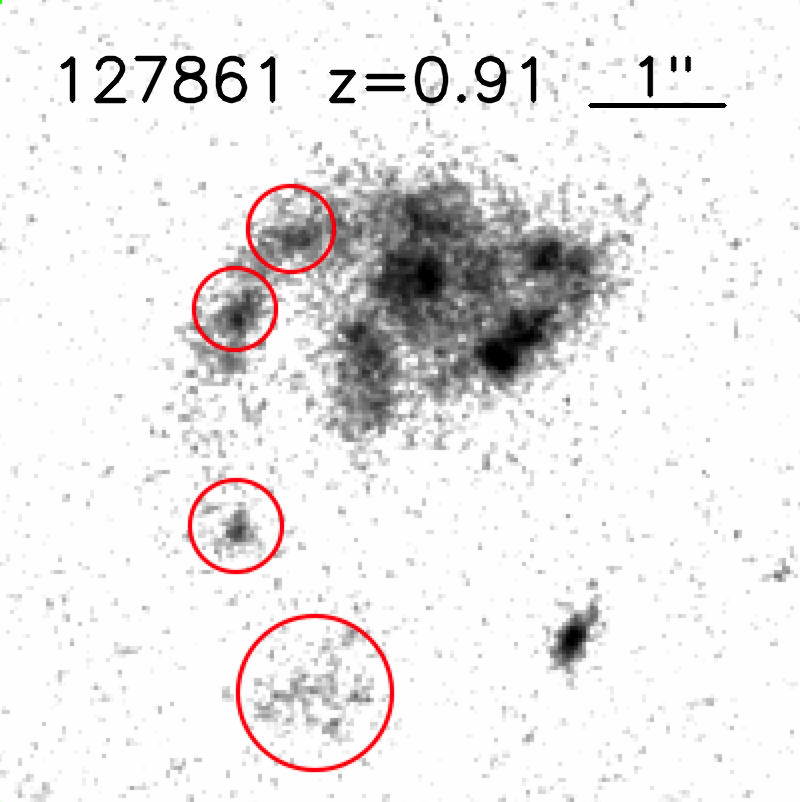
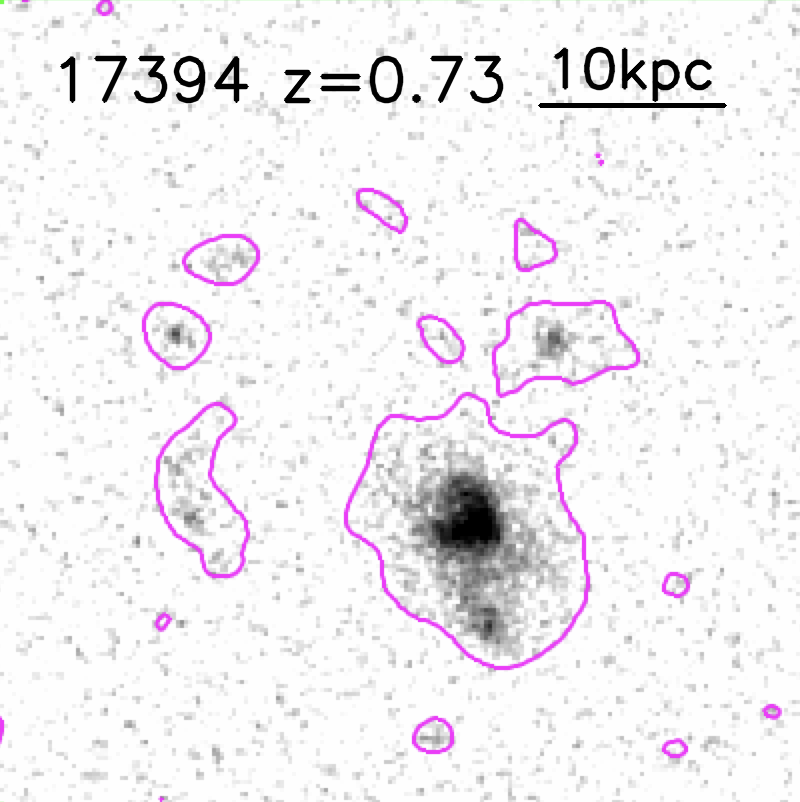
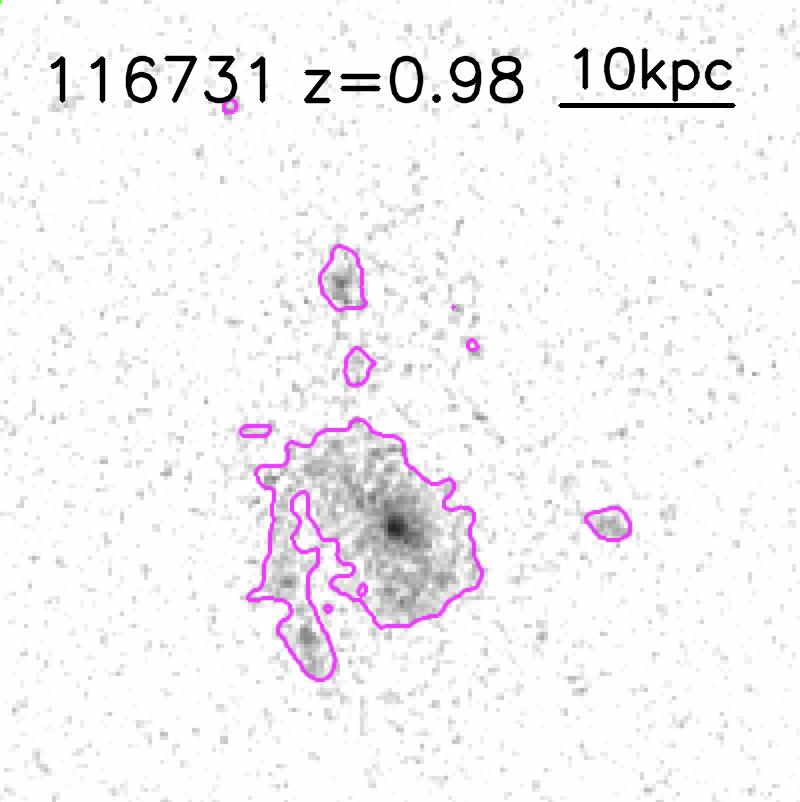
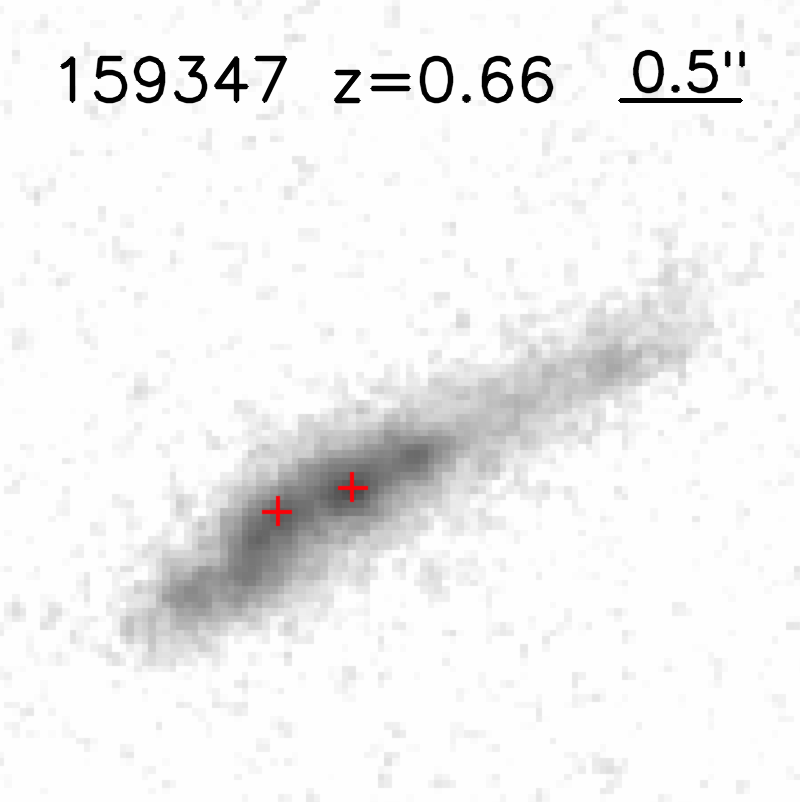
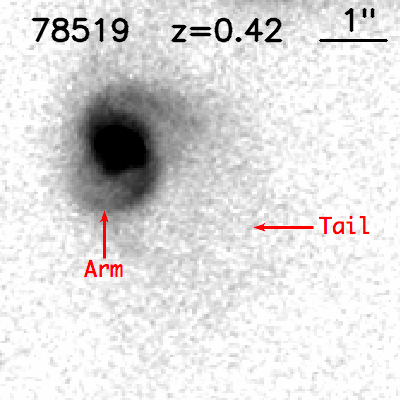
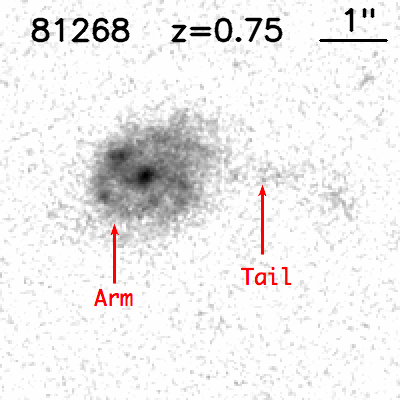
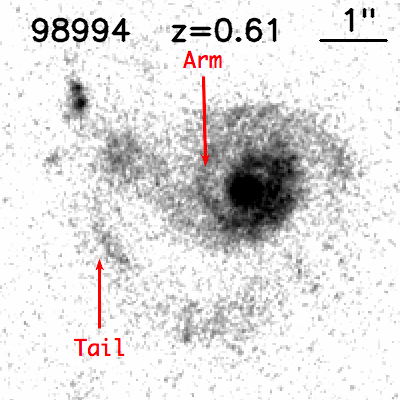
Within the sample of 177 clumps we identify TDGs. The confirmed TDGs in the literature (Duc & Mirabel, 1998; Monreal-Ibero et al., 2007; Wen et al., 2012) show different properties from the dwarf galaxies in the Local Group (Mateo, 1998). Following Wen et al. (2012), we adopt three criteria to determine if a clump is a TDG: 1) stellar mass M⊙ ; 2) effective radius kpc ; 3) central surface brightness brighter than 1.2 times that of the host tidal tails. Note that we relax the lower limit of from 0.5 kpc given in Wen et al. (2012) to 0.20 kpc because we find some TDGs at the tip of tidal tails to be more concentrated. Applying these criteria to all 177 clumps, we obtain 165 as TDGs residing in 126 LTTGs over the redshift range . Four examples of TDGs identified at the tip of long tidal tails are shown in Figure 5. The identification of 165 TDGs from 461 LTTGs gives a TDG production rate 0.36 per merger. We notice that TDGs can be found in tidal tails as well as at the tip of the tails. We introduce a parameter to show the location of TDGs in their host tails. The location parameter can be found in Table 1.
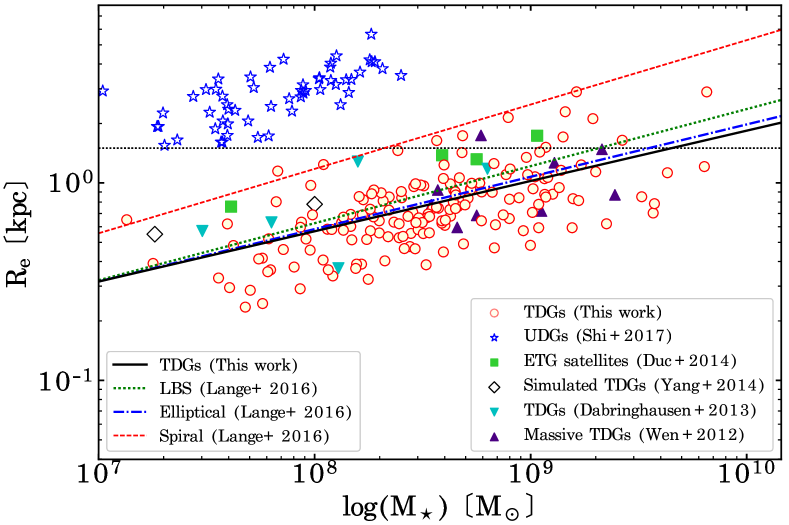
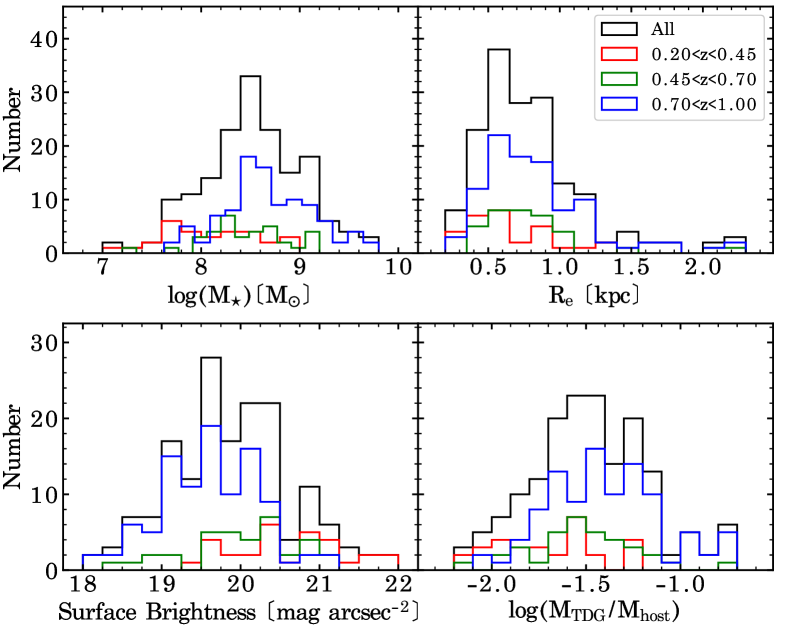
Figure 6 presents the distribution of stellar mass, F814W central SB, effective radius and TDG-to-host mass ratio for the 165 TDGs identified from our sample. The median of stellar mass is M⊙ and the average of = 0.81 kpc. Compared with TDGs in Wen et al. (2012) and Duc et al. (2014), our 165 TDGs are statistically more massive. This is not surprising because these TDGs are distributed in the redshift range of .
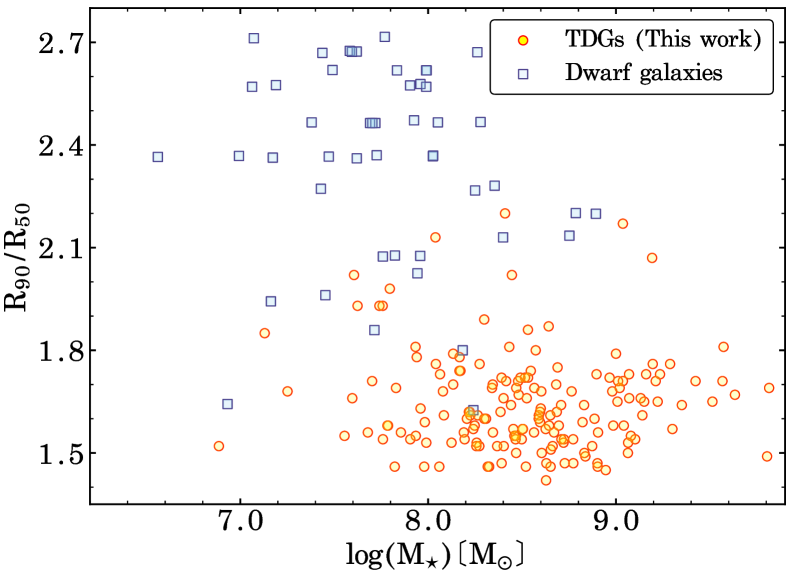
TDGs are believed to form through gas collapse followed by infall of stars (Duc & Mirabel, 1998; Duc et al., 2000) and new stellar populations can be formed at the centre of TDGs. The competition between collapse time-scale and star formation time-scale controls the light concentration of the TDGs. We quantify the concentration of TDGs using a concentration parameter , defined as the ratio between the 90 per cent-light and 50 per cent-light radii (/) (e.g. Shimasaku et al., 2001; Strateva et al., 2001; Kauffmann et al., 2003). This parameter reaches a lower limit of for a flat light distribution. Galaxies with more light concentrated in the inner part usually have a larger . Early-type galaxies are usually with and late-type star-forming galaxies mostly have (e.g., Strateva et al., 2001; Kauffmann et al., 2003). The median of is 1.65 for our sample of 165 TDGs. Figure 7 shows stellar mass versus for the 165 TDGs in comparison with dwarf galaxies (DGs) adopted from Conselice et al. (2003a). It is clear that the TDGs are dramatically less concentrated than DGs, no cores and rather flat surface brightness distribution in the inner parts. We note that Sérsic models are also often used to describe the surface brightness profile of a galaxy. The concentration parameter is a proxy of Sérsic index . Fitting the PSF-corrected surface brightness profile of TDGs in our sample with a single Sérsic function, we obtain that the majority of our TDGs are with , being consistent with for these TDGs. Table 2, we present the stellar mass, effective radius, F814W absolute magnitude and concentration parameter of the 165 TDGs.
We examine the mass-size relation of TDGs in comparison with different populations of dwarf galaxies. We collect samples of dwarf galaxies from the literature and show them in Figure 8. The TDGs from our sample are comparable to those in the nearby universe given in Dabringhausen & Kroupa (2013) and in intermediate redshifts from Wen et al. (2012). Interestingly, the early-type satellite galaxies of the nearby galaxies from Duc et al. (2014) fall into the same region as TDGs, implying that some of the satellites might be tidally originated.
We fit the relation of TDGs with a power-law, giving the best fit as , shown with the black-solid line in Figure 8. We also present the relations from Lange et al. (2016) for spiral galaxies (magenta-dashed line), elliptical galaxies (blue dot-dashed line) and blue spheroids (green-dotted line). We can see that TDGs obey the same relation as elliptical galaxies and blue spheriods of similar stellar masses. In contrast, spiral galaxies are more extended than ellipticals, blue spheroids and TDGs. In addition, we present ultra-diffuse galaxies (UDGs) from Shi et al. (2017) in Figure 8 for comparison. We can see that TDGs are much smaller than UDGs of similar stellar masses. Of 165 TDGs, only 10 TDGs are with kpc. However, these extended TDGs have central surface brightness at least two magnitudes brighter than UDGs, as shown in Figure 6, and therefore cannot be considered as bona-fide UDGs unless they constitute their brighter end.
| ID | R. A. | Dec | cb | ||||
|---|---|---|---|---|---|---|---|
| (J2000.0) | (J2000.0) | (kpc) | (mag) | ||||
| TDG-218 | 150.409721 | 1.641231 | 0.94 | 8.999 | 0.483 | 26.000 | 1.79 |
| TDG-737 | 150.634840 | 1.666839 | 0.85 | 8.629 | 0.679 | 25.277 | 1.47 |
| TDG-1692 | 150.377754 | 1.695574 | 0.88 | 8.685 | 1.734 | 24.813 | 1.62 |
| TDG-4590 | 150.625481 | 1.773197 | 0.23 | 7.252 | 0.391 | 25.496 | 1.68 |
| TDG-7458 | 150.490296 | 1.849473 | 0.38 | 8.886 | 1.102 | 23.686 | 1.60 |
| TDG-7613 | 150.674347 | 1.853363 | 0.51 | 8.689 | 0.491 | 24.227 | 1.75 |
| TDG-9348-1 | 150.485706 | 1.885998 | 0.26 | 7.939 | 0.633 | 24.077 | 1.78 |
| TDG-9348-2 | 150.485753 | 1.886106 | 0.26 | 7.679 | 0.235 | 24.728 | 1.56 |
| TDG-13685-1 | 150.497095 | 1.961305 | 0.35 | 7.759 | 0.245 | 25.452 | 1.54 |
| TDG-13685-2 | 150.497189 | 1.961506 | 0.35 | 7.796 | 0.363 | 25.360 | 1.98 |
| … | … | … | … | … | … | … | … |
| (The machine-readable and complete version of this table is available online.) | |||||||
| a F814W magnitude; bconcentration (i.e., ) . | |||||||
3.3.3 Isolated Clumps Around the Merging Galaxies
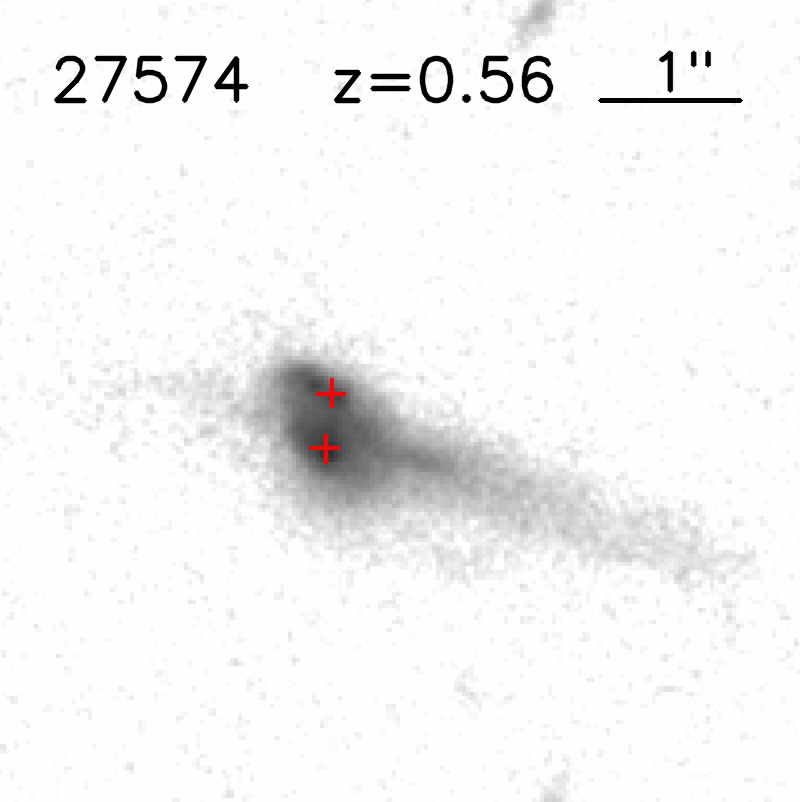
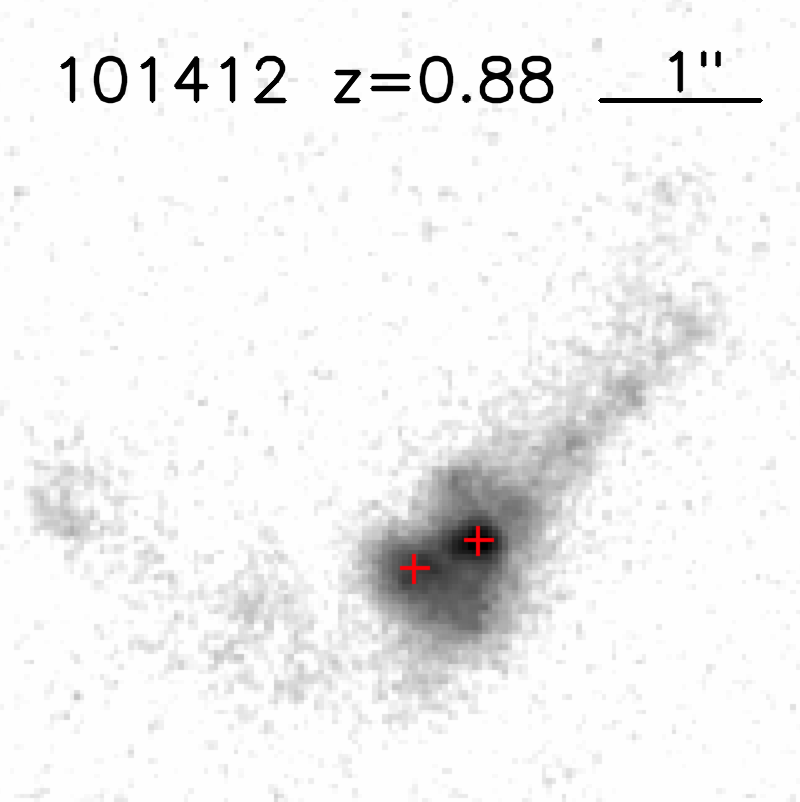
Tidal tails gradually fade and eventually become undetectable after coalescence of two galaxies. However, clumps formed on the tidal tails can still be detected after the tidal tail has dissipated. In such case, one may expect to see clumps around a merging system without clearly-visible tidal tails connecting them. Indeed, we find similar objects in our sample. Figure 9 shows two merging galaxies with surrounding clumps. The two objects exhibit clear tidal features but the diffuse component of their tidal tails are hardly detectable. We point out that our selection for LTTGs disfavors such systems as their long tidal tails become fainter than the limiting surface brightness.
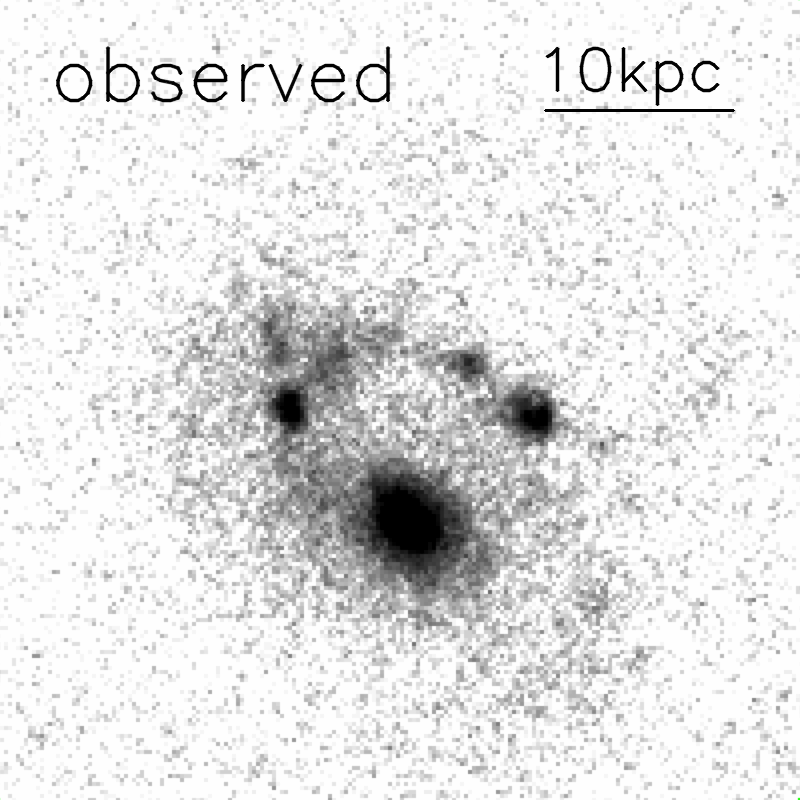
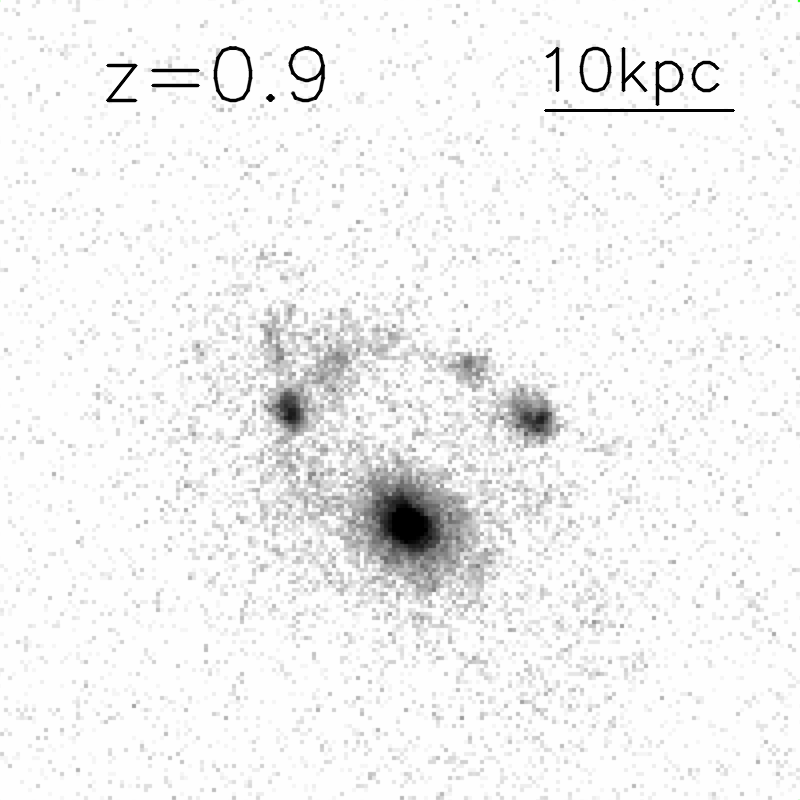
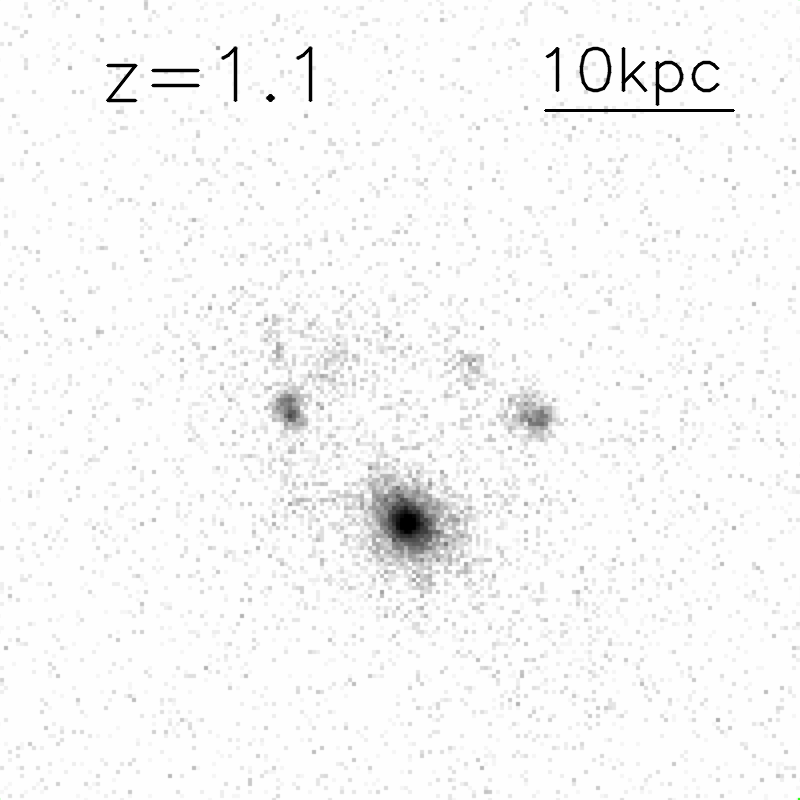
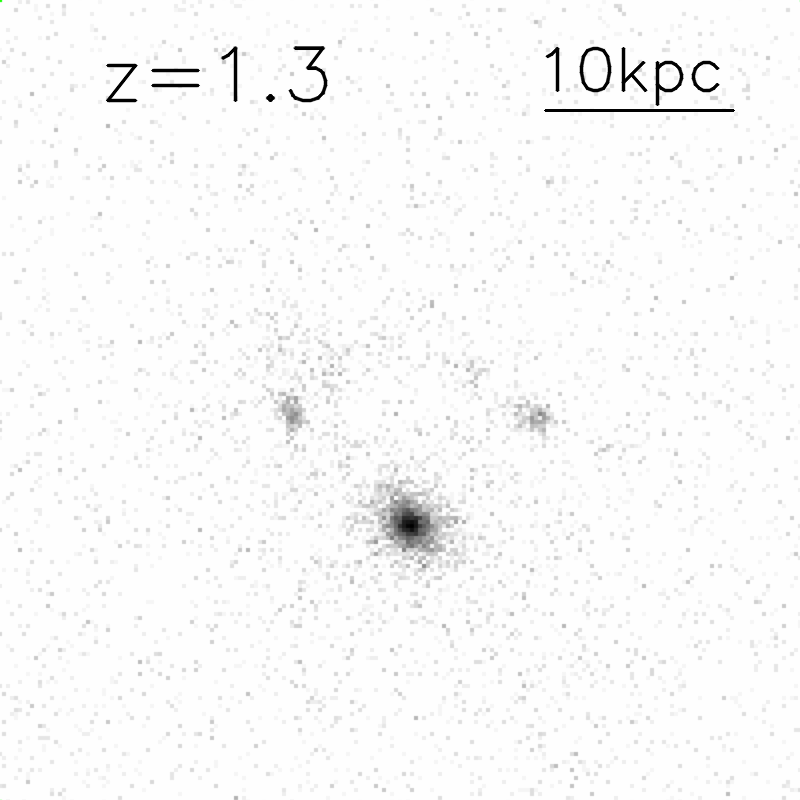
On the other hand, the cosmic dimming may lead to the same effect on the detection of the tidal tails. We demonstrate the case by redshifting merging galaxies to higher redshifts using low- observed objects and counting for the cosmic dimming effect. In Figure 10, the left panel gives one LTTG at from our sample; the right three panels present the simulated images of this object redshifted to = 0.9, 1.1 and 1.3 with an unchanged limiting surface brightness. It can be seen that the tidal tail and the entire system gradually fade at increasing redshift and these clumps loss connections through the tail bridges at . The simulated object at can not be identified as a merging system.
A clump at the tip of a tidal tail is often barely connected. The tip clump accretes surrounding materials and quickly creates a gap to the tail. The top two panels of Figure 5 demonstrate such cases. However, such clumps can be clearly identified. We thus include them into our clump sample. The tip clumps are exclusively TDGs.
4 Discussion
4.1 Formation of Tidal Tails in Relation to Their Shapes
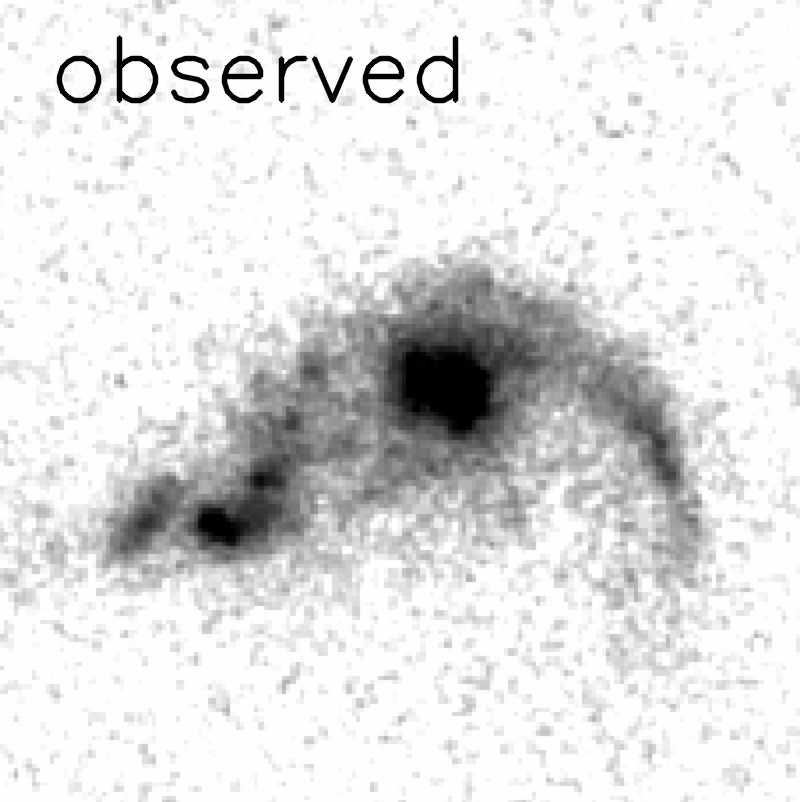
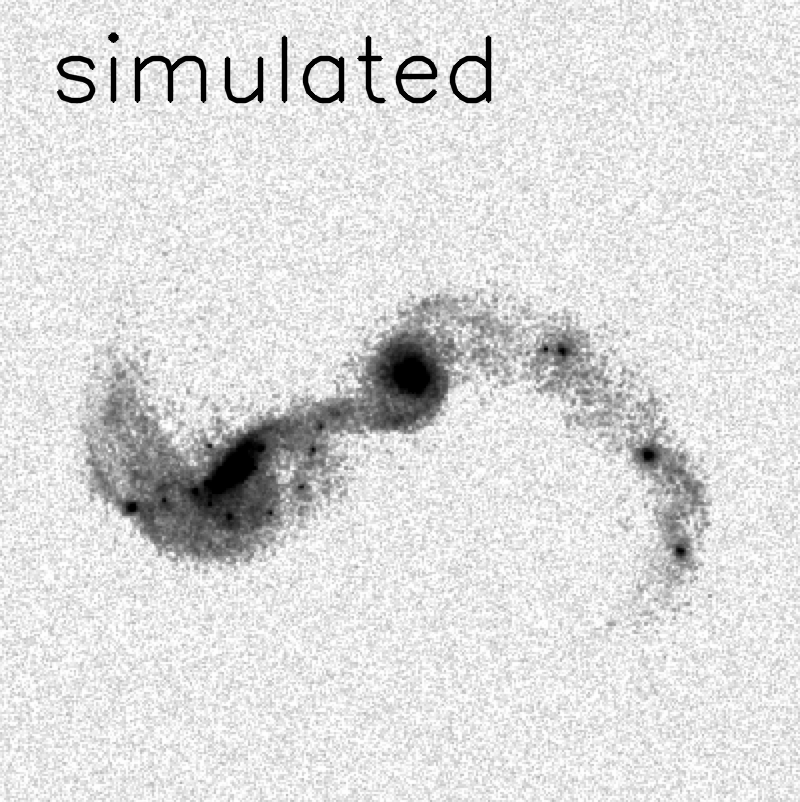
In galaxy merging processes, the shape of tidal tails is governed by galaxy morphologies, kinematics, merger parameters, merger stage and the viewing angle (e.g. Toomre & Toomre, 1972; Barnes, 1992). An effective way to assess the formation of these tidal tails is to match an observed merger with simulated ones in morphology and take the merger parameters from the matched simulation to model the observed merger and formation of the associated tidal tails. Figure 11 illustrates a real merger from our sample and a simulated merger from the GalMer database (Chilingarian et al., 2010). The snapshot of the simulated merger is chosen to be analog to the morphology of the real merger. This simulation models a prograde merger at the intermediate stage in which the tidal tails keep growing. We point out that it is a big effort to pinpoint a close match of simulated mergers to each of all 461 LTTGs in our sample and figure out how these mergers were undergoing. It is worth doing but beyond the scope of this work. Here we discuss the formation mechanisms for the three types of tidal tails in our sample.
Straight tails — Our results show that the fractions of straight and curved tails are comparable in our sample. The straight tails represent a large fraction ( per cent) of the overall tidal tails. Straight tails are statistically shorter than curved tails, as shown in Figure 3. Their host galaxies are mostly single nucleus or close pairs, are likely being in the late stages of merging processes. In Figure 12, we present three more examples of straight tails hosted by double-nucleus systems. Compared with the curved tails, the straight tails tend to have a lower mean surface brightness and host less clumps as well as TDGs.
We note that curved tidal tails mostly lie in the same plane of their rotating host galaxies. They could be viewed as straight from the edge-on angle. However, the fraction of the edge-on curved tidal tails is small if the inclination of these merging galaxies is not preferentially aligned. And such projection effect of the tidal tails can be clarified in nearby merging galaxies (Bournaud & Duc, 2004). We thus believe that the majority of straight tidal tails were formed to be straight.
It is unclear how to generate straight tidal tails in galaxy mergers at a high rate. From the properties of the straight tails, we suspect that they are associated with the late stages of galaxy mergers, and probably strongly stretched by violent tidal forces. Moreover, the lack of clumps and/or relatively short lengths may hint that their parent galaxies are not sufficiently massive. Further efforts are needed to interpret the formation of straight tidal tails.
Curved tails — Simulation suggest that long curved tails are often produced in the prograde mergers of disc galaxies. The length of the curved tails are significantly affected by the merger parameters such as the different inclination angle and the mass ratio. It is clear that curved tails formed after their first pericentre passage. This stage represents a relatively long period of the entire merging process (Barnes, 1992).
Plume tails — This type of tidal tails may be associated with the retrograde mergers of disc galaxies. In retrograde merging, the materials of the tails are driven away by tidal force, and then fall back to the host galaxies and form extended plume tails. Moreover, plume tails are in place after coalescence. Around the merger remnant, the tails and fallback materials dissipate and form a plume appearance located at the outskirts of the host galaxies.
4.2 Detection Completeness
Our sample of 461 LTTGs is increasingly incomplete at in detecting long tidal tails down to the limiting surface brightness of 25.1 mag arcsec-2 (3 detection, Wen & Zheng 2016). Figure 10 demonstrated the increasing detection incompleteness due to the cosmic dimming effect. Wen & Zheng (2016) examined the F814W surface brightness of these tidal tails and estimated the detection completeness (as shown in their figure 9). The tidal tail detection is complete above an intrinsic surface brightness of 23.1 mag arcsec-2 at after correcting for the cosmic dimming effect, and the completeness becomes 78, 72, and 62 per cent at , 0.7 and 0.9, respectively.
We classified the long tidal tails into three shape types. Among them, plume tails are statistically fainter in surface brightness than straight and curved tails. The detection completeness is thus lower than for plume tails than the other two types and our sample contains only a few plume tails at . This bias lowers the fraction of the plume type in our sample.
4.3 Formation of TDGs
We identified 165 TDGs in 126 LTTGs. This is so far the largest sample of TDGs at . The properties of TDGs in our sample, as shown in Figure 6, are generally consistent with those reported in previous works for individual cases in the nearby universe or small samples of TDGs. Based on the to date largest TDG sample, we estimated a production rate of TDGs to be 0.36 per major merger. In order to estimate the contribution of TDGs to the dwarf population in the local universe, we selected a subsample of TDGs with and calculate the production rate of TDGs in this mass range. The production rate of TDGs in this mass range is 0.17 TDGs per long-tidal tail merger system. Combining galaxy mass functions at from Laigle et al. (2016) with the LTTG merger fraction from Wen & Zheng (2016), we obtain a TDG density function in the mass range of . Adopting the TDG survival rates from Bournaud & Duc (2006) , we calculate the accumulated number density of survived TDGs to be over the past Gyr and over Gyr lookback time.
Considering that some TDGs in Gyr do not have enough time to escape from tidal tails and evolve into isolated dwarf galaxies, we find that the number density of dwarf galaxies evolved from TDGs since 12 Gyr ago is about . From the local galaxy mass function (Bell et al., 2003), we obtain that dwarf galaxies with have a number density of about in the local universe. This means that about per cent of dwarf galaxies are contributed by TDGs. Considering that half of the merging galaxies have long tidal tails and not all of the merging systems can produce TDGs (Bournaud & Duc, 2006; Wen & Zheng, 2016), we estimate that per cent of dwarf galaxies are of tidal origin. This is consistent with the result given in Wen et al. (2012). Such a low production rate indicates that the tidally-originated dwarf galaxies do not represent a significant fraction of the dwarf population in the same stellar mass regime.
We denote that most of the TDGs are associated with curved (85/165) and straight (55/165) tails. Interestingly, about half of TDGs are located at the tip of their host tails. We compare the tidal tails hosting TDGs with those containing no TDGs, finding no systematic difference in their properties. We suspect that gas fraction might be important for triggering the formation of TDGs (e.g., Duc, Bournaud & Masset, 2004). Our current investigation is unable to tell the reasons why some tidal tails can form TDGs at the tip while the others do not. Simulations of galaxy mergers can help to understand the formation mechanisms of TDGs.
TDGs are believed to contain little dark matter because of their tidal origin (Bournaud & Duc, 2006). Our TDGs have spherical-like morphologies with stellar mass mostly in the range of and half-light radius around kpc. Our results show that TDGs follow the mass-size relation of ellipticals and spheroids in the same stellar mass range (Figure 8). This coincidence suggests that at the low-mass end the central part of ellipticals and spheroids are likely dominated by the baryonic matter. In addition, our results reveal that the average surface brightness profile of TDGs is globally flatter than that of disc galaxies. We suspect that TDGs in our sample are still in the formation process and not dynamically relaxed yet, making them even more extended than disc galaxies. It is worth noting that the properties of TDGs, i.e., relatively small size and low Sérsic index, are similar to those of high- star-forming galaxies. TDGs could be thus used to explore the physical processes of rapid star formation that more often occur in high- galaxies.
Recently, some UDGs were claimed to be dominated by baryonic matter and possibly tidal originated. We examine our TDGs to see if some of them could be the UDG candidates. We note that UDGs are defined to have 1.5 kpc and the central surface brightness of 24 26 mag arcsec-2 (e.g. Koda et al., 2015; Shi et al., 2017). In our sample of 165 TDGs, there are only 10 with kpc. Their central surface brightness are, however, at least two magnitudes brighter than that of UDGs. Indeed, the limiting surface brightness of the COSMOS HST imaging data does not allow us to detect UDGs associated with our sample LTTGs. On the other hand, all of the TDGs on tidal tails are likely forming new stars through attracting surrounding gas and thus show a high brightness temporarily. We cannot deny the possibility that at least some of the 10 extended UDGs would fade dramatically and satisfy the criteria for being UDGs. This is supported by the finding that some old TDGs exhibit properties similar to those of UDGs (e.g., Duc et al., 2014).
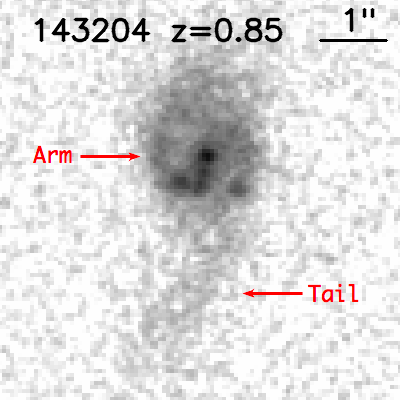
4.4 Spiral Arms and Curved Tails
Spiral arms in (barred) disc galaxies, in particular the “loose” ones, appear like curved tails and might contaminate our sample. We argue that the contamination is marginal and our results are not affected. Our sample galaxies are selected to have disturbed morphologies with strong tidal features in the outskirts. As shown in Figure 2, 4 and 5, the long tidal tails in these galaxies are asymmetric and extended. We also check all 461 LTTGs and pick up these with arm structures. Figure 13 shows the HST images of four sample galaxies with the least disturbed spiral arms. Both spiral arms and tidal tails can be seen in these galaxies. The spiral arms are symmetric and closely linked with the core of the host galaxies. In contrast, the tidal tails are diffuse and more extended. In some merging pairs of galaxies with "loose” spiral arms, tidal forces may drive the arms open and turn them into curved tails. This mechanism does not require strong tidal forces to break the original disc structures, likely responsible for part of the curved tails in galaxy pairs with nuclear separation distance kpc.
5 Conclusions
Using HST/ACS F814W imaging data in conjunction with publicly-available multi-wavelength data in the COSMOS field, we analyse the morphological properties for a sample of 461 merging galaxies with long tidal tails. We summarize our results as follows:
-
•
Of 461 LTTGs, 91 (21 per cent) are single-nucleus merging galaxies, 90 (20 per cent) are partially-coalesced with nuclear separation distance kpc, 128 (28 per cent) are close pairs with kpc, and 145 (31 per cent) are galaxy pairs with kpc. Comparison of our sample galaxies with simulations suggests that long tidal tails are mostly generated in prograde galaxy mergers.
-
•
The long tidal tails can be classified mainly into three shape types: straight, curved and plume. Our sample consists of 192 (41 per cent) LTTGs with straight tails, 213 (47 per cent) with curved tails, and 56 (12 per cent) with plume tails. We find that the curved tails viewed edge-on may be responsible for only a small fraction of the straight tails. It remains to be understood how galaxies merge to generate straight tails at such a high rate. We argue that the shape of tidal tails is generally coupled with the stage of merging processes although it also relies on the merger parameters.
-
•
We identify 177 clumps from all long tidal tails of our 461 merging galaxies. Of them, 165 are classified as tidal dwarf galaxies residing in 126 host merging galaxies, yielding a production rate of 0.36. We estimate that 5 per cent of local dwarf galaxies are tidally originated. Our results show that most of the TDGs are associated with curved (85/165) and straight (55/165) tails. More than half of TDGs are located at the tip of their host tails.
-
•
We find that TDGs follow the mass-size relation of local elliptical galaxies over M, while their surface brightness profiles appear statistically flatter than an exponential disc. These indicate that TDGs are still in the formation process, make them analogous objects for studying rapid star formation that commonly occur in high- star-forming galaxies.
Data availability
The data underlying this article are available in the article and in its online supplementary material.
Acknowledgements
We thank the anonymous referee for her/his useful comments and suggestions that improved this manuscript. This work is supported by the National Key Research and Development Program of China (2017YFA0402703), and the National Science Foundation of China (11773076, 11703092, 12073078), and the Chinese Academy of Sciences (CAS) through a China-Chile Joint Research Fund (CCJRF #1809) administered by the CAS South America Centre for Astronomy (CASSACA). DVG gratefully acknowledges the support from the CAS President’s International Fellowship Initiative (PIFI) visiting scientists program (2019VMA0003).
References
- Bahcall et al. (1997) Bahcall J. N., Kirhakos S., Saxe D. H., Schneider D. P., 1997, ApJ, 479, 642
- Barnes (1992) Barnes J. E., 1992, ApJ, 393, 484
- Barnes (2016) Barnes J. E., 2016, MNRAS, 455, 1957
- Barnes & Hernquist (1992) Barnes J. E., Hernquist L., 1992, Natur, 360, 715
- Barrows et al. (2017) Barrows R. S., Comerford J. M., Zakamska N. L., Cooper M. C., 2017, ApJ, 850, 27
- Bell et al. (2003) Bell E. F., McIntosh D. H., Katz N., et al., 2003, ApJS, 149, 289
- Bell et al. (2006) Bell E. F., Naab T., McIntosh D. H., et al., 2006, ApJ, 640, 241
- Bell et al. (2017) Bell E. F., Monachesi A., Harmsen B., et al., 2017, ApJ, 837L, 8
- Bluck et al. (2012) Bluck A. F. L., Conselice C. J., Buitrago F., Grützbauch R., Hoyos C., Mortlock A., Bauer A. E., 2012, ApJ, 747, 34
- Bournaud, Duc & Masset (2003) Bournaud F., Duc P.-A., Masset F., 2003, A&A, 411, 1
- Bournaud & Duc (2004) Bournaud F., Duc P.-A., et al., 2004, A&A, 425, 813
- Bournaud, Jog & Combes (2005) Bournaud F., Jog C. J., Combes F., 2005, A&A, 437, 69
- Bournaud & Duc (2006) Bournaud F., Duc P.-A., 2006, A&A, 456, 481
- Bournaud et al. (2011) Bournaud F., Chapon D., Teyssier R., et al., 2011, ApJ, 730, 4
- Bundy et al. (2009) Bundy K., Fukugita M., Ellis R. S., Targett T. A., Belli S., Kodama T., 2009, ApJ, 697, 1369
- Capak et al. (2007) Capak P., Aussel H., Ajiki M., et al., 2007, ApJS, 172, 99
- Chilingarian et al. (2010) Chilingarian I. V., Di Matteo P., et al., 2010, A&A, 518, 61
- Conselice et al. (2003a) Conselice C. J., Gallagher J. S. III, Wyse, R. F.G., 2003, AJ, 125, 66
- Conselice et al. (2003b) Conselice C. J., Bershady M. A., Dickinson M., Papovich C., 2003, AJ, 126, 1183
- Cui et al. (2001) Cui J., Xia X-Y, Deng Z-G, et al., 2001, AJ, 122, 63
- Dabringhausen & Kroupa (2013) Dabringhausen J., Kroupa P., 2013, MNRAS, 429, 1858
- Darg et al. (2010) Darg D. W., Kaviraj S., Lintott C. J., et al., 2010, MNRAS, 401, 1552
- De Propris et al. (2014) De Propris R., Baldry I. K., Bland-Hawthorn J., et al., 2014, MNRAS, 444, 2200
- Dubinski, Mihos & Hernquist (1996) Dubinski J., Mihos J. C., Hernquist L., 1996, ApJ, 462, 576
- Duc, Bournaud & Masset (2004) Duc P.-A., Bournaud F., Masset F., 2004, A&A, 427, 803
- Duc et al. (2000) Duc P.-A., Brinks E., Springel V., Pichardo B., Weilbacher P., Mirabel I. F., 2000, AJ, 120, 1238
- Duc & Mirabel (1998) Duc P.-A., Mirabel I. F., 1998, A&A, 333, 813
- Duc et al. (2015) Duc P.-A., Cuillandre J.-C., Karabal E., et al., 2015, MNRAS, 446, 120
- Duc et al. (2014) Duc P.-A., Paudel S., McDermid R. M., Cuillandre J.-C., Serra P., Bournaud F., Cappellari M., Emsellem E., 2014, MNRAS, 440, 1458
- Duc & Renaud (2013) Duc P.-A., Renaud F., 2013, LNP, 861, 327
- Ellison et al. (2013) Ellison S. L., Mendel J. T., Patton D. R., Scudder J. M., 2013, MNRAS, 435, 3627
- Fakhouri, Ma & Boylan-Kolchin (2010) Fakhouri O., Ma C.-P., Boylan-Kolchin M., 2010, MNRAS, 406, 2267
- Gargiulo et al. (2019) Gargiulo I. D., Monachesi A., Gómez F. A., et al., 2019, MNRAS, 489, 5742
- Genzel et al. (2001) Genzel R., Tacconi L. J., Rigopoulou D., Lutz D., Tecza M., 2001, ApJ, 563, 527
- Gong et al. (2019) Gong Y., Liu X. K., Cao Y., et al., 2019, ApJ, 883, 203
- Hancock et al. (2009) Hancock M., Smith B. J., Struck C., Giroux M. L., Hurlock S., 2009, AJ, 137, 4643
- Hilz, Naab & Ostriker (2013) Hilz M., Naab T., Ostriker J. P., 2013, MNRAS, 429, 2924
- Hood et al. (2018) Hood C. E., Kannappan S. J., Stark D. V., Dell’Antonio I. P., Moffett A. J., Eckert K. D., Norris M. A., Hendel D., 2018, ApJ, 857, 144
- Hopkins et al. (2010a) Hopkins P. F., Bundy K., Croton D., et al., 2010a, ApJ, 715, 202
- Hopkins et al. (2007) Hopkins P. F., Bundy K., Hernquist L., Ellis R. S., 2007, ApJ, 659, 976
- Hopkins et al. (2009) Hopkins P. F., Cox T. J., Younger J. D., Hernquist L., 2009, ApJ, 691, 1168
- Hopkins et al. (2010b) Hopkins P. F., Croton D., Bundy K., et al., 2010b, ApJ, 724, 915
- Hopkins et al. (2006) Hopkins P. F., Hernquist L., Cox T. J., Di Matteo T., Robertson B., Springel V., 2006, ApJS, 163, 1
- Ji, Peirani & Yi (2014) Ji I., Peirani S., Yi S. K., 2014, A&A, 566, A97
- Jogee et al. (2009) Jogee S., Miller S. H., Penner K., et al., 2009, ApJ, 697, 1971
- Kado-Fong et al. (2018) Kado-Fong E., Greene J. E., Hendel D., et al., 2018, ApJ, 866, 103
- Kauffmann et al. (2003) Kauffmann G., Heckman T. M., White S. D. M., et al., 2003, MNRAS, 341, 54
- Kaviraj (2014) Kaviraj S., 2014, MNRAS, 437, L41
- Kaviraj et al. (2012) Kaviraj S., Darg D., Lintott C., Schawinski K., Silk J., 2012, MNRAS, 419, 70
- Koda et al. (2015) Koda J., Yagi M., et al., 2015, ApJ, 807, L2
- Koekemoer et al. (2007) Koekemoer A. M., Aussel H., et al., 2007, ApJS, 172, 196
- Laigle et al. (2016) Laigle C., et al., 2016, ApJS, 224, 24
- Lange et al. (2016) Lange R., Moffett A. J., Driver S. P., et al., 2016, MNRAS, 462, 1470
- Laureijs et al. (2011) Laureijs R., Amiaux J., Arduini S., et al., 2011, arXiv: 1110.3193
- Leauthaud et al. (2007) Leauthaud A., Massey R., Kneib J.-P., et al., 2007, ApJS, 172, 219
- Lin et al. (2004) Lin L., Koo D. C., Willmer C. N. A., et al., 2004, ApJ, 617, L9
- Lin et al. (2008) Lin L., Patton D. R., Koo D. C., et al., 2008, ApJ, 681, 232
- Lin et al. (2013) Lin Y.-T., Brodwin M., Gonzalez A. H., Bode P., Eisenhardt P. R. M., Stanford S. A., Vikhlinin A., 2013, ApJ, 771, 61
- Lotz et al. (2008a) Lotz J. M., Davis M., Faber S. M., et al., 2008a, ApJ, 672, 177
- Lotz et al. (2011) Lotz J. M., Jonsson P., Cox T. J., Croton D., Primack J. R., Somerville R. S., Stewart K., 2011, ApJ, 742, 103
- Lotz et al. (2010) Lotz J. M., Jonsson P., Cox T. J., Primack J. R., 2010a, MNRAS, 404, 575
- Lotz et al. (2008b) Lotz J. M., Jonsson P., Cox T. J., Primack J. R., 2008b, MNRAS, 391, 1137
- Man, Zirm & Toft (2016) Man A. W. S., Zirm A. W., Toft S., 2016, ApJ, 830, 89
- Mantha et al. (2018) Mantha K. B., McIntosh D. H., Brennan R., et al., 2018, MNRAS, 475, 1549
- Martínez-Delgado et al. (2010) Martínez-Delgado D., Gabany R. J., Crawford K., et al., 2010, AJ, 140, 962
- Martin et al. (2017) Martin G., Kaviraj S., Devriendt J. E. G., Dubois Y., Laigle C., Pichon C., 2017, MNRAS, 472, L50
- Martin et al. (2018) Martin G., Kaviraj S., Devriendt J. E. G., Dubois Y., Pichon C., 2018, MNRAS, 480, 2266
- Mateo (1998) Mateo M. L., 1998, ARA&A, 36, 435
- Mihos & Hernquist (1996) Mihos J. C., Hernquist L., 1996, ApJ, 464, 641
- Mohamed, Reshetnikov & Sotnikova (2011) Mohamed Y. H., Reshetnikov V. P., Sotnikova N. Y., 2011, AstL, 37, 670
- Monreal-Ibero et al. (2007) Monreal-Ibero A., Colina L., Arribas S., García-Marín M., 2007, A&A, 472, 421
- Morales et al. (2018) Morales G., Martínez-Delgado D., Grebel E. K., Cooper A. P., Javanmardi B., Miskolczi A., 2018, A&A, 614, A143
- Moustakas et al. (2013) Moustakas J., Coil A. L., Aird J., et al., 2013, ApJ, 767, 50
- Muzzin et al. (2013) Muzzin A., Marchesini D., Stefannon M., et al., 2013, ApJS, 206, 8
- Naab & Burkert (2003) Naab T., Burkert A., 2003, ApJ, 597, 893
- Newman et al. (2012) Newman A. B., Ellis R. S., Bundy K., Treu T., 2012, ApJ, 746, 162
- Oser et al. (2010) Oser L., Ostriker J. P., Naab T., Johansson P. H., Burkert A., 2010, ApJ, 725, 2312
- Ownsworth et al. (2014) Ownsworth J. R., Conselice C. J., Mortlock A., Hartley W. G., Almaini O., Duncan K., Mundy C. J., 2014, MNRAS, 445, 2198
- Patton et al. (2002) Patton D. R., Pritchet C. J., Carlberg R. G., et al., 2002, ApJ, 565, 208
- Ploeckinger et al. (2018) Ploeckinger S., Sharma K., Schaye J., Crain R. A., Schaller M., Barber C., 2018, MNRAS, 474, 580
- Ricci et al. (2017) Ricci C., Bauer F. E., Treister E., et al., 2017, MNRAS, 468, 1273
- Robaina et al. (2009) Robaina A. R., Bell E. F., Skelton R. E., et al., 2009, ApJ, 704, 324
- Robertson et al. (2006) Robertson B., Bullock J. S., Cox T. J., Di Matteo T., Hernquist L., Springel V., Yoshida N., 2006, ApJ, 645, 986
- Rodriguez-Gomez et al. (2015) Rodriguez-Gomez V., Genel S., Vogelsberger M., et al., 2015, MNRAS, 449, 49 models
- Rodriguez-Gomez et al. (2016) Rodriguez-Gomez V., Pillepich A., Sales L. V., et al., 2016, MNRAS, 458, 2371
- Roman & Trujillo (2017) Roman J., Trujillon I.,2017, MNRAS, 468, 4039
- Sanders & Mirabel (1996) Sanders D. B., Mirabel I. F., 1996, ARA&A, 34, 749
- Sanders et al. (1988) Sanders D. B., Soifer B. T., Elias J. H., Madore B. F., Matthews K., Neugebauer G., Scoville N. Z., 1988, ApJ, 325, 74
- Shi et al. (2017) Shi D. D., Zheng X. Z., Zhao H. B., et al., 2017, ApJ, 846, 26
- Shimasaku et al. (2001) Shimasaku K., Fukugita M., Doi M., et al., 2001, AJ, 122, 1238
- Springel & White (1999) Springel V., White S. D. M., 1999, MNRAS, 307, 162
- Stewart et al. (2009) Stewart K. R., Bullock J. S., Barton E. J., Wechsler R. H., 2009, ApJ, 702, 1005
- Strateva et al. (2001) Strateva I., Ivezic Z., Knapp G. R., et al., 2001, AJ, 122, 1861S
- Struck & Smith (2012) Struck C., Smith B. J., 2012, MNRAS, 422, 2444
- Teyssier, Chapon & Bournaud (2010) Teyssier R., Chapon D., Bournaud F., 2010, ApJ, 720, L149
- Thorp et al. (2019) Thorp M. D., Ellison S. L., Simard L., Sánchez S. F., Antonio B., 2019, MNRAS, 482, L55
- Toomre & Toomre (1972) Toomre A., Toomre J., 1972, ApJ, 178, 623
- Treister et al. (2012) Treister E., Schawinski K., Urry C. M., Simmons B. D., 2012, ApJ, 758, L39
- Valls-Gabaud et al. (2017) Valls-Gabaud D., MESSIER Collaboration, 2017, IAU Symposium 321, 199
- van Dokkum (2005) van Dokkum P. G., 2005, AJ, 130, 2647
- Welker et al. (2014) Welker C., Devriendt J., Dubois Y., Pichon C., Peirani S., 2014, MNRAS, 445, L46
- Wen et al. (2012) Wen Z.-Z., Zheng X.-Z., Zhao Y.-H., Gao Y., 2012, Ap&SS, 337, 729
- Wen & Zheng (2016) Wen Z. Z., Zheng X. Z., 2016, ApJ, 832, 90
- Wen, Zheng & An (2014) Wen Z. Z., Zheng X. Z., An F. X., 2014, ApJ, 787, 130
- Wetzstein, Naab & Burkert (2007) Wetzstein M., Naab T., Burkert A., 2007, MNRAS, 375, 805
- White & Frenk (1991) White S. D. M., Frenk C. S., 1991, ApJ, 379, 52
- Xu et al. (2012) Xu C. K., Zhao Y., Scoville N., Capak P., Drory N., Gao Y., 2012, ApJ, 747, 85
- Yang et al. (2014) Yang Y., Hammer F., Fouquet S., Flores H., Puech M., Pawlowski M. S., Kroupa P., 2014, MNRAS, 442, 2419