The First Robust Constraints on the Relationship Between Dust-to-Gas Ratio and Metallicity in Luminous Star-forming Galaxies at High Redshift11affiliation: Based on data obtained at the W.M. Keck Observatory, which is operated as a scientific partnership among the California Institute of Technology, the University of California, and the National Aeronautics and Space Administration, and was made possible by the generous financial support of the W.M. Keck Foundation.
Abstract
We present rest-optical spectroscopic properties of a sample of four galaxies in the Atacama Large Millimeter/submillimeter Array Hubble Ultra Deep Field (ALMA HUDF). These galaxies span the redshift range and the stellar mass range . They have existing far-infrared and radio measurements of dust-continuum and molecular gas emission from which bolometric star-formation rates (SFRs), dust masses, and molecular gas masses have been estimated. We use new - and -band near-infrared spectra from the Keck/MOSFIRE spectrograph to estimate SFRs from dust-corrected H emission (SFR(H)) and gas-phase oxygen abundances from the ratio [NII]/H. We find that the dust-corrected SFR(H) is systematically lower than the bolometric SFR by a factor of several, and measure gas-phase oxygen abundances in a narrow range, (). Relative to a large comparison sample from the MOSDEF survey, the ALMA HUDF galaxies scatter roughly symmetrically around the best-fit linear mass-metallicity relation, providing tentative evidence for a flattening in the SFR dependence of metallicity at high stellar mass. Combining oxygen abundances with estimates of dust and molecular gas masses, we show that there is no significant evolution in the normalization of the dust-to-gas ratio DGR vs. metallicity relation from to . This result is consistent with some semi-analytic models and cosmological simulations describing the evolution of dust in galaxies. Tracing the actual form of the DGR vs. metallicity relation at high redshift now requires combined measurements of dust, gas, and metallicity over a significantly wider range in metallicity.
Subject headings:
galaxies: evolution — galaxies: high-redshift — galaxies: ISM1. Introduction
Dust is a key component of the interstellar medium (ISM), modulating interstellar chemistry and thermodynamics. Dust also plays an important role in the observed properties of galaxies over cosmic time, given that dust grains absorb ultraviolet and optical starlight and reradiate it at longer wavelengths. Indeed, our census of the star-formation rate (SFR) density of the universe as a function of redshift is highly incomplete unless we include the fraction of star formation obscured by dust (e.g., Madau & Dickinson 2014). Of particular interest is the co-evolution of the dust and metal content of galaxies, which constrains models of the formation and destruction of dust grains, and the overall chemical enrichment of galaxies (e.g., Feldmann 2015; Popping et al. 2017; McKinnon et al. 2017; Li et al. 2019; Hou et al. 2019).
In particular, the dust-to-gas ratio (defined as dust mass divided by gas mass, hereafter DGR) has been shown to scale with gas-phase oxgyen abundance in the local universe (Rémy-Ruyer et al. 2014; De Vis et al. 2019). Regardless of the specific form used to fit this relationship (broken or single power-law), it is shown that galaxies at lower metallicities ( have a lower ratio of dust to metals than more metal-rich galaxies. This scaling relationship can be interpreted in terms of dust grain growth in the ISM as galaxies evolve from lower to higher metallicity (Popping et al. 2017). Both semi-analytic models and numerical simulations have been used to describe the form and evolution of the DGR vs. metallicity relationship over a wide range of redshift. While Popping et al. (2017), Li et al. (2019) and Triani et al. (2020) predict very little evolution in the DGR vs. metallicity relationship out to , Hou et al. (2019) predict that the DGR should be detectably lower at fixed metallicity by . Although robust DGR and gas-phase metallicities have been assembled for hundreds of galaxies, the corresponding measurements at do not exist.
Sensitive Atacama Large Millimeter/submillimeter Array (ALMA) and Karl G. Jansky Very Large Array (VLA) observations of dust continuum and molecular gas emission in the Hubble Ultra Deep Field (HUDF; Dunlop et al. 2017; Aravena et al. 2020; Riechers et al. 2020) enable DGR estimates for luminous star-forming galaxies out to . Here we present additional measurements of robust gas-phase metallicities based on rest-optical spectroscopy, and therefore provide the first constraints on the DGR vs. metallicity relationship in luminous star-forming galaxies at . We also compare dust-corrected rest-optical and bolometric measurements of SFR, directly quantifying the importance of obscured star formation in our sample. In Section 2, we present the ALMA HUDF sample, and both existing and new observations. Section 3 contains our results on SFR, metallicity, and the DGR vs. metallicity relation. We conclude in Section 4 with a discussion of the implications of these results. Throughout, we assume a CDM cosmology with km s-1 Mpc-1, , and .
2. Sample and Observations
2.1. ALMA HUDF Sample and Multi-wavelength Observations
We analyze a sample of four objects drawn from the ALMA HUDF 1.3 mm survey of Dunlop et al. (2017), which used a 45-pointing mosaic to cover the 4.5 arcmin2 region of the HUDF also imaged by the Hubble Wide Field Camera 3/IR. A total of sixteen 1.3 mm detections were identified in the ALMA HUDF, ranging in redshift from to . This region was subsequently observed by the ALMA Spectroscopic Survey in the Hubble Ultra Deep Field (ASPECS; Walter et al. 2016), which obtained deeper continuum and higher-order CO emission-line observations at 1.2 mm (Aravena et al. 2020), and additional continuum and CO observations at 3.0 mm (González-López et al. 2019). Furthermore, Riechers et al. (2020) performed VLA CO(1-0) observations at mm in the ALMA HUDF.
The HUDF is covered by extensive multi-wavelength observations ranging from radio to X-ray wavelengths. These include multi-wavelength photometry spanning from the visible through mid-IR (i.e., Spitzer/IRAC) range, which can be used to model galaxy stellar populations. To estimate stellar masses, we model photometry from the publicly available catalogs of the 3D-HST survey (Skelton et al. 2014; Momcheva et al. 2016), corrected for contamination by rest-optical emission-line fluxes (Section 2.2).
2.2. MOSFIRE Observations
We used the Multi-object Spectrometer for Infrared Exploration (MOSFIRE; McLean et al. 2012) on the Keck I telescope to obtain moderate-resolution -, and -band rest-optical spectra for the subset of targets from Dunlop et al. (2017) at spectroscopic or photometric redshifts where the strongest rest-optical nebular emission lines fall within windows of atmospheric transmission (, , and ). There were 10 such targets, and we were able to fit 9 of them on a single multi-object slitmask centered at R.A.=03:32:43.00 and decl.=27:46:25.8 (J2000). We observed this mask on 21 October 2018 and 13 January 2019, for a total of 3.2 hours ( seconds) in and 2.0 hours ( seconds) in . The slitwidth was 07, yielding a spectral resolution of in and in . Conditions were partly cloudy on 21 October 2018 and clear on 13 January 2019. The average seeing in both the - and -band spectra was 06.
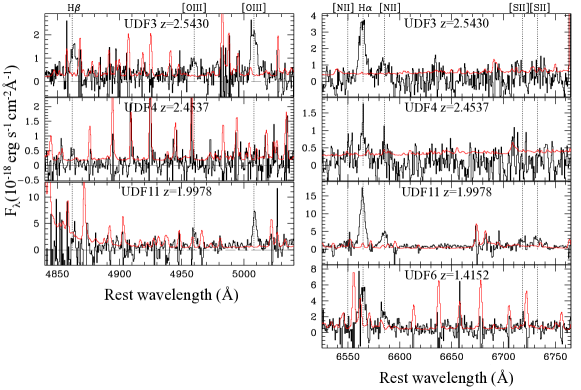
We reduced the raw data to produce two-dimensional science and error spectra using the pipeline described in Kriek et al. (2015), and optimally extracted one-dimensional science and error spectra from the two-dimensional spectra. Flux calibrations and slit-loss corrections for each filter were applied as described in Kriek et al. (2015) and Reddy et al. (2015). Of the 9 sources targeted with MOSFIRE, we measured rest-optical spectroscopic redshifts for five (UDF3, UDF4, UDF6, UDF10, and UDF11), based on fitting Gaussian profiles to the strongest rest-optical emission lines. The remaining four sources, (UDF1, UDF7, UDF13, and UDF15) either have photometric redshifts at the edge of the accessible ranges, such that their unmeasured spectroscopic redshifts may fall just outside the reach of MOSFIRE observations, or CO redshifts (González-López et al. 2019; Aravena et al. 2020) disagreeing with their photometric redshifts such that rest-optical features fall outside windows of atmospheric transmission or in extremely noisy regions of the near-IR transmission windows. The source UDF10 is not recovered in the deeper 1.2 mm map from the ASPECS survey, and removed from further analysis, leaving a final sample of four sources. Spectra for these sources are shown in Figure 1, and their MOSFIRE spectroscopic redshifts and H, [OIII], H, and [NII] line fluxes are listed in Table 1.
| IDaaGalaxy ID in Dunlop et al. (2017). | 3DHST-IDbbID in the 3D-HST v4.1 catalog (Momcheva et al. 2016). | R.A. (J2000)ccCoordinates in the 3D-HST v4.1 catalog (Momcheva et al. 2016). | Decl. (J2000)ccCoordinates in the 3D-HST v4.1 catalog (Momcheva et al. 2016). | ddRedshift from MOSFIRE spectra. | F(H) | F([OIII]) | F(H) | F([NII]) |
|---|---|---|---|---|---|---|---|---|
| (v4.1) | () | () | () | () | ||||
| UDF3 | 29606 | 3:32:38.54 | 27:46:34.04 | 2.5430 | ||||
| UDF4 | 29643 | 3:32:41.02 | 27:46:31.38 | 2.4537 | ||||
| UDF6 | 27881 | 3:32:34.43 | 27:46:59.55 | 1.4152 | ||||
| UDF11 | 24110 | 3:32:40.05 | 27:47:55.44 | 1.9978 |
3. Results
We combine our new MOSFIRE observations with the existing multi-wavelength data in the ALMA HUDF to determine the relationships among stellar populations, gas, dust and metals.
3.1. Stellar Masses and SFRs
We estimated stellar masses by fitting photometry obtained from the 3D-HST photometric catalogs (Skelton et al. 2014; Momcheva et al. 2016) with FAST++, an SED-fitting code written in C++ 111https://github.com/cschreib/fastpp and closely based on the FAST code (Kriek et al. 2009). The Conroy et al. (2009) flexible stellar population synthesis models, a Chabrier (2003) initial mass function (IMF), delayed- star-formation histories, and the Calzetti et al. (2000) dust attenuation curve were assumed. We estimated dust-corrected H SFRs (SFR(H)) for UDF3 and UDF4, which have coverage of both H and H. First we calculated , using the stellar-absorption-corrected H/H Balmer decrement, assuming an intrinsic H/H emission-line ratio of 2.86 and the Cardelli et al. (1989) extinction law. We then used to dust-correct H line fluxes. SFR(H) was then estimated from dust-corrected and slit-loss-corrected H luminosities, based on the calibration of Hao et al. (2011) for a Chabrier (2003) IMF. H falls in the band for UDF6, and in a region of low atmospheric transmission for UDF11. Accordingly, we report uncorrected H SFRs as lower limits for these two galaxies.
An important question is how well dust-corrected H emission traces the bolometric SFR at high redshift. The answer likely depends on the bolometric SFR. While Shivaei et al. (2016) has shown good agreement between dust-corrected SFR(H) and bolometric SFR for a sample of 17 star-forming galaxies at with SFR ranging from (median 74), Chen et al. (2020) show that dust-corrected SFR(H) underpredicts the IR-based (i.e., bolometric) SFR by at least a factor of 3 for a sample of 5 submillimeter galaxies with a median IR-based SFR of . We take “total” SFRs from Dunlop et al. (2017) (SFRtot) as the sum of UV (uncorrected for dust) and far-IR SFRs, and compare them with dust-corrected SFR(H) for UDF3 and UDF4 (shown in Table 2). We find that dust-corrected SFR(H) is a factor of 3.7 and 8.2 lower than SFRtot, respectively, for UDF3 and UDF4, although, because of the large error bars on both sets of measurements, the difference is not highly significant. If confirmed with smaller error bars, such a difference may indicate the contribution of dusty star-forming regions that are opaque to H emission but contribute to the bolometric SFR in the far-IR. UDF3 and UDF4, with SFRtot values ranging from , appear consistent with the results of Chen et al. (2020), although a larger sample of star-forming galaxies spanning a wide range in SFR is needed, covered by measurements of H, H and IR-based tracers of bolometric luminosity.
| ID | SFRtotaa“Total” SFR estimated from the sum of far-IR and UV emission, from Table 4 of Dunlop et al. (2017). | SFR(H)bbDust-corrected H SFR. For UDF3 and UDF4, the Balmer decrement is inferred from H and H. H is not covered for UDF6 and UDF11, so the uncorrected H SFR is listed as a lower limit. | ccGas-phase oxygen abundance based on the linear N2 indicator (Pettini & Pagel 2004). | ddALMA 1.2 mm and 3.0 mm fluxes from the ASPECS survey (Aravena et al. 2020). | ddALMA 1.2 mm and 3.0 mm fluxes from the ASPECS survey (Aravena et al. 2020). | eeDust mass in units of , based on either or , assuming an optically-thin modified blackbody function, and dust temperature, K. | eeDust mass in units of , based on either or , assuming an optically-thin modified blackbody function, and dust temperature, K. | ffMolecular gas mass in units of . for UDF3 and UDF4 are taken from Riechers et al. (2020), based on CO(1-0) luminosities, while those for UDF6 and UDF11 come from Aravena et al. (2020), based on higher-order CO transitions. | DGR1.2ggDust-to-gas ratio in units of , defined as the ratio between either or and . | DGR3.0ggDust-to-gas ratio in units of , defined as the ratio between either or and . | |
|---|---|---|---|---|---|---|---|---|---|---|---|
| () | () | () | (N2) | (Jy) | (Jy) | () | () | () | () | () | |
| UDF3 | 10.52 | 199.769.0 | 54.0 | 8.64 | 75238 | 324 | 3.24 | 3.61 | 11.62.4 | 2.8 | 3.1 |
| UDF4 | 10.36 | 94.44.0 | 11.5 | 8.68 | 31616 | 234 | 1.39 | 2.61 | 2.40.9 | 5.8 | 10.9 |
| UDF6 | 10.88 | 87.111.0 | 3.7 | 8.69 | 43023 | 2.39 | 10.00.8 | 2.4 | |||
| UDF11 | 10.91 | 168.394.0 | 24.8 | 8.59 | 34234 | 1.69 | 2.00.3 | 8.4 |
3.2. Metallicities
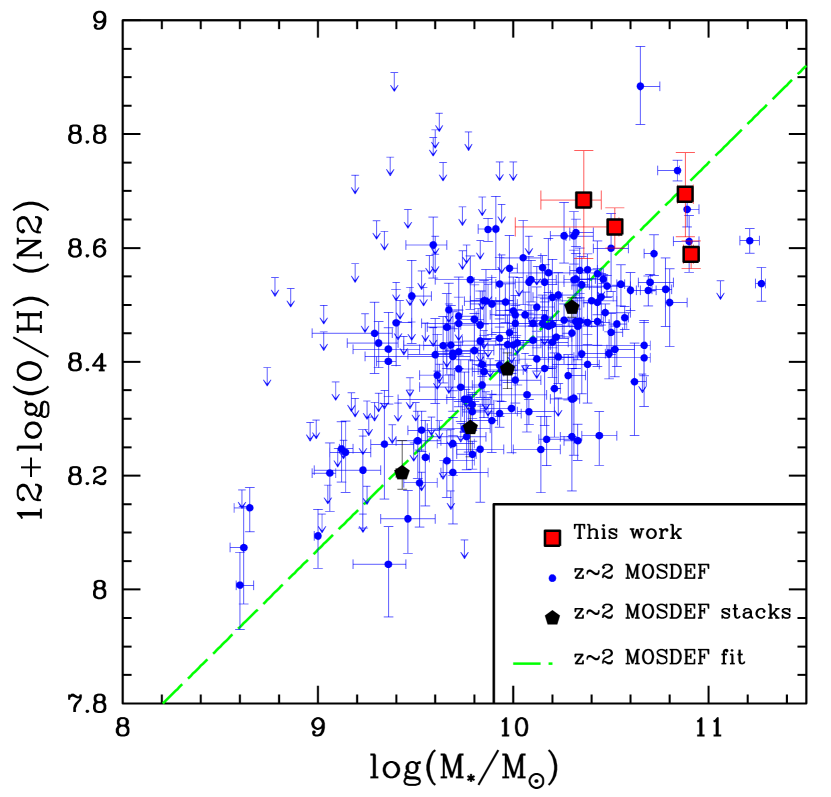
One of the key scaling relations probing the flow of baryons through galaxies is the mass-metallicity relation (MZR), between oxygen abundance and stellar mass. The MZR has been traced from the local universe out to (e.g., Tremonti et al. 2004; Onodera et al. 2016). Since all four ALMA HUDF targets have measurements of the [NII]/H ratio, we use the N2 indicator (N2); Pettini & Pagel 2004) to estimate gas-phase oxygen abundance (Table 2). For the MZR analysis, we apply the linear form of the N2 calibration, . Our sample spans a narrow range of metallicity, from solar, (assuming ; Asplund et al. 2009). For context, in Figure 2 we plot the masses and metallicities of the ALMA HUDF sample alongside those of the star-forming galaxy sample of Sanders et al. (2018) from the MOSDEF survey. MOSDEF galaxies ranging in mass from to are stacked in bins of . These stacked points are plotted as well as their best-fit linear regression (Sanders et al. 2018).
The ALMA HUDF points lie at the massive end of the MOSDEF sample, with only UDF4 overlapping the most massive MOSDEF stack in , and scatter around the best-fit linear MZR relation. Given the observed redshift evolution in the MZR, we restrict the comparison to UDF3, UDF4, and UDF11, all at . According to the “Fundamental Metallicity Relation” (FMR; Mannucci et al. 2010; Andrews & Martini 2013) discovered among galaxies and describing the dependence of metallicity on both and SFR, galaxies with higher-than-average SFR at fixed , lie at lower-than-average metallicity at fixed . Sanders et al. (2018) demonstrated that the FMR holds in this sense for MOSDEF galaxies. In Dunlop et al. (2017), UDF3, UDF4, and UDF11 are shown to have bolometric SFRtot that place them above the SFR vs. main sequence on average, yet we observe no corresponding average offset below the MZR.
At the same time, there is evidence that at the highest masses () in the local universe, the SFR dependence in the FMR reverses, such that galaxies with higher-than-average SFRs have higher-than-average metallicities (Yates et al. 2012). This high-mass regime, in which most of the ALMA HUDF targets lie, is currently poorly sampled in the MOSDEF dataset. A larger sample of high-mass galaxies with metallicity measurements spanning a wide range in bolometric SFRs is therefore needed to place the the masses, metallicities, and SFRs of the ALMA HUDF sample in context. We mention one final possibility, which is AGN contamination boosting the observed [NII]/H ratios. UDF3 is identified as a radio-loud AGN in Dunlop et al. (2017), yet its [OIII]/H and [NII]/H ratios (Table 1) place it well within the distribution of MOSDEF star-forming galaxies in the [OIII]/H vs. [NII]/H “BPT” diagram (Shapley et al. 2019). Spatially-resolved integral-field unit spectroscopic observations may address the question of AGN contamination.
3.3. The Relationship Between DGR and Metallicity
The unique aspect of the dataset analyzed here is the combination of both dust and gas masses drawn from the literature with new gas-phase oxygen abundance measurements. This combined dataset enables us to investigate, for the first time, the relationship between DGR and metallicity at .
Given the greater depth of the ASPECS 1.2 mm observations, we use these measurements to infer dust masses instead of the original 1.3 mm measurements from Dunlop et al. (2017). For the two sources in our sample with ASPECS 3.0 mm measurements (UDF3 and UDF4), we also use these longer-wavelength continuum observations as independent proxies for dust mass. To translate 1.2 and 3.0 mm flux densities ( and ) into dust masses, we assume an optically-thin modified blackbody function (e.g., Hughes et al. 1997), which yields:
| (1) |
where is the observed-frame mm-wave flux density probing the Rayleigh-Jeans tail of a modified blackbody; is the dust mass absorption coefficient at frequency, , with a functional form , and is the opacity at 850 m. Following recent work by Liang et al. (e.g., 2019), we adopt and . is the Planck function, and is the luminosity distance to redshift, . For estimating dust mass, we also assume a dust temperature of K (McLure et al. 2018).
We further assume that the gas mass is well-approximated by the molecular gas mass, as is standard for star-forming galaxies (Tacconi et al. 2018), and take from the literature. Riechers et al. (2020) present for UDF3 and UDF4 based on CO(1-0) measurements, while Aravena et al. (2020) present for UDF6 and UDF11 based on higher-order CO transitions, using the average CO excitation properties of the ASPECS sample (Boogaard et al. 2020) to convert to CO(1-0). In all cases, is assumed to convert CO(1-0) luminosity to . To estimate DGR, we simply take the ratio of and . and , along with , , and DGR, are listed in Table 2.
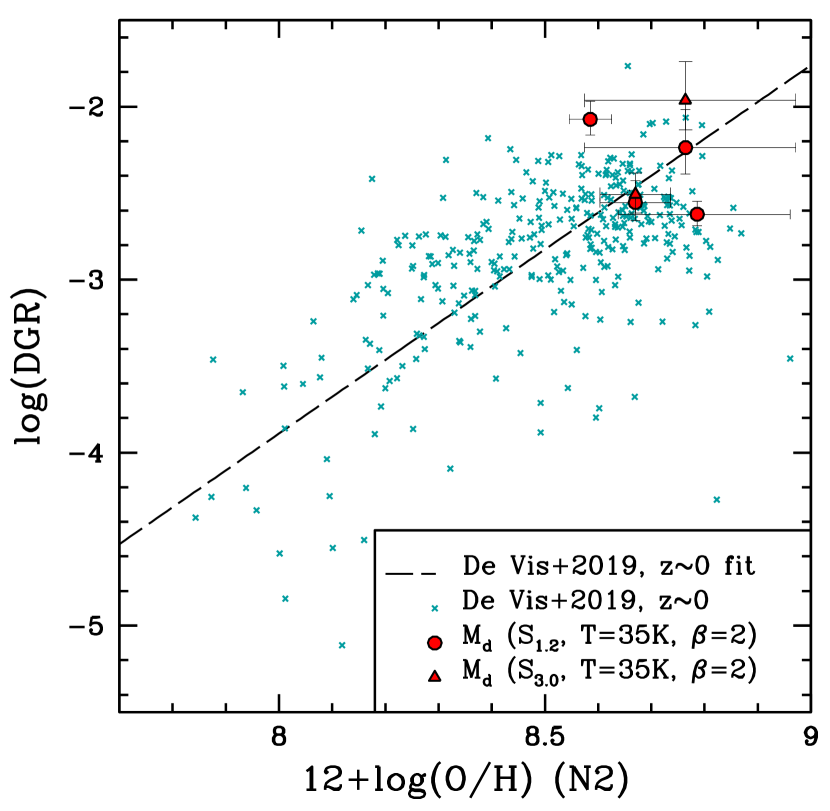
We aim to compare the relationship between DGR and for the ALMA HUDF sample and the corresponding relationship in the local universe. Most recently, De Vis et al. (2019) compiled metallicity and DGR measurements for 466 galaxies drawn from the local Dustpedia sample (Davies et al. 2017). for Dustpedia galaxies was obtained from fitting multi-wavelength photometry spanning from the UV through the microwave. was estimated as the sum of atomic and molecular gas , based on literature measurements of and an assumed relationship for as a function of . Using literature and VLT/MUSE optical emission-line spectra, De Vis et al. (2019) determined global galaxy metallicities for a number of different strong-line metallicity calibrations. These authors present best-fit linear regressions for DGR vs. metallicity for each metallicity calibration, including N2 (Pettini & Pagel 2004). In detail, De Vis et al. (2019) used the cubic form of the N2 calibration, , and fit a subsample of 368 late-type galaxies with , , and N2 measurements. For a consistent comparison, we apply the cubic N2 calibration here to the ALMA HUDF sample, which yields slightly higher values (on average 0.05 dex) than the linear calibration within the N2 range spanned by the ALMA HUDF sample. However, this comparison does not account for potential biases in the N2 metallicity calibration at high redshift due to evolving H II region physical conditions (Steidel et al. 2014; Sanders et al. 2015; Shapley et al. 2015).
As shown in Figure 3, we find that the DGRs for the ALMA HUDF sample based on scatter around the local relation, with median DGR1.2 within 0.04 dex of the DGR predicted by De Vis et al. (2019) for the sample median metallicity. DGR3.0 values for UDF3 and UDF4 are systematically higher, though consistent with the corresponding DGR1.2 estimates. Unlike the local sample, the ALMA HUDF galaxies in the plot span only a very narrow range in (i.e., 0.2 dex, at roughly solar metallicity). Accordingly, it is not possible to determine the slope of the DGR vs. metallicity relation at . However, at solar metallicity, there is robust evidence that the relationship between DGR and remains constant from to .
4. Discussion
We have shown that the normalization of the DGR vs. metallicity relation at solar metallicity does not significantly evolve between and . Such a lack of evolution is consistent with results at similar redshifts based on highly complementary measurements of the dust, gas, and metal content of damped Ly systems (Péroux & Howk 2020) and star-forming regions probed by gamma-ray-burst afterglow spectroscopy (Zafar et al. 2011). It is also consistent with the predictions of the semi-analytic models of Popping et al. (2017) and the SIMBA cosmological simulations (Li et al. 2019), in which galaxies evolve along the DGR vs. metallicity relationship as a function of time. At the same time, the simulations of Hou et al. (2019) predict measurable evolution towards lower DGR at fixed metallicity, as redshift increases. Accordingly, along with measures of the co-evolution of the dust and stellar mass content of galaxies (e.g., Donevski et al. 2020), evolutionary measures of the DGR vs. metallicity relation have discriminating power among the descriptions of dust grain production and destruction over cosmic time in galaxy formation simulations. Given the narrow range in metallicity spanned by the ALMA HUDF sample, however, we have no information on the form of the DGR vs. metallicity relation at . Future observations extending down towards lower metallicities and stellar masses – and correspondingly fainter ALMA dust continuum and CO flux levels – will be required to determine the slope and scatter of the high-redshift DGR vs. metallicity relationship, and compare with model predictions.
Assuming that not only the normalization but also the form of the DGR vs. metallicity relationship remains constant to , we can infer the DGRs of high-redshift galaxies based on more easily obtained rest-optical spectroscopic measurements of gas-phase metallicity. Such DGR estimates can be used to explain the relative invariance out to in both the dust attenuation at 1600Å () and fraction of star formation that is obscured () at fixed galaxy (e.g., Whitaker et al. 2017; McLure et al. 2018; Cullen et al. 2018). The invariance of these relations is striking, given the strong redshift evolution in galaxy properties at fixed such as gas fraction and metallicity (Sanders et al. 2018; Tacconi et al. 2020). These properties modulate dust attenuation, which depends on both dust column density and wavelength-dependent opacity. More quantitatively, we can express as a function of basic ISM properties as follows:
| (2) |
where is the dust opacity at 1600Å in units of m, and is the gas surface density, which can be inferred from inverting the Kennicutt-Schmidt star-formation law. In future work, we will investigate whether lower DGRs and higher at high redshift cancel out to keep and roughly constant at fixed – or whether , which encodes the properties of dust grains themselves, must evolve as well to explain the observations.
Acknowledgements
We acknowledge support from a NASA contract supporting the “WFIRST Extragalactic Potential Observations (EXPO) Science Investigation Team” (15-WFIRST15-0004), administered by GSFC, and the support of the UK Science and Technologies Facilities Council. We benefitted from useful conversations with Ian Smail, Desika Narayanan, and Qi Li. We warmly acknowledge Pieter de Vis, for sharing the Dustpedia dust-to-gas ratios and metallicity measurements. We finally wish to extend special thanks to those of Hawaiian ancestry on whose sacred mountain we are privileged to be guests.
References
- Andrews & Martini (2013) Andrews, B. H., & Martini, P. 2013, ApJ, 765, 140
- Aravena et al. (2020) Aravena, M., Boogaard, L., Gónzalez-López, J., et al. 2020, ApJ, 901, 79
- Asplund et al. (2009) Asplund, M., Grevesse, N., Sauval, A. J., & Scott, P. 2009, ARA&A, 47, 481
- Boogaard et al. (2020) Boogaard, L. A., van der Werf, P., Weiß, A., et al. 2020, arXiv e-prints, arXiv:2009.04348
- Calzetti et al. (2000) Calzetti, D., Armus, L., Bohlin, R. C., et al. 2000, ApJ, 533, 682
- Cardelli et al. (1989) Cardelli, J. A., Clayton, G. C., & Mathis, J. S. 1989, ApJ, 345, 245
- Chabrier (2003) Chabrier, G. 2003, PASP, 115, 763
- Chen et al. (2020) Chen, C.-C., Harrison, C. M., Smail, I., et al. 2020, A&A, 635, A119
- Conroy et al. (2009) Conroy, C., Gunn, J. E., & White, M. 2009, ApJ, 699, 486
- Cullen et al. (2018) Cullen, F., McLure, R. J., Khochfar, S., et al. 2018, MNRAS, 476, 3218
- Davies et al. (2017) Davies, J. I., Baes, M., Bianchi, S., et al. 2017, PASP, 129, 044102
- De Vis et al. (2019) De Vis, P., Jones, A., Viaene, S., et al. 2019, A&A, 623, A5
- Donevski et al. (2020) Donevski, D., Lapi, A., Małek, K., et al. 2020, arXiv e-prints, arXiv:2008.09995
- Dunlop et al. (2017) Dunlop, J. S., McLure, R. J., Biggs, A. D., et al. 2017, MNRAS, 466, 861
- Feldmann (2015) Feldmann, R. 2015, MNRAS, 449, 3274
- González-López et al. (2019) González-López, J., Decarli, R., Pavesi, R., et al. 2019, ApJ, 882, 139
- Hao et al. (2011) Hao, C.-N., Kennicutt, R. C., Johnson, B. D., et al. 2011, ApJ, 741, 124
- Hou et al. (2019) Hou, K.-C., Aoyama, S., Hirashita, H., Nagamine, K., & Shimizu, I. 2019, MNRAS, 485, 1727
- Hughes et al. (1997) Hughes, D. H., Dunlop, J. S., & Rawlings, S. 1997, MNRAS, 289, 766
- Kriek et al. (2009) Kriek, M., van Dokkum, P. G., Labbé, I., et al. 2009, ApJ, 700, 221
- Kriek et al. (2015) Kriek, M., Shapley, A. E., Reddy, N. A., et al. 2015, ApJS, 218, 15
- Li et al. (2019) Li, Q., Narayanan, D., & Davé, R. 2019, MNRAS, 490, 1425
- Liang et al. (2019) Liang, L., Feldmann, R., Kereš, D., et al. 2019, MNRAS, 489, 1397
- Madau & Dickinson (2014) Madau, P., & Dickinson, M. 2014, ARA&A, 52, 415
- Mannucci et al. (2010) Mannucci, F., Cresci, G., Maiolino, R., Marconi, A., & Gnerucci, A. 2010, MNRAS, 408, 2115
- McKinnon et al. (2017) McKinnon, R., Torrey, P., Vogelsberger, M., Hayward, C. C., & Marinacci, F. 2017, MNRAS, 468, 1505
- McLean et al. (2012) McLean, I. S., Steidel, C. C., Epps, H. W., et al. 2012, in Proc. SPIE, Vol. 8446, Ground-based and Airborne Instrumentation for Astronomy IV, 84460J
- McLure et al. (2018) McLure, R. J., Dunlop, J. S., Cullen, F., et al. 2018, MNRAS, 476, 3991
- Momcheva et al. (2016) Momcheva, I. G., Brammer, G. B., van Dokkum, P. G., et al. 2016, ApJS, 225, 27
- Onodera et al. (2016) Onodera, M., Carollo, C. M., Lilly, S., et al. 2016, ApJ, 822, 42
- Péroux & Howk (2020) Péroux, C., & Howk, J. C. 2020, ARA&A, 58, annurev
- Pettini & Pagel (2004) Pettini, M., & Pagel, B. E. J. 2004, MNRAS, 348, L59
- Popping et al. (2017) Popping, G., Somerville, R. S., & Galametz, M. 2017, MNRAS, 471, 3152
- Reddy et al. (2015) Reddy, N. A., Kriek, M., Shapley, A. E., et al. 2015, ApJ, 806, 259
- Rémy-Ruyer et al. (2014) Rémy-Ruyer, A., Madden, S. C., Galliano, F., et al. 2014, A&A, 563, A31
- Riechers et al. (2020) Riechers, D. A., Boogaard, L. A., Decarli, R., et al. 2020, ApJ, 896, L21
- Sanders et al. (2015) Sanders, R. L., Shapley, A. E., Kriek, M., et al. 2015, ApJ, 799, 138
- Sanders et al. (2018) —. 2018, ApJ, 858, 99
- Shapley et al. (2015) Shapley, A. E., Reddy, N. A., Kriek, M., et al. 2015, ApJ, 801, 88
- Shapley et al. (2019) Shapley, A. E., Sanders, R. L., Shao, P., et al. 2019, ApJ, 881, L35
- Shivaei et al. (2016) Shivaei, I., Kriek, M., Reddy, N. A., et al. 2016, ApJ, 820, L23
- Skelton et al. (2014) Skelton, R. E., Whitaker, K. E., Momcheva, I. G., et al. 2014, ApJS, 214, 24
- Steidel et al. (2014) Steidel, C. C., Rudie, G. C., Strom, A. L., et al. 2014, ApJ, 795, 165
- Tacconi et al. (2020) Tacconi, L. J., Genzel, R., & Sternberg, A. 2020, arXiv e-prints, arXiv:2003.06245
- Tacconi et al. (2018) Tacconi, L. J., Genzel, R., Saintonge, A., et al. 2018, ApJ, 853, 179
- Tremonti et al. (2004) Tremonti, C. A., Heckman, T. M., Kauffmann, G., et al. 2004, ApJ, 613, 898
- Triani et al. (2020) Triani, D. P., Sinha, M., Croton, D. J., Pacifici, C., & Dwek, E. 2020, MNRAS, 493, 2490
- Walter et al. (2016) Walter, F., Decarli, R., Aravena, M., et al. 2016, ApJ, 833, 67
- Whitaker et al. (2017) Whitaker, K. E., Pope, A., Cybulski, R., et al. 2017, ApJ, 850, 208
- Yates et al. (2012) Yates, R. M., Kauffmann, G., & Guo, Q. 2012, MNRAS, 422, 215
- Zafar et al. (2011) Zafar, T., Watson, D., Fynbo, J. P. U., et al. 2011, A&A, 532, A143