New high-frequency radio observations of the Cygnus Loop supernova remnant with the Italian radio telescopes
Abstract
Supernova remnants (SNRs) represent a powerful laboratory to study the Cosmic-Ray acceleration processes at the shocks, and their relation to the properties of the circumstellar medium. With the aim of studying the high-frequency radio emission and investigating the energy distribution of accelerated electrons and the magnetic field conditions, we performed single-dish observations of the large and complex Cygnus Loop SNR from 7.0 to 24.8 GHz with the Medicina and the Sardinia Radio Telescope, focusing on the northern filament (NGC 6992) and the southern shell. Both regions show a spectrum well fitted by a power-law function (), with spectral index for NGC 6992 and for the southern shell and without any indication of a spectral break. The spectra are significantly flatter than the whole Cygnus Loop spectrum (), suggesting a departure from the plain shock acceleration mechanisms, which for NGC6992 could be related to the ongoing transition towards a radiative shock. We model the integrated spectrum of the whole SNR considering the evolution of the maximum energy and magnetic field amplification. Through the radio spectral parameters, we infer a magnetic field at the shock of 10 G. This value is compatible with a pure adiabatic compression of the interstellar magnetic field, suggesting that the amplification process is currently inefficient.
keywords:
ISM: supernova remnants – ISM: individual object: Cygnus Loop – radio continuum: ISM1 Introduction
The Cygnus Loop is a bright SNR that was discovered by William Herschel in 1784. It has an integrated radio flux density of at and an apparent size of . From the Hubble Space Telescope data, the distance of this SNR was estimated by Blair et al. (2005) as . More recent studies, which were based on the distance of two stars located within the remnant, established the distance to the Cygnus Loop’s centre at (Fesen et al., 2018). Its age was estimated to be in the range on the basis of X-ray (Hester & Cox 1986, Levenson et al. 1998) and optical measurements (Fesen et al., 2018). Due to its large size, its location well out of the Galactic plane, and its high brightness, the Cygnus Loop is well suited for observations across the entire electromagnetic spectrum. Furthermore, this SNR presents a complex morphology, which deviates largely from its classification of typical middle-aged shell-type SNR (Aschenbach & Leahy 1999, Leahy et al. 1997, Uyanıker et al. 2004).
In the radio band, the Cygnus Loop exhibits a large northern circular shell, which is composed of two bright partial shells and a central filament, and a bubble-like shell located in the southern part. The nature of this very peculiar morphology is still debated (Uyanıker et al., 2002). Leahy et al. (1997) derived a strongly different polarisation fraction between the bright northeastern filament (NGC 6992, per cent) and the southern shell ( per cent). By exploiting also the comparison with X-ray images, they attributed the depolarisation of NGC 6992 to high-density, thermal electrons. Spatially-resolved spectral index studies performed by Leahy & Roger (1998) revealed a flatter spectrum of the northeastern rim with respect to other Cygnus Loop features. In the same study, the authors highlighted a spectral curvature: a steepening to high frequencies in the bright filaments and a flattening in the diffuse emission regions. More recent radio studies attributed the region-dependent variations of spectral indices and polarisation properties between the two main shells of the Cygnus Loop to their nature as two interacting SNRs (Uyanıker et al., 2002). In particular, radio spectral index changes and intrinsic variations in the magnetic field configuration were observed between NGC 6992 and the southern shell, suggesting the action of different acceleration mechanisms (Uyanıker et al., 2002). Furthermore, the X-ray and infrared emission are strong in NGC 6992, while they are very faint or completely absent in the southern shell. Also the H and O iii optical lines appear brighter and more extended in the northern filament than in the southern shell, indicating different environmental conditions (Uyanıker et al., 2002). On the other hand, X-ray observations do not support the two SNRs scenario (Katsuda et al. 2011, Leahy & Hassan 2013), highlighting how the X-ray emission shows a smoothly-gradual change between the northern and the southern shell, which was interpreted as the evidence of an asymmetry in the whole Cygnus Loop structure (Aschenbach & Leahy, 1999). Furthermore, in a recent multi-wavelength investigation, Fesen et al. (2018) conclude that there is no morphological evidence for two separated SNRs in the Cygnus Loop. In particular, they rely on the lack of X-ray emission at the putative interacting interface region between the two shells, and on the morphological connection between the main optical filaments of the southern shell and those of the northern part. All these characteristics make the physical interpretation of the two regions quite controversial. This challenging morphology makes the Cygnus Loop an ideal laboratory to study SNR shock conditions arising from different interacting structures in the interstellar medium (ISM; Hester et al. 1994, Leahy 2002, Leahy 2004). Indeed, the investigation of the correlation between flux density and spectral radio slope in the specific SNR macro-regions is useful to reach a complete understanding of complex objects like SNRs. This allows us to disentangle possible magnetic enhancement processes from spectral variation due to the energy distribution of the synchrotron emitting particles or to other emission mechanisms that could become significant at high radio frequencies.
Although the Cygnus Loop represents an interesting scientific case, high-resolution radio flux density measurements are available only up to , because of the technical difficulties in performing radio continuum observations of such a large source. Sun et al. (2006) derived an integrated spectral index of between 0.408 and , and ruled out any possible global spectral steepening within this frequency range. However, a steepening in the integrated spectrum, like the one observed for the similar SNR S 147 (Fürst & Reich, 1986), could be expected. Spatially-resolved spectral index studies revealed, for both the SNRs, the existence of a spectral variation between filamentary and diffuse structures, which was ascribed to the compression of the Galactic magnetic field across the filaments. In the case of S 147, the break observed in the integrated spectrum around 1 GHz was interpreted as a consequence of the spatial differences in the compressed magnetic field (Uyanıker et al., 2004). It is therefore of interest to firmly establish whether there is a spectral break for the Cygnus Loop to better constrain the particle maximum energy and the magnetic field, and compare them with those of SNRs of the same age class. Sensitive maps above could be crucial in investigate this aspect. On the basis of this scientific interest, we performed single-dish observations of the Cygnus Loop in order to obtain sensitive images of this SNR up to high-radio frequencies.
Here, we present the observations performed on the whole Cygnus Loop with the Medicina radio telescope111http://www.med.ira.inaf.it/ at 8.5 GHz, providing the highest-frequency map of this SNR ever obtained with a single-dish radio telescope. We use the Cygnus Loop radio data available in the literature, including our measurement at 8.5 GHz, and the -ray data presented in Katagiri et al. (2011) to model the emission spectrum of the particles accelerated in this SNR. Indeed, the combined study of radio and -ray spectra allows us to investigate the cosmic-ray (CR) acceleration mechanisms, taking into account both of the leptonic and the hadronic contributions. We adopt the model developed by Celli et al. (2019) and Morlino & Celli (2020) to constrain the maximum energy of the particles accelerated at the remnant shock and the evolution of magnetic field strength. We also present the observations carried out at 7.0, 18.7 and 24.8 GHz with the Sardinia Radio Telescope222http://www.srt.inaf.it/ (SRT) of two selected regions of the Cygnus Loop: the northern-bright filament and the southern shell. Our observations allow us to investigate the energetics of the accelerated particles and on the possible emission mechanisms that might compete with the synchrotron emission to produce the radio continuum emission at these frequencies.
In Sect. 2, we describe the observations carried out with the Medicina and SRT telescopes and the main steps of the data reduction and analysis. The results in terms of final calibrated images and flux density measurements are presented in Sect. 3. In Sect. 4, we discuss the spectral analysis performed on the whole Cygnus Loop. Sect. 5 is dedicated to the spectral analysis of the regions NGC 6992 and the southern shell. In Sect. 6, we describe the model used to investigate the Cygnus Loop’s non-thermal emission and related results. We summarise our conclusions in Sect. 7.
2 Observations and data analysis
| Radio | Observing | Target | N.maps | Obs. time | Freq. | BW | HPBW | Map size | Map size |
| telescope | date | (h) | (GHz) | (MHz) | (arcmin) | (RA) (∘,∘) | (Dec) (∘,∘) | ||
| Medicina | 2017 June | Cygnus Loop | 16 | 25.6 | 8.5 | 680 | 4.77 | 56 | 56 |
| 19, 21, 24, 26 | |||||||||
| 2017 Aug | Cygnus Loop | 16 | 25.6 | 8.5 | 250 | 4.77 | 56 | 56 | |
| 28, 29, 30, 31 | |||||||||
| SRT | 2019 Jan 24, Mar 21 | NGC 6992 | 6 | 9.9 | 7.0 | 1400 | 2.71 | 1.9 1.9 | 1.32.5 |
| 2018 Dec 28 | NGC 6992 | 1 | 1.7 | 18.7 | 1400 | 0.99 | 1.9 1.9 | - | |
| 2018 Feb 23 | NGC 6992 | 1 | 1.8 | 24.8 | 1400 | 0.75 | 1.9 1.9 | - | |
| 2019 Jan 31, May 02, Oct 22-24 | southern shell | 12 | 23.4 | 7.0 | 1400 | 2.71 | 2.2 1.8 | 1.62.5 | |
| 2019 Feb 05 | southern shell | 3 | 5.6 | 24.8 | 1400 | 0.75 | 2.2 1.8 | 1.62.5 |
| Calibrator | 7.0 GHz | 8.5 GHz | 18.7 GHz | 24.8 GHz |
|---|---|---|---|---|
| 3C286 | 5.8 Jy | 5.0 Jy | 2.9 Jy | 2.3 Jy |
| 3C295 | 4.2 Jy | 3.3 Jy | 1.2 Jy | 0.8 Jy |
| 3C147 | 5.4 Jy | 4.4 Jy | 2.1 Jy | 1.6 Jy |
| 3C48 | 3.8 Jy | 3.1 Jy | 1.5 Jy | 1.1 Jy |
| 3C123 | 11.2 Jy | 9.2 Jy | 4.0 Jy | 2.9 Jy |
| NGC 7027 | 5.6 Jy | 5.8 Jy | 5.5 Jy | 5.4 Jy |
2.1 Medicina observations
We observed the Cygnus Loop with the 32-m Medicina radio telescope between June and August 2017333Program code Medicina 14-17, PI: S.Loru.. The observations were performed at the central frequency of 8.5 GHz (-band) using the total-power continuum backend. The bandwidth was 680 MHz during the observing sessions of June, but it was subsequently reduced to 250 MHz due to the observed radio frequency interference (RFI). The observations are summarised in Table 1.
The ‘On-the-fly’ (OTF) observing technique was used to map a area along RA-Dec scan directions. The map size was chosen to be twice the source extension, to properly identify and subtract the background baseline component. We set the scanning velocity to 4 and sampling interval to 20 ms. Two consecutive scans were separated by an interleave of 4.8 arcmin, which implies one passage per beam size at that observing frequency. We chose this parameter to minimise the long time necessary to complete a map on such a wide source, and to rely on system and weather stability during the observation. On the other hand, oversampling with respect to the beam size is required to perform a direct evaluation of statistical errors, and to properly reject the corrupted data affected by RFI. This leads to the achievement of improved accuracy in the final images, as demonstrated by our previous experience in single-dish imaging of Galactic sources (Egron et al. 2016, Egron et al. 2017, Loru et al. 2019). For this reason, we performed four complete maps for each observing session, which allowed us to acquire 240 samples per beam once merged. The offset between the four maps acquired in each observing session is of arcmin and assures a proper Nyquist sampling. The aforementioned parameters implied a total duration of a target observation (meant as a RA+Dec map) of about 3.2 hours, including slew and dead time. We observed the point-like flux density calibrators (3C286, 3C295, 3C147, 3C48, 3C123 and NGC 7027) through repeated cross-scans at the beginning and at the end of each observing session.
2.2 SRT observations
The observations were carried out in the framework of our SRT observing program444Program code SRT 22-18, PI: A.Pellizzoni. of the 2018B semester, which was focused on the high-frequency investigation of a wider sample of middle-aged and young SNRs and the precise modelling of the region-dependent continuum spectral indices. SRT observations of the Cygnus Loop were carried out between December 2018 and October 2019 at the central frequencies of 7.0 GHz (-band), 18.7 GHz and 24.8 GHz (-band). The data were recorded by using the spectro-polarimetric backend SARDARA (SArdinia Roach2-based Digital Architecture for Radio Astronomy, Melis et al. 2018) in full-Stokes mode with 1024 spectral channels and the maximum bandwidth available (1.4 GHz both for - and -band), which maximises the signal-to-noise ratio and increases the spectral coverage. A summary of the observing sessions and parameters with SRT are given in Table 1. We observed the target at elevations to avoid significantly pointing errors and beam shape instability effects.
The SRT -band receiver is characterised by a seven-feed system. The receiver was used in the Best Space Coverage configuration (Bolli et al., 2015) that automatically rotates the dewar to optimally cover the scanned area (scan spacing 0.87 arcmin, comparable to the half power beam width, HPBW). The observational strategy and data analysis procedure that is required to observe extended sources with this configuration is described in Loru et al. (2019).
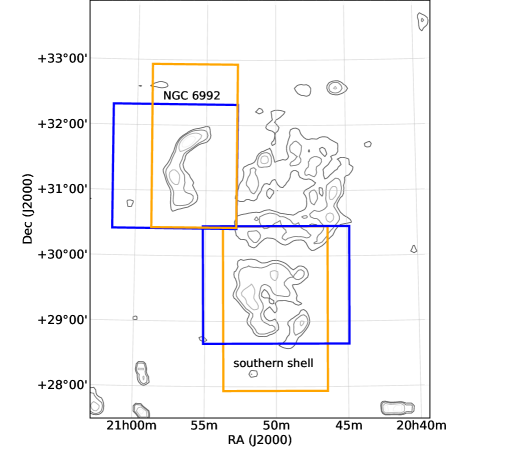
Due to visibility constraints, it is not feasible to map the entire Cygnus Loop at high frequencies (7.0 GHz) in a single long observing session. Atmospheric variations might have a strong impact on the image quality in case of very long observing duration. For this reason, we decided to separately observe two interesting regions of the Cygnus Loop: the northern-bright filament (NGC 6992) and the southern shell. We adopted the well-established OTF mapping strategy in use for the INAF single-dish radio telescope network (Egron et al. 2017, Loru et al. 2019). We decided to perform RA and Dec maps with different size, which are indicated respectively by the blue and orange boxes in Fig. 1, to ensure that about 50 per cent of the scan’s length/duration is free from significant source contribution. This makes the baseline subtraction easier and, at the same time, minimises the observing time. For all the observing frequencies, we set a scanning velocity and a sampling interval of and 20 ms, respectively. Two consecutive 7.0-GHz scans were separated by an interleave of 0.6 arcmin, which implies four passages per beam size, and about 27 samples beam-1 scan-1 were recorded. The same offset was adopted for the observations at 18.7 and 24.8 GHz, implying in this case one passage per beam for each feed of the receiver. We made this choice in order to minimise the observing time, considering that fast mapping mitigates the effects of time-based atmospheric opacity variations on the image quality, which especially affect the high-frequency observations (Navarrini et al., 2016). On the other hand, the seven-feed -band receiver configuration significantly increased the amount of data acquired for each map, and allowed us to obtain about (if we consider the proper operation/contribution of all 7 feeds), a proper Nyquist sampling and an exposure time of for a full RA or Dec map. The -band observations were performed on NGC 6992 at the two central frequencies of 18.7 and 24.8 GHz, while the southern shell was observed only at 24.8 GHz due to the strong RFI found at the lower -band frequency after December 2018. Despite SRT observations were performed in ‘shared-risk mode’ (for which observations under optimal weather conditions are not guaranteed), all the data presented here were acquired in the recommended opacity conditions (<0.1 neper), which are necessary to guarantee the good quality of the -band observations.
2.3 Data reduction and analysis
We performed the data reduction with the SRT Single-Dish Imager (SDI) software, written in IDL and suitable for all Medicina and SRT receivers/backends (Prandoni et al. 2017, Egron et al. 2016, Marongiu et al. 2020). This tool provides an automatic pipeline (quicklook analysis) and interactive tools for data inspection, baseline removal, RFI rejection and image calibration (standard analysis). At the end of these procedures, SDI produces standard FITS images. All final images were produced in units of mJy beam-1, and using the cubehelix colour scheme (Green, 2011).
In the case of the Medicina observations, which were carried out with the total-intensity backend, we adopted the standard data reduction procedure as described in detail in Egron et al. (2017). We performed cross-scan observations on the calibrators and used the flux density measurements and the polynomial expressions proposed by Perley & Butler (2013) to reconstruct/extrapolate their flux density at the observed frequency (see Table 2). In order to guarantee the consistency between calibrators and target in terms of the gain stability and observing condition, we chose the calibration factors by requiring that: i) they have same backend attenuation parameters; ii) their observations are performed within 12 h (or less in case of changing weather) from each target scan epoch. We noted the presence of persistent RFI that affected the 8.5-GHz band. The decision to reduce the bandwidth from 680 MHz to 250 MHz allowed us to mitigate the problem. The data related to the left polarisation channel were found to be strongly noisy, and we discarded them in order to avoid their negative impact on the final image quality.
The SRT observations at 7.0 and 18.7-24.8 GHz used the spectral-polarimetric backend SARDARA. This allowed us to complement the ‘spatial’ RFI rejection procedure (as described in Egron et al. 2017) with a ‘spectral’ RFI rejection. A specific SDI routine is dedicated to the automated search for outliers in each scan-sample’s spectrum, which are dynamically identified as RFI and rejected. After this procedure, the data are averaged into a single continuum channel, and they can be processed with the same data reduction procedure described for the total-intensity Medicina data. Despite the two different RFI removal processes, the not always ideal weather conditions introduced a background noise contribution that could not be deleted in the data reduction phase, especially in the case of a weak target signal. We have accounted for these effects with the background subtraction procedure described in Sect. 3.
The multi-feed data at 18.7 and 24.8 GHz were calibrated considering each feed characterised by a specific efficiency (Orfei et al. 2010; Loru et al. 2019). For this purpose, we used calibrator maps of each SRT observing session in order to calculate the ratios between the expected flux of the calibrator and the peak counts related to each feed. We then applied these scaling factors to the related single feed maps of the target.
The uncertainties associated with our flux density measurements include the statistical errors and the errors related to the calibration procedure, which are added in quadrature. We calculated the first term as the product of the standard deviation associated with the region used to estimate the background contribution and the square root of the number of beam solid angles that are contained in the extraction area of the target. The calibration errors were estimated as the standard deviation on the calibration factors. These are strongly related to the gain stability of the receiver and the observing conditions that characterised each session. We calculated a calibration error of 4 per cent for the 7.0-GHz data, 6 per cent for the data at 18.7 GHz and of 14 per cent for those at 24.8 GHz.
3 Results
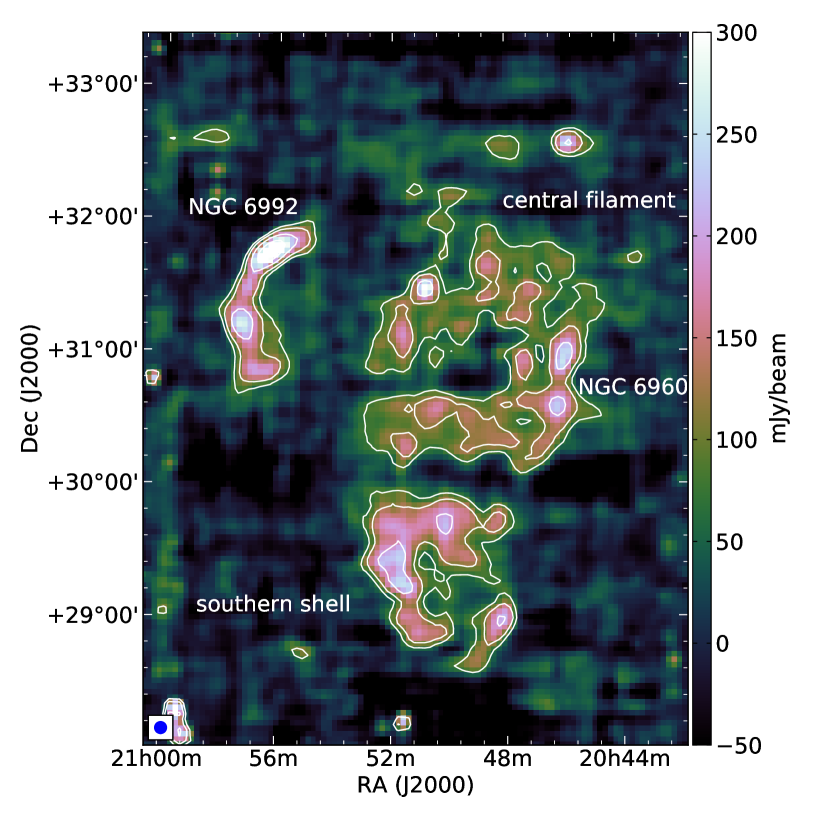
The map of the whole Cygnus Loop SNR at 8.5 GHz is shown in Fig. 2. It was obtained by merging and averaging all the maps of the Medicina observing sessions reported in Table 1. This is the highest-frequency map of the entire Cygnus Loop SNR obtained so far with a single-dish telescope. The Cygnus Loop results well detected, and we can distinguish the two prominent shells (NGC 6960 and NGC 6992) and the central filament, which constitutes the northern remnant, as well as the southern remnant. These regions are highlighted by white contours in Fig. 2.
Our data analysis procedure ensures a zero-mean flux associated with the regions devoid of unrelated source contamination. Despite this, we carefully chose the target extraction region in order to discard possible contributions from near-unrelated sources and RFI features affecting the image. We considered a polygonal region encompassing the SNR emission in order to carry out the integrated flux density measurement. We obtained a continuum flux density of 544 Jy and an image rms of (calculated in a map area free from source contribution and RFI contamination). We also exploited our 8.5-GHz map to derive the flux densities related to the two region of interest. We calculated a flux density of 7.50.9 Jy for NGC 6992 and 16.61.5 Jy for the southern shell.
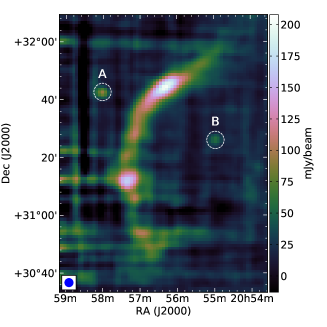
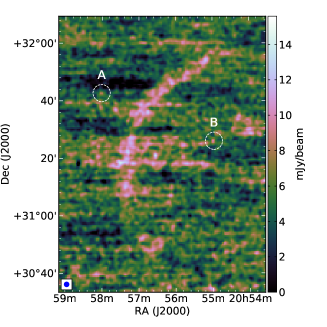
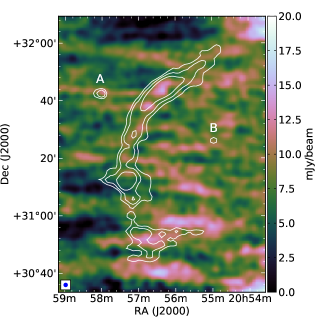
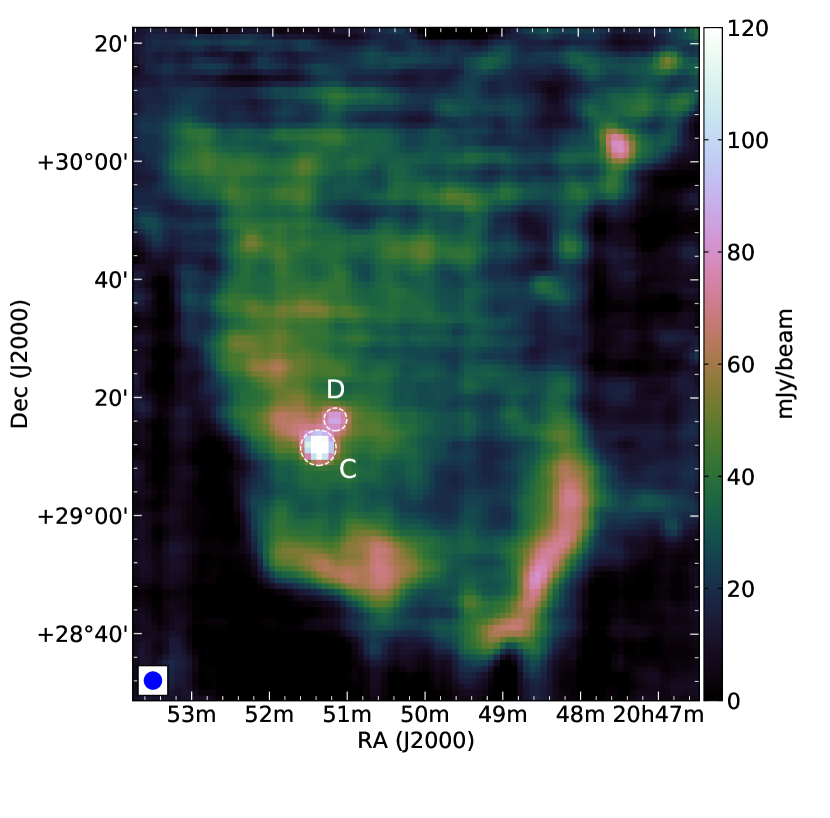
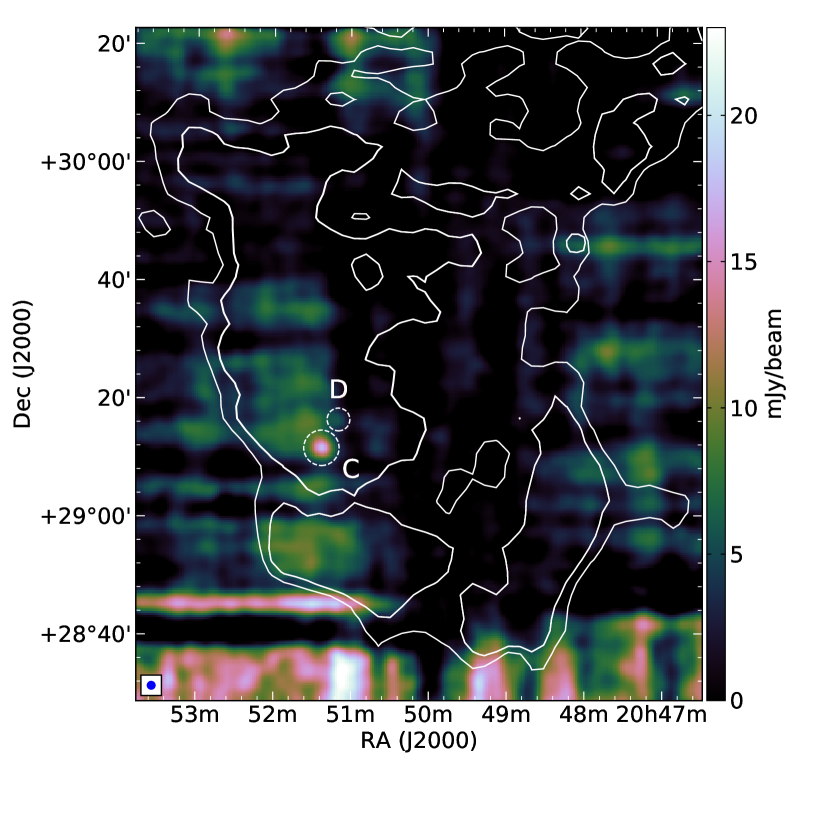
The SRT images of the NGC 6992 region at 7.0, 18.4 and 24.8 GHz, and of the southern shell at 7.0 and 24.8 GHz are shown in Fig. 3 and Fig. 4, respectively. These are the first high-resolution images of the two regions at these frequencies. The map resolution is equal to 2.71, 0.99 and 0.75 arcmin at 7.0, 18.7 and 24.8 GHz, respectively. We obtained these images by averaging, for each frequency, the maps of the different observing sessions. The data sets selected to obtain the final images are summarised in Table 1. Regarding the SRT observations, the total number of maps for each observing session was at last determined by the impact of the weather conditions. Especially in the case of observations at 18.7 and 24.8 GHz, the temporal variations of the atmospheric opacity strongly affect the image quality during each observing session. Hence, we discarded the maps that contribute negatively to the final image accuracy and rms.
We used the SRT data sets to further investigate the morphology and the spectra of NGC 6992 and the southern shell. The maps of NGC 6992 at 7.0 GHz, 18.7 GHz and 24.8 GHz are compared in Fig. 3. The 7.0-GHz map of NGC 6992 (Fig. 3, left) reveals the clumpy emission of the southern part of the filament, probably ascribed to the interaction of the shock wave with smaller discrete clouds (Fesen et al., 2018). The coincident indented structures observed in the X-ray maps are indicative of a blast wave significantly hampered by dense clumps of gas, which are photoionized by the shock precursor (Levenson et al., 1998). The northern part is instead more uniform and bright, resulting from the interaction between the remnant and a more extended cloud (Levenson et al., 1999). The NGC 6992 radio emission is significantly weaker at the higher frequencies. Due to the smaller beam size, in both 18.7- and 24.8-GHz images (Fig. 3, middle and right) the filamentary structure appears thinner, and the highly noisy background makes it difficult to distinguish the morphological features. We overlaid 7.0-GHz contours to the 24.8-GHz map (Fig. 3, right) to make the visual identification of the source easier, and distinguish it from the strong and unrelated noise and RFI contribution.
Despite this, the northern filament is detected at 7.0, 18.7 and 24.8 GHz, but the attenuation of the astronomical signal, due to sky conditions (humidity level) not always ideal, and the weakening of the SNR emission with increasing frequency, make the precise baseline subtraction difficult. This implies that the baseline-subtracted pixels in the regions free from source contamination have non-zero mean flux density. In this case, we applied the background subtraction to obtain correct flux density measurements. In order to estimate the background contribution, we considered the flux density of a region surrounding the filament, excluding the other regions of the Cygnus Loop, and multiplied it by the ratio between the extraction area of the source and the background area. We calculated the flux density of NGC 6992 at 7.0, 18.7 and 24.8 GHz by considering the same extraction region used for the 8.5-GHz map. In this way, we estimated a flux density of 8.70.6 Jy, 5.60.7 Jy and 4.50.9 Jy at 7.0, 18.7 and 24.8 GHz, respectively.
The SRT 7.0-GHz image of the southern shell (Fig. 4, left) revealed a non-uniform structure. We detected three bright regions: the western boundary and the two emission knots in the eastern side. The SNR shock appears discontinuous between these regions. The eastern feature is most likely attributed to a fully radiative shock (Levenson et al., 1999). The structure is difficult to be detect in the 24.8-GHz image, because of its lower signal-to-noise ratio. It is indicated by the white contours in Fig. 4 (right). We point out that the southern shell region includes the shell-like structure, clearly visible in the radio band, and the north-western structure observed both in radio and X-ray emission (Aschenbach & Leahy, 1999). We calculated the 24.8-GHz flux density of the southern shell by considering the same extraction region adopted for the maps at 7.0 and 8.5 GHz. In the same way as described above for NGC 6992, we estimated the background contribution, obtaining a flux density measurement of 18.20.8 Jy and 9.81.8 Jy at 7.0 and 24.8 GHz, respectively.
3.1 Serendipitous point sources in the Cygnus Loop field
Several compact radio sources were detected within the boundary of the Cygnus Loop or in its immediate vicinity (Keen et al. 1973, Green 2019). In the images at 7.0, 18.7 and 24.8 GHz, we detect four point sources located in close proximity to the remnant. These sources are, instead, confused within the Cygnus Loop emission on the 8.5-GHz map due to its lower resolution. When possible (depending on the variability of the source), we exploited the literature flux density measurements associated with these sources in order to cross-check our calibration and data analysis procedure.
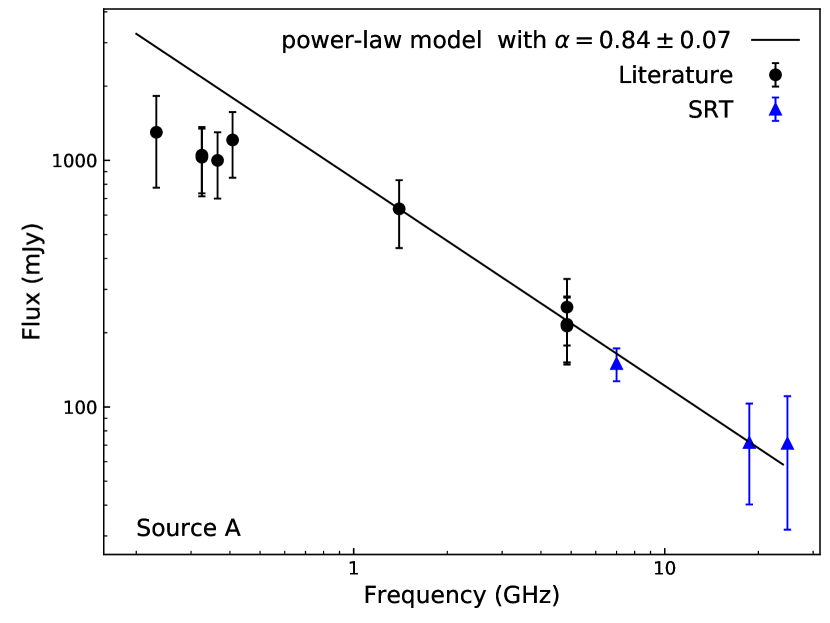
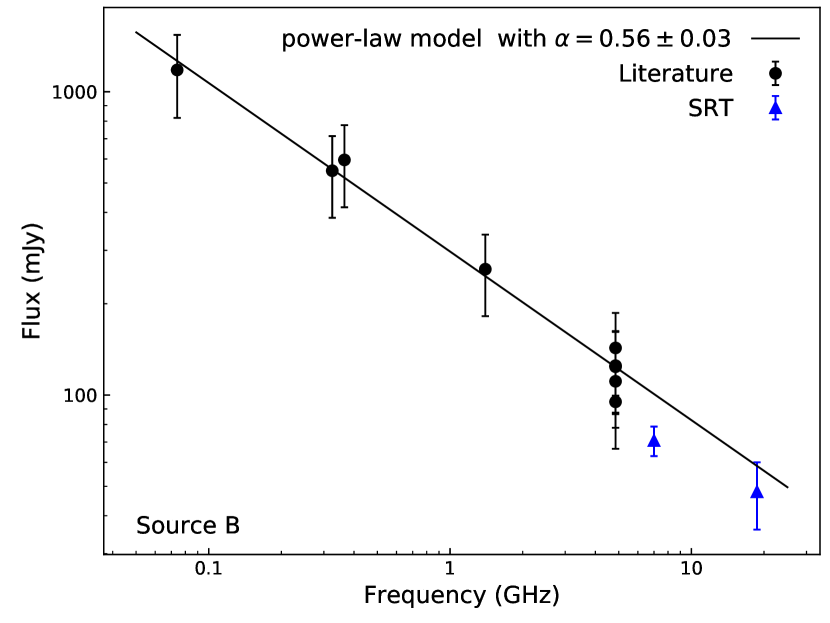
Two point sources are well detected in the 7.0-GHz map of NGC 6992, and are indicated by the white-dashed circles in Fig. 3. These sources are reported in the NVSS catalogue (Condon et al., 1998) as NVSS J205800+314231 (‘A’ in Fig. 3) and NVSS J205458+312614 (‘B’ in Fig. 3), respectively. The source A is also detected at 18.7 and 24.8 GHz, while the weaker source B is well-detected only at 18.7 GHz. For both point sources, radio flux density measurements in the range 0.25 GHz are available on VizieR555https://vizier.u-strasbg.fr/ along with their spectral energy distribution (SEDs). Although a classification of these sources is not available in the literature, the radio data and their location outside the Galactic plane suggest that they are likely radio galaxies. We coupled the literature measurements with our flux densities of the source A at 7.0, 18.7 and 24.8 GHz and those at 7.0 and 18.7 GHz of the source B to assess the quality of our maps.
The SEDs associated with the two sources are shown in Fig. 5, where we also report the extrapolated fit of the spectra referred to the literature data. In the case of the source A, we excluded from the fit the data between 232 and 408 MHz, probably associated with a low-frequency spectral turn-over. All the SRT data related to this source are perfectly consistent with the fit obtained from the literature data. In the case of the source B, our flux measurements at 7.0 and 18.7 GHz are consistent with the fit derived from the other data within 3 and 1, respectively.
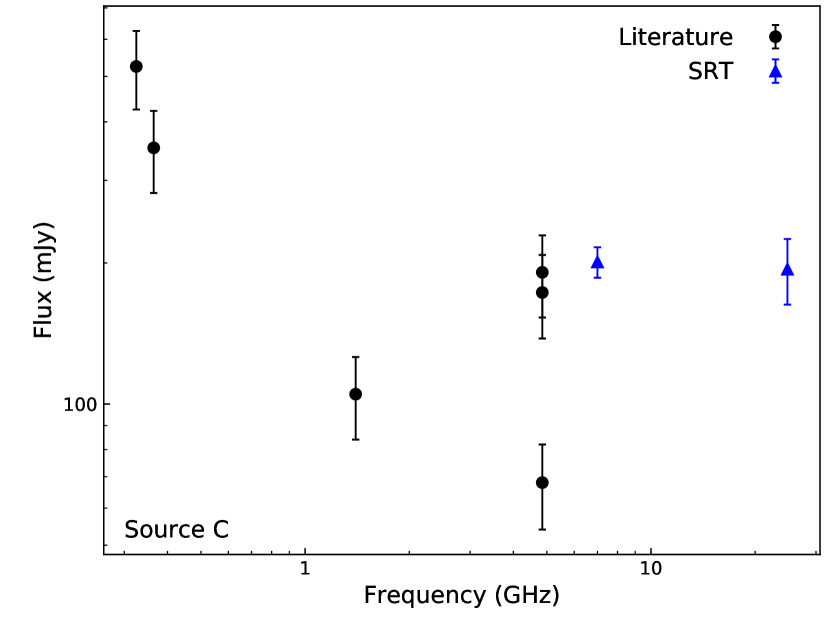
In our 7.0-GHz image of the southern shell, we detected two point sources unrelated with the remnant, and indicated with white-dashed circles in Fig. 4. Differently from what was observed for NGC 6992, in the southern shell both point sources are superimposed on the remnant. The southern source (source ‘C’ in Fig. 4) is listed in the NVSS catalogue as NVSS J205122+291140. Flux density measurements are available on VizieR between 0.325 and 4.85 GHz. This source is also included in the ‘Variable 1.4 GHz radio sources from NVSS and FIRST’ catalogue (Ofek & Frail, 2011). Indeed, as shown in Fig. 6 (left), the literature flux density measurements reveal a certain variability of this source, which is particularly highlighted by the spread of the NVSS flux densities at 4.85 GHz. Our measurements at 7.0 and 24.8 GHz also confirm this variability, which makes this source useless to cross-check our flux density measurements.
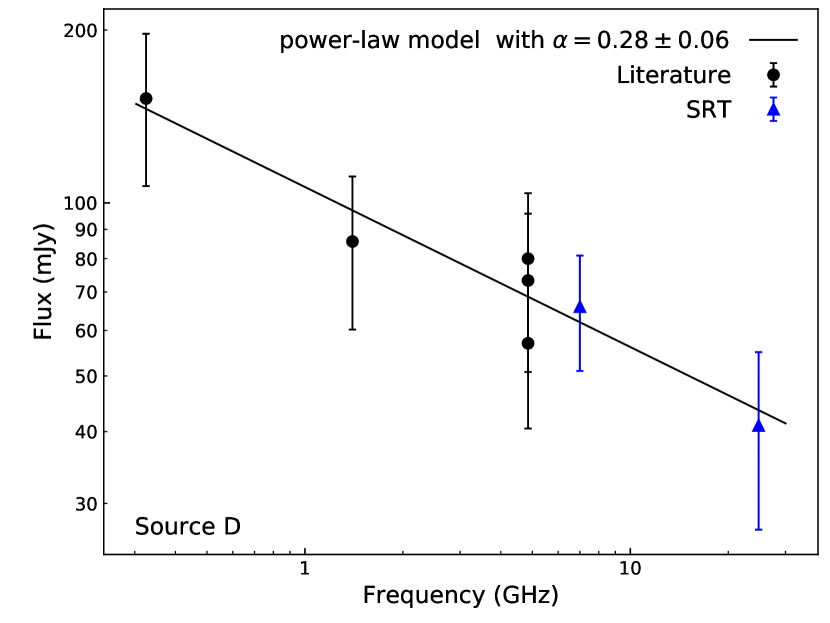
The second point source (source ‘D’ in Fig. 4) is named NVSS J205109+291629 (Condon et al., 1998), and it is indicated as a blazar candidate in the ‘low-frequency radio catalogue of flat-spectrum sources’ (Massaro et al., 2014). The radio flux density measurements associated with this source are summarised in Vollmer et al. (2010), and the related SED is available on VizieR. The spectrum of this point source is shown in Fig. 6 (right). Both the SRT measurements are perfectly consistent with the fit derived from the archive data. The related spectral index is , in agreement with the flat spectrum expected for this kind of objects. It is worth to note that the flux densities of the source D at 7.0, 8.5 (extrapolated from the fit) and 24.8 GHz are within the uncertainties associated with the southern shell measurements at these frequencies (Sect. 5.2). For this reason, we did not remove their contribution to the integrated flux density of the southern shell.
| Flux density (mJy) | ||||
|---|---|---|---|---|
| Source | ID | 7.0 GHz | 18.7 GHz | 24.8 GHz |
| NVSS J205800+314231 | A | 150.0 23 | 72 32 | 71 39 |
| NVSS J205458+312614 | B | 71 8 | 48 12 | - |
| NVSS J205122+291140 | C | 201 15 | - | 194 31 |
| NVSS J205109+291629 | D | 85 20 | - | 41 14 |
Our flux density measurements of the four point sources at 7.0, 18.7 and 24.8 GHz are given in Table 3. The derived spectra of the point sources A, B and D provide a useful verification of the reliability of our flux density measurements.
4 Spectral analysis of the whole Cygnus Loop SNR
| Freq. | Flux density | Reference | Freq. | Flux density | Reference |
|---|---|---|---|---|---|
| (GHz) | (Jy) | (GHz) | (Jy) | ||
| 0.022 | 1378400 | Roger et al. (1999) | 0.863 | 18418 | Uyanıker et al. (2004) |
| 0.0345 | 1245195 | Sastry et al. (1981) | 0.960 | 19050 | Kenderdine (1963) |
| 0.038 | 956150 | Kenderdine (1963) | 1.420 | 14314 | Uyanıker et al. (2004) |
| 0.041 | 770140 | Kundu & Velusamy (1967) | 2.675 | 11512 | Uyanıker et al. (2004) |
| 0.158 | 35070 | Mathewson et al. (1960) | 2.695 | 12516 | Green (1990) |
| 0.195 | 38260 | Kundu & Velusamy (1967) | 2.7 | 886 | Kundu (1969) |
| 0.408 | 23050 | Kenderdine (1963) | 4.940 | 737 | Kundu & Becker (1972) |
| 0.408 | 26050 | Mathewson et al. (1960) | 4.8 | 909 | Sun et al. (2006) |
| 0.408 | 23724 | Uyanıker et al. (2004) | 8.5 | 544 | this work |
| 0.430 | 29750 | Kundu & Velusamy (1967) | 30 | 24.91.7 | Planck Collaboration et al. (2016) |
We analysed the radio spectrum of the entire Cygnus Loop SNR by coupling our measurement at 8.5 GHz and all the flux density measurements available in the literature. We also included the Planck measurement at 30 GHz, the only one reported by Planck Collaboration et al. (2016) in Table 3 for this SNR. All the values and related references are reported in Table 4.
It is worth noting that our measurement is the most sensitive obtained so far at these frequencies, if we exclude the lower-resolution Planck data. The overall radio spectrum is displayed in Fig. 7. The Medicina value at 8.5 GHz is represented with a filled red triangle, and perfectly matches the tendency suggested by the other data without any apparent spectral variation. We modelled the integrated spectrum of the Cygnus Loop using a simple synchrotron power-law function. From the weighted least-squares fit (), we obtained a spectral index of and a normalisation constant at 1 GHz of Jy. Our result is consistent within with the spectral index derived by Uyanıker et al. (2004) by considering all the flux density measurements available in the literature between 0.022 and 4.94 GHz, and within with the spectral index of calculated by Uyanıker et al. (2004) by considering the data from the Effelsberg 100-m telescope and the DRAO Synthesis telescope between 0.408 and 2.675 GHz, and that calculated by Sun et al. (2006), , by adding the Urumqi telescope data at 4.8 GHz. We also fit the data reported in Table 4 with a simple synchrotron model with an exponential cutoff:
where is the normalisation constant and is the cutoff frequency. The weighted least-squares fit () gives a spectral index , Jy (representing the flux density at 1 GHz) and a cutoff frequency GHz. Although the data are well-fitted by both the simple synchrotron power-law and the cutoff-frequency model, the high value of the obtained cutoff frequency suggests that the non-thermal synchrotron emission, without any steepening, is dominant in the considered frequency range.
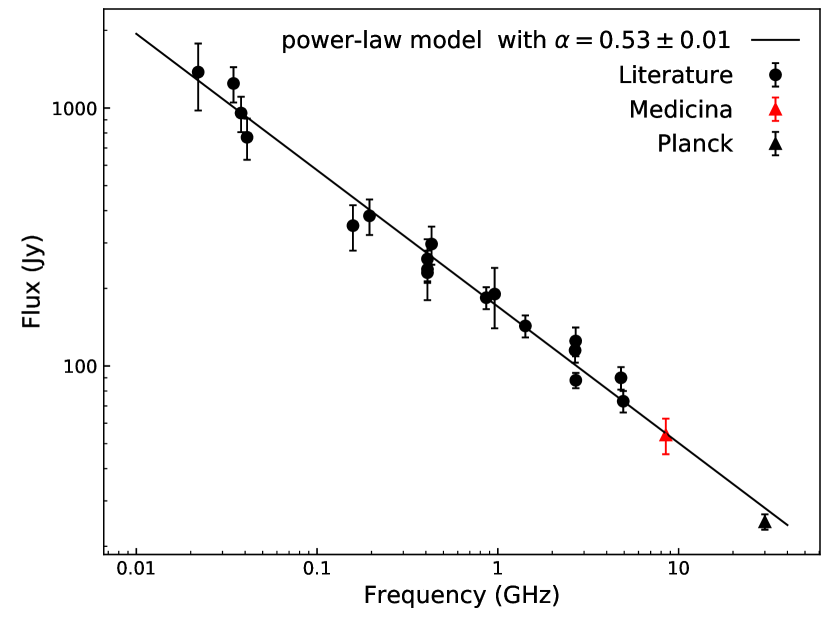
Furthermore, our measurement rules out any spectral steepening up to high radio frequencies, and it confirms the tendency suggested by the Planck data at 30 GHz. Although the Cygnus Loop is considered approximately at the same evolutionary phase of other SNRs that showed a synchrotron spectral break, as in the case of S 147 (Fürst & Reich, 1986) and W44 (Loru et al., 2019), or characteristic spectral features, as the spectral bump observed in the IC443 between 20 and 70 GHz (Onić et al. 2017, Loru et al. 2019), its integrated spectrum appears dominated by the non-thermal synchrotron emission without any noticeable deviation. This result could indicate an earlier evolutionary phase of this SNR, for which a spectral steepening is expected at higher frequencies, or the global effect of different electron populations across the remnant undergoing peculiar shocks conditions.
| parameters | Results | |||||
| Source | geometry | |||||
| (cm3) | (erg s-1) | (erg) | (G) | |||
| Cygnus Loop | sphere | 0.53 | 19 | |||
| shell | 0.53 | 27 | ||||
| NGC 6992 | - | 0.45 | 46 | |||
| Southern shell | sphere | 0.49 | 21 | |||
| shell-I | 0.49 | 31 | ||||
| shell-II | 0.49 | 36 | ||||
On the other hand, the presence of a synchrotron spectral steepening above 20 GHz could be hidden by other processes, like thermal Bremsstrahlung or thermal dust-emission, which may become dominant depending on environmental conditions. On this base, we considered an upper cutoff frequency of 25 GHz and a lower cutoff frequency of 22 MHz, the latter corresponding to the lower-frequency flux density measurement available in the literature, to estimate the minimum total energy contents Umin in the Cygnus Loop and the related magnetic field strength B (Umin). We here estimate these quantities under the assumption of the equipartition between particles and magnetic energy (Condon & Ransom, 2016):
| (1) |
| (2) |
where and are the volume and the total luminosity of the source expressed in cm3 and erg s-1, respectively; is a factor that accounts for the contribution to the total energy of protons and heavier ions with respect to electrons; is a physical parameter that depends on the lower () and upper () cutoff frequencies and the spectral index ():
where and are constants with value and in cgs units (Dubner & Giacani, 2015). We assumed an isotropic emission in the frequency range from 22 MHz to 25 GHz and , as it was usually done in previous works on SNRs (Castelletti et al., 2007). We assumed these values also in the case of NGC 6992 (Sect. 5.1) and the southern shell (Sect. 5.2). The other parameters are summarised in Table 5 together with the results. We performed the analysis for two geometrical models: i) by approximating the Cygnus Loop to an uniform sphere of radius deg; ii) by considering the CR electrons confined within the Cygnus Loop shell, with a thickness of approximately 5 per cent of the SNR radius. The assumption of the energy equipartition between particles and magnetic field provides a first estimation of the minimum value of the energy and magnetic field strength in a SNR. However, it is very difficult to decide whether synchrotron sources are in equipartition, especially in the case of extended and complex object like SNRs (Dubner & Giacani, 2015). Observational constraints from radio and -ray data are then needed to firmly constrain the particle energetics and the magnetic field strength, and to investigate on a possible SNR departure from the equipartition condition. Indeed, the maximum energy achieved by an electron population with cutoff frequency is (Reynolds, 2008):
| (3) |
Considering a tentative lower limit on the radio cutoff frequency of 25 GHz and the maximum particle energy between 1 and 10 GeV, as derived from the -ray observations by Katagiri et al. (2011), we obtained a minimum value of the magnetic field ranging from 54 G to 5.4 mG from Eq. (3).
On the other hand, a stringent upper limit on the magnetic field can be obtained from the condition that the synchrotron cooling time has to be larger than the remnant’s age, otherwise a cooling break should be visible in the radio spectrum. The cooling time is given by (Ohira et al., 2012):
| (4) |
where and are the electron mass and the classical electron radius, respectively. In the second equality, we substituted from Eq. (3), Hence, imposing with the condition GHz, we get G.
A more constraining investigation on the particle energetics and magnetic field strength can be achieved through a model of the radio and -ray emission from the Cygnus Loop, which accounts for the electron radiative losses and the evolution of the magnetic field, coupled to the SNR dynamics. A detailed description of this method is provided in Sect. 6.
5 Spectral analysis of NGC 6992 and the southern shell
In this Section, we use the Medicina and SRT data and the flux density measurements at 30 and 40 GHz, derived from the public Planck maps, in order to investigate the integrated spectrum of the two regions of the Cygnus Loop: NGC 6992 and the southern shell. Due to the lack of separated -ray flux measurements for these two regions, we cannot use the Eq. (3) or the model described in Sect. 6 to constrain the magnetic field strength and the particle spectrum. We will estimate, instead, the magnetic field using only radio data under the assumption of energy equipartition between non-thermal particles and magnetic field.
| Source | Freq. | Flux density | |
|---|---|---|---|
| name | (GHz) | (Jy) | (mJy/beam) |
| NGC 6962 | 7.0 | 8.7 0.6 | 15.8 |
| 8.5 | 7.5 0.9 | 43.7 | |
| 18.7 | 5.6 0.7 | 3.4 | |
| 24.8 | 4.5 0.9 | 8.9 | |
| Southern shell | 7.0 | 18.2 0.8 | 6.5 |
| 8.5 | 16.6 1.5 | 44.7 | |
| 24.8 | 9.8 1.8 | 6.6 |
| Source | Freq. | Flux density |
| name | (GHz) | (Jy) |
| NGC 6962 | 30 | 4.32 0.4 |
| 44 | 4.57 0.9 | |
| Southern shell | 30 | 9.49 0.5 |
| 44 | 8.25 1.1 |

5.1 NGC 6992
The morphology of NGC 6992 is governed by the interaction of the SNR blast wave with smaller discrete clouds (Fesen et al., 2018). The correlation between X-ray and optical emission reflects the non-homogeneous interaction of the blast wave with the clouds: in the low-density inter-cloud medium, the shock wave propagates unimpeded and emits X-ray radiation, while it decelerates where it encounters dense clumps of gas with a resultant optical emission (Levenson et al., 1998). Local changes in shock velocity and in the preshock density were also pointed out by optical studies of the H filaments observed in NGC 6992 (Blair et al., 2005). These result in isolated regions where the non-radiative shock is becoming radiative. NGC 6992 corresponds to the brightest sector of the -ray Cygnus Loop emission observed with Fermi-LAT between 1 and 100 GeV (Katagiri et al., 2011), suggesting the interaction of high-energy particles with the circumstellar medium (CSM) regions.
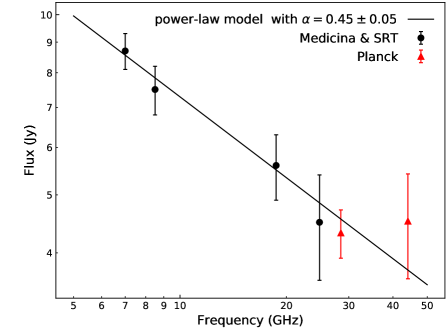
We used the flux densities calculated from our maps at 7.0, 8.5 and 18.7 GHz to investigate the integrated spectrum associated with NGC 6992. These values are listed in Table 6. We performed a weighted fit of our data by using a simple power-law model, as shown in Fig. 8. We calculated for this region , which is significantly lower () than the value that we obtained for the whole Cygnus Loop SNR ( = 0.53 0.01). This result confirms and extends up to high radio frequencies the slightly flatter spectra () revealed for this region by the spatially-resolved spectral index studies performed by Uyanıker et al. (2002) in the frequency range from 0.408 to 2.675 GHz.
There are several explanations for flat radio spectra of SNRs in the current literature (see Onić, 2013, for an overview). Most of the models involve a significant contribution of the second-order Fermi mechanism, but some of them also discuss high compression ratio, contribution of secondary electrons produced in hadronic collisions, as well as the possibility of thermal contamination. Given the relatively low density in the region of NGC 6992 ( cm-3), contributions from secondary electrons and thermal emission are disfavoured.
Concerning the second-order Fermi acceleration, we have considered the model developed by Ostrowski (1999), which includes this mechanism in the shock acceleration and predicts hard spectra when the ratio (where is the Alfvén velocity and is the shock velocity) and/or the particle diffusion is much flatter, in energy, than the Bohm-like diffusion. However, in the case of NGC 6992, a spectrum with requires either an upstream magnetic field G, a value which we will exclude in our next analysis (see the last part of this Section and Sect. 6), or a diffusion coefficient . The latter condition is also at odds with the idea that diffusion results form the self-generated turbulence. In such a case, particle spectra harder than would produce self-generated diffusion harder than , contradicting the premise. Hence a different turbulence origin should be invoked.
We are left with the possibility of large compression. Such a condition is naturally realised in radiative shocks because the downstream plasma loses energy through radiation and becomes more compressible. Blair et al. (2005) found that some portions of the shock in NGC 6992 are close to become radiative. The same conclusion was reached by Szentgyorgyi et al. (2000) for the region NGC 6995. Then it is possible that the compression ratio () is just slightly larger than 4. Remembering that the radio spectral index is connected to the shock compression ratio as , we need to produce . Such an interpretation is very attractive, but comes with some caveats. First of all, radiative shocks are not thought to be efficient accelerators even though it is not very clear when the transition from efficient to inefficient acceleration occurs. Indeed, the Cygnus Loop may represent a rare example where such a transition may be studied. Secondly, when a shock becomes radiative, its velocity structure is more complex than the simple step function used to describe high-velocity shocks. Therefore, the final particle spectrum should be computed using the correct velocity profile but this is beyond the aim of the present work.
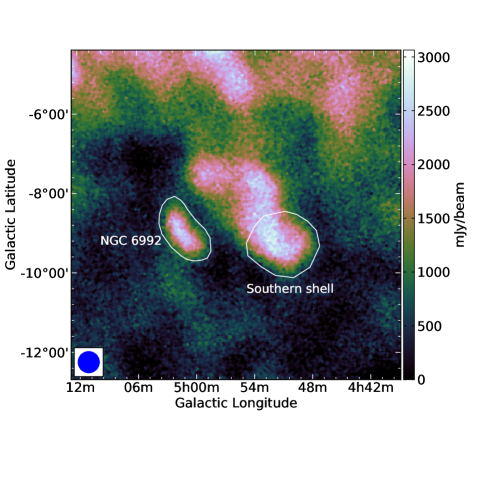
We used the Planck public maps of the Cygnus Loop available on the NASA/IPAC Infrared Science Archive666https://irsa.ipac.caltech.edu/Missions/planck.html to compute the flux density of NGC 6992 at 30 and 44 GHz. We considered the same extraction region as shown in Fig. 9. The background-corrected results are listed in Table 7. We calculated the errors associated with the Planck measurements adding in quadrature the statistical uncertainty and the flux calibration uncertainty. For the latter, we assumed the values of the mission calibration uncertainty reported in the Table 1 of Planck Collaboration et al. (2016). The Planck flux density at 30 GHz is consistent with the tendency suggested by our data. This represents a further confirmation that no spectral steepening takes place in this region up to high radio frequencies. The value at 44 GHz indicates, instead, a significant flux density increase, suggesting that the dust emission contribution becomes important. On the other hand, we cannot exclude a possible contribution of the dust emission also at lower frequencies, in particular on the flux density at 30 GHz. This could compete with the synchrotron emission, hiding a possible spectral cutoff. However, we note that our high-frequency maps, especially that at 24.8 GHz, are affected by artefacts and high noise, which together with the weakness of the source emission make a precise flux density estimation difficult. More -band SRT observations are needed to firmly establish the NGC 6992 spectral behaviour at high radio frequencies.
As in the case of the whole Cygnus Loop, we established a lower limit for a possible spectral break in the NGC 6992 region at 25 GHz and used it for estimating the minimum energy and related magnetic field by assuming that this region satisfies the equipartition condition. The used parameters and results are summarised in Table 5. The magnetic field value (46 G) is in perfect agreement with the estimation performed by Sun et al. (2006) for the same region considered in the energy equipartition condition. On the other hand, the magnetic field obtained for NGC 6992 is higher than that obtained for the entire Cygnus Loop SNR both modelling it as an uniform sphere (19 G) or a shell (27 G), suggesting a possible magnetic field amplification process in this region like the turbulent dynamo.
5.2 Southern shell
The southern shell is the brightest region of the Cygnus Loop in the radio domain. It is a typical shell centred at about (, ) = (20h49.56m, 29) with a size of (Uyanıker et al., 2002). Radio polarimetric studies revealed a tangential configuration of the magnetic field along the whole southern shell, as typically expected for a middle-aged SNR in its adiabatic phase (Sun et al., 2006). Spatially-resolved spectral index studies performed on the whole Cygnus Loop by Leahy & Roger (1998) between 0.408 and 1.420 GHz revealed region-dependent spectral indices, ranging from flat spectra corresponding to the north and northeast rims, to steep spectra in the southern shell and in the faint region on the west of the central bright filament of the northern shell. By including also the radio data at 2.695 GHz, the authors also pointed out region-dependent spectral shapes with a negative curvature (spectral steepening) associated with NGC 6992 and a positive curvature (concave-up) in the central faint regions of the northern shell and in the southern shell. More recent observations by Uyanıker et al. (2004) between 0.408 and 2.675 GHz showed slight variations of the southern shell spectral index compared to the integrated value of the whole Cygnus Loop SNR (). In particular a steeper spectrum was observed in the central fainter region (), while lower spectral indices are found in the brightest filaments (). The authors attributed these variations to a weak compression between the shock wave and the ISM in the southern shell, where the shock acceleration appears as the dominant mechanism.
Optical observations revealed a fully radiative region on the east side of the shell. However, the filamentary structures are less extended than those observed in the northern shell, suggesting smaller clouds or a more recent interaction of the SNR shock with them (Levenson et al., 1998). The southern shell is very faint in the X-ray images, with an extremely smooth shell detected in the soft X-ray band (Levenson et al., 1999). The radio continuum and the -ray emission do not appear correlated in this region (Katagiri et al., 2011). Only the bright southern -ray spot (centred at , =,) is coincident with the brightest radio region of the shell.
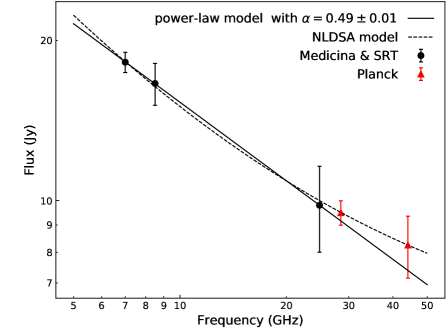
We investigated the high-frequency spectrum of the southern shell by using the flux densities at 7.0, 8.5 and 24.8 GHz. The resulting spectrum is shown in Fig. 8 (), where we also included the Planck measurements at 30 GHz and 44 GHz (see Table 7).
Between 7.0 and 24.8 GHz,
the spectrum results perfectly fitted by a simple power-law function with , ruling out any spectral steepening.
Our fit underestimates the Planck data. If we include them in our analysis, the spectrum results well fitted by a synchrotron power-law function with . The uncertainties related to our flux density at 24.8 GHz make it compatible with this fit. Nevertheless, both Planck values seem to suggest a concave-up deviation from the simple synchrotron-emission model. We tried to investigate the emission processes and the theoretical models that could be at the basis of this spectral tendency.
‘Concave-up’ radio spectra, flattening to high frequencies, were observed both in evolved (composite, mixed-morphology) and young shell-like SNRs. In the first case, the curvature of the spectrum is related to other emission mechanisms that become significant at high frequencies, especially for SNR evolving in complex environmental conditions (Urošević, 2014). The most accredited models include bremsstrahlung emission in presence of dense ISM environment, thermal dust emission linked to cold dust in molecular clouds and spinning dust emission from very small grains usually found in nearby Galactic molecular and dust clouds interacting with the SNR shocks.
The density in the southern shell is even lower than the one in NGC 6992 (Fesen et al., 2018), hence a possible significant contribution from these processes is not expected.
In particular, the thermal dust contribution, expected at these frequencies, is not strongly evident at 30 and 44 GHz. It could become significant at higher frequencies.
In some young SNRs, in the free-expansion and in the early adiabatic-expansion phases of their evolution (Dubner &
Giacani, 2015), a curved concave-up shape is observed as a possible result of the dynamical reaction of accelerated particles that modify the shock structure. Under the modified shock configuration, the low-energy electrons are confined in the subshock region where they undergo a compression factor . This results in a steepening of the radio spectra at low frequencies. On the contrary, because the high-energy electrons can sample a more extended space region ( far from the shock) the related energy spectrum results harder (flat radio spectrum). The overall effect is a concave-up radio spectrum due to a significant CR production and confinement (Amato &
Blasi 2005, Urošević 2014). The magnetic field configuration of the southern shell is consistent with that of a shell-like SNR in the adiabatic phase, and it results different from that of the northern shell, where the magnetic field shell structure appears more irregularly (Sun et al., 2006).
The nature of the southern shell is still debated. On the basis of neutral Hydrogen line observations, Leahy (2005) interpreted this region as a result of a southern cavity arising from the Cygnus Loop expansion on a wall of neutral gas with consequent acceleration of smaller interstellar clouds adjacent to
the northern rim of this region toward the center of the Cygnus Loop.
On the other hand, in the scenario of two SNRs composing the Cygnus Loop, the radio and magnetic field characteristics are attributed to an early evolutionary stage of the southern SNR, which would have formed after the northern one (Uyanıker et al., 2004). The absence of a spectral steepening, due to a still very efficient acceleration mechanism up to high radio frequencies, could be a confirmation of this hypothesis. In this context, the indication of a concave-up spectrum could be associated with an efficient CR production at the shock.
In order to investigate this possibility, we fitted our data and the Planck measurements at 30 GHz and 44 GHz by a model that includes non-linear diffusive shock acceleration (NLDSA) effects. We represented this model with a varying power-law of the form , where is a curvature parameter. The resulting fit for the varying spectral-index model is represented by the dotted line in Fig. 8 (right). We obtained a spectral index , a spectral curvature parameter and a normalisation constant of 612 Jy at 1 GHz. The spectral index is significantly higher compared to that obtained for the simple synchrotron power-law model, indicating a flattening with increasing frequencies. Our estimation of the curvature parameter is perfectly consistent with that obtained by Onić & Urošević (2015) () for the case of the young SNR Cas A, which they ascribed to an efficient non-linear diffusive shock accelerator. Furthermore, the spectral index obtained for the southern shell is consistent within with that obtained for Cas A (). We point out that our flux density measurements, including the Planck ones, perfectly agree with both the simple synchrotron emission and the non-linear synchrotron model due to the large uncertainties, and do not allow us to constrain the spectral tendency in the frequency range between 20 and 50 GHz. Therefore, we cannot completely exclude a possible dust emission contribution, although not dominant. More flux-density measurements with higher sensitivity between GHz and GHz could be crucial to constrain the particle-acceleration mechanisms in the southern shell.
Assuming the southern shell in the energy-equipartition condition, we calculated the minimum energy and associated magnetic field strength by using Eqs. 1 and 2. In Table 5, we list the used parameters and related results. We assumed two shell models with a thickness of: i) 5 per cent of the Cygnus Loop radius; ii) 5 per cent of the southern shell radius. We observed that the magnetic field strength of the southern shell, considered as an uniform sphere (), is very close to that obtained for the whole Cygnus Loop, suggesting very similar conditions (). On the other hand, the estimation performed by considering the southern shell as an independent SNR (shell-II) provides a higher magnetic field () compared to that obtained for the entire Cygnus Loop. This could be consistent with an amplification of the magnetic field as observed in SNRs with a concave-up radio spectrum and resulting from an efficient shock acceleration that modifies the shock structure (Reynolds, 2011). However, only a detailed modelling of the non-thermal emission from the radio to the -ray band will firmly constrain the magnetic field strength in this region.
6 Modelling the non-thermal emission
In this Section, we model the non-thermal emission from the whole Cygnus Loop, combining radio and -ray observations, to investigate the properties of particle acceleration at the forward shock and their time-dependent escape from the source.
One of the main issues in the shock acceleration theory is identifying the maximum energy that particles can reach and understanding how it evolves in time. This is also intimately connected with the magnetic field amplification, a process thought to occur in the shock region by means of the same accelerated particles and a necessary requirement to reach energies much larger than a few tens of GeV (for recent reviews see Blasi, 2013; Amato, 2014). To this respect, middle-aged SNRs can be very helpful given that several among these remnants show a -ray spectrum with a cutoff, or a spectral softening above GeV, and the Cygnus Loop makes no exception (Katagiri et al., 2011). Such a feature could be related to the maximum energy of the particles accelerated at the present time (Celli et al., 2019; Brose et al., 2020). In fact, the break, or softening, could be produced by particles accelerated in the past that are no more confined by the acceleration mechanism and start diffusing away from the source in such a way that a fraction of escaped particles are still located inside the source. If this were indeed the case, a spectral break is expected in the radio band at a frequency given by Eq. (3), namely GHz. In turn, if the -ray emission is due to hadronic processes, the maximum energy inferred from the high-energy cutoff rather refers to protons, such that the magnetic field remains generally poorly constrained and cannot be determined. Hence, it is fundamental to describe both contributions from accelerated hadrons and leptons, and related radiative emissions, to obtain a clear understanding about the relative importance of the many ongoing physical processes. For this reason, we will use a self-consistent model, where the magnetic field at the shock is estimated from the maximum energy of particles through the amplification process. Here, the temporal evolution of the SNR is taken into account to calculate adiabatic losses for both particles and magnetic field, in order to correctly determine the whole synchrotron spectrum.
With such a time-dependent model, we can constrain several quantities like particle maximum energy, acceleration efficiency, ratio between accelerated electrons and protons, and magnetic field strength at different stages of the remnant evolution. In order to keep the calculations as simple as possible, we will use a spherically symmetric model, which in turn will not allow to account for the different radio slopes observed in different parts of the Cygnus Loop.
6.1 Particle acceleration model
The model that we adopt here is developed by Celli et al. (2019) and Morlino & Celli (2020), hence the reader is referred to those papers for further details. For simplicity, we assume that the remnant is expanding into a uniform CSM, with numerical density . The SNR properties (namely SN explosion kinetic energy , circumstellar density , SNR age and distance from us ) are fixed to the best values obtained by Fesen et al. (2018), and summarised in Table 8. We then follow Truelove & McKee (1999) to describe the SNR evolution assuming an ejecta power-law index equal to 0 (see Table 5 in Truelove & McKee, 1999). The ejecta mass is then fixed to to match the measured shock proper motion of 0.1 arcsec yr-1, which at pc, corresponds to a shock velocity (Fesen et al., 2018). At the same time, the predicted shock radius, pc, well matches with the E-W semi-axis of 18.5 pc.
We account for particle acceleration at the forward shock assuming that a fixed fraction of the shock kinetic energy is transferred to non-thermal particles. The instantaneous proton spectrum accelerated at the shock is
| (5) |
where ( being the proton’s mass), is a normalisation constant such that the CR pressure at the shock is . The factor represents the instantaneous acceleration efficiency, and it is kept constant during the whole evolution of the SNR until now. We also remember that the linear diffusive shock acceleration process (DSA) predicts the particle spectral slope to be for strong shocks. represents the instantaneous maximum momentum (and is the corresponding maximum energy) achieved at the time . Simple considerations on particle confinement suggest that it increases during the ejecta dominated (ED) phase and decreases during the Sedov-Taylor (ST) phase, following a simple power-law:
| (6) |
where yr is the beginning of the ST age. Both the absolute maximum momentum and the slope are free parameters, that will be constrained from data. We also stress that the final result is not very sensitive to the behaviour of for , as a consequence of the fact that . Hence the behaviour of the maximum energy during the ED phase cannot be constrained.
Differently from protons, electrons are affected by radiative losses, so that we need to estimate the magnetic field strength in order to determine their distribution at the shock. To be conservative, we only evaluate the magnetic field at the shock required to reach the maximum energy. The common assumption is that this field is self generated by the same particles through resonant (Skilling, 1975) or non-resonant instabilities (Bell, 2004) (see also Amato & Blasi, 2009). Here, we do not specify the precise mechanism, but we make the assumption that the magnetic turbulence has a flat power distribution to produce a Bohm-like diffusion coefficient in the upstream of the shock, i.e. where is the particle’s Larmor radius and is the logarithmic power spectrum of magnetic turbulence related to particle momentum through the resonant condition . In the following, refers to the unperturbed circumstellar magnetic field, while represents the turbulent component, so that the total magnetic field upstream reads as . In addition, subscript 1 (2) refers to quantities evaluated upstream (downstream) of the shock. When the magnetic field is amplified beyond the linear regime (), the diffusion becomes Bohm-like in the amplified magnetic field (Blasi, 2013). In other words, the function should have the following limits: for and for . A minimal formula that reproduces these limits is , which, once inverted, gives
| (7) |
The relation between the maximum energy and the turbulent magnetic field upstream, , is obtained by imposing that the maximum energy is determined by the age of the SNR, i.e. . Using the acceleration time from quasi-linear theory, namely (Morlino, 2017), we have . This equation allows us to compute the magnetic turbulence self-generated by accelerated particles at the shock, once a receipt is given for the maximum momentum and the shock speed temporal evolution. The magnetic field upstream is then compressed at the shock and expands adiabatically during the SNR evolution.
The electron spectrum is similar to that of protons, but the maximum energy and the cutoff shape are different. In the loss-dominated case, i.e. for , a super-exponential cutoff is expected (Zirakashvili & Aharonian, 2007; Blasi, 2010). In particular, when energy losses are proportional to , like in synchrotron and inverse Compton (IC) processes, the spectral cutoff is proportional to . A good approximation to the spectrum is provided by Zirakashvili & Aharonian (2007):
| (8) |
where the constant accounts for the different injection efficiency of electrons with respect to protons. The electron maximum momentum, is determined (as a function of time) either by losses or by the acceleration time, i.e. where losses include both synchrotron emission and IC scattering. The latter is evaluated adopting the average Galactic background photons due to the cosmic microwave background (CMB), plus infrared, optical and UV radiation produced by dust emission and star-light.
Once proton and electron spectra are known at the shock, their evolution inside the SNR is calculated assuming that all particles with energies remain confined into their plasma elements, suffering adiabatic and radiative losses (for electrons). On the contrary, when , particles (both protons and electrons) start escaping from the shock with a rate determined by the properties of the local CSM. Inferring such properties is quite difficult, hence we assume that particles diffuse with a local diffusion coefficient given by , where is the average Galactic diffusion coefficient as estimated from direct CR measurements (see e.g. Evoli et al., 2019) and is a free parameter that can be estimated from observations.
6.2 Results
Cygnus Loop properties Acceleration model parameters Assumed Derived erg 5 yr 735 pc 0.4 cm-3 20 pc 380 km s-1 0.07 4.0 200 TeV 3 0.15 G 1
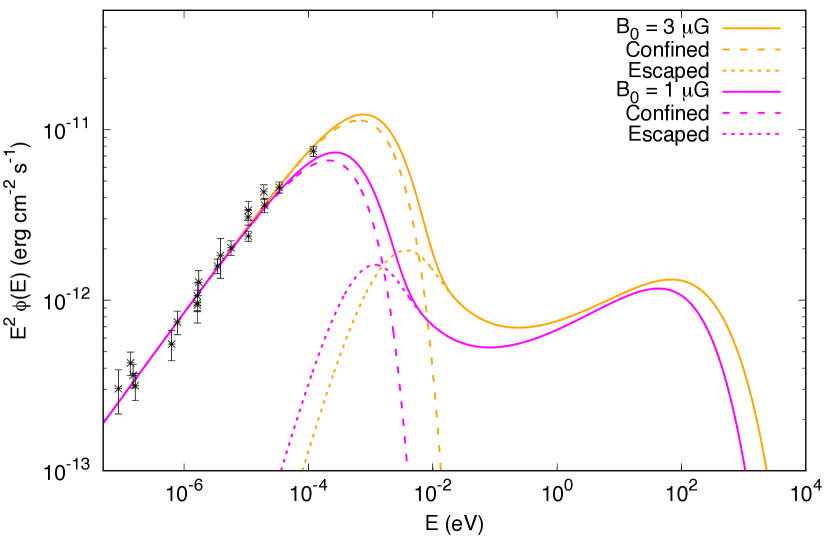
The model outlined in the previous Section has seven free parameters, listed in the right side of Table 8, which can all be constrained with a reasonable accuracy using radio and -ray observations. Figures 10 and 11 show the -ray and the radio emission, respectively, resulting from our best model, as compared with available data. The modelling result accounts for the radiation emerging from several mechanisms, including proton collisions on target gas density (pp interaction), electron IC scattering on the background photons and synchrotron emission from electrons in the SNR magnetic field. The -ray emission from pp interaction is calculated using the parametrization provided by Kafexhiu et al. (2014). Each radiation process contains two different contributions, one produced by confined particles and one from escaping particles.
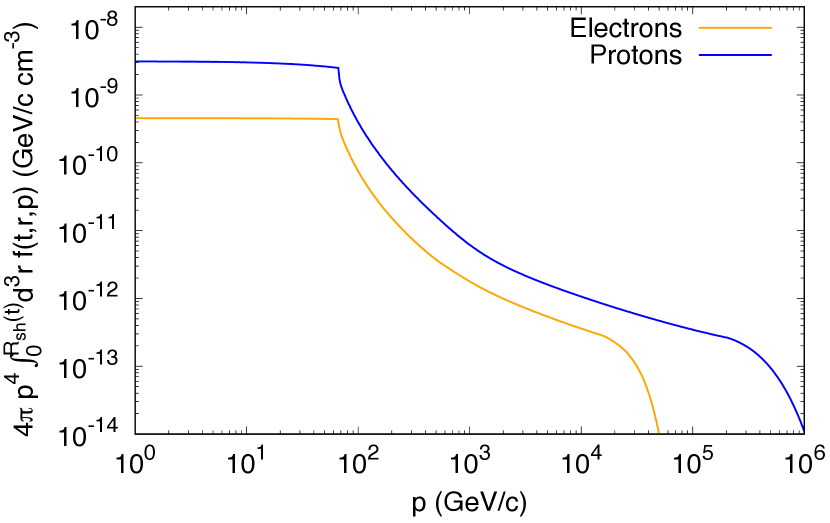
To better understand the shape of the non-thermal radiation, it is useful to have a closer look at the particles spectra. Figure 12 shows both electron and proton spectra spatially integrated in the remnant interior at the present time. The maximum energy reached at is 65 GeV for both electrons and protons: below this energy, particles are all confined and their spectrum is proportional to , as set through Eq. (5), while above the spectra steepen as a consequence of the escaping process. We highlight that the flattening observed towards the largest energies is due to the contribution of the shock precursor, where particles do not suffer adiabatic losses. The cutoffs observed at the highest energies are due to the absolute maximum energy reached at the beginning of the ST phase, which for protons is TeV while, for electrons is a factor 10 lower due to severe synchrotron losses, resulting in TeV. We note that the maximum energy we derived here is much larger than the interval GeV obtained by Katagiri et al. (2011).
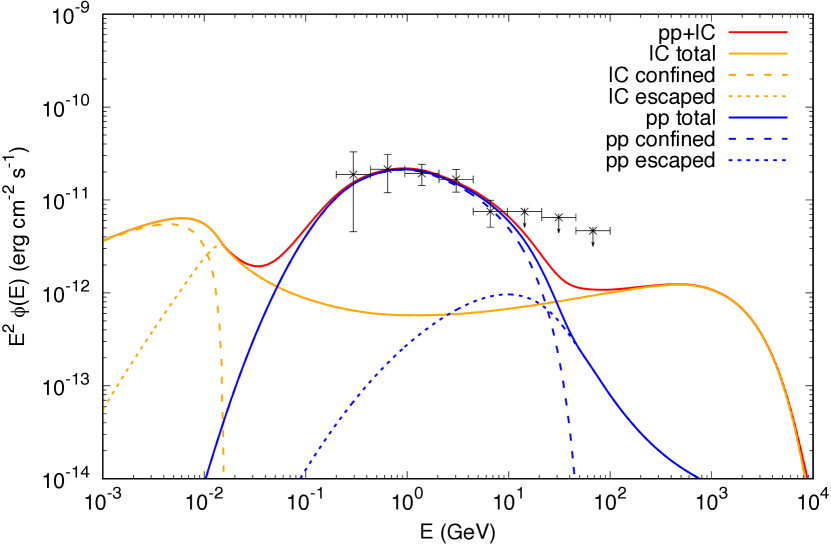
In the following, we outline how data constrain each single parameter of the model. First of all, the radio spectral index fixes the particle spectral slope through the relation , hence , in good agreement with linear DSA prediction. As the observed -ray spectrum is expected to arise entirely though pp collisions, its normalisation allows us to fix the acceleration efficiency , once the target density is fixed, while the spectral shape beyond few GeV simultaneously constraints , and . Unfortunately, the lacks data beyond a few 10 GeV results in some degeneracy between those three parameters. Hence, we decided to make the conservative assumption , which allows us to constrain TeV and in order to reproduce the -ray data as shown in Figure 10. It is worth stressing that the IC emission spectrum from escaping electrons is quite flat and dominates the emission above GeV. Even if those electrons have been accelerated in the past, a fraction of them is still located inside the SNR and its amount depends on the diffusion coefficient like . As a consequence, our choice of should be considered as a lower limit, in that would result in overshooting the Fermi-LAT upper limits above 10 GeV.
An interesting test for our model would be to look for the TeV emission produced through IC by escaping electrons. The differential flux at 1 TeV is erg s-1 cm-2, well within the sensitivity range of current imaging atmospheric Cherenkov telescopes (IACTs). Unfortunately, the Cygnus Loop is very extended, what makes the observation very challenging for the small field of view (FoV) of IACTs. An attempt was made by the MAGIC collaboration (Reichardt Candel, 2012), resulting only in upper limits (compatible with our predictions). The large IC flux produced by the escaping electrons in the -ray band results from the large electron density as inferred from the radio data. In fact, radio data allow to estimate the remaining parameters, and , which are 0.15 and G, respectively, for our fiducial model shown in Figure 11. In particular, the magnetic field is determined by the absence of any spectral break up to the highest frequency point detected by Planck at 30 GHz. For our fiducial model the breaking frequency is located at GHz and below such energy the emission behaves like a single power-law. Values of much smaller than G are incompatible with the radio data as shown in Figure 11, where we also display the synchrotron emission from a model with G, keeping all the other parameters unchanged. Such a low magnetic field implies GHz and underestimates the synchrotron emission as measured by Planck. In addition G implies , a very large value that has never been inferred in other SNRs.
On the contrary, G is still compatible with the radio data, but it would violate the pressure equilibrium. In fact, the detection of H emission from several regions of the forward shock (Blair et al., 2005) implies that the temperature of the CSM has to be K, hence the ratio between magnetic and thermal pressures is implying that cannot be much larger than the value adopted here.
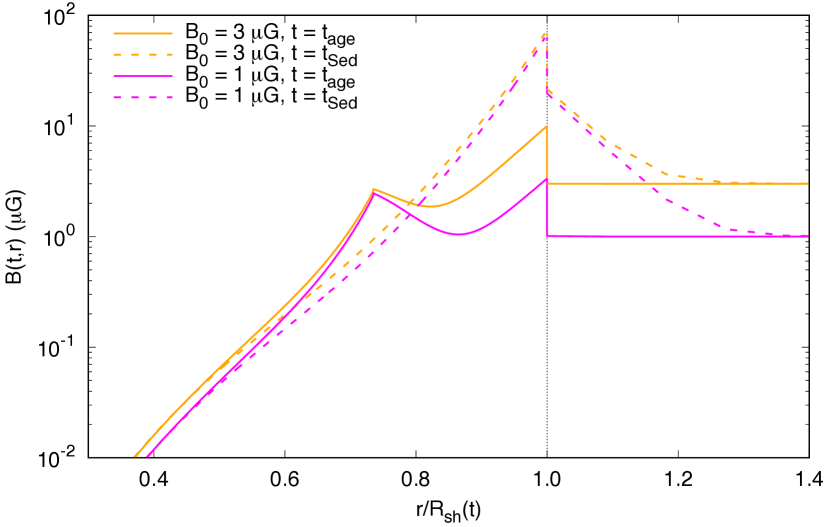
In Figure 13, we show the profile of magnetic field strength inside and outside the SNR at and at . In the first case, the amplification is very efficient, giving , which after the compression at the shock rises up to G, while for decreases due to adiabatic losses. In addition, a precursor upstream of the shock develops with a thickness . On the contrary, the amplification is inefficient at the present age, resulting in and G. A precursor is still present with but is not visible in the plotted scale. The peak observed at corresponds, instead, to the plasma that has been shocked at the , namely when the magnetic field amplification was much more efficient. Nevertheless, the contribution of this region to the overall radio emission today is negligible. The same profile is also shown for the case with G. Interestingly, the peak value at is very close to the case with G, confirming that the magnetic field there was dominated by the amplification process.
In the Appendix A, we demonstrate how the inferred level of turbulence in the precursor is compatible with that being determined by the competition between the CR amplification and the damping due to ion-neutral friction. At the same time, this damping can explain the temperature of the shock precursor as measured through Balmer emission.
Concerning the energy budget, the total content in the non-thermal particles located inside the SNR is erg and erg for electrons and protons, respectively. The total energy in magnetic field instead is erg. Hence, it is clear that the equipartition argument illustrated in Sect. 4 does not hold. This is not surprising, given that a SNR is a transient system where non-thermal particles do not have enough time to equilibrate with the magnetic field which is, instead, a byproduct of instabilities involving mainly ions.
Figure 11 shows that Cygnus Loop is still producing non-thermal X-ray emission thanks to the residual component of non confined electrons. Such flux is much smaller than the detected X-ray emission, estimated to be in the [0.7-1.85] keV interval (Tomida et al., 2016) which is, however, compatible with being of purely thermal origin. In this work we do not attempt to model the thermal emission because it requires to account for the different chemical abundances to fit the X-ray lines, and goes beyond our aims. Nevertheless, as a consistency check, we can compare the electron temperature inferred from X-ray data with the proton temperature estimated from our model. X-ray emission detected with ROSAT from the whole SNR allow to infer an electron temperature of eV (Levenson et al., 1999). In our model, the post shock proton temperature is eV, which implies that the electron to proton temperature ratio is . Such a result is compatible with the finding that for shock speed below km s-1 the equilibration between electron and proton is quite efficient, resulting in (see, eg. Ghavamian et al., 2001).
A final comment concerns the value of which is found to be 0.15, quite larger than typical values estimated for young SNRs (like Tycho or SN 1006), which are in the range (Berezhko et al., 2013; Morlino & Caprioli, 2012; Morlino et al., 2009). This finding may be a peculiarity of the Cygnus Loop or may indicate that the electron/proton ratio is larger for middle-aged SNRs, suggesting that increases for decreasing shock speed. Indeed, the mechanism allowing electrons to be injected into the DSA is still far from being understood. Given the small Larmor radius, thermal electrons need to be pre-accelerated before to enter the DSA. Such pre-acceleration is probably due to kinetic instabilities that develop in the shock foot, as shown by particle-in-cell (PIC) simulations (Amano & Hoshino, 2010; Riquelme & Spitkovsky, 2011), which suggest that electron injection increases for increasing shock speed (Xu et al., 2019), contrary to our suggestion. Nevertheless, at the moment, PIC simulations are limited to explore 1D systems, and cannot catch the complex phenomenology of 3D reality. It is also important that may be lower than what estimated here if additional mechanisms able to amplify the magnetic field are present downstream of the shock, like turbulent dynamo processes (Giacalone & Jokipii, 2007). In such a case, the downstream magnetic field increases without modifying the proton maximum energy (which is mainly determined by the upstream magnetic field). Hence, the hadronic -ray emission would remain unaltered but the number of electrons required to match the radio data would be reduced because the product is fixed by the radio flux. A systematic study of SNRs showing possible correlation between the electron/proton ratio with SNR properties can shed light on this difficult problem.
7 Conclusions
We presented the spectral analysis performed on the whole Cygnus Loop SNR and on its two peculiar regions, NGC 6992 and the southern shell, by using the Medicina and SRT data between 7.0 and 24.8 GHz and the Planck data at 30 and 40 GHz.
Our observations at 8.5 GHz of the entire Cygnus Loop SNR confirm the tendency suggested by the Planck data, ruling out any spectral curvature up to high radio frequencies. By modelling the radio and -ray emission, we constrained the maximum particle energy (for both electrons and protons) at 65 GeV, and the magnetic field strength at the shock at 10 G. The model description of the radio data also constrains the electron density, revealing a dominant IC emission from escaping electrons in the -ray spectrum above 10 GeV. This result sheds new light on the electron contribution to the SNR spectral features at high energies. In this respect, new -ray observations with the next IACT generation, like the Cherenkov Telescope Array777https://www.cta-observatory.org (CTA), could be crucial to investigate the emission produced through IC by escaping electrons at energies TeV and place observing constraints on this spectral tendency. On the other hand, high-frequency radio data are also required to better constrain the electron density and the background magnetic field . The new multi-feed -band (33-50 GHz) receiver (Navarrini et al., 2016), that is currently being implemented for SRT, will allow us to explore this range.
We investigated the integrated spectrum of NGC 6992 and the southern shell between 7.0 and 44 GHz, by using our single-dish data and the Planck flux density measurements. Both regions present a spectrum flatter than the one associated with the whole Cygnus Loop SNR, showing no indication of a spectral cutoff. The Planck data indicated a flux density rising at 44 GHz in the NGC 6992 spectrum that we attributed to a significant dust-emission contribution. In the case of the southern shell, Planck measurements suggested a concave-up spectral shape that we tentatively ascribed to an efficient production of CRs, which could modify the shock structure. For both regions, further sensitive flux density measurements in the range between and GHz are needed to firmly characterise their spectral tendency.
Unlike the case of the whole Cygnus Loop SNR, we could not model the non-thermal emission from NGC 6992 and the southern shell, because no separated -ray measurements are available for these regions. Nevertheless, we exploited the fact that the radio spectrum of both regions showed no indications for a spectral steepening to establish a lower limit on the break frequency of 25 GHz and estimate the magnetic field strength under the assumption of equipartition between the particle and magnetic field energy. For the southern shell, we obtained a value very similar to that estimated in the same way for the whole SNR, suggesting that this region is a good approximation for the properties of the whole SNR. In the case of NGC 6992, we obtained a higher magnetic field with respect to the average Cygnus Loop value. In addition, this region presents a harder radio spectrum with respect to the whole SNR. Both these findings may be a consequence of the fact that the shock is currently transiting to a radiative phase. However, these hypotheses can be tested only through a proper modelling of the non-thermal emission associated with this region possibly accounting for the presence of thermal Hydrogen which can significantly modify the shock dynamics (Morlino et al., 2013). In this regard, high spatial resolution -ray observations, which will be possible with CTA, will be crucial to achieve spatially-resolved images of the Cygnus Loop and constrain the maximum particle energy and magnetic field strength of its peculiar regions through refined models, like the one used in this work for the whole SNR.
Acknowledgements
The Sardinia Radio Telescope is funded by the Department of University and Research (MIUR), the Italian Space Agency (ASI), and the Autonomous Region of Sardinia (RAS), and is operated as a National Facility by the National Institute for Astrophysics (INAF). We deeply thank W. Reich for assistance and the very useful suggestions. We are very grateful to H. Katagiri for the useful discussion about the Fermi-LAT data. SL acknowledge contribution from the grant INAF CTA-SKA "Probing particle acceleration and -ray propagation with CTA and its precursors". GM acknowledges support from Grants ASI/INAF n. 2017-14-H.O, SKA- CTA-INAF 2016 and INAF-Mainstream 2018.
Data availability
The data underlying this article are all reported in the tables of the paper.
References
- Amano & Hoshino (2010) Amano T., Hoshino M., 2010, Phys. Rev. Lett., 104, 181102
- Amato (2014) Amato E., 2014, International Journal of Modern Physics D, 23, 1430013
- Amato & Blasi (2005) Amato E., Blasi P., 2005, MNRAS, 364, L76
- Amato & Blasi (2009) Amato E., Blasi P., 2009, MNRAS, 392, 1591
- Aschenbach & Leahy (1999) Aschenbach B., Leahy D. A., 1999, A&A, 341, 602
- Bell (2004) Bell A. R., 2004, MNRAS, 353, 550
- Berezhko et al. (2013) Berezhko E. G., Ksenofontov L. T., Volk H. J., 2013, in International Cosmic Ray Conference. p. 3163
- Blair et al. (2005) Blair W. P., Sankrit R., Raymond J. C., 2005, AJ, 129, 2268
- Blasi (2010) Blasi P., 2010, MNRAS, 402, 2807
- Blasi (2013) Blasi P., 2013, A&ARv, 21, 70
- Bolli et al. (2015) Bolli P., et al., 2015, Journal of Astronomical Instrumentation, 4, 1550008
- Brose et al. (2020) Brose R., Pohl M., Sushch I., Petruk O., Kuzyo T., 2020, A&A, 634, A59
- Castelletti et al. (2007) Castelletti G., Dubner G., Brogan C., Kassim N. E., 2007, A&A, 471, 537
- Celli et al. (2019) Celli S., Morlino G., Gabici S., Aharonian F. A., 2019, MNRAS, 490, 4317
- Condon & Ransom (2016) Condon J. J., Ransom S. M., 2016, Essential Radio Astronomy
- Condon et al. (1998) Condon J. J., Cotton W. D., Greisen E. W., Yin Q. F., Perley R. A., Taylor G. B., Broderick J. J., 1998, AJ, 115, 1693
- Dubner & Giacani (2015) Dubner G., Giacani E., 2015, A&ARv, 23, 3
- Egron et al. (2016) Egron E., Pellizzoni A., Iacolina M. N., Loru S., Righini S., Trois A., SRT Astrophysical Validation Team 2016, INAF - Osservatorio Astronomico di Cagliari. Internal Report N.59,
- Egron et al. (2017) Egron E., et al., 2017, MNRAS, 470, 1329
- Evoli et al. (2019) Evoli C., Aloisio R., Blasi P., 2019, Phys. Rev. D, 99, 103023
- Fesen et al. (2018) Fesen R. A., Neustadt J. M. M., Black C. S., Milisavljevic D., 2018, MNRAS, 475, 3996
- Fürst & Reich (1986) Fürst E., Reich W., 1986, A&A, 163, 185
- Ghavamian et al. (2001) Ghavamian P., Raymond J., Smith R. C., Hartigan P., 2001, ApJ, 547, 995
- Giacalone & Jokipii (2007) Giacalone J., Jokipii J. R., 2007, ApJ, 663, L41
- Green (1990) Green D. A., 1990, AJ, 100, 1927
- Green (2011) Green D. A., 2011, Bulletin of the Astronomical Society of India, 39, 289
- Green (2019) Green D. A., 2019, Journal of Astrophysics and Astronomy, 40, 36
- Hester & Cox (1986) Hester J. J., Cox D. P., 1986, ApJ, 300, 675
- Hester et al. (1994) Hester J. J., Raymond J. C., Blair W. P., 1994, ApJ, 420, 721
- Kafexhiu et al. (2014) Kafexhiu E., Aharonian F., Taylor A. M., Vila G. S., 2014, Phys. Rev. D, 90, 123014
- Katagiri et al. (2011) Katagiri H., et al., 2011, ApJ, 741, 44
- Katsuda et al. (2011) Katsuda S., et al., 2011, ApJ, 730, 24
- Katsuda et al. (2016) Katsuda S., et al., 2016, ApJ, 819, L32
- Keen et al. (1973) Keen N. J., Wilson W. E., Haslam C. G. T., Graham D. A., Thomasson P., 1973, A&A, 28, 197
- Kenderdine (1963) Kenderdine S., 1963, MNRAS, 126, 55
- Kulsrud & Cesarsky (1971) Kulsrud R. M., Cesarsky C. J., 1971, Astrophys. Lett., 8, 189
- Kundu (1969) Kundu M. R., 1969, ApJ, 158, L103
- Kundu & Becker (1972) Kundu M. R., Becker R. H., 1972, AJ, 77, 459
- Kundu & Velusamy (1967) Kundu M. R., Velusamy T., 1967, Annales d’Astrophysique, 30, 723
- Leahy (2002) Leahy D. A., 2002, AJ, 123, 2689
- Leahy (2004) Leahy D. A., 2004, MNRAS, 351, 385
- Leahy (2005) Leahy D. A., 2005, AJ, 130, 165
- Leahy & Hassan (2013) Leahy D., Hassan M., 2013, ApJ, 764, 55
- Leahy & Roger (1998) Leahy D. A., Roger R. S., 1998, ApJ, 505, 784
- Leahy et al. (1997) Leahy D. A., Roger R. S., Ballantyne D., 1997, AJ, 114, 2081
- Levenson et al. (1998) Levenson N. A., Graham J. R., Keller L. D., Richter M. J., 1998, ApJS, 118, 541
- Levenson et al. (1999) Levenson N. A., Graham J. R., Snowden S. L., 1999, ApJ, 526, 874
- Loru et al. (2019) Loru S., et al., 2019, MNRAS, 482, 3857
- Marongiu et al. (2020) Marongiu M., et al., 2020, arXiv e-prints, p. arXiv:2004.00346
- Massaro et al. (2014) Massaro F., Giroletti M., D’Abrusco R., Masetti N., Paggi A., Cowperthwaite P. S., Tosti G., Funk S., 2014, ApJS, 213, 3
- Mathewson et al. (1960) Mathewson D. S., Large M. I., Haslam C. G. T., 1960, MNRAS, 121, 543
- Melis et al. (2018) Melis A., et al., 2018, Journal of Astronomical Instrumentation, 7, 1850004
- Morlino (2017) Morlino G., 2017, High-Energy Cosmic Rays from Supernovae. p. 1711, doi:10.1007/978-3-319-21846-5_11
- Morlino & Caprioli (2012) Morlino G., Caprioli D., 2012, A&A, 538, A81
- Morlino & Celli (2020) Morlino G., Celli S., 2020, In preparation
- Morlino et al. (2009) Morlino G., Amato E., Blasi P., 2009, MNRAS, 392, 240
- Morlino et al. (2013) Morlino G., Blasi P., Bandiera R., Amato E., Caprioli D., 2013, ApJ, 768, 148
- Navarrini et al. (2016) Navarrini A., et al., 2016, in 27th international symposium on space therahertz technology.
- Ofek & Frail (2011) Ofek E. O., Frail D. A., 2011, ApJ, 737, 45
- Ohira et al. (2012) Ohira Y., Yamazaki R., Kawanaka N., Ioka K., 2012, MNRAS, 427, 91
- Onić (2013) Onić D., 2013, Ap&SS, 346, 3
- Onić & Urošević (2015) Onić D., Urošević D., 2015, ApJ, 805, 119
- Onić et al. (2017) Onić D., Urošević D., Leahy D., 2017, AJ, 153, 32
- Orfei et al. (2010) Orfei A., et al., 2010, IEEE Antennas and Propagation Magazine, 52, 62
- Ostrowski (1999) Ostrowski M., 1999, A&A, 345, 256
- Perley & Butler (2013) Perley R. A., Butler B. J., 2013, ApJ, 204, 19
- Planck Collaboration et al. (2016) Planck Collaboration et al., 2016, A&A, 586, A133
- Prandoni et al. (2017) Prandoni I., et al., 2017, A&A, 608, A40
- Reichardt Candel (2012) Reichardt Candel I., 2012, PhD thesis, 663, L41
- Reynolds (2008) Reynolds S. P., 2008, ARA&A, 46, 89
- Reynolds (2011) Reynolds S. P., 2011, Ap&SS, 336, 257
- Riquelme & Spitkovsky (2011) Riquelme M. A., Spitkovsky A., 2011, ApJ, 733, 63
- Roger et al. (1999) Roger R. S., Costain C. H., Landecker T. L., Swerdlyk C. M., 1999, A&AS, 137, 7
- Sastry et al. (1981) Sastry C. V., Dwarakanath K. S., Shevgaonkar R. K., 1981, Journal of Astrophysics and Astronomy, 2, 339
- Skilling (1975) Skilling J., 1975, MNRAS, 173, 245
- Sun et al. (2006) Sun X. H., Reich W., Han J. L., Reich P., Wielebinski R., 2006, A&A, 447, 937
- Szentgyorgyi et al. (2000) Szentgyorgyi A. H., Raymond J. C., Hester J. J., Curiel S., 2000, ApJ, 529, 279
- Tomida et al. (2016) Tomida H., Uchida D., Tsunemi H., Imatani R., Kimura M., Nakahira S., Hanayama T., Yoshidome K., 2016, PASJ, 68, S32
- Truelove & McKee (1999) Truelove J. K., McKee C. F., 1999, ApJS, 120, 299
- Urošević (2014) Urošević D., 2014, Ap&SS, 354, 541
- Uyanıker et al. (2002) Uyanıker B., Reich W., Yar A., Kothes R., Fürst E., 2002, A&A, 389, L61
- Uyanıker et al. (2004) Uyanıker B., Reich W., Yar A., Fürst E., 2004, A&A, 426, 909
- Vollmer et al. (2010) Vollmer B., et al., 2010, A&A, 511, A53
- Xu et al. (2019) Xu R., Spitkovsky A., Caprioli D., 2019, arXiv e-prints, p. arXiv:1908.07890
- Zirakashvili & Aharonian (2007) Zirakashvili V. N., Aharonian F., 2007, A&A, 465, 695
Appendix A The shock precursor
One of the main finding of our acceleration model is the fact that the particle maximum energy in the ST stage decreases in time like . This is quite remarkable because the streaming instability (resonant and non resonant) predicts a less pronounced decrease, with . One possible explanation for our finding is connected to the presence of neutral Hydrogen in the CSM, which in the case of Cygnus Loop is firmly established by the detection of H emission (see, e.g. Blair et al., 2005). In fact, neutral atoms can damp the amplified magnetic waves, making the particle escape from the source easier. Here, we show that this assumption is compatible with the level of magnetic turbulence that we have found and above which, quite remarkably, can also account for the temperature increase observed in the precursor ahead of the shock (Katsuda et al., 2016).
We start from the common assumption that the magnetic turbulence upstream consists of Alfvén waves excited by streaming instability with a rate (integrated over all momenta) given by (Skilling, 1975)
| (9) |
where is the Alfvén speed, is the ion mass density and the CR pressure at the shock. At the same time, the turbulence is damped by the ion-neutral friction with a damping rate (Kulsrud & Cesarsky, 1971):
| (10) |
where is the ion neutral collision frequency, is the neutral Hydrogen density and the plasma temperature. For reasonable values of and , the damping timescale ranges between few years to few tens of years, hence it is much smaller than the advection time in the precursor, given by yr. In such a situation, the level of magnetic turbulence is given by the equilibrium condition between damping and growth, i.e. . Approximating , where pc is the CR precursor length, the equilibrium condition gives:
| (11) |
Using the parameter values in Table 8 and assuming a neutral fraction of 0.5, we found , namely 3 times larger than the value found in Sect. 6.2. Given the uncertainties in several parameters, we consider this result in fair agreement with our model.
An interesting method to test the level of magnetic turbulence in the shock precursor is through the measurement of its temperature. Blair et al. (2005) and Katsuda et al. (2016) detected Balmer emission from non-radiative shocks in the northeastern part of the Cygnus Loop, reporting a clear detection also in the region upstream of the shock. Measuring the H line width, they inferred a temperature of K in an extended region of pc attributed to a photo-ionization precursor plus a smaller region close to the shock with K and size cm, which they attribute to a tiny CR precursor. However, temperatures K lead to complete ionization of neutral hydrogen in equilibrium, so that H emission from the filament would not be detected. Thus, the reported observation implies that the pre-shock gas is heated in a thin precursor. Katsuda et al. (2016) argued that the damping of Alfvén waves could account for at least a fraction of this heating, and here we want to investigate this scenario. The total energy density released by the turbulent damping into a plasma element that crosses the whole precursor is . This energy is completely converted into heating, hence, neglecting radiation losses, the final plasma temperature just ahead of the shock is given by the relation , where is the Boltzmann constant and K is the far upstream temperature. Using the same values as above, we have
| (12) |
a value in between the extended and the small precursors’ temperatures. This is a quite remarkable result, in that we have not tuned any parameter of the model to get it, and demonstrates that Alfvén wave damping can be the main process to heat the shock precursor. One should note, however, that the CR precursor length that we estimated is times larger than the extended precursor and times larger than the smaller and hotter precursor. Hence the extended precursor could be mainly heated by CRs rather than by ionizing photons. On the other hand, the thinner precursor requires an additional heating which may be provided either by very low energy CRs ( MeV) or by fast neutrals (Katsuda et al., 2016). A proper answer can be provided by using a model for particle acceleration in presence of neutral plasma (Morlino et al., 2013).