ALMA Observations of the Inner Cavity in the Protoplanetary Disk around Sz 84
Abstract
We present Atacama Large Millimeter/submillimeter Array (ALMA) observations of a protoplanetary disk around the T Tauri star Sz 84 and analyses of the structures of the inner cavity in the central region of the dust disk. Sz 84’s spectral energy distribution (SED) has been known to exhibit negligible infrared excess at 10 m due to the disk’s cavity structure. Analyses of the observed visibilities of dust continuum at 1.3 mm and the SED indicate that the size of the cavity in the disk of large (millimeter size) dust grains is 8 au in radius and that in the disk of small (sub-micron size) dust grains is 60 au in radius. Furthermore, from the SED analyses, we estimate that the upper limit mass of small dust grains at 60 au is less than 10-3 , which is 0.01 % of the total (small large) dust mass at 60 au. These results suggest that large dust grains are dominant at 60 au, implying that dust grains efficiently grow with less efficient fragmentation in this region, potentially due to weak turbulence and/or stickier dust grains. The balance of grain growth and dust fragmentation is an important factor for determining the size of large dust grains in protoplanetary disks, and thus Sz 84 could serve as a good testbed for investigations of grain growth in such disks.
1 Introduction
Planet formation is believed to take place in protoplanetary disks. In its earliest stages, dust grains grow. For small (sub-micron size) dust grains, which are comparable to typical interstellar medium dust in size, van der Waals forces cause the dust grains, which exhibit Brownian motion, to stick when they collide. Beyond the millimeter size, dust grains can grow into planetesimals a kilometer (or larger) in size via either direct collisional aggregation of dust grains (e.g., Weidenschilling & Cuzzi, 1993; Kataoka et al., 2013) or some instabilities such as streaming instabilities (e.g., Johansen et al., 2014). The accretion of such planetesimals eventually leads to the formation of planets.
Grain growth in protoplanetary disks has been extensively investigated (e.g., Testi et al., 2014). Theoretically, grain growth is limited by two processes, namely radial drift and fragmentation. Radial drift occurs when dust grains become large enough to decouple from the disk gas and then experience a head wind (Weidenschilling, 1977). Accordingly, dust size is limited when dust grains undergo radial drift. Fragmentation also limits grain growth. It occurs when the relative velocity of colliding dust grains becomes high enough to result in fragmentation rather than a merger.
Observational investigations of grain growth have been conducted at (sub-)millimeter wavelengths (e.g., Testi et al., 2003; Pérez et al., 2012; Testi et al., 2014). Optical and infrared (IR) observations can trace the surface layer of the disk due to the layer’s large optical depth, whereas (sub-)millimeter observations probe thermal emissions from the disk midplane region, where grain growth is the most efficient. This region becomes optically thin (or thinner) at longer wavelengths. As dust grains grow, the dust opacity (), which is approximated as , and its index () both decrease (e.g., Miyake & Nakagawa, 1993; Draine, 2006). Based on the Rayleigh-Jeans limit and the optically thin assumption, the observed flux can be expressed as , and thus multiple wavelength observations can be used to measure even if the absolute dust opacity is unknown.
In addition to determining , comparisons of disk structures observed at near-infrared (NIR) and (sub-)millimeter wavelengths are useful for exploring grain growth. When a cavity structure in the central region of a disk (such disks are called transitional disks111There are two types of transitional disk in the simple classical picture based on SED analyses (e.g., Espaillat et al., 2014). One has a cavity in which the central region of the disk is optically thin, and the other is an optically thick disk separated into inner and outer disks by an optically thin gap. Recent studies on transitional disks by Francis & van der Marel (2020) suggest that the existence of the inner disk responsible for the NIR excess does not correlate with that in the dust continuum at (sub-)millimeter wavelengths, and that this discrepancy may not exist for large dust grains.; e.g., Espaillat et al., 2014) is observed directly, it may have different sizes at different wavelengths (e.g., Dong et al., 2012; Garufi et al., 2013; van der Marel et al., 2013; Villenave et al., 2019). One explanation for the different cavity sizes at different wavelengths is the trapping of large (millimeter size) dust grains (e.g., Rice et al., 2006) by planet–disk interactions (e.g., Zhu et al., 2012). A planet embedded in a disk reduces the surface density of the gas and creates a gas gap at the planetary orbital radius. The gap thereby produces a gas pressure bump at its outer edge where large dust grains are trapped. Because the small dust grains coupled to the gas can flow inside the gas pressure bump, their cavity sizes are smaller. This spatial segregation can be used as a proxy of grain growth in the disk.
Dust growth itself can also spatially segregate cavities without dust trapping. The trend of such segregation is opposite to that mentioned above. Numerical simulations of grain growth (e.g., Dullemond & Dominik, 2005; Birnstiel et al., 2012) show that small dust grains, which are the main components of NIR excesses in the spectral energy distribution (SED), grow into large (millimeter size) dust grains within a time scale of 0.1 Myr at 1 au if dust fragmentation is negligible. When small dust grains in the central region of a protoplanetary disk are removed, the corresponding SED shows a deficit of flux at NIR wavelengths. Because grain growth proceeds in an inside-out manner, which is due to higher gas density and a faster dynamical time scale in the inner disk (e.g., Dullemond & Dominik, 2005; Brauer et al., 2008), the small and large dust grains are predicted to be preferentially distributed in the outer and inner regions of the disk, respectively. Such opposite distributions of small and large dust grains were reported for the transitional disk around DM Tau (Kudo et al., 2018; Hashimoto et al. submitted), in which the cavity in the disk of small dust grains is inferred to be located at 3 au. Large dust grains are present even within this cavity. These results suggest that small dust grains at a few au around DM Tau efficiently grow into large dust grains with less efficient fragmentation, possibly due to weak turbulence and/or stickier dust grains (e.g., Steinpilz et al., 2019).
In this paper, we report another example of an opposite spatial segregation for a cavity in the disk around the T Tauri star Sz 84 (spectral type: M5, Alcalá et al., 2014; : 3162 K, Hendler et al., 2020; : 0.2 , Alcalá et al., 2014; age: 1 Myr, Alcalá et al., 2014; distance: 152.6 pc, Gaia Collaboration et al., 2018; disk inclination: 75°, Ansdell et al., 2016). The SED of Sz 84 shows no or very weak IR excesses at 10 m, which has been interpreted as indicating the presence of an almost clean cavity in the disk of small dust grains at 55 au (i.e., negligible small dust grains inside the cavity; e.g., Merín et al., 2010). Subsequent Atacama Large Millimeter/submillimeter Array (ALMA) observations of Sz 84 with a beam size of 03 (46 au) showed no cavity structures in the dust continuum image (Ansdell et al., 2016), even though visibility analyses suggested a cavity structure at 20–41 au (Tazzari et al., 2017; van der Marel et al., 2018). These results suggest that the size of the cavity in the disk of small dust grains (55 au) could be larger than that in the disk of large dust grains (20–41 au). The 13CO gas disk around Sz 84 reveals no cavity structure in integrated CO visibilities (van der Marel et al., 2018). However, gas cavities tend to be 1.5–3 times smaller than dust cavities (van der Marel et al., 2016, 2018), and thus the available data may simply not resolve a gas cavity. Furthermore, it is reasonable to assume that the mass accretion rate of Sz 84, 1 10-9 /yr (Manara et al., 2014), is comparable to that of typical T Tauri stars (Najita et al., 2015). These two observational results predict that small dust grains well coupled to the gas exist in the vicinity of the central star (they arrive there by flowing inside the cavity), possibly explaining the smaller size of the cavity in the disk of small dust grains. However, as mentioned above, analyses of the visibilities of the dust continuum and the SED in the literature show the opposite observational results. The origin of Sz 84’s cavity in the disk of small dust grains with a moderate mass accretion rate is still unclear (e.g., Manara et al., 2014).
2 Observations
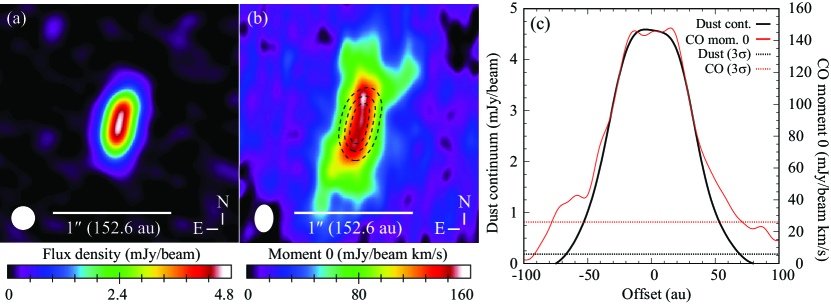
ALMA observations of Sz 84 were carried out with band 6 in cycle 3 (ID: 2015.1.01301.S; PI: J. Hashimoto); they are summarized in Table 1. The data were calibrated using the Common Astronomy Software Applications (CASA) package (McMullin et al., 2007) with the calibration scripts provided by ALMA. We conducted a self-calibration of the visibilities. The phases were self-calibrated once with fairly long solution intervals (solint=‘inf’) that combined all spectral windows. The proper motions of Sz 84 were calculated with the function EPOCH_PROP in GAIA ADQL (Astronomical Data Query Language222https://gea.esac.esa.int/archive/). The phase centers were corrected using fixvis in the CASA tools. The dust continuum image at band 6 was synthesized by CASA with the CLEAN task using a multi-frequency deconvolution algorithm (Rau & Cornwell, 2011). In the CLEAN task, we set the -taper to obtain a nearly circular beam pattern (Table 1). The synthesized dust continuum image is shown in Figure 1. The root-mean-square (r.m.s.) noise in the region far from the object is 61.3 Jy/beam with a beam size of 198 195 mas at a position angle (PA) of 88.5.
In addition to our own data, two archival dust continuum datasets were used for our visibility analysis in § 4.1. They were taken with band 3 in cycle 4 (ID: 2016.1.00571.S; PI: M. Tazzari) and band 7 in cycle 2 (ID: 2013.1.00220.S; PI: J. Williams). The calibration procedures described above were applied to these data. These additional observations are summarized in Table 4 in the Appendix. Because the data quality (spatial resolution and sensitivity) of our band 6 data is better than that of the archival data, whose spatial resolution is 03, we only show the band 6 image in Figure 1.
The 12CO line data (Table 1) were extracted by subtracting the continuum in the plane using the uvcontsub task in the CASA tools. A line image cube with channel widths of 1.0 km/s was produced by the CLEAN task. The integrated line flux map (moment 0) and the intensity-weighted velocity map (moment 1) are shown in Figures 1 and 2, respectively. The channel maps at 1.0 to 11.0 km/s are shown in Figure 6 in the Appendix. The r.m.s. noise in the moment 0 map is 8.7 mJy/beamkm/s with a beam size of 235 161 mas at a PA of 2.0 and that in the moment 1 map at the 1.0 km/s bin is 2.37 mJy/beam. The peak signal-to-noise ratio (SNR) is 17.9 in the channel map of 7.0 km/s. 13CO line emissions were detected with a peak SNR of less than 5, and thus the images are not shown. We did not detect C18O line emissions.
| Observations | ||
|---|---|---|
| Observing date (UT) | 2016.Sep.17 | |
| Project code | 2015.1.01301.S | |
| Time on source (min) | 29.7 | |
| Number of antennas | 38 | |
| Baseline lengths | 15.1 m to 2.5 km | |
| Baseband Freqs. (GHz) | 219.5, 220.4, 230.5, 232.5 | |
| Channel width (MHz) | 0.122, 0.122, 0.122, 15.6 | |
| Continuum band width (GHz) | 2.3 | |
| Bandpass calibrator | J15172422 | |
| Flux calibrator | J14274206 | |
| Phase calibrator | J16103958 | |
| New phase center with GAIA | 15h58m2.50261s, -37d36m3.1145s | |
| Imaging | Dust continuum | 12CO |
| Bobust clean parameter | 2.0 | |
| Outer -taper parameter | 50.0 0.6 M with 183.0 | |
| Beam shape | 198 195 mas at PA of 88.5 | 235 161 mas at PA of 2.0 |
| r.m.s. noise (Jy/beam) | 61.3 | 2.37 103 at 1.0 km/s bin |
3 Results
Figures 1(a) and (b) show the dust continuum image at band 6 and the 12CO moment 0 map, respectively. Our observations clearly detect the spatially resolved disk in both images. However, no cavity structure appears in the central region of the disk in either image. The total flux density of the dust continuum derived from the visibility fitting in § 4.1 is 13.43 0.13 mJy, which is consistent with previous ALMA band 6 observations (12.63 0.21; Ansdell et al., 2018) assuming a 10 % uncertainty in absolute flux calibration. The 12CO integrated flux density at more than 3 is 1.89 0.05 Jy/beamkm/s.
We derived the spectral index based on band 3, 6, and 7 data. The total flux densities at bands 3 and 6 taken from our visibility fitting in § 4.1 are 1.70 0.06 and 13.43 0.13 mJy, respectively, and that at band 7 taken from van der Marel et al. (2018) is 33 0.4 mJy. Note that because our visibility fitting for band 7 data shows large uncertainty (Figure 10), we used the flux density reported in the literature. The value of was then calculated as 2.42 0.04, which is lower than the value of 2.7 found in other transitional disk systems (Pinilla et al., 2014). This indicates that larger dust grains are present in the disk or that the disk tends to be partially optically thick at (sub-)millimeter wavelengths.
Figure 1(c) shows radial cuts of the dust continuum (Figure 1a) and the 12CO moment 0 map (Figure 1b) at a PA of 165.71 taken from our modeling results in § 4.1. Their brightness profiles are similar at 50 au with a nearly flat slope at 20 au. In contrast, the two brightness profiles (Figure 1c) at 50 au deviate, possibly due to the larger size of the CO disk (Trapman et al., 2020) or the presence of small dust grains, which is discussed in § 4.2.
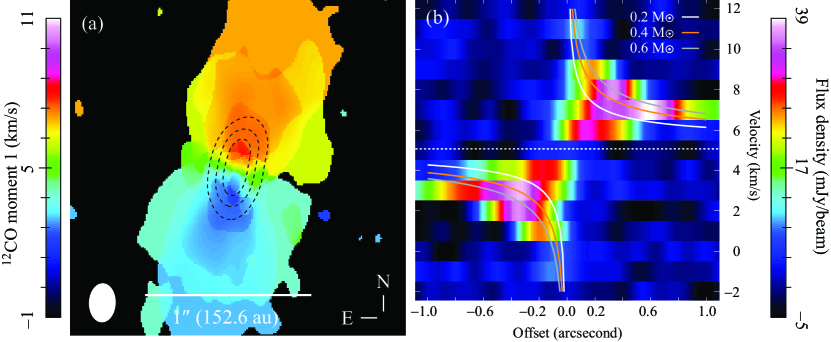
Figure 2 shows the 12CO moment 1 map and its position–velocity (PV) diagram at a PA of 165.71 and a disk inclination of 75.13 taken from § 4.1. The center of the CO gas motion in the moment 1 map nearly coincides with the center of the dust continuum emission (Figure 2a). We plotted the loci of the peak emission of a Keplerian disk around the central star by changing its mass from 0.2 to 0.6 in the PV diagram and found that the dynamical mass of Sz 84 is 0.4–0.6 . This value is consistent with the dynamical mass estimated from the 13CO line reported in the literature (0.4 0.1 ; Yen et al., 2018). Note that these estimates are roughly 2–3 times larger than the spectroscopically determined mass (0.16–0.18 ; Alcalá et al., 2017). This discrepancy may result from the high disk inclination of 75°. 12CO is generally optically thick and traces the surface layer of the disk, and thus the velocity structure could be largely affected by the high inclination. The disk vertical structure must be taken into account to derive a dynamical mass in the inclined disk system.
4 Modeling
In this section, we determine the radial structure of the dust disk around Sz 84 by conducting both visibility and SED fitting. Because the high disk inclination of 75°(Ansdell et al., 2016) makes characterizing a cavity with a radius of a few tens of au in an image challenging, modeling is necessary. As mentioned in the introduction (§ 1), (sub-)millimeter and near- to mid-IR observations are generally sensitive to large and small dust grains, respectively, and hence two models, one each for visibility and the SED, were used to determine the radial distributions of large and small dust grains, respectively. Note that van der Marel et al. (2018) derived these models using ALMA cycle 2 band 7 data for Sz 84. Modeling with our new dataset, which has better sensitivity and a better spatial resolution, could better constrain the structures of the dust disk.
4.1 Visibility fitting
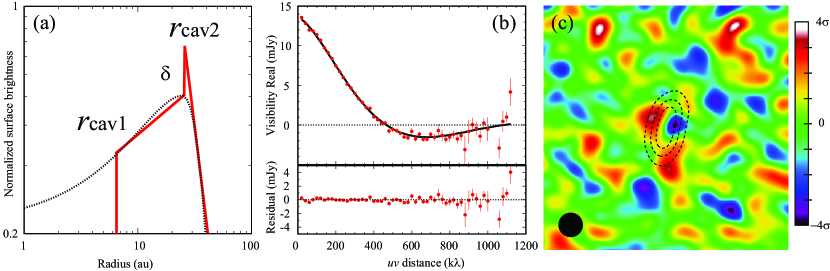
The visibilities of Sz 84 show a null point at 450 k (Figure 3b), which suggests cavity (or gap) structures in the protoplanetary disk (c.f., Zhang et al., 2016). To confirm the cavity structures, we performed visibility fitting, in which observed visibilities are reproduced with a parametric model of the disk by utilizing all the spatial frequency information.333We originally attempted to derive the disk structure from the band 3, 6, and 7 data simultaneously to map the spatial distribution of the spectral index . However, we mainly show the results from band 6 in this paper due to the insufficient baseline lengths and lower sensitivities of the band 3 and 7 data (Figures 9 and 10). Data from all three bands were used only to derive the average value of for the entire disk in § 3.
We describe the surface brightness distributions of the disk in our model with a simple power-law radial profile:
| (1) |
where , , and are a scaling factor, the exponent of the power law, and the normalization factor at , respectively. As shown below, this simple profile is sufficient for reproducing the observations. In the radial direction, we adopt the following scaling factors and exponents:
The best-fit surface brightness profile444Because the best-fit profile can be rather complex, we attempted to fit the best-fit profile with an asymmetric Gaussian profile (e.g., Pinilla et al., 2018) by eye in Figure 3(a). We found that the asymmetric Gaussian profile extends inside the inner cavity at , which results in significant IR excess, as shown in model C in § 4.2. Thus, we utilized the power-law radial profile in this paper. with explanations is shown in Figure 3(a). Because the SED of Sz 84 shows negligible NIR excess, we set no emissions at ; that is, . The total flux density () was set as a free parameter. The disk inclination () and PA were also set as free parameters. The phase center was fixed. In total, there are 8 free parameters in our model (, , , , , , , PA)555The value of was set to zero in the initial fitting. However, we immediately found that the model with 0 produces visibilities with an excessively deep gap at the -distance of 600k in Figure 3(b) and cannot well reproduce the observed visibilities. Therefore, we decided to set as a free parameter..
The modeled disk image was converted into complex visibilities with the public Python code vis_sample (Loomis et al., 2017), in which modeled visibilities are sampled with the same (, ) grid points as those in our observations. The modeled visibilities were deprojected666Visibilities were deprojected in the -plane using the following equations (e.g., Zhang et al., 2016):
where and PA are free parameters in our visibility analyses in § 4.1. with the system PA and as free parameters, and were calculated as azimuthal mean values () and standard deviations () within 20 k bins in the real part. The fitting was performed with the Markov chain Monte Carlo (MCMC) method in the emcee package (Foreman-Mackey et al., 2013). The log-likelihood function ln in the MCMC fitting was
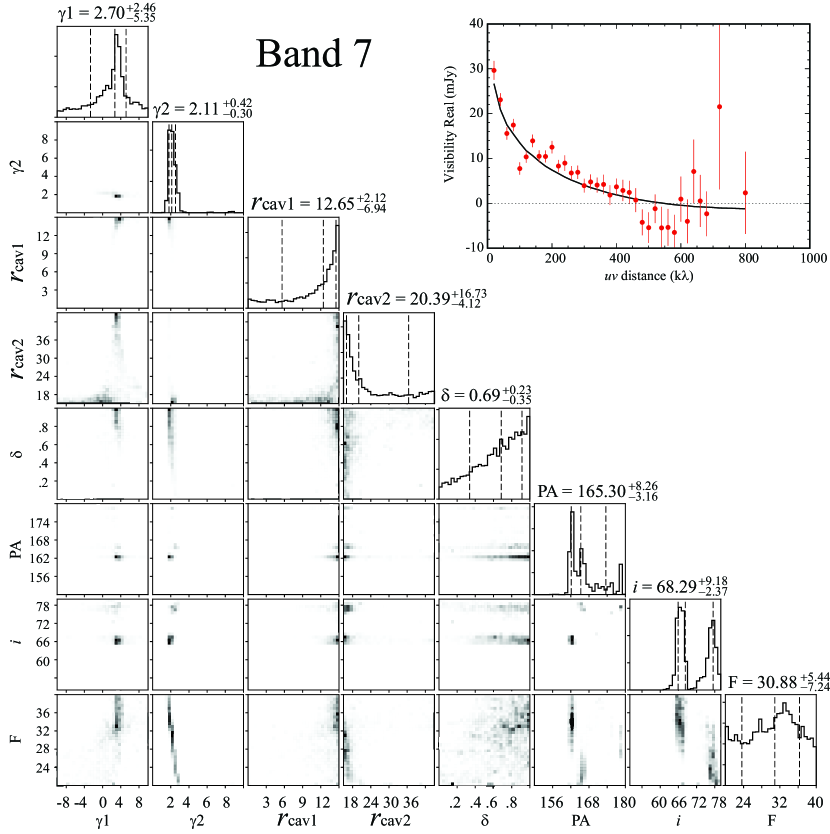
, where , , and are the observed and modeled visibilities and standard deviations in the real part, respectively. The subscript represents the -th bin. Our calculations used flat priors with the parameter ranges summarized in Table 1. The burn-in phase (from initial conditions to reasonable sampling) employed 2000 steps, and we ran another 2000 steps for convergence, for a total of 4000 steps with 200 walkers. These fitting procedures were also applied to the band 3 and 7 data with the same parameter ranges except for that of the total flux density. However, we found multiple peaks and a nearly flat posterior probability distribution, especially for the disk inclination and flux density in band 3 and 7 data, respectively, possibly due to shorter baseline lengths and lower sensitivities (Table 5 and Figures 9 and 10 in the Appendix). Therefore, we decided to use only the flux density from band 3 data (i.e., band 7 data were not used).
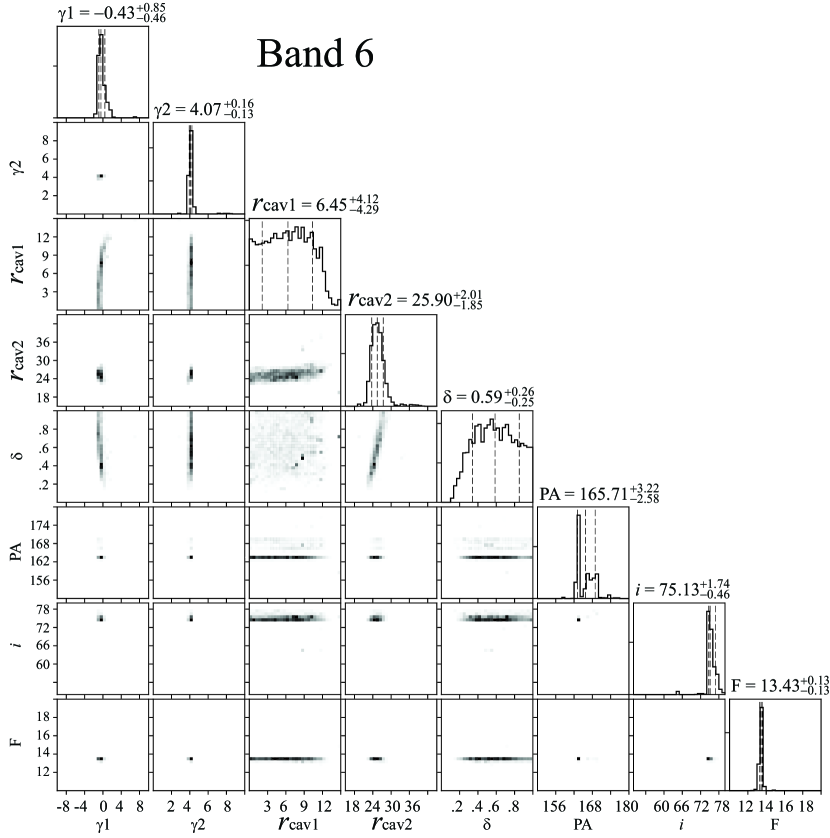
The fitting results with errors computed from the 16th and 84th percentiles are shown in Table 2, the radial profile of best-fit surface brightness is shown in Figure 3(a), the best-fit visibilities with a reduced- of 1.24 are shown in Figure 3(b), the best-fit modeled image is shown in Figure 7, and the probability distributions for the MCMC posteriors are shown in Figure 8. We found that the cavity at 26 au (i.e., ) is shallow with 0.2 (Figure 8). We also found that it is difficult to determine the size of the empty cavity (i.e., ) due to insufficient baselines in our observations, which have an upper limit of 10 au (Figure 8). A better constraint on this size can be obtained by the SED fitting (see § 4.2). The flux inside the 26 au cavity was measured at 4.4 mJy in the best-fit model disk, which is 33 % of the total flux at band 6. We subtracted the modeled visibilities from the observed ones, and made a CLEANed image (Figure 1c).
In § 3, we mentioned the similarity of the radial profiles at 50 au in the dust continuum and 12CO moment 0 images. As shown here, the dust continuum emission decreases at 26 au. Hence, the brightness of 12CO might decrease in the central region of the disk as well. Note that we assumed that the flux attenuation in the central region of the CO gas disk caused by the foreground cloud absorption is negligible due to the high inclination of Sz 84 (75.1).
| Flux | P.A. | Reduced | ||||||
|---|---|---|---|---|---|---|---|---|
| (mJy) | (au) | (au) | () | () | ||||
| 13.43 | 6.45 | 25.90 | 4.07 | 0.59 | 75.13 | 165.71 | 1.24 | |
| {10.0-20.0} | {0.0 .. 21.4} | {15.3 .. 45.8} | {0.0 .. 10} | {-10 .. 10} | {0.0 .. 1.0} | {50 .. 80} | {150 .. 180} |
Note. — Values in parentheses are parameter ranges in our MCMC calculations.
4.2 SED fitting
In the previous section, our model showed that the innermost cavity () is located at 10 au. Because Sz 84’s SED has negligible IR excess at 10 m (Figure 4e), we need to confirm that our model does not produce significant IR excess. Furthermore, we found a shallow cavity at 26 au in the disk of large dust grains in the previous section. This size is roughly consistent with the au estimated by van der Marel et al. (2018), who suggested that the 20 au cavity can reproduce the SED of Sz 84. However, this size is smaller than the cavity size derived from the SED analysis by Merín et al. (2010), namely 55 au in radius. Therefore, we revisited the SED analyses to constrain the radial distributions of both large and small dust grains by running radiative transfer modeling using a Monte Carlo radiative transfer (MCRT) code (HOCHUNK3D; Whitney et al., 2013).
The MCRT code follows a two-layer disk model with small (up to micron size) dust grains in the upper disk atmosphere and large (up to millimeter size) dust grains in the disk midplane (e.g., D’Alessio et al., 2006). The modeled disk structure and dust properties in the MCRT code are described in our previous studies (Hashimoto et al., 2015). Briefly, small dust grains are from the standard interstellar-medium dust model (a composite of silicates and graphites with a size distribution of from m to m) in Kim et al. (1994) and large dust grains (a composite of carbons and silicates with a size distribution of from m to m) are from Model 2 in Wood et al. (2002). The radial surface density was assumed to have a simple power-law radial profile similar to the equation in § 4.1:
where is the normalization factor at , is the normalized surface density determined from the total (gas dust) disk mass () assuming a gas-to-dust mass ratio of 100, is the scaling factor for the surface density (which is set to the same value as in § 4.1 for large dust grains), and is the radial gradient parameter. The scaling factor for small dust grains () was assumed to be zero at . The radial gradient parameters and (which are the same for disks of large and small dust grains) were fixed to reproduce the surface brightness derived in § 4.1, as explained below. The value of 26 au was taken from the result in § 4.1. and were free parameters. We set to reproduce a flux of 13.43 mJy at 1.3 mm. The scale heights () of large and small grains were assumed to vary as . For simplicity, we assumed 1.25 with a typical midplane temperature profile of . We fixed the scale heights of 1 au at 100 au for the disk of large dust grains (). Those of small dust grains () were varied to reproduce the flux at 60–70 m. The mass fraction () of large dust grains in the total dust mass was set to 0.9. The disk inclination was set to 75, as derived in our visibility analyses (§ 4.1). The HOCHUNK3D code calculates the accretion luminosity from the star based on the mass accretion rate. Half of the flux was emitted as X-rays (which heat the disk) and half as stellar flux at a higher temperature. We set a mass accretion rate of 1.3 10-9 /yr (Manara et al., 2014). In the code, we varied four parameters, namely , , , and , as shown in Table 3, along with the calculated at 1–100 m.
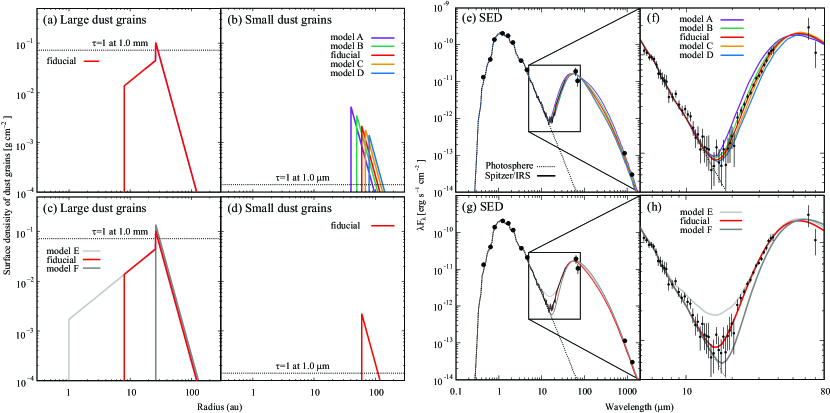
Figure 4 shows the surface densities and the SEDs for each model. Photometry and spectroscopy data used here are summarized in Table 5. Our fitting procedure included the following four steps.
- 1.
-
2.
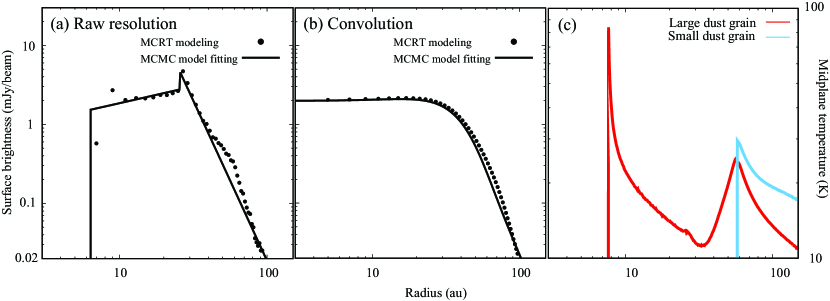
We iteratively varied the radial gradient parameters and to reproduce the radial surface brightness of the dust continuum at band 6 derived in § 4.1, and found that the values of 1.0 and 4.5 (fiducial model) well reproduce the surface brightness, as shown in Figures 11(a) and (b). The bumps at 10 and 60 au in the surface brightness of the MCRT modeling are attributed to those of the midplane temperature in Figure 11(c) due to irradiated cavity walls. We fixed these two values in the following procedures.
-
3.
To constrain the cavity size of small dust grains, was set to 40 (model A), 50 (model B), 60 (fiducial model), 70 (model C), and 80 au (model D), as shown in upper panels in Figure 4, with iterative adjustment of . The SED can be well reproduced by a cavity in the small dust with a size of au.
-
4.
Finally, we set at 1 (model E), 8 (fiducial model), and 26 au (model F), as shown in lower panels in Figure 4, to constrain the size of the inner cavity in the disk of large dust grains. The 8 au cavity, which is consistent with the results of MCMC modeling in § 4.1 (i.e., 10 au), is suitable for the fiducial model.
In summary, our modeling suggests that the small dust grains are located at 60 au and the large dust grains are distributed at 10 au 60 au. There is a dust-free region at 10 au.
Because we used two independent disk models in the visibility fitting (§ 4.1) and the SED fitting (§ 4.2), we compare the surface brightness of the two models at band 6 in Figure 11 to check their consistency. The maximum residual between the two surface brightness profiles convolved with the ALMA observation beam of 02 (30 au) in Figure 11(b) is 119 Jy/beam (1.9 ). This residual is insignificant and thus the two models are mutually consistent.
Our picture of the disk with small dust grains residing only at large radii is supported by gas observations. As shown in § 3, the radial profile of the CO moment 0 deviates from that of dust at au. Small dust grains are the main source of heating as they are present in the upper layer of the disk and are thus directly irradiated by the stellar light and effectively absorb it. Therefore, the outer disk is heated more effectively than the inner disk, which contains only a small amount of small dust grains. Because small dust grains do not emit effectively at (sub-)millimeter wavelengths and the amount of large dust grains rapidly decreases at outer radii (), these two facts do not greatly affect dust continuum emission. However, the 12CO gas emission mainly traces the temperature of the disk and therefore its moment 0 emission profile should be affected by the presence of small dust grains.
| Model | |||||||||||||||
|---|---|---|---|---|---|---|---|---|---|---|---|---|---|---|---|
| (au) | (au) | (au) | (au) | (au) | (au) | () | ( yr-1) | (°) | (°) | ||||||
| fiducial | 8.0 | — | 26.0 | 60.0 | 0.59 | 0 | 1.25 | 1.0 | 4.5 | 1.0 | 5.0 | 2.5 | 1.3 10-9 | 75 | 151.0 |
| A | 8.0 | — | 26.0 | 40.0 | 0.59 | 0 | 1.25 | 1.0 | 4.5 | 1.0 | 5.8 | 2.5 | 1.3 10-9 | 75 | 662.4 |
| B | 8.0 | — | 26.0 | 50.0 | 0.59 | 0 | 1.25 | 1.0 | 4.5 | 1.0 | 5.2 | 2.5 | 1.3 10-9 | 75 | 200.0 |
| C | 8.0 | — | 26.0 | 70.0 | 0.59 | 0 | 1.25 | 1.0 | 4.5 | 1.0 | 4.8 | 2.5 | 1.3 10-9 | 75 | 180.7 |
| D | 8.0 | — | 26.0 | 80.0 | 0.59 | 0 | 1.25 | 1.0 | 4.5 | 1.0 | 4.5 | 2.5 | 1.3 10-9 | 75 | 299.6 |
| E | 1.0 | — | 26.0 | 60.0 | 0.59 | 0 | 1.25 | 1.0 | 4.5 | 1.0 | 5.5 | 2.5 | 1.3 10-9 | 75 | 312.4 |
| F | 26.0 | — | 26.0 | 60.0 | 0.59 | 0 | 1.25 | 1.0 | 4.5 | 1.0 | 5.0 | 2.5 | 1.3 10-9 | 75 | 478.2 |
4.3 Upper limit on amount of small grains inside cavity
Following Beichman et al. (2005), we converted the upper limit on the measured IR (10 µm) flux at a certain wavelength into an upper limit on the amount of small dust grains inside the 60 au cavity, . At NIR wavelengths, the emission from large dust grains at 26 au is negligible, as shown in our SED fitting (§ 4.2). The value of is expected to be very small because the NIR flux is consistent with stellar photospherical emission. We assumed that the excess emission at NIR wavelengths is optically thin (i.e., a transitional disk with a cavity, Espaillat et al. 2010). The surface density of small dust grains inside the cavity, , was assumed to vary with the radius as
where 1 au and is the surface density at 1 au. The total dust mass is thus
We calculated the equilibrium temperature of optically thin dust at each radius inside the cavity, , using the HOCHUNK3D code. The total NIR flux from the cavity dust at a given wavelength is
where is the Planck function at and , and is the absorption opacity of small dust grains. Note that because our purpose is to derive the total mass of small dust grains from the upper limit of the observed flux, disk inclination is not needed to take into account in the calculation.
At 10 µm, the upper limit on the IR excess of the system is ergs s-1 cm-2. Assuming that is the dust sublimation radius at 0.03 at, is 60 au, and (self-similar viscous disk solution with viscosity radius, Lynden-Bell & Pringle 1974), the upper limit on is ( g cm-2, equivalent to ). We note that the value of is only weakly affected by the chosen wavelength. For example, using 3.35 , the associated upper limit on the disk flux ergs s-1 cm-2 yields . Decreasing reduces (e.g., setting 5 au results in ) and increasing has the opposite effect (e.g., setting 1 au results in ). Flattening or reversing the dependence of on radius yields a higher value of (e.g., setting results in ).
We conclude that the amount of small dust inside the millimeter emission cavity is tiny, less than a lunar mass under reasonable assumptions. The mass of large dust grains at 60 au is 7 , and thus the ratio of the mass of small dust grains to that of large dust grains is smaller than 10-4.
5 Discussion
5.1 Comparison with other systems
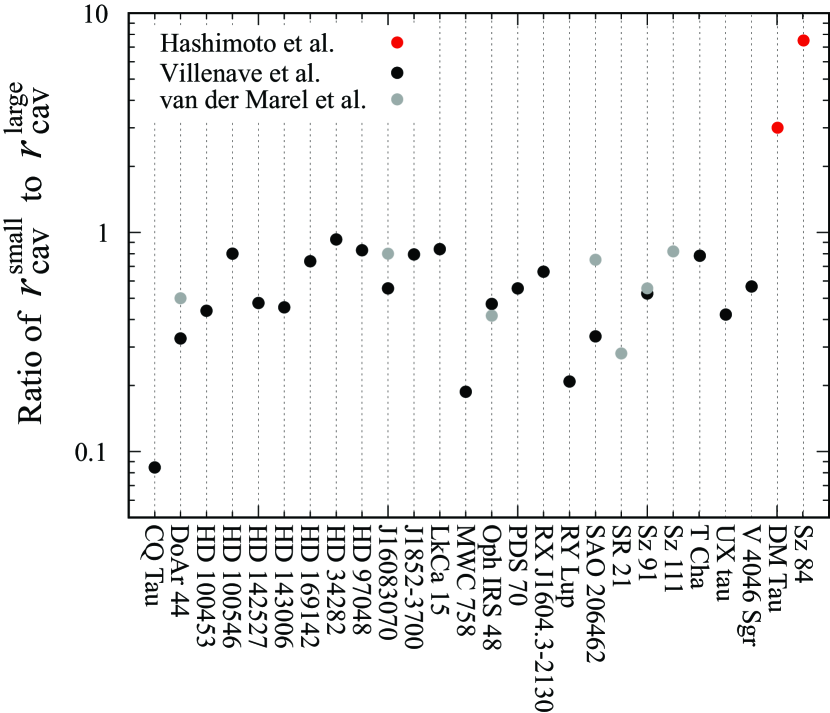
The sizes of the cavities of large and small dust grains have been discussed by combining NIR direct imaging and radio interferometry (e.g., Dong et al., 2012; Villenave et al., 2019). Additionally, assuming that small dust grains are well coupled to the gas, measured CO gas distributions might serve as a proxy of the spatial distribution of small dust grains. CO gas observations with sufficient spatial resolution and sensitivity have been conducted with ALMA (e.g., van der Marel et al., 2015, 2016, 2018). The general trend of the cavity sizes in the disk of large dust grains vs. small ones (or CO gas) indicates that the cavity size in the disk of large dust grains is largest. The ratios of to and those of to from the literature are compiled in Figure 5. These results can be interpreted as outcomes of planet–disk interactions (e.g., Zhu et al., 2012; de Juan Ovelar et al., 2013; Facchini et al., 2018), as described in § 1.
For Sz 84, the cavity sizes show the opposite trend (Figure 5), i.e., the disk composed of small dust grains has a larger cavity, as shown in § 4. As far as we know, such structures can only be found in DM Tau (3 au and 1 au; Hashimoto et al. submitted). Systems with a larger cavity in the disk of small dust grains may be relatively rare. Villenave et al. (2019) and van der Marel et al. (2016, 2018) compared the cavity sizes ( vs. or vs. ) for 24 objects and found that all the disks have larger cavities of large dust grains (Figure 5). There are currently two objects (Sz 84 and DM Tau) that have a larger cavity in the disk of small dust grains, accounting for 7.7 % of objects observed with NIR direct imaging and ALMA. However, current NIR observations are biased toward brighter objects ( band 12 mag) due to the limitations of the adaptive optics system. Future observations with extreme adaptive optics systems such as VLT/SPHERE and Subaru/SCExAO would increase the number of samples (especially faint objects) and thus further constrain the statistics.
5.2 Origin of cavities
Although systems with large dust grains inside the cavity in the disk of small dust grains may be rare, Sz 84 data have important implications for understanding planet formation. Here, we discuss the possible origins of such cavity structures. Some formation mechanisms of the cavity have been proposed, including photoevaporation (e.g., Clarke et al., 2001; Alexander et al., 2014), planet–disk interactions (e.g., Kley & Nelson, 2012), grain growth (e.g., Dullemond & Dominik, 2005), radiation pressure (e.g., Krumholz et al., 2019), and a combination of these mechanisms (e.g., planet grain growth; Zhu et al., 2012).
Photoevaporation — The basic idea of photoevaporation is that high-energy radiation (UV/X-ray) from the central star heats the surface of the disk, and the hot gas (103–104 K) escapes from the disk as a photoevaporative wind. Because small dust grains are well coupled to the gas, they flow with the gas, possibly resulting in similar sizes of the cavities in the disks of small dust grains and gas. However, 12CO emissions can be clearly seen at 60 au (Figure 1). Furthermore Sz 84 has a moderate mass accretion rate (Manara et al., 2014). Thus, photoevaporation does not seem to be a viable mechanism for creating the cavity in the disk around Sz 84 (e.g., Ercolano & Pascucci, 2017).
Planet–disk interactions — This mechanism is commonly considered as a potential origin of transitional disks (e.g., Espaillat et al., 2014). However, the robust detection of young planets that possibly induce cavity/gap structures is currently very limited (e.g., PDS 70b & c; Keppler et al., 2018; Haffert et al., 2019), and no planets have been detected around Sz 84. Additionally, as mentioned above (§ 5.1), the spatial distributions of small and large dust grains expected for planet–disk interactions are opposite to those around Sz 84. Furthermore, as discussed in Zhu et al. (2012), because gas ( small dust grains) can flow across the planet-induced gap, NIR excess in the SED emitted by hot (100–1000 K) dust grains around the central star cannot be sufficiently suppressed by only planet–disk interactions. This is also opposite to Sz 84’s SED with negligible NIR excess. Therefore, planet–disk interactions alone cannot account for the observational results for Sz 84.
Grain growth — To account for a transitional disk system with negligible NIR excess in the SED and a moderate mass accretion, only small dust grains in the vicinity of the central star need to be removed. For this purpose, Zhu et al. (2012) introduced grain growth in addition to planet–disk interactions. Dust grains grow faster in the inner region of the disk because of a faster dynamical time scale (e.g., Brauer et al., 2008), and thus small dust grains are dispersed from the inside out. However, large dust grains are expected to fragment into small dust grains depending on disk turbulence (e.g., Weidenschilling, 1984) and/or their stickiness (e.g., Wada et al., 2009), and thus weak dust fragmentation is required to efficiently remove small dust grains. Numerical simulations of grain growth with no/low fragmentation show a deficit of flux at NIR to MIR wavelengths in the SED (e.g., Dullemond & Dominik, 2005; Birnstiel et al., 2012). Moreover, as grain growth does not affect gas distribution, the mass accretion would be unchanged. Hence, grain growth with less efficient fragmentation would explain both the spatial distributions of dust grains at 10 au and the moderate mass accretion rate of Sz 84. We note that our modeling in § 4 implies that the inner disk at 10 au is optically thin at 10 m for both small and large dust grains, which could be interpreted as meaning that dust grains are large enough to radially drift to the central star (e.g., Brauer et al., 2008) or have already grown into planetesimals (e.g., Okuzumi et al., 2012; Kataoka et al., 2013).
As mentioned in § 5.1, Sz 84 could be a very rare system because most T Tauri stars have IR excesses in their SEDs (e.g., Espaillat et al., 2014). These facts suggest that in most T Tauri star systems, small dust grains need to be replenished after being removed by grain growth, for instance by dust fragmentation through high-speed collisions. Under reasonable assumptions, the balance of the rates of grain growth and fragmentation determines whether T Tauri star systems have IR excess. For Sz 84, grain growth could be very efficient and/or fragmentation could be very inefficient, potentially due to weak turbulence in the disk or stickier dust grains.
Furthermore, according to numerical simulations in Dullemond & Dominik (2005), the time scale of grain growth with less effective fragmentation required to create the dip at NIR to MIR wavelengths in the SED is expected to be 0.1 Myr, and the cavity size in the disk of small dust grains reaches 100 au within 1 Myr (see model F2 in Figure 6). This picture is roughly consistent with Sz 84 (60 au in § 4.2; an age of 1 Myr, Alcalá et al., 2014). In contrast, DM Tau, which also has larger cavities of small dust grains, as mentioned in the previous subsection (§ 5.1), has a cavity size on the order of 1 au even though the cavity’s age is 1 Myr (e.g., Andrews et al., 2013). Because the time scale of the cavity formation on the order of 1 au via grain growth is predicted to be 0.01 Myr (Dullemond & Dominik, 2005), slow grain growth might occur in DM Tau’s disk. These results suggest that Sz 84 has more efficient grain growth and/or more insufficient fragmentation than those of DM Tau because the time scale of the cavity formation might also depend on the balance of grain growth and fragmentation. Therefore, Sz 84 could serve as an excellent testbed for investigating grain growth with less efficient fragmentation because dust fragmentation is one of the big problems in planet formation. One way to test the scenario of grain growth is to investigate the spectral index as a function of radius. Future multiple wavelength observations with higher spatial resolution and better sensitivity will guide our understanding of the cavity formation mechanism around Sz 84.
Radiation pressure — Another possible mechanism for the selective removal of small dust grains is radiation pressure (e.g., Krumholz et al., 2019; Owen & Kollmeier, 2019). Stellar radiation radially and rapidly pushes away small dust grains, whereas large dust grains persist for a longer time, when the radiation pressure force on dust grains is stronger than the drag force of the gas. To suppress this drag force, Krumholz et al. (2019) reduced the gas density to less than 1 % of the minimum mass solar nebula (e.g., Weidenschilling, 1977; Hayashi, 1981). Additionally, because the dust disk needs optically thin conditions to avoid shielding stellar radiation, a dust-to-mass ratio of less than 10-4 is preferable. Consequently, radiation pressure could efficiently remove small dust grains on gas-poor systems, i.e., debris disks. Conversely, the protoplanetary disk of Sz 84 is likely to be a gas-rich system, as detected in 12CO (Figure 1), and therefore, radiation pressure can be safely ruled out as the dominant mechanism for cavity formation around Sz 84.
6 Conclusion
We observed the transitional disk around the T Tauri star Sz 84 at band 6 (1.3 mm) with a spatial resolution of 02 (30 au) with ALMA. We clearly detected a dust continuum and 12CO line emissions. Although the SED of Sz 84 exhibits obvious deficits of IR excess at 10 m, indicating a cavity structure with a size of 100 au in diameter, the dust continuum image does not show any cavity structures. In contrast, the observed visibilities of the dust continuum clearly show a null point at the -distance of 450 k, suggesting a cavity structure in dust continuum. These observational results motivated us to conduct analyses of the visibilities and the SED to explore the structures of the dust disk. Our main findings are as follows.
-
1.
The spectral index () at bands 3, 6, and 7 (0.9 to 3 mm) is 2.42 0.04, which is lower than the value of 2.7 found in other transitional disk systems (Pinilla et al., 2014).
-
2.
The analyses of visibilities and the SED show that the cavity in the disk consisting of small dust grains is located at 60 au, and that large dust grains are present inside the cavity in the disk of small dust grains at 60 au down to 10 au. Gas is also present at 60 au in the 12CO moment 0 map.
-
3.
A transitional disk in which the size of the cavity in the disk of small dust grains is larger than that in the disk of large dust grains may be rare (to our knowledge, only Sz 84 and DM Tau), accounting for 7.7 % of objects observed with NIR direct imaging and ALMA (Villenave et al., 2019; van der Marel et al., 2016, 2018). Note that we assumed that the cavity sizes in disks of gas and small dust grains are identical in the modeling of CO gas taken from van der Marel et al. (2016, 2018).
-
4.
To account for the observational results for Sz 84 (spatial distributions of dust grains and gas in the disk, SED with negligible IR excess, and moderate mass accretion), grain growth and less efficient fragmentation (i.e., not photoevaporation, planet–disk interactions, or radiation pressure) are the likely mechanisms for cavity formation around Sz 84. Grain growth is thought to be an important first step in planet formation, and dust fragmentation prevents dust grains from growing into larger bodies. Therefore, Sz 84 is a good testbed for investigating grain growth with inefficient fragmentation of dust grains.
vis_sample (Loomis et al., 2017),
HOCHUNK3D (Whitney et al., 2013),
CASA (McMullin et al., 2007),
emcee (Foreman-Mackey et al., 2013)
Here, we provide additional supporting tables and figures.
ALMA observations of archive data from bands 3 and 7 used in this paper are summarized in Table 4.
| Band 3 | Band 7 | |
|---|---|---|
| Observing date (UT) | 2016.Oct.06 | 2015.Jun.14 |
| Project code | 2016.1.00571.S | 2013.1.00220.S |
| Time on source (min) | 6.0 | 2.2 |
| Number of antennas | 42 | 41 |
| Baseline lengths | 18.6 m to 3.1 km | 21.4 m to 0.78 km |
| Baseband Freqs. (GHz) | 90.6, 92.5, 102.6, 104.5 | 328.3, 329.3, 330.6, 340.0, 341.8 |
| Channel width (MHz) | 0.98, 0.98, 0.98, 0.98 | 15.6, 0.122, 0.122, 0.244, 0.977 |
| Continuum band width (GHz) | 7.5 | 4.8 |
| Bandpass calibrator | J15172422 | J14274206 |
| Flux calibrator | J14274206 | Titan |
| Phase calibrator | J16103958 | J16103958 |
| New phase center with GAIA | 15h58m2.50256s, -37d36m3.1157s | 15h58m2.50402s, -37d36m3.0857s |
Note. — Because bands 3 and 6 data are mainly used for visibility analyses in § 4.1, we do not describe the imaging parameters.
Figure 6 shows the 12CO channel maps at 1.0 to 11.0 km/s.
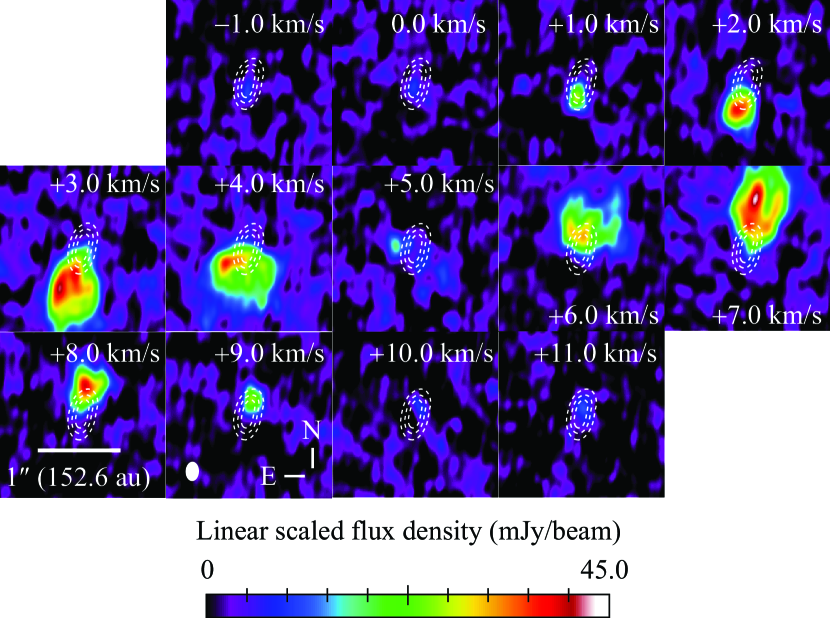
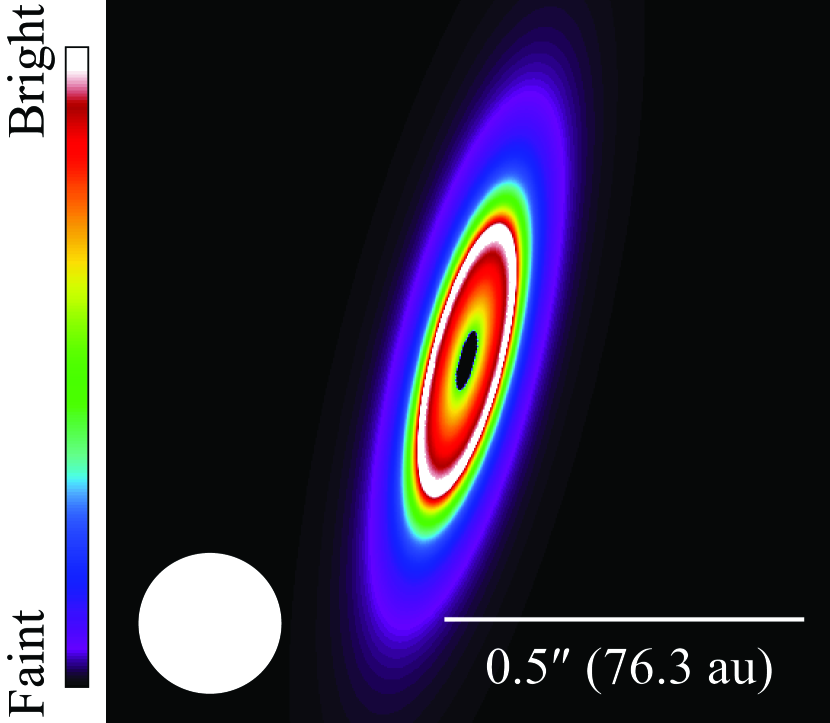
Figure 7 shows the best-fit model image of the disk around Sz 84 based on MCMC model fitting in § 4.1.
Figures 8, 9, and 10 show corner plots of the MCMC posteriors calculated in the visibility fitting for bands 6, 3, and 7, respectively, in § 4.1.
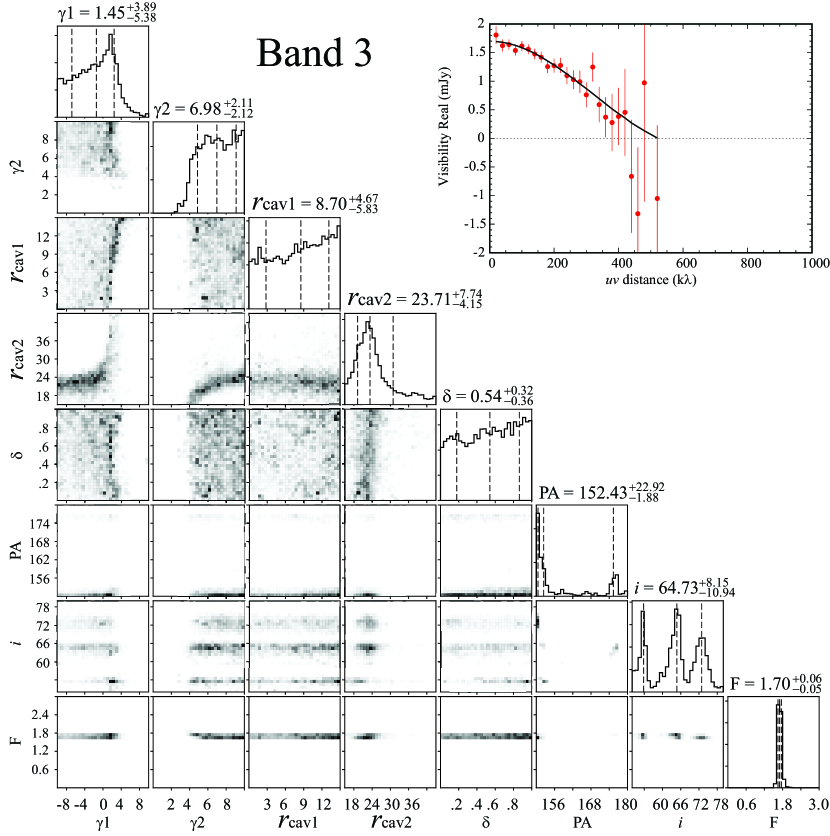
| Band | Flux | P.A. | ||||||
|---|---|---|---|---|---|---|---|---|
| (mJy) | (au) | (au) | () | () | ||||
| Band 3 | 1.70 | 8.70 | 23.71 | 1.45 | 6.98 | 0.54 | 64.73 | 152.43 |
| {0.0-3.0} | {0.0 .. 21.4} | {15.3 .. 45.8} | {0.0 .. 10} | {-10 .. 10} | {0.001 .. 1.0} | {50 .. 80} | {150 .. 180} | |
| Band 7 | 30.88 | 12.65 | 20.39 | 2.70 | 2.11 | 0.69 | 68.29 | 165.30 |
| {20.0-40.0} | {0.0 .. 21.4} | {15.3 .. 45.8} | {0.0 .. 10} | {-10 .. 10} | {0.001 .. 1.0} | {50 .. 80} | {150 .. 180} |
Note. — Values in parentheses are parameter ranges in our MCMC calculations.
| Wavelength | Reference | |
|---|---|---|
| (m) | (10-13 erg s-1 cm-2) | |
| 0.44 | 132.0 | USNO-B1.0 (Monet et al., 2003) |
| 0.64 | 400.8 | USNO-B1.0 (Monet et al., 2003) |
| 0.80 | 1388.1 | USNO-B1.0 (Monet et al., 2003) |
| 1.235 | 2042.6 43.2 | 2MASS (Cutri et al., 2003) |
| 1.662 | 1758.1 37.2 | 2MASS (Cutri et al., 2003) |
| 2.159 | 1152.8 24.4 | 2MASS (Cutri et al., 2003) |
| 3.350 | 37.12 7.9 | WISE (Cutri & et al., 2014) |
| 4.600 | 20.80 4.0 | WISE (Cutri & et al., 2014) |
| 5.308 | 110.1 8.3 | Spitzer/IRS (Spitzer Heritage Archive) |
| 5.520 | 104.7 6.8 | Spitzer/IRS (Spitzer Heritage Archive) |
| 5.731 | 94.0 6.4 | Spitzer/IRS (Spitzer Heritage Archive) |
| 5.943 | 94.2 6.2 | Spitzer/IRS (Spitzer Heritage Archive) |
| 6.155 | 90.5 6.0 | Spitzer/IRS (Spitzer Heritage Archive) |
| 6.366 | 79.6 6.4 | Spitzer/IRS (Spitzer Heritage Archive) |
| 6.578 | 64.4 7.1 | Spitzer/IRS (Spitzer Heritage Archive) |
| 6.790 | 63.7 7.6 | Spitzer/IRS (Spitzer Heritage Archive) |
| 7.002 | 57.7 8.3 | Spitzer/IRS (Spitzer Heritage Archive) |
| 7.213 | 55.0 8.2 | Spitzer/IRS (Spitzer Heritage Archive) |
| 7.425 | 53.3 8.9 | Spitzer/IRS (Spitzer Heritage Archive) |
| 7.701 | 37.2 4.9 | Spitzer/IRS (Spitzer Heritage Archive) |
| 8.120 | 37.3 3.8 | Spitzer/IRS (Spitzer Heritage Archive) |
| 8.544 | 40.1 3.4 | Spitzer/IRS (Spitzer Heritage Archive) |
| 8.967 | 31.2 3.3 | Spitzer/IRS (Spitzer Heritage Archive) |
| 9.391 | 27.1 3.2 | Spitzer/IRS (Spitzer Heritage Archive) |
| 9.814 | 28.1 2.7 | Spitzer/IRS (Spitzer Heritage Archive) |
| 10.24 | 24.7 2.4 | Spitzer/IRS (Spitzer Heritage Archive) |
| 10.66 | 23.7 2.6 | Spitzer/IRS (Spitzer Heritage Archive) |
| 11.08 | 18.1 3.0 | Spitzer/IRS (Spitzer Heritage Archive) |
| 11.51 | 14.3 3.1 | Spitzer/IRS (Spitzer Heritage Archive) |
| 11.93 | 15.5 3.2 | Spitzer/IRS (Spitzer Heritage Archive) |
| 12.35 | 10.9 3.0 | Spitzer/IRS (Spitzer Heritage Archive) |
| 12.78 | 14.7 2.9 | Spitzer/IRS (Spitzer Heritage Archive) |
| 13.20 | 11.5 3.5 | Spitzer/IRS (Spitzer Heritage Archive) |
| 13.62 | 11.1 3.8 | Spitzer/IRS (Spitzer Heritage Archive) |
| 14.05 | 10.9 4.3 | Spitzer/IRS (Spitzer Heritage Archive) |
| 14.58 | 6.7 2.5 | Spitzer/IRS (Spitzer Heritage Archive) |
| 15.17 | 7.4 2.8 | Spitzer/IRS (Spitzer Heritage Archive) |
| 15.76 | 11.4 2.2 | Spitzer/IRS (Spitzer Heritage Archive) |
| 16.36 | 8.0 3.0 | Spitzer/IRS (Spitzer Heritage Archive) |
| 16.95 | 7.4 2.8 | Spitzer/IRS (Spitzer Heritage Archive) |
| 17.54 | 10.9 2.7 | Spitzer/IRS (Spitzer Heritage Archive) |
| 18.13 | 7.6 3.3 | Spitzer/IRS (Spitzer Heritage Archive) |
| 18.73 | 11.1 3.2 | Spitzer/IRS (Spitzer Heritage Archive) |
| 19.32 | 12.7 4.7 | Spitzer/IRS (Spitzer Heritage Archive) |
| 19.91 | 14.8 3.8 | Spitzer/IRS (Spitzer Heritage Archive) |
| 20.54 | 11.8 4.6 | Spitzer/IRS (Spitzer Heritage Archive) |
| 21.61 | 23.0 3.2 | Spitzer/IRS (Spitzer Heritage Archive) |
| 22.79 | 27.1 2.4 | Spitzer/IRS (Spitzer Heritage Archive) |
| 23.98 | 31.3 2.2 | Spitzer/IRS (Spitzer Heritage Archive) |
| 25.16 | 37.7 2.3 | Spitzer/IRS (Spitzer Heritage Archive) |
| 26.35 | 41.3 2.2 | Spitzer/IRS (Spitzer Heritage Archive) |
| 27.53 | 49.1 2.1 | Spitzer/IRS (Spitzer Heritage Archive) |
| 28.72 | 57.6 2.6 | Spitzer/IRS (Spitzer Heritage Archive) |
| 29.90 | 61.4 2.4 | Spitzer/IRS (Spitzer Heritage Archive) |
| 31.09 | 67.6 3.1 | Spitzer/IRS (Spitzer Heritage Archive) |
| 32.27 | 78.9 3.4 | Spitzer/IRS (Spitzer Heritage Archive) |
| 33.46 | 87.7 5.2 | Spitzer/IRS (Spitzer Heritage Archive) |
| 34.65 | 103.2 4.9 | Spitzer/IRS (Spitzer Heritage Archive) |
| 35.83 | 109.7 9.6 | Spitzer/IRS (Spitzer Heritage Archive) |
| 37.02 | 112.3 9.2 | Spitzer/IRS (Spitzer Heritage Archive) |
| 63 | 190.0 4.8 | Herschel (Riviere-Marichalar et al., 2016) |
| 70 | 105.0 3.1 | Spitzer/MIPS (Merín et al., 2010) |
| 909 | 1.14 0.14 | ALMA (van der Marel et al., 2018) |
| 1300 | 0.30 0.003 | ALMA (this work) |
Note. — The value of 0.5 mag (Manara et al., 2014) is applied here.
Figure 11 shows the azimuthally averaged radial profile at 150 au based on MCMC model fitting and MCRT modeling in § 4.1 and § 4.2, respectively, to test the consistency of the surface brightness in the two models.
References
- Alcalá et al. (2014) Alcalá, J. M., Natta, A., Manara, C. F., et al. 2014, A&A, 561, A2, doi: 10.1051/0004-6361/201322254
- Alcalá et al. (2017) Alcalá, J. M., Manara, C. F., Natta, A., et al. 2017, A&A, 600, A20, doi: 10.1051/0004-6361/201629929
- Alexander et al. (2014) Alexander, R., Pascucci, I., Andrews, S., Armitage, P., & Cieza, L. 2014, in Protostars and Planets VI, ed. H. Beuther, R. S. Klessen, C. P. Dullemond, & T. Henning, 475, doi: 10.2458/azu_uapress_9780816531240-ch021
- Andrews et al. (2013) Andrews, S. M., Rosenfeld, K. A., Kraus, A. L., & Wilner, D. J. 2013, ApJ, 771, 129, doi: 10.1088/0004-637X/771/2/129
- Ansdell et al. (2016) Ansdell, M., Williams, J. P., van der Marel, N., et al. 2016, ApJ, 828, 46, doi: 10.3847/0004-637X/828/1/46
- Ansdell et al. (2018) Ansdell, M., Williams, J. P., Trapman, L., et al. 2018, ApJ, 859, 21, doi: 10.3847/1538-4357/aab890
- Beichman et al. (2005) Beichman, C. A., Bryden, G., Gautier, T. N., et al. 2005, ApJ, 626, 1061, doi: 10.1086/430059
- Birnstiel et al. (2012) Birnstiel, T., Andrews, S. M., & Ercolano, B. 2012, A&A, 544, A79, doi: 10.1051/0004-6361/201219262
- Brauer et al. (2008) Brauer, F., Dullemond, C. P., & Henning, T. 2008, A&A, 480, 859, doi: 10.1051/0004-6361:20077759
- Clarke et al. (2001) Clarke, C. J., Gendrin, A., & Sotomayor, M. 2001, MNRAS, 328, 485, doi: 10.1046/j.1365-8711.2001.04891.x
- Cutri & et al. (2014) Cutri, R. M., & et al. 2014, VizieR Online Data Catalog, II/328
- Cutri et al. (2003) Cutri, R. M., Skrutskie, M. F., van Dyk, S., et al. 2003, VizieR Online Data Catalog, II/246
- D’Alessio et al. (2006) D’Alessio, P., Calvet, N., Hartmann, L., Franco-Hernández, R., & Servín, H. 2006, ApJ, 638, 314, doi: 10.1086/498861
- de Juan Ovelar et al. (2013) de Juan Ovelar, M., Min, M., Dominik, C., et al. 2013, A&A, 560, A111, doi: 10.1051/0004-6361/201322218
- Dong et al. (2012) Dong, R., Rafikov, R., Zhu, Z., et al. 2012, ApJ, 750, 161, doi: 10.1088/0004-637X/750/2/161
- Draine (2006) Draine, B. T. 2006, ApJ, 636, 1114, doi: 10.1086/498130
- Dullemond & Dominik (2005) Dullemond, C. P., & Dominik, C. 2005, A&A, 434, 971, doi: 10.1051/0004-6361:20042080
- Ercolano & Pascucci (2017) Ercolano, B., & Pascucci, I. 2017, Royal Society Open Science, 4, 170114, doi: 10.1098/rsos.170114
- Espaillat et al. (2010) Espaillat, C., D’Alessio, P., Hernández, J., et al. 2010, ApJ, 717, 441, doi: 10.1088/0004-637X/717/1/441
- Espaillat et al. (2014) Espaillat, C., Muzerolle, J., Najita, J., et al. 2014, Protostars and Planets VI, 497, doi: 10.2458/azu_uapress_9780816531240-ch022
- Facchini et al. (2018) Facchini, S., Pinilla, P., van Dishoeck, E. F., & de Juan Ovelar, M. 2018, A&A, 612, A104, doi: 10.1051/0004-6361/201731390
- Foreman-Mackey et al. (2013) Foreman-Mackey, D., Hogg, D. W., Lang, D., & Goodman, J. 2013, PASP, 125, 306, doi: 10.1086/670067
- Francis & van der Marel (2020) Francis, L., & van der Marel, N. 2020, arXiv e-prints, arXiv:2003.00079. https://arxiv.org/abs/2003.00079
- Gaia Collaboration et al. (2018) Gaia Collaboration, Brown, A. G. A., Vallenari, A., et al. 2018, A&A, 616, A1, doi: 10.1051/0004-6361/201833051
- Garufi et al. (2013) Garufi, A., Quanz, S. P., Avenhaus, H., et al. 2013, A&A, 560, A105, doi: 10.1051/0004-6361/201322429
- Haffert et al. (2019) Haffert, S. Y., Bohn, A. J., de Boer, J., et al. 2019, Nature Astronomy, 329, doi: 10.1038/s41550-019-0780-5
- Hashimoto et al. (2015) Hashimoto, J., Tsukagoshi, T., Brown, J. M., et al. 2015, ApJ, 799, 43, doi: 10.1088/0004-637X/799/1/43
- Hayashi (1981) Hayashi, C. 1981, Progress of Theoretical Physics Supplement, 70, 35, doi: 10.1143/PTPS.70.35
- Hendler et al. (2020) Hendler, N., Pascucci, I., Pinilla, P., et al. 2020, ApJ, 895, 126, doi: 10.3847/1538-4357/ab70ba
- Johansen et al. (2014) Johansen, A., Blum, J., Tanaka, H., et al. 2014, in Protostars and Planets VI, ed. H. Beuther, R. S. Klessen, C. P. Dullemond, & T. Henning, 547, doi: 10.2458/azu_uapress_9780816531240-ch024
- Kataoka et al. (2013) Kataoka, A., Tanaka, H., Okuzumi, S., & Wada, K. 2013, A&A, 557, L4, doi: 10.1051/0004-6361/201322151
- Keppler et al. (2018) Keppler, M., Benisty, M., Müller, A., et al. 2018, A&A, 617, A44, doi: 10.1051/0004-6361/201832957
- Kim et al. (1994) Kim, S.-H., Martin, P. G., & Hendry, P. D. 1994, ApJ, 422, 164, doi: 10.1086/173714
- Kley & Nelson (2012) Kley, W., & Nelson, R. P. 2012, ARA&A, 50, 211, doi: 10.1146/annurev-astro-081811-125523
- Krumholz et al. (2019) Krumholz, M. R., Ireland, M. J., & Kratter, K. M. 2019, arXiv e-prints, arXiv:1912.06788. https://arxiv.org/abs/1912.06788
- Kudo et al. (2018) Kudo, T., Hashimoto, J., Muto, T., et al. 2018, ApJ, 868, L5, doi: 10.3847/2041-8213/aaeb1c
- Loomis et al. (2017) Loomis, R. A., Öberg, K. I., Andrews, S. M., & MacGregor, M. A. 2017, ApJ, 840, 23, doi: 10.3847/1538-4357/aa6c63
- Lynden-Bell & Pringle (1974) Lynden-Bell, D., & Pringle, J. E. 1974, MNRAS, 168, 603, doi: 10.1093/mnras/168.3.603
- Manara et al. (2014) Manara, C. F., Testi, L., Natta, A., et al. 2014, A&A, 568, A18, doi: 10.1051/0004-6361/201323318
- McMullin et al. (2007) McMullin, J. P., Waters, B., Schiebel, D., Young, W., & Golap, K. 2007, in Astronomical Society of the Pacific Conference Series, Vol. 376, Astronomical Data Analysis Software and Systems XVI, ed. R. A. Shaw, F. Hill, & D. J. Bell, 127
- Merín et al. (2010) Merín, B., Brown, J. M., Oliveira, I., et al. 2010, ApJ, 718, 1200, doi: 10.1088/0004-637X/718/2/1200
- Miyake & Nakagawa (1993) Miyake, K., & Nakagawa, Y. 1993, Icarus, 106, 20, doi: 10.1006/icar.1993.1156
- Monet et al. (2003) Monet, D. G., Levine, S. E., Canzian, B., et al. 2003, AJ, 125, 984, doi: 10.1086/345888
- Najita et al. (2015) Najita, J. R., Andrews, S. M., & Muzerolle, J. 2015, MNRAS, 450, 3559, doi: 10.1093/mnras/stv839
- Okuzumi et al. (2012) Okuzumi, S., Tanaka, H., Kobayashi, H., & Wada, K. 2012, ApJ, 752, 106, doi: 10.1088/0004-637X/752/2/106
- Owen & Kollmeier (2019) Owen, J. E., & Kollmeier, J. A. 2019, MNRAS, 487, 3702, doi: 10.1093/mnras/stz1591
- Pérez et al. (2012) Pérez, L. M., Carpenter, J. M., Chand ler, C. J., et al. 2012, ApJ, 760, L17, doi: 10.1088/2041-8205/760/1/L17
- Pinilla et al. (2014) Pinilla, P., Benisty, M., Birnstiel, T., et al. 2014, A&A, 564, A51, doi: 10.1051/0004-6361/201323322
- Pinilla et al. (2018) Pinilla, P., Tazzari, M., Pascucci, I., et al. 2018, ApJ, 859, 32, doi: 10.3847/1538-4357/aabf94
- Rau & Cornwell (2011) Rau, U., & Cornwell, T. J. 2011, A&A, 532, A71, doi: 10.1051/0004-6361/201117104
- Rice et al. (2006) Rice, W. K. M., Armitage, P. J., Wood, K., & Lodato, G. 2006, MNRAS, 373, 1619, doi: 10.1111/j.1365-2966.2006.11113.x
- Riviere-Marichalar et al. (2016) Riviere-Marichalar, P., Merín, B., Kamp, I., Eiroa, C., & Montesinos, B. 2016, A&A, 594, A59, doi: 10.1051/0004-6361/201527829
- Steinpilz et al. (2019) Steinpilz, T., Teiser, J., & Wurm, G. 2019, ApJ, 874, 60, doi: 10.3847/1538-4357/ab07bb
- Tazzari et al. (2017) Tazzari, M., Testi, L., Natta, A., et al. 2017, A&A, 606, A88, doi: 10.1051/0004-6361/201730890
- Testi et al. (2003) Testi, L., Natta, A., Shepherd, D. S., & Wilner, D. J. 2003, A&A, 403, 323, doi: 10.1051/0004-6361:20030362
- Testi et al. (2014) Testi, L., Birnstiel, T., Ricci, L., et al. 2014, in Protostars and Planets VI, ed. H. Beuther, R. S. Klessen, C. P. Dullemond, & T. Henning, 339, doi: 10.2458/azu_uapress_9780816531240-ch015
- Trapman et al. (2020) Trapman, L., Ansdell, M., Hogerheijde, M. R., et al. 2020, A&A, 638, A38, doi: 10.1051/0004-6361/201834537
- van der Marel et al. (2016) van der Marel, N., Cazzoletti, P., Pinilla, P., & Garufi, A. 2016, ApJ, 832, 178, doi: 10.3847/0004-637X/832/2/178
- van der Marel et al. (2015) van der Marel, N., van Dishoeck, E. F., Bruderer, S., Pérez, L., & Isella, A. 2015, A&A, 579, A106, doi: 10.1051/0004-6361/201525658
- van der Marel et al. (2013) van der Marel, N., van Dishoeck, E. F., Bruderer, S., et al. 2013, Science, 340, 1199, doi: 10.1126/science.1236770
- van der Marel et al. (2018) van der Marel, N., Williams, J. P., Ansdell, M., et al. 2018, ApJ, 854, 177, doi: 10.3847/1538-4357/aaaa6b
- Villenave et al. (2019) Villenave, M., Benisty, M., Dent, W. R. F., et al. 2019, A&A, 624, A7, doi: 10.1051/0004-6361/201834800
- Wada et al. (2009) Wada, K., Tanaka, H., Suyama, T., Kimura, H., & Yamamoto, T. 2009, ApJ, 702, 1490, doi: 10.1088/0004-637X/702/2/1490
- Weidenschilling (1977) Weidenschilling, S. J. 1977, MNRAS, 180, 57, doi: 10.1093/mnras/180.1.57
- Weidenschilling (1984) —. 1984, Icarus, 60, 553, doi: 10.1016/0019-1035(84)90164-7
- Weidenschilling & Cuzzi (1993) Weidenschilling, S. J., & Cuzzi, J. N. 1993, in Protostars and Planets III, ed. E. H. Levy & J. I. Lunine, 1031
- Whitney et al. (2013) Whitney, B. A., Robitaille, T. P., Bjorkman, J. E., et al. 2013, ApJS, 207, 30, doi: 10.1088/0067-0049/207/2/30
- Wood et al. (2002) Wood, K., Wolff, M. J., Bjorkman, J. E., & Whitney, B. 2002, ApJ, 564, 887, doi: 10.1086/324285
- Yen et al. (2018) Yen, H.-W., Koch, P. M., Manara, C. F., Miotello, A., & Testi, L. 2018, A&A, 616, A100, doi: 10.1051/0004-6361/201732196
- Zhang et al. (2016) Zhang, K., Bergin, E. A., Blake, G. A., et al. 2016, ApJ, 818, L16, doi: 10.3847/2041-8205/818/1/L16
- Zhu et al. (2012) Zhu, Z., Nelson, R. P., Dong, R., Espaillat, C., & Hartmann, L. 2012, ApJ, 755, 6, doi: 10.1088/0004-637X/755/1/6