SDSS-IV MaNGA: The link between bars and the early cessation of star formation in spiral galaxies
Abstract
Bars are common in low-redshift disk galaxies, and hence quantifying their influence on their host is of importance to the field of galaxy evolution. We determine the stellar populations and star formation histories of 245 barred galaxies from the MaNGA galaxy survey, and compare them to a mass- and morphology-matched comparison sample of unbarred galaxies. At fixed stellar mass and morphology, barred galaxies are optically redder than their unbarred counterparts. From stellar population analysis using the full spectral fitting code Starlight, we attribute this difference to both older and more metal-rich stellar populations. Dust attenuation however, is lower in the barred sample. The star formation histories of barred galaxies peak earlier than their non-barred counterparts, and the galaxies build up their mass at earlier times. We can detect no significant differences in the local environment of barred and un-barred galaxies in this sample, but find that the HI gas mass fraction is significantly lower in high-mass () barred galaxies than their non-barred counterparts. We speculate on the mechanisms that have allowed barred galaxies to be older, more metal-rich and more gas-poor today, including the efficient redistribution of galactic fountain byproducts, and a runaway bar formation scenario in gas-poor disks. While it is not possible to fully determine the effect of the bar on galaxy quenching, we conclude that the presence of a bar and the early cessation of star formation within a galaxy are intimately linked.
keywords:
galaxies: evolution – galaxies: general – galaxies: stellar content – galaxies: spiral1 Introduction
Given that such a large fraction of disk galaxies possess stellar bars (e.g. Nair & Abraham, 2010; Eskridge et al., 2000; Masters et al., 2011), it is imperative to understand the interaction between these large-scale disk structures and their host galaxies.
Bars are non-axisymmetric structures, and are efficient at redistributing material (gas, stars) and angular momentum within galaxies (e.g. Berentzen et al., 1998; Martinez-Valpuesta et al., 2006; Athanassoula et al., 2013). Torques induced by bars drive gas both outwards, and towards the centre of galaxies (Quillen et al., 1995; Knapen et al., 2002; Athanassoula, 2003; Fragkoudi et al., 2016), causing a starburst (Jogee et al., 2005; Spinoso et al., 2017), or central mass concentration growth (Wang et al., 2012). This is followed by a decay in star formation rate (e.g. Robichaud et al., 2017; Khoperskov et al., 2018).
Observationally, there is evidence supporting this scenario: for example, the centres of barred galaxies have been found to be younger and more metal-rich than non-barred galaxies (e.g. Coelho & Gadotti, 2011; Ellison et al., 2011; Pérez & Sánchez-Blázquez, 2011). Resolved observations of HI gas show holes in disk regions, presumably where the bar has swept up and funnelled gas both inwards and outwards within its region of influence (e.g. Laine & Gottesman, 1998; Newnham et al., 2020). All of these effects are generally more prominent in strongly-barred galaxies (Ho et al., 1997; Gavazzi et al., 2015; Kim et al., 2017). It is clear that a thorough understanding of the influence of bars on their host galaxies is essential to understand galaxy evolution.
Many observational works have found differences between barred and unbarred galaxies: star formation rates and atomic gas fractions in barred galaxies are lower today than for unbarred galaxies of the same mass (e.g. Masters et al., 2012; Krishnarao et al., 2020), although star formation in central regions remains enhanced (e.g. Wang et al., 2012). Barred galaxies are known to be optically redder than their non-barred counterparts (Masters et al., 2011; Vera et al., 2016; Kruk et al., 2018), which is commonly attributed to lower current star formation rates. We know that bars are preferentially located in high-mass, central mass concentration-dominated galaxies (e.g. Sheth et al., 2008; Masters et al., 2011; Lee et al., 2012; Cheung et al., 2013; Cervantes Sodi, 2017), and bars in these galaxies are longer than in bluer, less ‘evolved’ galaxies (Hoyle et al., 2011). Barred galaxies are also more numerous in denser environments (e.g. Skibba et al., 2012). This is especially true of early-type galaxies (Barway et al., 2011; Lin et al., 2014). This evidence suggests that bars are responsible for (or at least involved in) different galaxy evolutionary paths.
We must be careful to ensure that observed differences between barred and unbarred galaxies are not being driven by some other correlated factor. For example, host galaxy stellar mass is strongly linked to bar length (Erwin, 2019), strength, star formation activity (Fraser-McKelvie et al., 2020), and colour (Kruk et al., 2018). Bar fraction increases with stellar mass (e.g. Masters et al., 2012; Melvin et al., 2014; Gavazzi et al., 2015), and bars are more prevalent in galaxies of early-type morphology (e.g. Elmegreen & Elmegreen, 1985; Martin, 1995; Erwin, 2005; Menéndez-Delmestre et al., 2007; Díaz-García et al., 2016; Erwin, 2019). What is less obvious is the reason why barred galaxies are redder: it could be due to older or more metal-rich stellar populations, or a contribution from dust reddening (e.g. Masters et al., 2010; Cortese, 2012), or a combination of all of these. It could also be simply that bars form more easily in redder galaxies (e.g. Villa-Vargas et al., 2010; Algorry et al., 2017). For a discussion of the complex relation between the effects of gas on bar growth and evolution in simulations we refer the reader to Athanassoula et al. (2013).
Given these correlations, it is important to disentangle the effect of a bar from other external influences. To quantify the effect of bars on their host galaxies, barred galaxies must be compared to unbarred galaxies at fixed mass and morphology. Fortunately, Galaxy Zoo 2 (Willett et al., 2013; Hart et al., 2016) provides detailed morphological classifications for 239,695 galaxies within the Sloan Digital Sky Survey. Coupled with ancillary data from the NASA Sloan Atlas (Blanton et al., 2011), a well-matched sample of barred and unbarred galaxies can be created and compared.
The addition of detailed spectroscopic information from the Mapping Nearby Galaxies at APO (MaNGA) galaxy survey (Bundy et al., 2015) means we can employ advanced population synthesis techniques to study not just the current stellar populations, but the entire star formation history of galaxies. Such an analysis was performed by Peterken et al. (2020), in which full-spectral fitting techniques were employed to determine the fossil records of 798 spiral galaxies on a spaxel by spaxel basis. We will build on this analysis to recover the stellar populations and star formation histories of a sample of barred spiral galaxies from the MaNGA galaxy survey, and compare them to a stringently-selected mass- and morphology-matched sample of non-barred galaxies.
This paper is arranged as follows: in Section 2, we describe the MaNGA galaxy survey, barred spiral sample selection, and full spectrum fitting technique, and in Section 3 we present our results and discussion. Throughout this paper we use a flat CDM cosmology with , , , , and a Chabrier (2003) IMF.
2 Data & sample selection
2.1 The MaNGA galaxy survey
The MaNGA Galaxy Survey is an integral field spectroscopic survey that will observe 10,000 galaxies by survey completion (Bundy et al., 2015; Drory et al., 2015). It is an SDSS-IV project (Blanton et al., 2017), employing the 2.5m telescope at Apache Point Observatory (Gunn et al., 2006) and BOSS spectrographs (Smee et al., 2013). MaNGA Product Launch 8 (MPL-8) contains 6779 unique galaxy observations, observed and reduced by the MaNGA Data Reduction Pipeline (DRP; Law et al., 2015, 2016). Derived properties including emission line fits (Belfiore et al., 2019) were produced by the MaNGA Data Analysis Pipeline (DAP; Westfall et al., 2019), and provided as a single data cube per galaxy (Yan et al., 2016a). MaNGA’s target galaxies were chosen to include a wide range of galaxy masses and colours, over the redshift range , and the Primary+ sample (Yan et al., 2016b; Wake et al., 2017) contains spatial coverage out to 1.5 for 66% of all observed galaxies, the remainder of which are observed out to .
2.2 Spiral sample
Galaxy Zoo 2 (GZ2; Willett et al., 2013; Hart et al., 2016) was a citizen science project that required the public to classify galaxy images via questions based on the appearance of various galaxy features. In this way, the traditional morphological structure of a galaxy may be inferred with the added bonus that individual morphological characteristics (e.g. the prominence of a bulge or the tightness of spiral arm winding) can be determined for each galaxy. As we are interested in the star formation histories of barred galaxies, we only examine spiral galaxies, which should have more recent star formation than S0s. We select spiral galaxies using the recommendations of Willett et al. (2013) and Masters et al. (2019a), in the same manner as Peterken et al. (2020), briefly detailed here.
To create a clean spiral sample, we remove galaxies with nearby contaminants and filter out ellipticals using the criterion recommended by (Willett et al., 2013) of pfeaturesordisk 0.43 and the redshift-debiased and user-weighted measurements of Hart et al. (2016). An axis ratio cut of obtained from NSA elliptical Petrosian photometry was employed to ensure sufficient resolution in arm and bar regions. Finally, the user-weighted probability that a galaxy contained spiral arms, pspiral 0.8, was employed as a cut, with the additional restriction that a galaxy had at least 20 classifications, as suggested by Willett et al. (2013).
The Peterken et al. (2020) sample was used for full spectral fitting analysis, and hence a further 109 galaxies were removed from the analysis with flags for bad or questionable data in the MaNGA DRP. To ensure consistency in angular resolution as a function of spaxel size, we select only galaxies in the Primary+ sample, for which coverage is out to . This selection process results in 798 spiral galaxies with IFU observations, from which we further select barred and comparison samples.
2.2.1 Barred spiral sample
Barred galaxies were selected from the current spiral sample using the same criteria as Hart et al. (2017). Barred galaxies are identified using the GZ2 parameter pbar > 0.5. From the original spiral sample of 798 galaxies, 245 were selected as the barred sub-sample. We note that this gives a bar fraction of 31%, which is low compared to previous literature estimates (e.g. Eskridge et al., 2000; Aguerri et al., 2009; Melvin et al., 2014). The cut at pbar > 0.5 was originally intended to select only strongly barred galaxies, and works such as Hart et al. (2017) use 0.2 < pbar < 0.5 to select weak bars. While weak bars will certainly inhabit this region of parameter space, there is likely to be some contamination from unbarred galaxies. In the interests of creating as clean a sample as possible, we adopted the higher threshold, with the caveat that the results may not hold for the weakest bars.
2.2.2 Mass- and morphology-matched comparison sample
Host galaxy stellar mass is well-known to influence the properties of bars (e.g. Kruk et al., 2018; Erwin, 2019; Fraser-McKelvie et al., 2020). Given the dependence of many bar and galaxy properties on morphological type (e.g. Díaz-García et al., 2016; Erwin, 2019), it is imperative to remove these two variables when creating a sample to compare to the barred galaxies. Masters et al. (2019a) showed a lack of correlation between spiral arm morphology and bulge size, so we include both of these parameters, along with a stellar mass criterion, in the construction of a comparison sample.
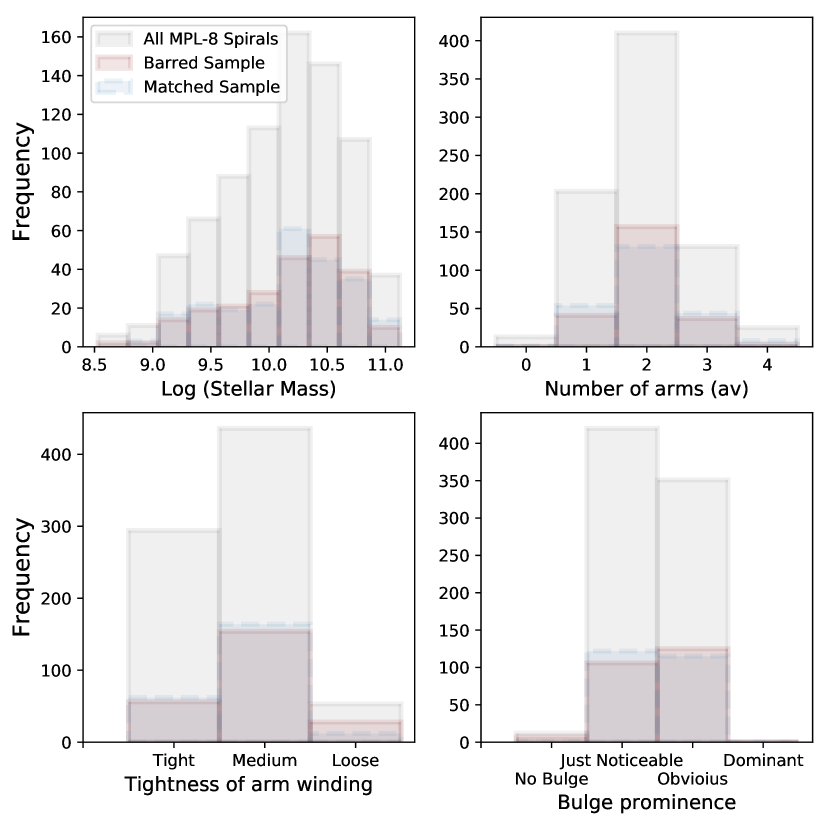
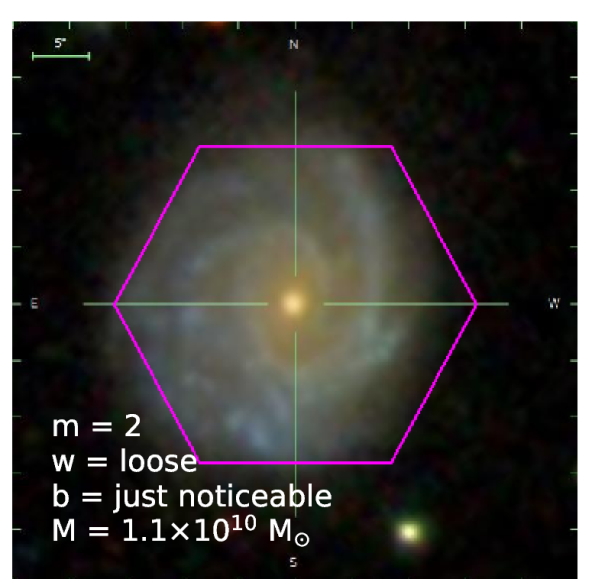
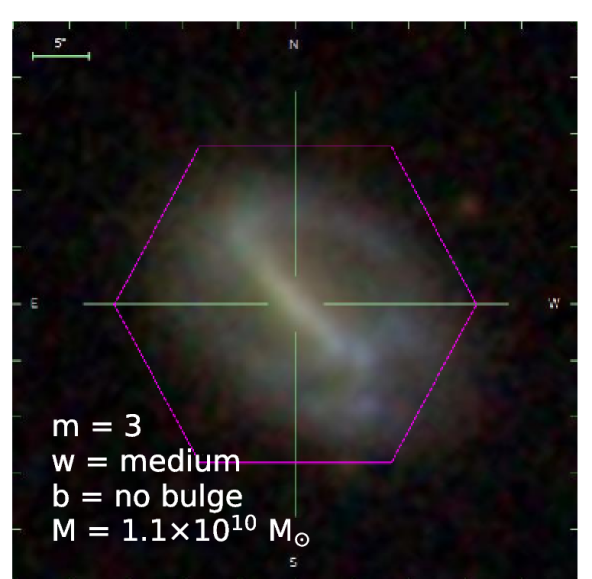
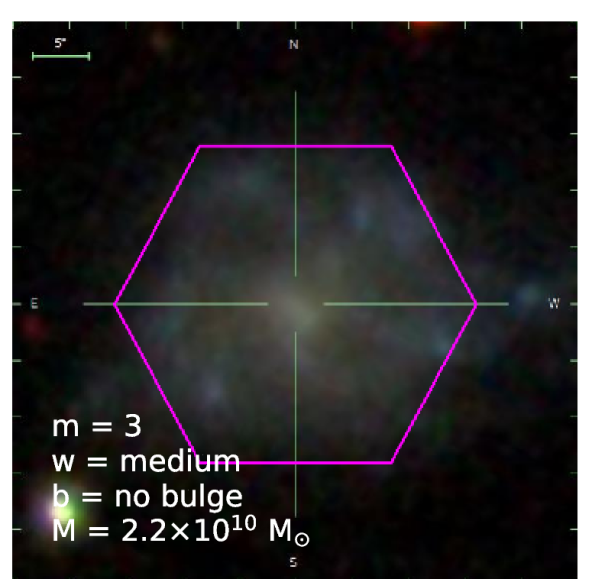
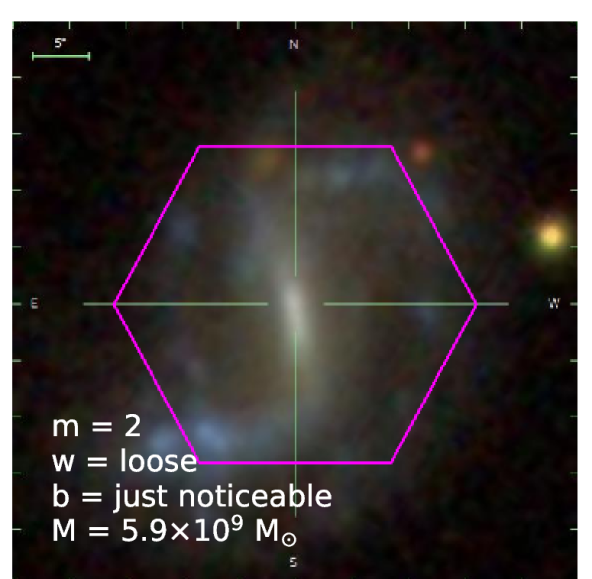
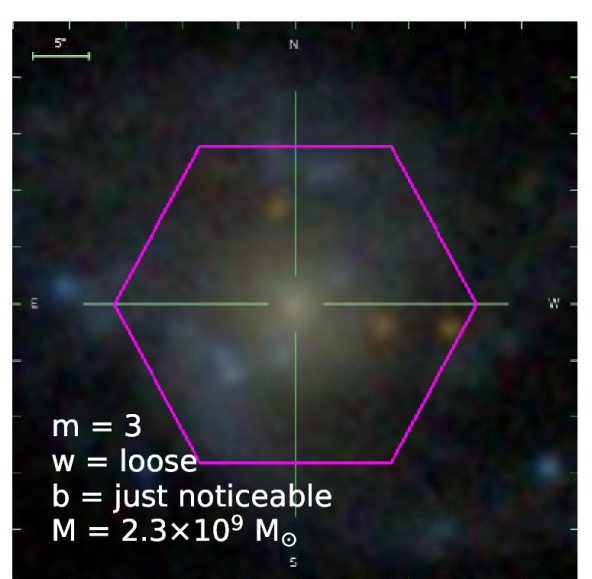
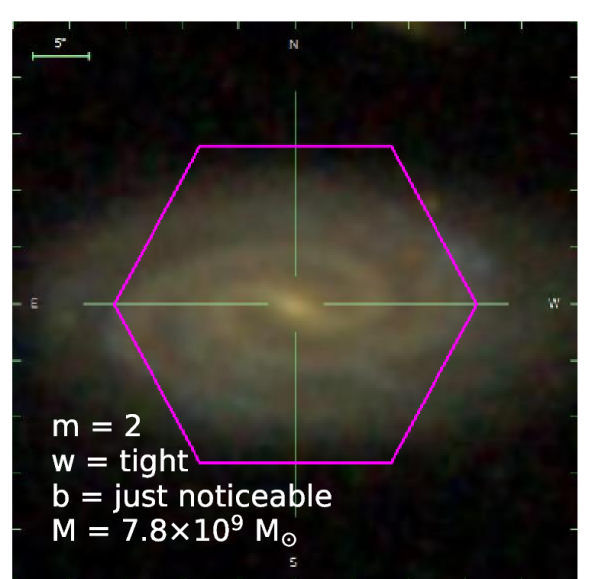
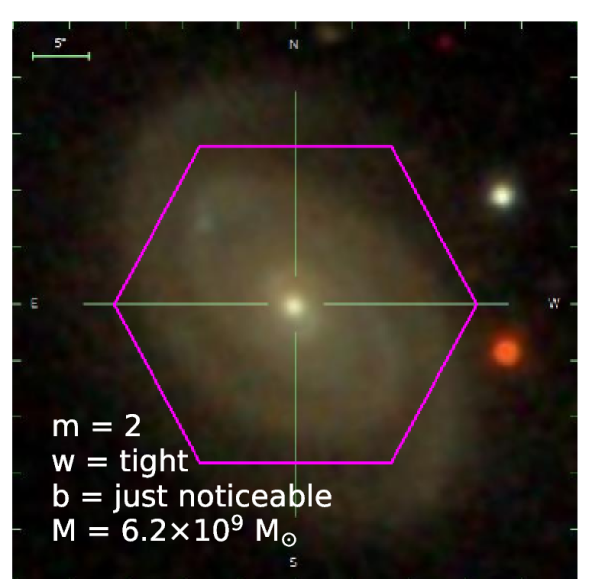
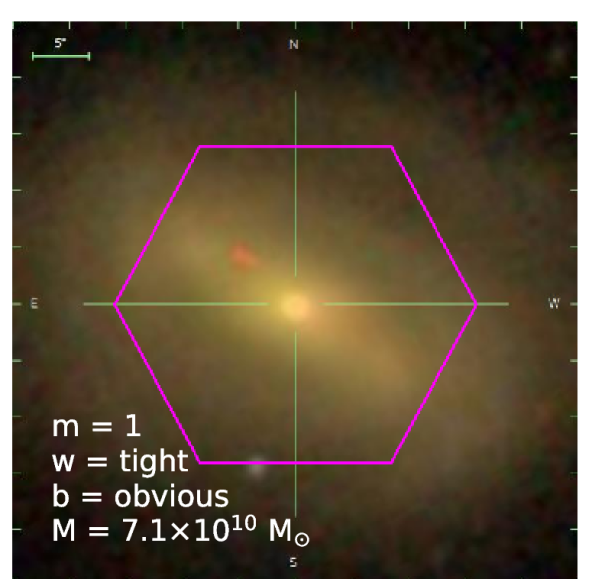
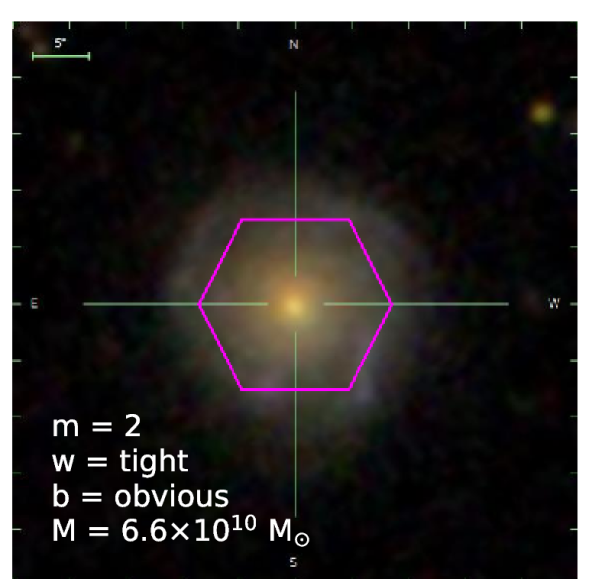
In a method similar to Hart et al. (2017), we take the individual responses to GZ2 questions and compute average values for spiral arm number (), tightness of arm winding ( = ‘tight’, ‘medium’, or ‘loose’), and bulge prominence ( = ‘no bulge’, ‘just noticeable’, ‘obvious’, or ‘dominant’). Using
| (1) |
where is the average value to compute (be that , , or ), is the maximum value of , is the value assigned to each response, and is the de-biased vote fraction from Hart et al. (2016) for that response. For the tightness of arm winding and bulge prominence questions, we assume a linear difference between each of the responses and assign them a value of 1–3 in the case of arm winding (such that corresponds to tightly-wound arms and to loosely wound), and 1–4 for bulge prominence (such that corresponds to no bulge and to a dominant bulge). The result of applying Equation 1 to the GZ2 classifications is an average value for every galaxy based on user votes, which we normalise to a value between 0 and 1, where 1 is the maximum value for that parameter from the parent sample of 798 galaxies.
We also normalise the log(stellar mass) for each barred galaxy, and choose a comparison galaxy (without replacement) that is closest in normalised spiral arm number, arm winding, bulge prominence, and stellar mass. In essence, we have chosen the non-barred galaxy that is closest to it in a four-dimensional parameter space, with each parameter having equal weighting in the match. In Figure 1 we show histograms of each of these parameters for the barred sample (maroon), mass- and morphology-matched comparison sample (blue), and the entire MPL-8 spiral sample (grey). Despite the number of constraints imposed, there is good agreement in all parameters between the barred and comparison samples. We can therefore be confident that any trends we see in the barred versus unbarred properties are not due to stellar mass or morphological differences between the samples.
We do note that the drawback of discretizing a continuous distribution of morphological classification votes into distinct categories is that some galaxies that may look alike (e.g. similar bulge prominence) may be classified into different categories as a result of the rounding of average vote fractions. That said, overall, we find this method reliably separates galaxies based on their physical properties, and excellent agreement in properties is found between barred galaxies and their matched counterparts as seen from Figure 1. The median log(stellar mass) difference between galaxy pairs is 0.13 dex, and the median separation between bulge prominence, number of arms, and arm winding are all less than 1, corresponding to a difference of less than one category.
Interestingly, the barred galaxy distribution follows that of the overall spiral population in stellar mass, number of arms, and bulge prominence. However, we confirm the result of Masters et al. (2019a) that bars are more numerous in galaxies with more loosely wound arms. This deviation from the overall spiral galaxy population also argues for the importance of matching not just in mass, but also in morphology.
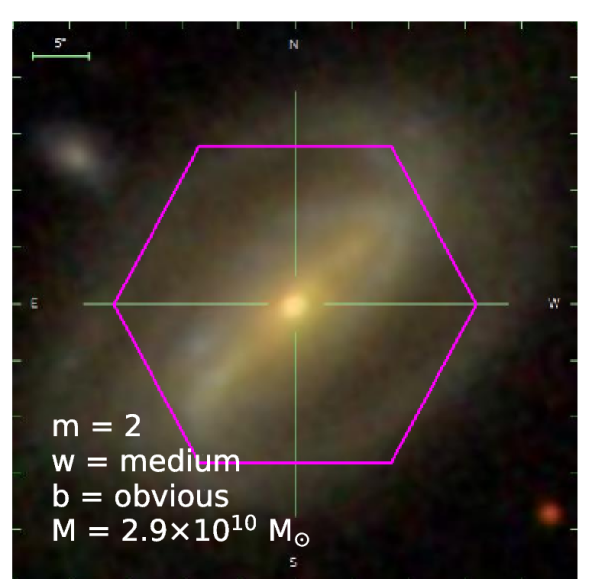
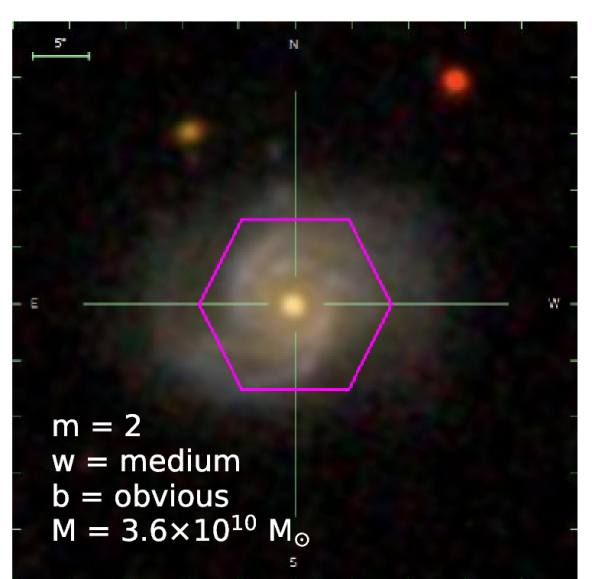
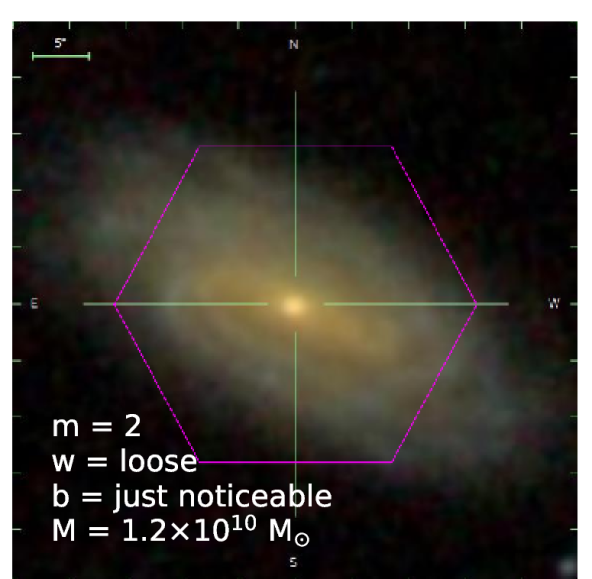
In Figure 2, we show some examples of barred galaxies, and their non-barred counterpart closest in arm number, spiral arm winding, bulge prominence, and stellar mass.
2.3 Modelling the star formation history of galaxies
2.3.1 Starlight fits
We adopt the spectral fitting results of Peterken et al. (2020), which used Starlight to model the stellar populations and star formation histories of 798 spiral galaxies in MaNGA MPL-8. For full details of the fitting process, we refer the reader to Peterken et al. (2020), but we summarise the salient points below.
Each spectrum in every galaxy data cube in the barred and unbarred samples were fit using Starlight. The input was an emission-line-subtracted data cube produced by subtracting the emission line cube provided by the MaNGA DAP from the observed galaxy data cube. As these spectral fits were originally utilised to investigate spiral and inter-arm regions within galaxies, we did not bin the outer spaxels, lest any bins covered multiple spatial regions of interest. Peterken et al. (2020) performed detailed analysis on the outer IFU spaxels and found they were able to recover true SFHs even when the signal-to-noise ratio was low. In this analysis we use the total SFH of all spaxels as a global SFH indicator. While there is no explicit weighting, the outer spaxels will have a lower SFR at all lookback times so will be implicitly downweighted when they are summed.
To cover a full range of stellar population ages in the fit, we use a combination of two spectral template libraries, the first of which is the standard E-MILES library (Vazdekis et al., 2010, 2016), which includes nine ages (log[age/years] = 7.85, 8.15, 8.45, 8.75, 9.05, 9.35, 9.65, 9.95, and 10.25) and six metallicities , and assumes a Chabrier (2003) IMF, Girardi et al. (2000) ‘Padova’ isochrones, and Milky-Way metallicity-scaled [/Fe] (‘baseFe’). For greater resolution at the younger end of the measured star formation histories, we also include templates of Asa’d et al. (2017) covering the younger ages (log[age/years] = 6.8, 6.9, 7.0, 7.2, 7.4, 7.6) and the two recommended metallicities, which are generated using the same method as the E-MILES set of Vazdekis et al. (2016), but with Bertelli et al. (1994) isochrones instead of Padova. A Calzetti et al. (2000) dust law is included in the fit.
Through thorough testing, it was found that the weights and fluxes of stellar populations younger than 30 Myr cannot be obtained reliably using this method. As explained in Peterken et al. (2020), the very blue young templates’ weights from the Starlight fits will be trying to model both blue light coming from old stellar populations not accounted for in the SSP models used (e.g. planetary nebula cores), and stellar populations of Myr. Since we cannot separate these contributions (but know that stars of these ages exist due to H), these templates are used in the fits, but we do not attempt to measure SFHs (or other parameters) below 30 Myr for science applications.
2.3.2 Starlight output: mean stellar age, metallicity and star formation histories
Using the mass weights assigned to each SSP template by Starlight in the fits for each spaxel spectrum, mass-weighted mean age and metallicity maps are derived for each galaxy. As a result of the dust prescription, extinction maps were also generated for each galaxy.
The E-MILES library includes predictions for the amount of mass lost since each stellar population formed. For each SSP template, it is therefore possible to measure the current mass of each population contained within a spaxel’s spectrum and convert this to an initial (formation) mass. For each spaxel’s spectrum, each template’s initial mass weight in the Starlight fit is divided by the time interval between it and its next-youngest SSP, to calculate an estimate of the average SFR occurring at each SSP age. At each of 100 sampling points in the SFH, a Gaussian-weighted average of all SSP SFRs is found, using a Gaussian of width 0.3 dex centred on the sampling point. This effectively smooths the discretised SFRs from the fits into a continuous SFH. This procedure is followed for each individual spaxel.
3 Results & Discussion
In order to compare this work to previous literature on barred galaxies, we first determine the colour of the barred and non-barred samples.
3.1 Galaxy colour
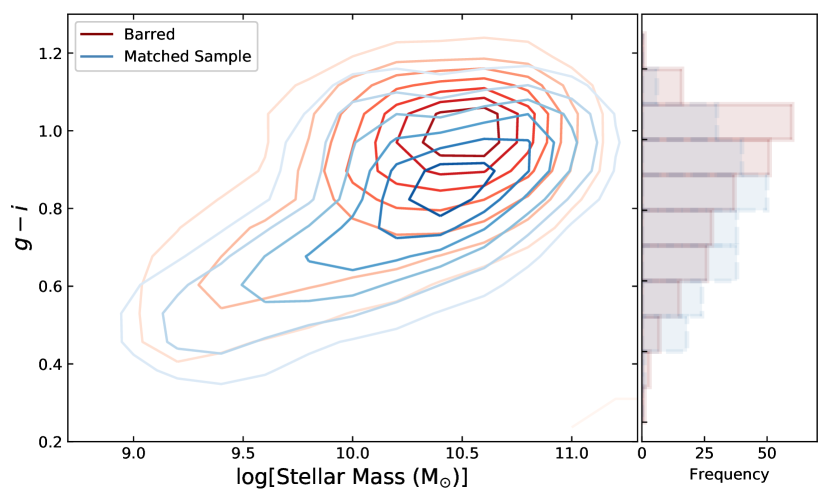
We measure the colour for each galaxy in both the barred and unbarred samples from NASA-Sloan Atlas elliptical Petrosian photometry (Blanton et al., 2011), and in Figure 3 we show these data as a colour–mass diagram. We see that barred galaxies are on average redder than their non-barred, mass- and morphologically-matched counterparts for a given mass. This distinction is especially clear for high-mass galaxies, with . This result has been shown in previous literature for many different barred galaxy samples (e.g. Masters et al., 2011; Lee et al., 2012; Oh et al., 2012; Kruk et al., 2018). Observed galaxy colour can be caused by a number of variables, including average stellar age, stellar metallicity, and dust extinction. In the following sections, we look at each in turn, using the results of the full spectral fit to determine the cause of the redder colours of barred galaxies.
3.2 Starlight full spectrum fit results: stellar populations and dust
Figure 4 shows contours of the global light-weighted mean stellar age (panel a), metallicity (panel b), and dust attenuation (panel c) where spaxels are weighted by their flux contribution at 4020 Å. For reference, in panel d) we plot contours of the SED-derived star formation rates from the Galex-SDSS-WISE Legacy Catalog 2 (GSWLC-2; Salim et al., 2016, 2018). On average, the barred galaxies are older and more metal-rich by 0.5 dex than the mass- and morphology-matched comparison sample. In panel c) of Figure 4 we plot contours of the average extinction by dust in the barred and unbarred galaxy samples. For a barred galaxy to appear redder through extinction alone, it should have a higher value of . In fact, we see the opposite in that a portion of unbarred comparison galaxies possess higher extinction than their barred counterparts.
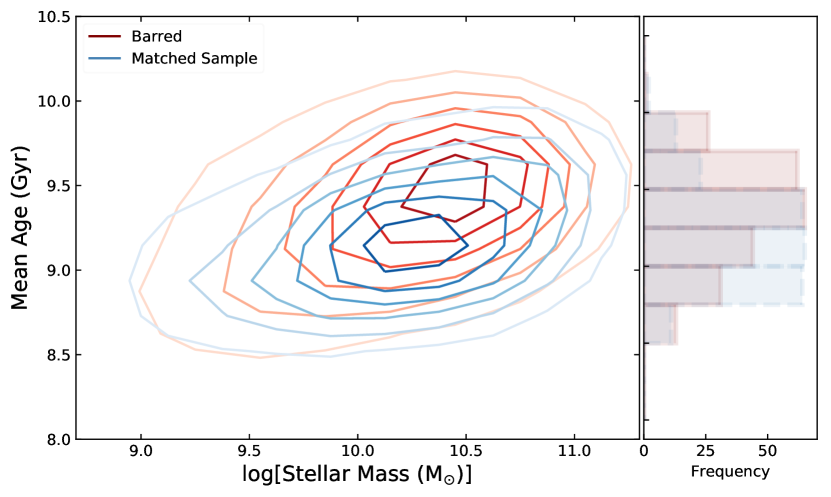
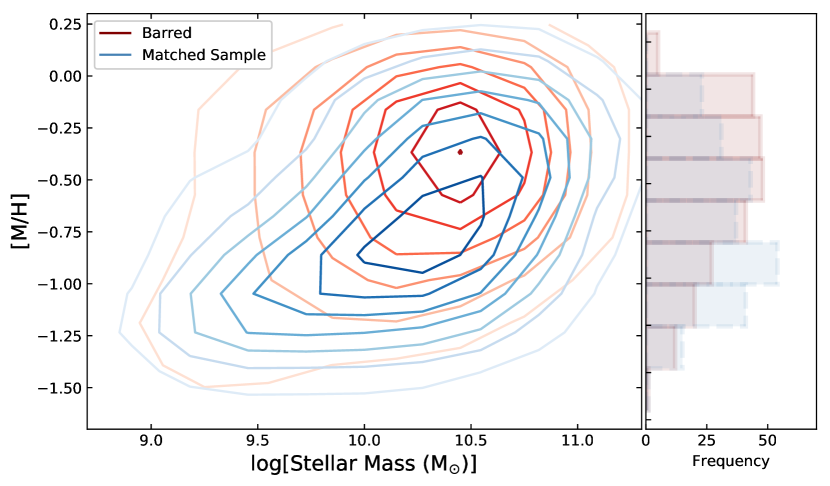
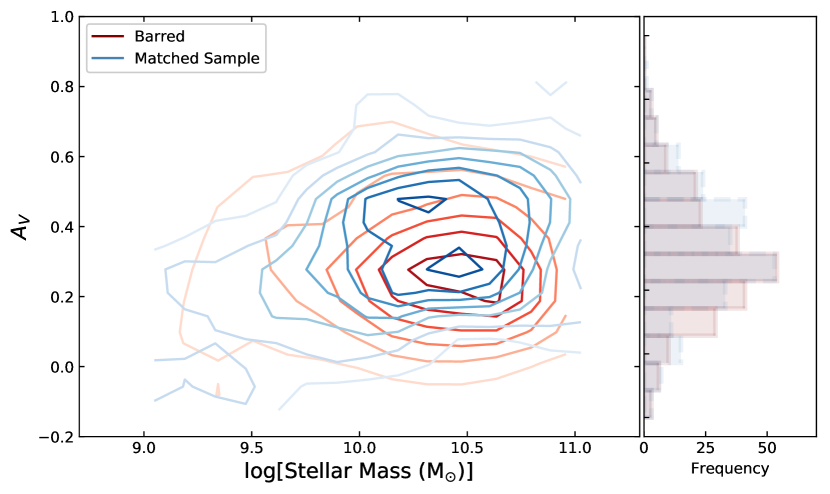
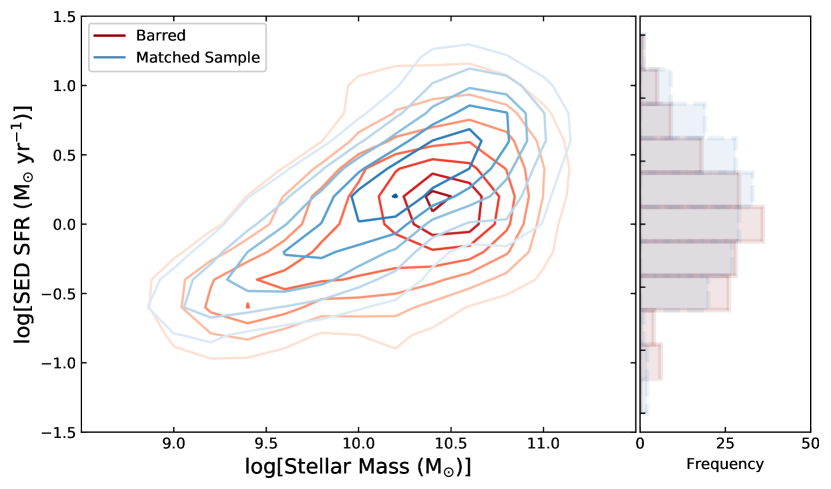
From Figure 4 d), we see that the current SFR of barred galaxies is lower at a given stellar mass than that of their non-barred counterparts. This would also contribute to their redder colours. We conclude that the redder optical colour of barred galaxies is due to older and more metal-rich stellar populations within them, and not a greater amount of dust. This conclusion is in line with previous studies such as Ellison et al. (2011) and Pérez & Sánchez-Blázquez (2011).
We note here that an identical analysis was also performed on a sample of non-barred galaxies matched on mass alone (i.e. no morphology matching). We report the same results presented here and throughout, but with a lower statistical significance.
3.3 Star formation histories
We have shown that the stellar populations of barred galaxies are older than a mass- and morphology-matched sample of non-barred galaxies. The power of full spectrum fitting tools such as Starlight is that it can also give information on the mass buildup sequence within a galaxy, or its star formation history (SFH).
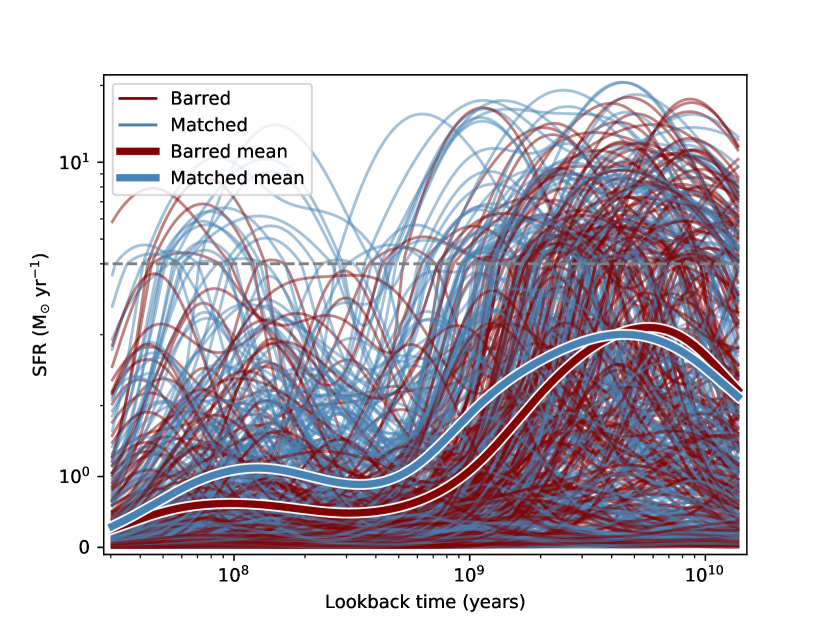
In Figure 5, we show the smoothed normalised star formation histories from Starlight output of barred (maroon) and unbarred (blue) galaxies in the sample. While this diagram is primarily for illustrative purposes, it can be seen that the barred galaxies seem to peak in their star formation at earlier times, while the non-barred galaxies peak at later times. Some non-barred galaxies show a secondary peak in star formation within the last 0.1 Gyr, consistent with current star formation activity.
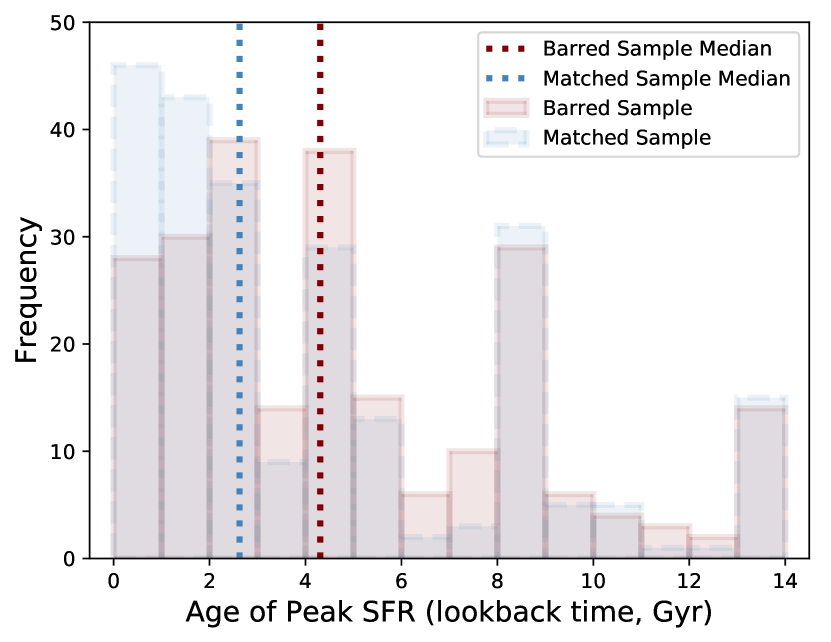
These trends can be quantified by measuring the attributes of the SFH curves. Panel a) of Figure 6 shows a histogram of the age at which a galaxy reaches its peak star formation rate for the barred (maroon) and non-barred (blue) samples. As alluded to in Figure 5, we see that barred galaxies peak in their SFHs earlier than the mass- and morphology-matched comparison sample. The median peak age of star formation is 4.3 Gyr ago for the barred sample, and 2.6 Gyr ago for the mass- and morphology-matched comparison sample. A 2-sample Kolmogorov-Smirnov (K-S) text confirms we can reject the null hypothesis that the barred and matched samples are drawn from the same distribution at a level, with a p-value of .
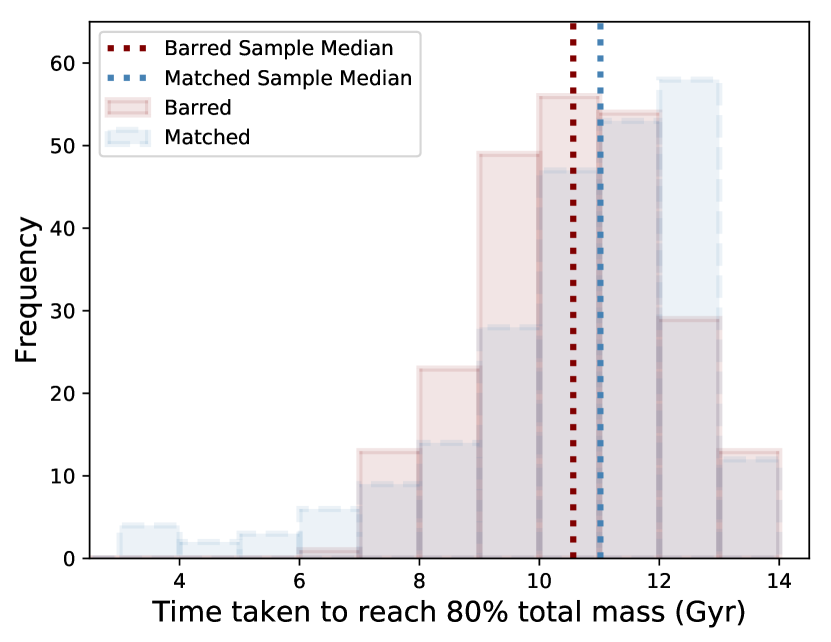
The time taken by a galaxy to reach 80% of its final mass is shown in panel b) of Figure 6. In line with results from panel a), barred galaxies build up their mass more quickly than their non-barred counterparts. The median time taken for a barred galaxy to build up 80% of its current mass is 10.6 Gyr, while non-barred galaxies take a median of 11.0 Gyr. Again, a 2-sample K-S test confirms these samples are not drawn from the same distribution at a level, with a p-value of .
Putting this information all together, barred galaxies peak in their star formation activity earlier than non-barred galaxies. This early peak leads them to build up their current-day mass earlier than mass- and morphology-matched non-barred galaxies. From this we conclude that the older and more metal-rich stellar populations present in barred galaxies have formed in an early episode of star formation, with only low-level activity persisting to the present day.
3.4 Gas content
Given that barred galaxies are redder and contain more evolved stellar populations when compared to their unbarred counterparts, we might expect differences in the neutral gas content. Indeed, studies such as Davoust & Contini (2004) and Masters et al. (2012) found a correlation between gas content and bar fraction at fixed stellar mass such that as gas fraction increases, the probability of a galaxy hosting a bar decreases.
We matched the barred and unbarred samples from this work to the MaNGA HI follow up survey (Masters et al., 2019b), which aims to provide HI single dish observations for all galaxies observed for the MaNGA survey. As of February 2020, 3730 objects had matched HI observations either from the Arecibo Legacy Fast Arecibo L-band Feed Array (ALFALFA) survey (Haynes et al., 2011, 2018), or the Robert C. Byrd Green Bank Telescope observations (175 have both). In order to ensure a fair comparison, we selected only galaxies that had available HI observations for both the barred galaxy, and its mass- and morphology-matched counterpart. 110 galaxy pairs had HI observations available in the MaNGA HI followup survey, and we show the gas mass fraction properties of both samples in Figure 7.
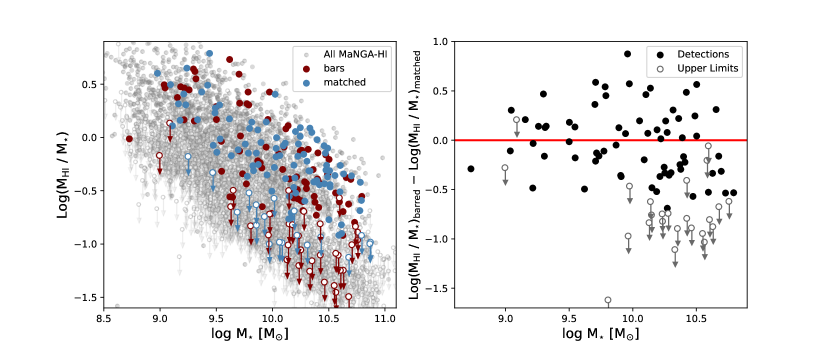
In panel a) of Figure 7, we present the HI gas mass fraction as a function of galaxy stellar mass. The HI gas mass fraction of barred galaxies is plotted in maroon, and the mass- and morphology-matched comparison sample in blue. Upper limits are denoted by unfilled circles, and for reference, all galaxies currently observed as part of the MaNGA HI followup survey are shown in grey. It is not immediately obvious whether one sample is more gas-rich than another, although we note that at the high-mass end, there is an abundance of low-gas fraction non-detections for the barred galaxies.
For each barred galaxy and its matched non-barred counterpart, we measure the difference in log HI gas mass fraction as a function of galaxy stellar mass. These results are presented in panel b) of Figure 7. When a barred galaxy has an upper limit for its HI measurement but its matched non-barred galaxy has a detection, the subtracted value is an upper limit. When a matched galaxy has an upper limit and its barred counterpart is a detection, the subtracted value would be a lower limit (though there are no such cases in this analysis). When both galaxies in a pair were upper limits (as is the case for some of the high-mass galaxy pairs), these measurements are not plotted in panel b). We perform a binomial test to determine the significance of any deviation from an equal distribution about zero difference between barred and unbarred gas fractions. For the entire sample, we find the somewhat marginal (2.6) result that the barred galaxies possess less gas than their non-barred counterparts. It is well known however, that the effect of a bar is felt more strongly in higher-mass galaxies (e.g. Ellison et al., 2011; Carles et al., 2016; Fraser-McKelvie et al., 2020), and when we consider only galaxies with , we report a 3.1 result such that high-mass barred galaxies contain less gas than non-barred of the same stellar mass.
Given that we have shown barred galaxies contain more evolved stellar populations and less current star formation when compared to their unbarred counterparts, the high-mass gas fraction deficit is not a surprising result. There is less gas available to form stars in these galaxies, and hence their stellar content is weighted towards the older populations. From simulations, if there is little or no gas present, then we may expect their disks to be colder and more dynamically unstable (e.g. Seo et al., 2019), and hence more prone to undergoing a bar instability, which may explain the prevalence of bars in red galaxies (e.g. Friedli & Benz, 1993; Berentzen et al., 2007; Villa-Vargas et al., 2010). The question remains as to whether the bar had any influence in making a galaxy disk gas-poor, or if it simply took advantage of the gas-poor conditions already present and formed. A runaway process may occur in which galaxies with slightly less gas may be slightly quicker to form a bar, which then funnels gas more efficiently, and leads to a longer and stronger bar. Given that barred galaxies should use up their gas more quickly along with the fact that lower gas fraction disks form bars more quickly, just tiny differences at early times could lead to the larger differences seen now.
3.5 Environment
We investigate the environment of the barred and unbarred galaxy sample using the Galaxy Environment for MaNGA Value Added Catalogue (GEMA-VAC; Argudo-Fernández et al. in prep). This catalogue was matched to the barred and unbarred samples, and 42 pairs were found to have environmental information available. Using the projected distance to the 5th nearest group galaxy, , parameter, we perform a 2-sample K-S test on the barred and unbarred samples. We find a p-value of 0.39, meaning we cannot reject the null hypothesis that the two samples are drawn from the same population. For the galaxy pairs with environmental information, it seems there is no difference in group-scale environment between barred an unbarred galaxies. We note here that the environments probed in this work do not include very dense cluster regions, where some studies find an overabundance of bars (e.g. Andersen, 1996; Skibba et al., 2012).
We also consider the possible effects of the cosmic web by computing the distance to the nearest filament, , and nearest node for 126 galaxy pairs with cosmic web information obtained from a 3D ridge extractor algorithm DisPerSE (Sousbie, 2011; Sousbie et al., 2011) applied to the SDSS main galaxy catalogue (Tempel et al., 2014; Kraljic et al., 2020). When large-scale structure is considered, we find the marginal difference (2.4) between the distance to filaments ( p-value = 0.018), and the distance to nodes ( pval = 0.018) such that barred galaxies may be located closer to large-scale structure than their non-barred counterparts.
We conclude that the barred galaxies with environmental information in our sample are not more likely to be located in overdense environments (be that on group or cluster scales) than their unbarred counterparts. While the large-scale signal is marginal, we can conclude that any significant differences in stellar populations and star formation histories presented in this work are not attributed to environmental effects.
3.6 Bars – cause or effect?
We have shown that barred galaxies possess stellar populations that are older, more metal-rich, and less dust-obscured than a stringently-selected mass- and morphology-matched sample of non-barred galaxies. The reason for this difference is that they have built up their mass earlier, and reached the peak of their star formation activity earlier. We do not expect this differing history is due simply to a lack of availability of pristine gas, as the group-scale environments of the barred and non-barred galaxy samples are comparable. We infer that barred galaxies performed the bulk of their star formation at earlier times, and have settled into a more quiescent state earlier than equivalent unbarred galaxies.
An interesting result is the difference in global average stellar metallicity between the barred and unbarred galaxies. While it is possible it is an environmental effect (unbarred galaxies may have access to greater amounts of pristine gas for star formation, and hence the lower metallicity measurements), we do not see significant evidence of this effect in this sample. Instead, we speculate that the processes of star formation are different in barred and unbarred galaxies; barred galaxies may be better at recycling used gas. When gas is ejected from the disk by supernova feedback it is eventually thought to rain back down onto the disk via a galactic fountain accretion model (e.g. Oppenheimer et al., 2010). It is possible that in non-barred galaxies the galactic fountain gas stays close to where it is deposited back onto the galactic disk, whereas in barred galaxies, this gas is more likely to be moved around the galaxy (including being funnelled into central regions) where it is used again in star formation, further chemically-enriching the host galaxy.
HI gas fraction results confirm that barred galaxies lack the fuel required to continue significant star formation at current times, especially for high stellar-mass galaxies. It is obvious that bars reside in galaxies that aged earlier than galaxies that do not host a bar, but the question remains as to whether the presence of a bar had any impact on the galaxy performing the bulk of its star formation early. This brings us to a ‘chicken and the egg’ problem, which can be rephrased as ‘what came first, the quenched galaxy, or the bar’?
The term ‘bar quenching’ describes a scenario in which the bar aids in the faster cessation of star formation in a galaxy, and explains the observations that barred galaxies are redder than non-barred. An alternate explanation, however, is that it is more difficult to form or grow bars in gas-rich disks. If simulations assume that bars grow with time (e.g. Hernquist & Weinberg, 1992; Debattista & Sellwood, 2000), then the longer and stronger bars observed in less active galaxies may simply be the result of them having had more of an opportunity to grow. Indeed, simulations report this scenario (Villa-Vargas et al., 2010; Athanassoula et al., 2013; Algorry et al., 2017), and even small amounts of gas in disks can lead to delayed bar formation and slower subsequent growth (Berentzen et al., 1998; Bournaud et al., 2005). Simulations predict that bars form and grow more easily in gas-free disks (e.g. Athanassoula et al., 2013), such that if a galaxy’s star formation shut off early, the disk will become dynamically cold and unstable enough that a bar instability can form. That said, this scenario does not explain the number of bars that reside in gas-rich disks (e.g. Newnham et al., 2020).
The alternate explanation, that bars help quench a galaxy via a secular evolutionary scenario, is difficult to test without excellent spatial resolution. Observational results of small samples of barred galaxies have been analysed using MUSE; Neumann et al. (2020) analyse the stellar populations of nine barred galaxies and find on average that stellar populations are younger along the major axis of a bar, but older at the edges. The bars are embedded in disks that are even younger, supporting a scenario in which star formation continues in the outer disk of a galaxy, while it has been quenched within the inner disk regions (known as the star formation desert). Work is also occurring that aims to date the central nuclear disks of barred galaxies (Gadotti et al., 2020), and therefore the age of the bar itself. As we are unable to resolve central disks within the barred galaxies of this sample, it is difficult to comment on which scenario is, in reality, playing out.
4 Summary & Conclusions
We investigated the physical properties of a sample of 245 barred galaxies from the MaNGA galaxy survey and compared them to a stringently-selected mass- and morphology-matched sample of non-barred galaxies. We confirmed previous results that barred galaxies are globally redder, older, and more metal-rich than non-barred galaxies of a given mass and morphological type. Bars must therefore be linked to lower current and recent star formation activity in galaxies. By using Starlight to perform full spectral fitting on both samples, we found that the star formation histories of barred galaxies peak on average 1.7 Gyr earlier and build up their mass on average 0.4 Gyr quicker than non-barred galaxies.
We find no evidence that barred galaxies are located in denser environments, but cannot completely rule it out given the sample size. It is therefore not likely that the cosmic web pristine gas replenishment is the main culprit of the late-time star formation in non-barred galaxies.
HI results are somewhat marginal for the entire sample, but we report the 3.1 result that the HI gas fraction is lower for high-mass () barred galaxies than for their non-barred counterparts. For these high-mass galaxies, we propose a runaway feedback scenario in which disks with slightly less gas form bars slightly quicker. The bar grows in strength and funnels gas more efficiently and this, coupled with the fact that barred galaxies should use up their gas more quickly means that small differences at early times may lead to these larger differences in HI gas fraction observed in high-mass galaxies today.
The efficient funnelling of gas by bars is also thought to have been responsible for redistributing gas deposited back onto barred galaxies via galactic fountains. We speculate that bars funnel this gas towards central regions, where it is again used in star formation, further chemically enriching the galaxy and causing the higher global metallicities observed in barred galaxies.
Without a method to observationally age-date the formation time of bars, it is impossible to determine whether they induce, or are a result of, disk quenching. We do however, confirm the coupling between the presence of a bar, and an early peak in a galaxy’s star formation history.
5 Acknowledgements
The authors wish to thank the anonymous referee, as well as Steven Bamford, Daniel Thomas, and Dhanesh Krishnarao for useful conversations related to this project.
Funding for the Sloan Digital Sky Survey IV has been provided by the Alfred P. Sloan Foundation, the U.S. Department of Energy Office of Science, and the Participating Institutions. SDSS-IV acknowledges support and resources from the Center for High-Performance Computing at the University of Utah. The SDSS web site is www.sdss.org.
SDSS-IV is managed by the Astrophysical Research Consortium for the Participating Institutions of the SDSS Collaboration including the Brazilian Participation Group, the Carnegie Institution for Science, Carnegie Mellon University, the Chilean Participation Group, the French Participation Group, Harvard-Smithsonian Center for Astrophysics, Instituto de Astrofísica de Canarias, The Johns Hopkins University, Kavli Institute for the Physics and Mathematics of the Universe (IPMU) / University of Tokyo, Lawrence Berkeley National Laboratory, Leibniz Institut für Astrophysik Potsdam (AIP), Max-Planck-Institut für Astronomie (MPIA Heidelberg), Max-Planck-Institut für Astrophysik (MPA Garching), Max-Planck-Institut für Extraterrestrische Physik (MPE), National Astronomical Observatories of China, New Mexico State University, New York University, University of Notre Dame, Observatário Nacional / MCTI, The Ohio State University, Pennsylvania State University, Shanghai Astronomical Observatory, United Kingdom Participation Group, Universidad Nacional Autónoma de México, University of Arizona, University of Colorado Boulder, University of Oxford, University of Portsmouth, University of Utah, University of Virginia, University of Washington, University of Wisconsin, Vanderbilt University, and Yale University.
6 Data Availability
The data underlying this article are available at https://doi.org/10.1093/mnras/staa1303. Scripts used to analyse these data are available on request.
References
- Aguerri et al. (2009) Aguerri J. A. L., Méndez-Abreu J., Corsini E. M., 2009, A&A, 495, 491
- Algorry et al. (2017) Algorry D. G., et al., 2017, MNRAS, 469, 1054
- Andersen (1996) Andersen V., 1996, AJ, 111, 1805
- Asa’d et al. (2017) Asa’d R. S., Vazdekis A., Cerviño M., Noël N. E. D., Beasley M. A., Kassab M., 2017, MNRAS, 471, 3599
- Athanassoula (2003) Athanassoula E., 2003, MNRAS, 341, 1179
- Athanassoula et al. (2013) Athanassoula E., Machado R. E. G., Rodionov S. A., 2013, MNRAS, 429, 1949
- Barway et al. (2011) Barway S., Wadadekar Y., Kembhavi A. K., 2011, MNRAS, 410, L18
- Belfiore et al. (2019) Belfiore F., et al., 2019, AJ, 158, 160
- Berentzen et al. (1998) Berentzen I., Heller C. H., Shlosman I., Fricke K. J., 1998, MNRAS, 300, 49
- Berentzen et al. (2007) Berentzen I., Shlosman I., Martinez-Valpuesta I., Heller C. H., 2007, ApJ, 666, 189
- Bertelli et al. (1994) Bertelli G., Bressan A., Chiosi C., Fagotto F., Nasi E., 1994, A&AS, 106, 275
- Blanton et al. (2011) Blanton M. R., Kazin E., Muna D., Weaver B. A., Price-Whelan A., 2011, AJ, 142, 31
- Blanton et al. (2017) Blanton M. R., et al., 2017, AJ, 154, 28
- Bournaud et al. (2005) Bournaud F., Combes F., Semelin B., 2005, MNRAS, 364, L18
- Bundy et al. (2015) Bundy K., et al., 2015, ApJ, 798, 7
- Calzetti et al. (2000) Calzetti D., Armus L., Bohlin R. C., Kinney A. L., Koornneef J., Storchi-Bergmann T., 2000, ApJ, 533, 682
- Carles et al. (2016) Carles C., Martel H., Ellison S. L., Kawata D., 2016, MNRAS, 463, 1074
- Cervantes Sodi (2017) Cervantes Sodi B., 2017, ApJ, 835, 80
- Chabrier (2003) Chabrier G., 2003, PASP, 115, 763
- Cheung et al. (2013) Cheung E., et al., 2013, ApJ, 779, 162
- Coelho & Gadotti (2011) Coelho P., Gadotti D. A., 2011, ApJL, 743, L13
- Cortese (2012) Cortese L., 2012, A&A, 543, A132
- Davoust & Contini (2004) Davoust E., Contini T., 2004, A&A, 416, 515
- Debattista & Sellwood (2000) Debattista V. P., Sellwood J. A., 2000, ApJ, 543, 704
- Díaz-García et al. (2016) Díaz-García S., Salo H., Laurikainen E., Herrera-Endoqui M., 2016, A&A, 587, A160
- Drory et al. (2015) Drory N., et al., 2015, AJ, 149, 77
- Ellison et al. (2011) Ellison S. L., Nair P., Patton D. R., Scudder J. M., Mendel J. T., Simard L., 2011, MNRAS, 416, 2182
- Elmegreen & Elmegreen (1985) Elmegreen B. G., Elmegreen D. M., 1985, ApJ, 288, 438
- Erwin (2005) Erwin P., 2005, MNRAS, 364, 283
- Erwin (2019) Erwin P., 2019, arXiv e-prints, p. arXiv:1908.08423
- Eskridge et al. (2000) Eskridge P. B., et al., 2000, AJ, 119, 536
- Fragkoudi et al. (2016) Fragkoudi F., Athanassoula E., Bosma A., 2016, MNRAS, 462, L41
- Fraser-McKelvie et al. (2020) Fraser-McKelvie A., et al., 2020, MNRAS,
- Friedli & Benz (1993) Friedli D., Benz W., 1993, A&A, 268, 65
- Gadotti et al. (2020) Gadotti D. A., Bittner A., Falcón-Barroso J., Méndez-Abreu J., Timer Team 2020, in Valluri M., Sellwood J. A., eds, IAU Symposium Vol. 353, IAU Symposium. pp 135–139 (arXiv:1909.02582), doi:10.1017/S1743921319008585
- Gavazzi et al. (2015) Gavazzi G., et al., 2015, A&A, 580, A116
- Girardi et al. (2000) Girardi L., Bressan A., Bertelli G., Chiosi C., 2000, A&AS, 141, 371
- Gunn et al. (2006) Gunn J. E., et al., 2006, AJ, 131, 2332
- Hart et al. (2016) Hart R. E., et al., 2016, MNRAS, 461, 3663
- Hart et al. (2017) Hart R. E., et al., 2017, MNRAS, 472, 2263
- Haynes et al. (2011) Haynes M. P., et al., 2011, AJ, 142, 170
- Haynes et al. (2018) Haynes M. P., et al., 2018, ApJ, 861, 49
- Hernquist & Weinberg (1992) Hernquist L., Weinberg M. D., 1992, ApJ, 400, 80
- Ho et al. (1997) Ho L. C., Filippenko A. V., Sargent W. L. W., 1997, ApJ, 487, 591
- Hoyle et al. (2011) Hoyle B., et al., 2011, MNRAS, 415, 3627
- Jogee et al. (2005) Jogee S., Scoville N., Kenney J. D. P., 2005, ApJ, 630, 837
- Khoperskov et al. (2018) Khoperskov S., Haywood M., Di Matteo P., Lehnert M. D., Combes F., 2018, A&A, 609, A60
- Kim et al. (2017) Kim E., Hwang H. S., Chung H., Lee G.-H., Park C., Cervantes Sodi B., Kim S. S., 2017, ApJ, 845, 93
- Knapen et al. (2002) Knapen J. H., Pérez-Ramírez D., Laine S., 2002, MNRAS, 337, 808
- Kraljic et al. (2020) Kraljic K., et al., 2020, MNRAS, 491, 4294
- Krishnarao et al. (2020) Krishnarao D., et al., 2020, arXiv e-prints, p. arXiv:2007.01874
- Kruk et al. (2018) Kruk S. J., et al., 2018, MNRAS, 473, 4731
- Laine & Gottesman (1998) Laine S., Gottesman S. T., 1998, MNRAS, 297, 1041
- Law et al. (2015) Law D. R., et al., 2015, AJ, 150, 19
- Law et al. (2016) Law D. R., et al., 2016, AJ, 152, 83
- Lee et al. (2012) Lee G.-H., Park C., Lee M. G., Choi Y.-Y., 2012, ApJ, 745, 125
- Lin et al. (2014) Lin Y., Cervantes Sodi B., Li C., Wang L., Wang E., 2014, ApJ, 796, 98
- Martin (1995) Martin P., 1995, AJ, 109, 2428
- Martinez-Valpuesta et al. (2006) Martinez-Valpuesta I., Shlosman I., Heller C., 2006, ApJ, 637, 214
- Masters et al. (2010) Masters K. L., et al., 2010, MNRAS, 404, 792
- Masters et al. (2011) Masters K. L., et al., 2011, MNRAS, 411, 2026
- Masters et al. (2012) Masters K. L., et al., 2012, MNRAS, 424, 2180
- Masters et al. (2019a) Masters K. L., et al., 2019a, MNRAS, 487, 1808
- Masters et al. (2019b) Masters K. L., et al., 2019b, MNRAS, 488, 3396
- Melvin et al. (2014) Melvin T., et al., 2014, MNRAS, 438, 2882
- Menéndez-Delmestre et al. (2007) Menéndez-Delmestre K., Sheth K., Schinnerer E., Jarrett T. H., Scoville N. Z., 2007, ApJ, 657, 790
- Nair & Abraham (2010) Nair P. B., Abraham R. G., 2010, ApJL, 714, L260
- Neumann et al. (2020) Neumann J., et al., 2020, A&A, 637, A56
- Newnham et al. (2020) Newnham L., Hess K. M., Masters K. L., Kruk S., Penny S. J., Lingard T., Smethurst R. J., 2020, MNRAS, 492, 4697
- Oh et al. (2012) Oh S., Oh K., Yi S. K., 2012, ApJS, 198, 4
- Oppenheimer et al. (2010) Oppenheimer B. D., Davé R., Kereš D., Fardal M., Katz N., Kollmeier J. A., Weinberg D. H., 2010, MNRAS, 406, 2325
- Pérez & Sánchez-Blázquez (2011) Pérez I., Sánchez-Blázquez P., 2011, A&A, 529, A64
- Peterken et al. (2020) Peterken T., Merrifield M., Aragón-Salamanca A., Fraser-McKelvie A., Avila-Reese V., Riffel R., Knapen J., Drory N., 2020, MNRAS,
- Quillen et al. (1995) Quillen A. C., Frogel J. A., Kenney J. D. P., Pogge R. W., Depoy D. L., 1995, ApJ, 441, 549
- Robichaud et al. (2017) Robichaud F., Williamson D., Martel H., Kawata D., Ellison S. L., 2017, MNRAS, 469, 3722
- Salim et al. (2016) Salim S., et al., 2016, ApJS, 227, 2
- Salim et al. (2018) Salim S., Boquien M., Lee J. C., 2018, ApJ, 859, 11
- Seo et al. (2019) Seo W.-Y., Kim W.-T., Kwak S., Hsieh P.-Y., Han C., Hopkins P. F., 2019, ApJ, 872, 5
- Sheth et al. (2008) Sheth K., et al., 2008, ApJ, 675, 1141
- Skibba et al. (2012) Skibba R. A., et al., 2012, MNRAS, 423, 1485
- Smee et al. (2013) Smee S. A., et al., 2013, AJ, 146, 32
- Sousbie (2011) Sousbie T., 2011, MNRAS, 414, 350
- Sousbie et al. (2011) Sousbie T., Pichon C., Kawahara H., 2011, MNRAS, 414, 384
- Spinoso et al. (2017) Spinoso D., Bonoli S., Dotti M., Mayer L., Madau P., Bellovary J., 2017, MNRAS, 465, 3729
- Tempel et al. (2014) Tempel E., et al., 2014, A&A, 566, A1
- Vazdekis et al. (2010) Vazdekis A., Sánchez-Blázquez P., Falcón-Barroso J., Cenarro A. J., Beasley M. A., Cardiel N., Gorgas J., Peletier R. F., 2010, MNRAS, 404, 1639
- Vazdekis et al. (2016) Vazdekis A., Koleva M., Ricciardelli E., Röck B., Falcón-Barroso J., 2016, MNRAS, 463, 3409
- Vera et al. (2016) Vera M., Alonso S., Coldwell G., 2016, A&A, 595, A63
- Villa-Vargas et al. (2010) Villa-Vargas J., Shlosman I., Heller C., 2010, ApJ, 719, 1470
- Wake et al. (2017) Wake D. A., et al., 2017, AJ, 154, 86
- Wang et al. (2012) Wang J., et al., 2012, MNRAS, 423, 3486
- Westfall et al. (2019) Westfall K. B., et al., 2019, AJ, 158, 231
- Willett et al. (2013) Willett K. W., et al., 2013, MNRAS, 435, 2835
- Yan et al. (2016a) Yan R., et al., 2016a, AJ, 151, 8
- Yan et al. (2016b) Yan R., et al., 2016b, AJ, 152, 197