Light Detection System and Time Resolution of the NA62 RICH
Abstract
A large RICH detector is used in NA62 to suppress the muon contamination in the charged pion sample by a factor of 100 in the momentum range between 15 and 35 GeV/c. Cherenkov light is collected by 1952 photomultipliers placed at the upstream end. In this paper the characterization of the photomultipliers and the dedicated Frontend and Data Acquisition electronics are described, the time resolution and the light detection efficiency measurement are presented.
1 Introduction
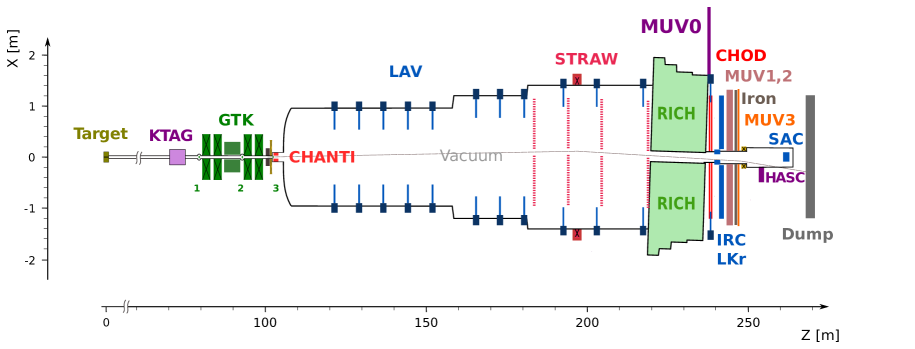
NA62 [1] is a fixed target experiment located in the North Area of CERN and dedicated to study charged kaon decays, in particular the very rare decay . The NA62 beam line and detector are sketched in figure 1, while a detailed description can be found in [2].
A 400-GeV proton beam extracted from the CERN Super Proton Synchrotron (SPS) impinges on a beryllium target in spills of three seconds effective duration. Typical intensities during data-taking range from to protons per pulse. The resulting secondary hadron beam of positively charged particles is comprised of 70% , 23% protons, 6% , and 1 , with a nominal momentum of 75 GeV/c (1% rms momentum bite).
Beam particles are characterized by a differential Cherenkov counter (KTAG) and a three-station silicon pixel array (Gigatracker, GTK). The KTAG uses N2 gas at 1.75 bar pressure (contained in a 5-m long vessel) and is read out by photomultiplier tubes grouped in eight sectors. It tags incoming kaons with 70-ps time resolution. The GTK stations are located before, between, and after two pairs of dipole magnets (a beam achromat), forming a spectrometer that measures beam particle momentum, direction, and time with resolutions of 0.15 GeV/, 16 rad, and 100 ps, respectively. The typical beam particle rate at the third GTK station (GTK3) is about 450 MHz.
GTK3 marks the beginning of a 117 m-long vacuum tank. The first 80 m of the tank define a fiducial volume (FV) in which 13% of the kaons decay.
The time, momentum, and direction of charged decay products are measured by a magnetic spectrometer (STRAW), a ring-imaging Cherenkov counter (RICH), and two scintillator hodoscopes (CHOD and NA48-CHOD). The STRAW, comprised of two pairs of straw chambers on either side of a dipole magnet, measures momentum-vectors with a resolution of between 0.3% and 0.4%. The RICH must tag the decay particles with a timing precision of better than 100 ps and provides particle identification. The CHOD, a matrix of tiles read out by SiPMs, and the NA48-CHOD, composed of two orthogonal planes of scintillating slabs, are used for triggering and timing, providing a time measurement with 200-ps resolution.
Other sub-detectors suppress decays into photons or into multiple charged particles (electrons, pions or muons) or provide complementary particle identification. Six stations of plastic scintillator bars (CHANTI) detect, with 99% efficiency and 1 ns time resolution, extra activity, including inelastic interactions in GTK3. Twelve stations of ring-shaped electromagnetic calorimeters (LAV1 to LAV12), made of lead-glass blocks, surround the vacuum tank and downstream sub-detectors to achieve hermetic acceptance for photons emitted by decays in the FV at polar angles between 10 and 50 mrad. A 27 radiation-length thick, quasi-homogeneous liquid krypton electromagnetic calorimeter (LKr) detects photons from decays emitted at angles between 1 and 10 mrad. The LKr also complements the RICH for particle identification. Two hadronic iron/scintillator-strip sampling calorimeters (MUV1,2) and an array of scintillator tiles located behind 80 cm of iron (MUV3) supplement the pion/muon identification system. A lead/scintillator shashlik calorimeter (IRC) located in front of the LKr and a similar detector (SAC) placed on the Z axis at the downstream end of the apparatus, ensure the detection of photons down to zero degrees in the forward direction. Additional counters (MUV0, HASC) installed at optimized locations provide nearly hermetic coverage for charged particles produced in multi-track kaon decays.
The RICH detector has a fundamental role in the search for the decay [3]. It must distinguish pions from muons, provide a precise pion time in a high particle rate environment (10 MHz) to match the kaon in the very intense beam (750 MHz); furthermore the RICH time is used as reference for the Level-0 trigger of the experiment. A first study of decay, based on data collected in 2016, was published in [4], while the analysis of data collected in 2017 was presented in [5], where the details of background suppression are discussed and the importance of the RICH detector is highlighted.
2 RICH detector
The process is the decay with the largest branching ratio (), about 10 orders of magnitude larger than that of the signal . The suppression of this background is achieved by kinematics and by using the very different stopping power of muons and charged pions in calorimeters. A further suppression factor of 100 is obtained by means of the RICH. Neon gas at atmospheric pressure has been chosen as radiator having the appropriate refractive index and because it guarantees good light transmission and low chromatic dispersion. The 12.5 GeV/c Cherenkov threshold for pions is well suited for the 15 GeV/c lower bound of the NA62 operating momentum range. On the other hand, given the low emission rate per length of Cherenkov photons in neon, a long radiator is needed.
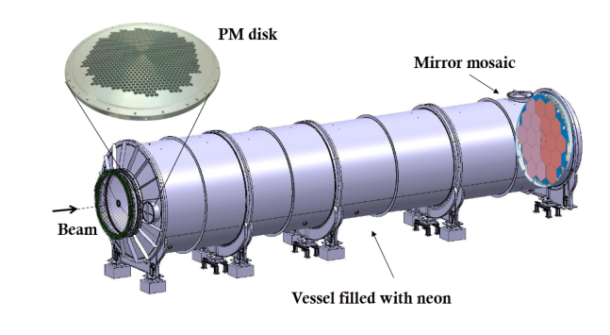
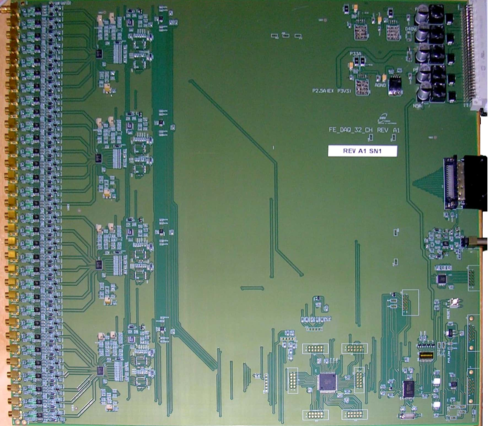
A detailed description of the RICH detector can be found in [6]. The RICH neon vessel is a 17 m long vacuum proof tank, made of steel and composed of 4 cylindrical sections of decreasing diameter. A beam pipe, 168 mm in diameter, crosses the RICH detector to allow undecayed particles to travel in vacuum down to the experiment beam dump. A steel conical cap connects the upstream window with the first cylindrical section and accommodates the photomultipliers (PMs) placed outside the particle acceptance in two disks containing 976 PMs each. Cherenkov light is reflected by a mosaic of 20 spherical mirrors with 17 m focal length, placed at the downstream end of the vessel and described in detail in [6]; the mirror alignment during data taking is discussed in [7]. The total neon volume is about 200 m3: fresh neon is injected inside the container after it has been fully evacuated, then sealed. No purification or recirculation system is present. Two prototype detectors were built and tested in hadron beams to demonstrate the performance of the proposed layout: the results of these tests have been published [8, 9]. A pictorial view of the RICH detector is shown in figure 2.
3 The light detection system
The simulation of the shape and granularity of the photo-detection system showed that the optimal performance can be achieved with a pixel pitch not larger than 18 mm, given the dual mirror orientation, the radiator refractive index and the signal kinematics.
A compact size PM (Hamamatsu R7400 U-03) with cathode sensitivity ranging from visible to near UV and high multiplication gain was chosen as photo-detector as the result of a beam test [8]. The PM has a cylindrical shape with an outer diameter of 16 mm, a height of 16 mm and a circular active surface of 8 mm diameter. The transit time spread is 0.28 ns. The characteristics of the chosen PM are summarised in table 1.
| PM | R7400U-03 |
|---|---|
| type | head on; metal package tube for UV-visible range |
| diameter | 16 mm |
| active diameter | 8 mm |
| min | 185 nm |
| max | 650 nm |
| peak sensitivity | 420 nm |
| cathode radiant sensitivity | 62 mA/W |
| window | UV glass |
| cathode type | bialkali |
| cathode luminous sensitivity | 70 A/lm |
| anode luminous sensitivity | 50 A/lm |
| gain | |
| dark current after 30 minutes | 0.2 nA |
| rise time | 0.78 ns |
| transit time | 5.4 ns |
| transit time spread | 0.28 ns |
| number of dynodes | 8 |
3.1 The photomultipliers
The R7400U-03 spectral response was measured in laboratory for several units and for few photon wavelengths since a systematic characterization in the whole Cherenkov spectrum would have required dedicated instrumentation. Those measurements showed that the quantum efficiency (QE) is about 20% at 400 nm for PMs with cathode luminous sensitivity at the level of 60 A lm-1. Moreover, the efficiency was found to be proportional to the cathode luminous sensitivity quoted by manufacturer, hence the 1952 PMs with the best cathode luminous sensitivity were installed in the RICH detector and the remaining PMs (15%) were left as spares.
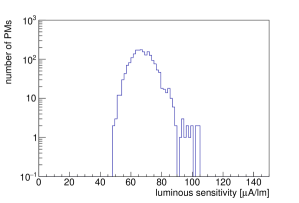
The cathode luminous sensitivity quantity is proportional to the photo-current produced by an incident flux from a tungsten lamp operated at 2856 K. In figure 3-left the cathode luminous sensitivity for the installed PMs is presented, showing that the sample has an average of 68 A lm-1 with few devices reaching 100 A lm-1. All PMs underwent a laser acceptance test before installation in the detector.
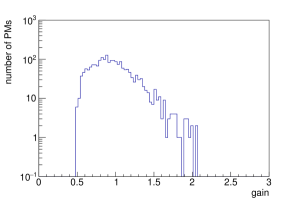
The typical gain of the the R7400U-03 is at 800 V and at 900 V. The corresponding average charge generated per photo-electron is 110 fC and 240 fC, respectively. The frontend electronics is fully efficient only for charge larger than 100 fC (see section 5.1), as a consequence an operating voltage of 900 V was chosen. Since the maximum operating voltage for R7400U-03 is 1000 V, there is a possibility to increase the applied voltage in case of ageing. For the NA62 RICH, PMs with a gain greater than at 800 V were requested from the manufacturer (see figure 3-right).
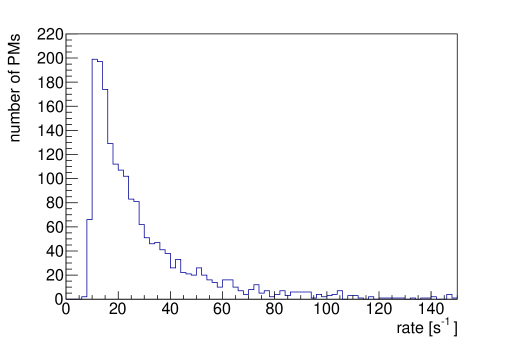
The dark count rate of each individual PM is evaluated in situ from the PM counting rate when the beam is off. The measurement is performed periodically and is part of the characterization routine for detector maintenance and the response equalization. Figure 4 shows the dark count rate measurements. The 98% of the 1952 PMs have a dark count rate below 150 s-1 with an average of 30 s-1 and a typical value of 10 s-1.
3.2 Voltage divider
A custom voltage divider was designed to replace the E5780 voltage divider (standard for R7400U-03) to overcome the problem of heat dissipation and to avoid the use of a cooling system for the PM disks. This precaution allows to prevent variation of the refractive index of the radiator due to temperature gradient along the vessel. The divider is encapsulated in a socket with the same geometrical characteristics and pin assignment as those of the E5780. Optical tightness is guaranteed by coating the circuit with a flame retardant, halogen free, low smoke and heat conductive resin. At 900 V bias, the custom divider has a current flow of 32 mA, to be compared with 320 mA of the E5780. The socket is equipped with two cables: a 22 AWG twisted pair to feed the high voltage and an RG-178 coaxial cable to route the anode signal towards the frontend electronics.
3.3 High voltage power supply
A reasonable compromise between the channel independence and the cost of the high voltage boards led to a distribution scheme in which a single HV channel feeds four PMs (referred as a cell). For the HV system two different boards are used, 12 modules of type CAEN A1733N (12 channels) and 16 modules of type CAEN A1535SN (24 channels), for a total number of 528 output channels. At 900 V the absorbed current is about 130-140 A for each cell, giving a total consumption of about 60 W.
4 PM mechanics
To simplify access and avoid discharges, the PMs are mounted outside the radiator gas volume. A test performed during the R&D phase showed that the selected PMs operating in helium started to produce discharges with supplied voltages greater than 600 V. The assembly consists of two independent aluminium flanges: a 35 mm thick flange holding the PMs (PM disk) and a 23 mm thick radiator flange.
4.1 Radiator flange
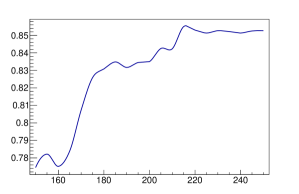
The light entrance holes on the radiator flange have a truncated cone shape, approximating a paraboloid ("Winston Cone" [10]). A Winston cone is designed to maximize the collection of incoming light by allowing off-axis rays to enter the exit aperture after multiple reflections. The optimized dimensions of the cone are 21.5 mm high, 18 mm wide at the entrance and 7.5 mm at the exit. Each cone is covered with a highly reflective aluminized Polyethylenterephthalat (Mylar™) foil to funnel the light through the window aperture. The average reflectivity of the mylar foil measured for different samples as a function of the radiation wavelength in shown in figure 5-left.
Outside each Winston cone, on the PM side, there is a 1.5 mm deep, 14 mm wide cylindrical hole to accommodate the quartz windows. Quartz windows, used to separate PMs from the neon gas, are 12.7 mm wide, 1 mm thick and made of synthetic UV-grade fused silica. The quartz transmission is shown in figure 5-right. The refractive index is 1.46 and the density is 2.20 g/cm3. The windows are manufactured by Präzisions Glas & Optik GmbH.
4.2 PM disk
The PMs are mounted on the PM disk in front of the quartz windows. A cylindrical hole, 16.4 mm wide and 12.5 mm high, has been drilled in the disk for each PM, followed by a 17.5 mm wide and 20 mm high hole for the HV divider. A 1 mm thick O-ring (17.5 mm outer and 13.5 mm inner diameter, retained by a 1.5 mm thick groove in the hole, 1 mm above the end) has been placed in front of the PM and pressed against the quartz window to avoid the penetration of external light. A 5 mm thick O-ring (with the same outer and inner diameter as the 1 mm O-ring) has been placed on the back of the PM, after the end of the HV divider, to close the hole and avoid external light. This O-ring also guarantees good thermal contact between the PM and the PM disk.
5 Frontend electronics
The frontend (FE) electronics is placed near the PM disks and is comprised of 64 boards housed in four crates. The design of custom FE boards is based on the NINO chip [11].
5.1 NINO chip
The NINO chip is an 8-channel ASIC developed at CERN for the ALICE experiment for precision time measurement. Each channel features an ultra fast low noise input amplifier followed by a discriminator stage. The NINO chip has been adopted for the RICH due to the following characteristics: input signal range between fC and pC (compatible with the PM output); small time jitter ( ps for charge greater than fC); ns peaking time (to sustain the RICH single channel rate up to few hundred kHz); output LVDS pulse width proportional to the input charge preserving charge information after digitization. The discrimination threshold can be set as low as fC corresponding to a small fraction of a typical PM signal.
In addition the NINO has a fully differential circuit design that gives immunity against noise and provides a digital OR output used for trigger purposes. Each NINO chip serves two 4-channel HV cells, the 8-channel OR ouput is defined as a supercell. The total number of supercells is 244.
5.2 Frontend boards
Each FE board has 32 channels and houses four NINO chips. Each channel has a custom designed preamplifier (PA) with gain 3 and differential signal output. Special attention has been devoted to impedance adjustment: in order to avoid reflections each channel has a 50 impedance both at the PA and NINO level. In addition to the ancillary components of NINO and PA, the frontend board houses the following parts: a power section with appropriate voltage regulators, a circuit for external test pulse distribution and a group of lines to set and monitor NINO parameters (threshold, pulse width and hysteresis). There are two options to set NINO parameters: a trimmer resistor or a DAC (digital to analog converter) remotely controlled via CAN bus.
The boards are powered by AGILENT N6700 mainframes. Four modules are installed in each mainframe to provide independent voltage lines: and V for the PA’s, V for the NINOs and a V for the other digital logic circuits. The total power consumption for each crate is 170 W.
6 DAQ system
The readout of the RICH is based on the NA62 common system composed of a mother board, the TEL62 [12] and four daughter Time to Digital Converter Boards (TDCB) [13]. In total there are five TEL62 boards, four boards to read the PM signals and one to read the signals from supercells.
6.1 The TDCB
The TDCB input is designed to receive up to 128 channels (4 connectors with 32 channels each). The requirements of a good time resolution led to the choice of the CERN high-performance time-to-digital converter (HPTDC) [14]. The HPTDC output provides the leading and trailing time of the LVDS input signal with 100 ps least significant bit (LSB). Each TDCB houses 4 HPTDC and 1 FPGA used to transfer data from each single HPTDC to the TEL62 board. The FPGA is also used to configure the TDCB.
6.2 TEL62
The TEL62 is a general-purpose data acquisition board, an updated version of the TELL1 board designed by the EPFL for the LHCb experiment at CERN [15]. The board hosts five FPGA. Four of them are called PP (Pre-Processing), each one handling the data coming from a TDCB. The fifth FPGA, called SL (Sync-Link), is used to merge the data flux of the four PPs. The SL also sends the data to the online PC farm via a 4 gigabit ethernet daughter card. The TEL62 can also produce trigger primitives and send them to a central L0 trigger processor [16], whose expected maximum output rate is 1 MHz.
6.3 RICH in L0 Trigger
The RICH is one of the detectors used in the L0 Trigger system of NA62, producing the reference time for most trigger configurations. The RICH primitives are generated by the TEL62 dedicated to the readout of supercell signals. The trigger algorithm is based on the clustering of supercell signals and on the computation of cluster multiplicity and average time. In the PP, if at least two hits have a time difference less than 6.25 ns, a sub-cluster primitive is generated. The SL firmware stores the sub-clusters coming from different PPs into one buffer. If two or more sub-clusters are closer in time than 6.25 ns, the sub-cluster multiplicities are summed and define the cluster multiplicity; the cluster time is computed as the weighted average of sub-cluster times. The RICH primitive is generated if the cluster multiplicity is greater or equal to an adjustable threshold that allows to keep the L0 primitive rate within the design limit of 10 MHz. The threshold was initially set to 3 and lowered to 2 in 2017 after an L0 system improvement.
7 Light detection efficiency
The relative efficiency of Cherenkov photon detection was measured for the 2016-2018 data taking period for most of the RICH PMs. Here the results obtained for the year 2017 are shown.
With a tight selection of decays (Ke3) a clean positron sample has been obtained without using the RICH information. For positrons the average ring radius and number of hits are constant in the momentum range exploited in the experiment. The background from other decays is at the level of . The Cherenkov photons emitted by positrons are requested to be in the geometric acceptance of the RICH mirrors. This requirement together with the kinematic constraints derived by Ke3 decay selection does not allow to measure the efficiency for all the PMs due to low statistics. The efficiency was not measured for 2 PMs in the right disk (with respect to the beam direction) and 37 in the left one, corresponding to of PMs.
7.1 RICH performance stability
First, the stability of the RICH performance is checked. The number of hits and ring radius for positron rings are averaged over a certain time period (typically one day long) and the average values and are plotted as a function of time (see figure 7).
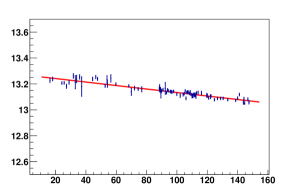
exhibits a slow decrease hits/day, while is stable within 0.04 mm (or in relative terms). The average radius value is = 190.67 mm.
The obtained result proves the performance stability and allows to calculate the expected value of and for any time period.
7.2 Light detection efficiency measurement
For each selected Ke3 event the expected position of the ring center and the expected radius of the Cherenkov ring of the positron at the PM flanges are calculated exploiting the track direction from the spectrometer and the known value . Defining as the difference between , the distance of the PM center from the expected ring center, and the expected ring radius , is required to be lower than 3 mm in order that the ring falls in the PM active area. For each PM satisfying such a condition a "normalization" counter is incremented by one.
Afterwards, for the same event and for each PM included in the normalization subset with a hit (without any assumption on the ring from the RICH reconstruction) in time with the positron (the KTAG time of the event is used) an "efficiency" counter is incremented by a weight defined as:
| (7.1) |
where mm is the radius of the entrance surface of the Winston Cone, mm is the radius of the exit surface of the Winston cone (corresponding to the active surface of the PM photocathode), is an estimation of the integrated reflectivity of the internal surface of the Winston cone. This weight is applied to take into account the dependence of the measured efficiency on the amount of Cherenkov light reaching a single PM. A further correction of the order of is applied to remove the residual dependence due to mirror misalignment, thus where is the event number.
The light detection efficiency related to a single PM is calculated as the ratio of two counters after all events in the Ke3 sample have been considered. This value corresponds to the integrated efficiency for a Cherenkov ring crossing the center of the PM and takes into account all possible effects: the number of Cherenkov photons emitted by the positron passage in the radiator (determined by the figure of merit of the RICH detector), the reflectivity and the dispersion introduced by the mirrors, the probability of absorption and diffusion in the radiator, the probability of photon transmission in the quartz window, the QE of the PM and the readout efficiency of the RICH.
The light detection efficiency measurement is used to compare different PMs, to identify misbehaving PMs and to study the RICH response for different periods of the data taking, in order to spot possible ageing or degradation effects.
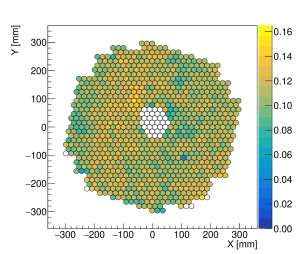
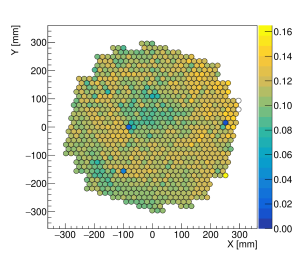
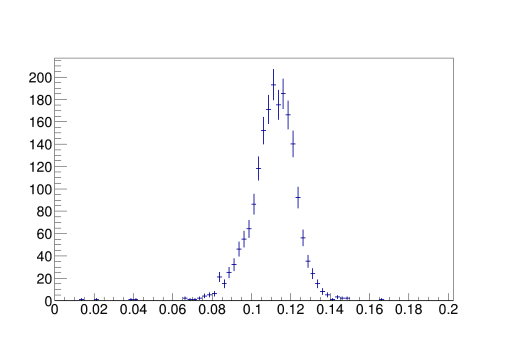
Figure 8 illustrates the relative efficiency map for two PM disks of the RICH. The efficiency distribution is shown in figure 9; the average efficiency is found to be . Four PMs ( of the total sample) with problematic behaviour are identified.
8 Time resolution
One of the main characteristics of the PM and readout performance is the time resolution. The measurement of the event and single hit time resolution is presented below.
8.1 Event time resolution
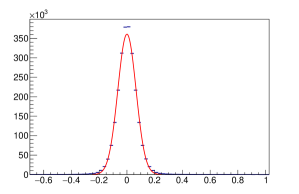
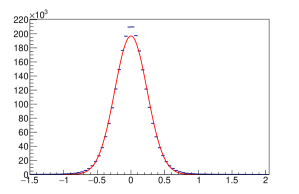
The event time resolution is measured using a clean sample of positron rings similar to the one described in Section 7 but with a tighter selection: the rings are required to be in the acceptance of the PM plane, while the light cones should not touch the beam pipe. These cuts are applied to remove rings that are partially outside the PM acceptance: such rings are useful for the efficiency studies but could bias the time resolution measurement due to lower number of hits per ring. The details of the event selection can be found in [7]. In order to perform the time resolution measurement independently of other detectors, RICH hits associated with a ring are randomly split into two groups, the average time of each group and is calculated and a new variable is introduced: . The event time is equal to . Assuming the hit independence, and hence , where is the gaussian width. The distribution of the is shown in figure 10. The gaussian fit gives ns. The wide fit range includes non-gaussian tails which results in a poor agreement between the data and fitting function in the central region. The non-gaussian tails in the distribution are mostly due to the non-gaussian tails of the single-hit time distribution and to residual systematic effects of the TEL62 time offsets.
8.2 Single hit time resolution
The single hit time resolution is estimated from the same positron sample as for the event time resolution measurement. In order to exclude the dependence on the number of hits, the variable is introduced as . Since (under the same assumption as in 8.1) and , , where is the single hit time resolution. The distribution is shown in figure 11-left. The gaussian fit gives = 0.24 ns. The origin of non-gaussian tails is the same as for figure 10. As a cross-check, the single hit time resolution is calculated from the time variance . The distribution of is shown in figure 11-right. Its mean value (0.25 ns) is an alternative estimate of and is similar to the value obtained from the width.
Using the measured value of the average number of hits = 14.1 (this value is higher than the one from Section 7.1 due to the additional cut on the ring acceptance to exclude the cone intersection with the beam pipe, see [7] for details), one can estimate the event time resolution under the assumption of constant value of : ns which is close to the measured value ns.
9 Conclusions
The RICH detector was installed at the beginning of the NA62 pilot run in 2014 and commissioned in 2014-2015. The physics runs took place in 2016-2018.
In this paper the details of the NA62 RICH light detection and read-out systems are described. The light detection efficiency is estimated for single PMs and the average value is found to be 10%. The time resolution is measured using the positron sample: the event time resolution is 0.07 ns, much better than the requested 0.1 ns resolution needed to cope with the experiment particle rate, while the single hit time resolution is 0.24 ns.
The RICH detector has been crucial in the NA62 physics results, contributing to several aspects of the analysis: the optimal RICH time resolution has been essential for the L0 trigger and to suppress accidental background, while the PID performance has been indispensable to reduce background from kaon decays.
Acknowledgments
The construction of the RICH detector would have been impossible without the enthusiastic work of technicians from the University and INFN of Perugia and Firenze and the staff of the CERN laboratory. We are grateful to the whole NA62 Collaboration for its support during the construction, installation and commissioning of the RICH detector and for its dedication in operating the experiment in data taking conditions. The software framework and algorithms developed by the NA62 collaboration for off-line data processing were used to obtain the results presented here.
References
- [1] G. Anelli et al, Proposal to measure the rare decay at the CERN SPS, CERN-SPSC-2005-013, CERN-SPSC-P-326.
- [2] E. Cortina Gil et al, The beam and detector of the NA62 experiment at CERN, JINST 12 (2017) P05025.
- [3] R. Volpe et al, The role of the NA62 RICH in the measurement, Nucl. Instrum. Meth. Phys. Res. A 952 (2020) 161802.
- [4] E. Cortina Gil et al, First search for using the decay-in-flight technique, Phyis. Lett. B 791 (2019) 156.
- [5] E. Cortina Gil et al, An investigation of the very rare decay, arXiv:2007.08218 [hep-ex] (2020), submitted to JHEP.
- [6] G. Anzivino et al, Mirror system of the RICH detector of the NA62 experiment, JINST 12 (2017) P12017.
- [7] G. Anzivino et al, Precise mirror alignment and basic performance of the RICH detector of the NA62 experiment at CERN, JINST 13 (2018) P07012.
- [8] G. Anzivino et al, Construction and test of a RICH prototype, Nucl. Instrum. Meth. Phys. Res. A 538 (2008) 314.
- [9] B. Angelucci et al, Pion-Muon separation with a RICH prototype for the NA62 experiment, Nucl. Instrum. Meth. Phys. Res. A 621 (2010) 205.
- [10] H. Hinterberger and R. Winston, Efficient Light Coupler for Threshold Cerenkov Counters, Rev. Sci. Instr. 37 (1966) 1094.
- [11] F. Anghinolfi et al, NINO: An ultrafast low-power front-end amplifier/discriminator ASIC designed for the multigap resistive plate chambers, Nucl. Instrum. Meth. Phys. Res. A 533 (2004) 183.
- [12] B. Angelucci et al, The FPGA based trigger and data acquisition system for the CERN NA62 experiment, JINST 9 (2014) C01055.
- [13] E. Pedreschi et al, A high-resolution TDC-based board for a fully digital trigger and data acquisition system in the NA62 experiment at CERN, IEEE Trans. Nucl. Sci. 62 (2015) 1050.
- [14] J. Christiansen, HPTDC, high performance time to digital converter, CERN/EP-MIC, Geneva, Switzerland, Mar. 2004 [Online]. Available: http://tdc.web.cern.ch/TDC/hptdc/docs/hptdc_manual_ver2.2.pdf.
- [15] G. Haefeli et al, The LHCb DAQ interface board TELL1, Nucl. Instrum. Meth. Phys. Res. A 560, 494 (2006).
- [16] R. Ammendola et al, The integrated low-level trigger and readout system of the CERN NA62 experiment, Nucl. Instrum. Meth. Phys. Res. A 929 (2019) 1.