11email: xyzhang@strw.leidenuniv.nl 22institutetext: SRON Netherlands Institute for Space Research, Sorbonnelaan 2, 3584 CA Utrecht, The Netherlands 33institutetext: Kavli Institute for the Physics and Mathematics of the Universe (WPI), The University of Tokyo, Kashiwa, Chiba 277-8583, Japan 44institutetext: Hamburger Sternwarte, University of Hamburg, Gojenbergsweg 112, 21029 Hamburg, Germany 55institutetext: Dipartimento di Fisica e Astronomia, Università di Bologna, via Gobetti 93/2, 40122 Bologna, Italy 66institutetext: INAF - Istituto di Radioastronomia di Bologna, Via Gobetti 101, 40129 Bologna, Italy 77institutetext: Minnesota Institute for Astrophysics, University of Minnesota, 116 Church St. S.E., Minneapolis, MN 55455, USA 88institutetext: Harvard-Smithsonian Center for Astrophysics, 60 Garden Street, Cambridge, MA 02138, USA 99institutetext: Department of Physics and Astronomy, University of Iowa, 203 Van Allen Hall, Iowa City, IA 52242, USA
ClG 0217+70: A massive merging galaxy cluster with a large radio halo and relics
We present an analysis of archival Chandra data of the merging galaxy cluster ClG 0217+70. The Fe XXV He X-ray emission line is clearly visible in the 25 ks observation, allowing a precise determination of the redshift of the cluster as . We measure keV and estimate based on existing scaling relations. Correcting both the radio and X-ray luminosities with the revised redshift reported here, which is much larger than previously inferred based on sparse optical data, this object is no longer an X-ray underluminous outlier in the scaling relation. The new redshift also means that, in terms of physical scale, ClG 0217+70 hosts one of the largest radio halos and one of the largest radio relics known to date. Most of the relic candidates lie in projection beyond . The X-ray morphological parameters suggest that the intracluster medium is still dynamically disturbed. Two X-ray surface brightness discontinuities are confirmed in the northern and southern parts of the cluster, with density jumps of and , respectively. We also find a kpc X-ray faint channel in the western part of the cluster, which may correspond to compressed heated gas or increased non-thermal pressure due to turbulence or magnetic fields.
Key Words.:
X-rays: galaxies: clusters – galaxies: clusters: individual: ClG 0217+70 – galaxies: clusters: intracluster medium1 Introduction
Galaxy cluster mergers are the most extreme events in the universe and can release energies up to erg. The shocks and magnetohydrodynamic (MHD) turbulence generated during these mergers heat the intracluster medium (ICM) and can also (re)accelerate particles into the relativistic regime (see Brunetti & Jones 2014 for a theoretical review). Synchrotron radiation emitted by these relativistic particles as they gyrate around intergalactic magnetic field lines leads to observed giant radio halos and radio relics (see van Weeren et al. 2019 for a review). Merging galaxy clusters therefore provide unique laboratories to study particle acceleration in a high thermal-to-magnetic pressure ratio plasma. Among the large merging galaxy cluster sample, clusters that host double relics are a rare subclass. They usually have a simple merging geometry with the merger axis close to the plane of the sky and therefore suffer less from projection uncertainties.
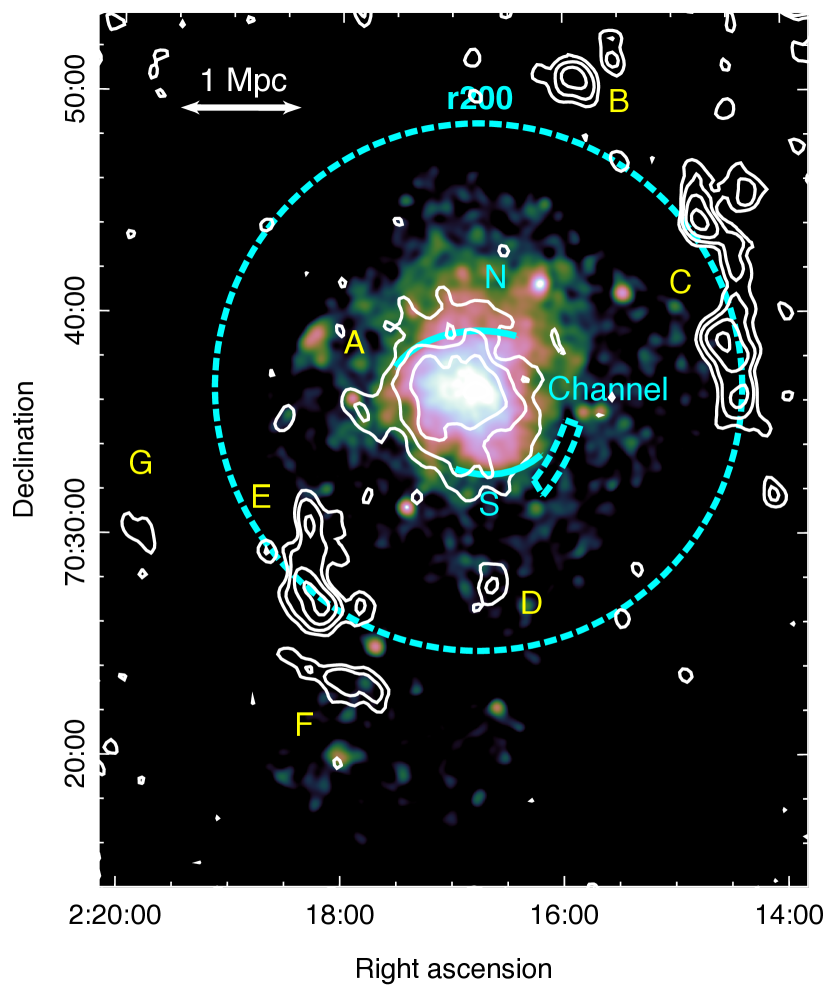
ClG 0217+70, also known as 8C 0212+703 (Hales et al. 1995) or 1RXS J021649.0+703552, is a radio-selected merging cluster (Rengelink et al. 1997; Rudnick et al. 2006), which hosts several peripheral radio relic candidates located on opposite sides of a central radio halo (Brown et al. 2011). Among the relic candidates, sources C, E, F, and G (see Fig. 1 for definition) are not associated with any optical galaxy, and a recent study shows that their spectral indices are steeper towards the cluster center (Hoang et al. in prep.), indicating a shock acceleration feature. This cluster appears as an X-ray underluminous outlier in the scaling relation (e.g., Brunetti et al. 2009; Cassano et al. 2013). One possible explanation for this is the misestimation of the redshift; because of the lack of deep optical data, this was believed to be (Brown et al. 2011). An accurate redshift is essential to scale the physical properties of the cluster and those of the diffuse radio sources (e.g., size and luminosity).
Here we present an analysis of archival Chandra data, which allows a precise determination of the cluster redshift via the ICM Fe-K line. The high spatial resolution of Chandra also enables us to search for surface brightness discontinuities related to the merger. We adopt a CDM cosmology where km s-1 Mpc-1, , and .
2 Observations and data reduction
We analyzed the 24.75 ks Chandra archival data (ObsID: 16293). The Chandra Interactive Analysis of Observations (CIAO)111https://cxc.harvard.edu/ciao/ v4.12 with CALDB 4.9.0 is used for data reduction. The level 2 event file is generated by the task chandra_repro with the VFAINT mode background event filtering. We extracted the 100 s binned 9 – 12 keV light curve for the whole field and did not find flares. Therefore, we used the entire exposure period for data analysis.
3 Data analysis and results
For the imaging analysis, we used the task fluximage to extract the 1 – 3 keV count map and the corresponding exposure map with vignetting correction. The non X-ray background (NXB) map is generated from the stowed background file, which is reprojected to the observation frame by using reproject_events and is scaled by the 9 – 12 keV count rate. The exposure map is applied to the count map after the NXB subtraction to produce the flux map (see Fig. 1). For the spectral analysis, we used the task blanksky to create the tailored blank sky background. Source and background spectra are created using the script specextract, where the weighted redistribution matrix files and ancillary response files are created by mkwarf and mkacisrmf, respectively. The background spectra are scaled by the 9 – 12 keV count rate. We used SPEX v3.06 (Kaastra et al. 1996, 2018) to fit the spectra. The reference protosolar element abundance table is from Lodders et al. (2009). The 0.5–7.0 keV energy range of all spectra were used and optimally binned (Kaastra & Bleeker 2016). The C-statistics (Cash 1979) were adopted as the likelihood function in the fit. We used spectral models to fit the spectra of the ICM, where represents the cosmological redshift, is the emission from hot cluster gas in collisional ionization equilibrium, and we fixed the temperature of the model to keV to mimic the absorption from neutral gas in our Galaxy. In the model, we coupled the abundances of all metals ( to ) with .
| Region | S/B | C-stat / d.o.f. | ||||
|---|---|---|---|---|---|---|
| ( cm-2) | (keV) | () | ||||
| 0”–100” | 11.6 | |||||
| 100”–200” | 4.5 | |||||
| 200”–300” | 1.0 | |||||
| 0”–500” () | 1.7 |
3.1 Spectral properties and X-ray redshift
This object is at a low Galactic latitude and has high Galactic absorption. The tool nhtot222https://www.swift.ac.uk/analysis/nhtot/index.php, which includes the absorption from both atomic and molecular hydrogen (Willingale et al. 2013), suggests cm-2. However, fixing the to this value leads to significant residuals in the soft band. The best-fit from three annuli centered at the X-ray peak and having different source-to-background ratios (S/B) are consistent with each other and all imply a Galactic that is higher than the nhtot database value (see Table 1). This suggests the low-energy residuals are not due to incorrect modeling of the Galactic Halo foreground.
Allowing as a free parameter, the temperature in the three central annuli considered for this analysis is keV. The scaling relation of Henry et al. (2009) then implies Mpc. We also note that the best-fit redshift for all three annuli is , which is much higher then the previous estimation (Brown et al. 2011).
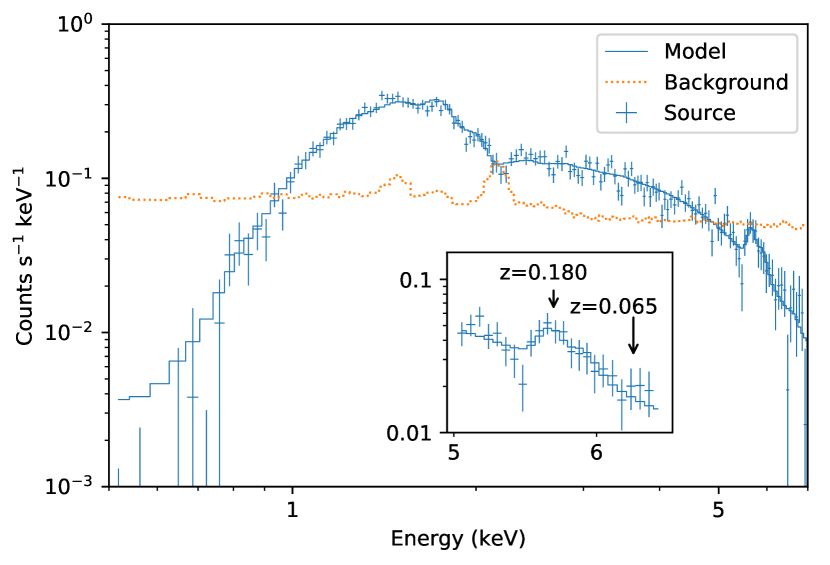
To confirm these findings we further extract a spectrum from the cluster’s central region, which we estimate as Mpc (Reiprich et al. 2013). For our assumed cosmology, this corresponds to ” at . The best-fit redshift within this aperture is indeed , and the Fe emission lines are clearly visible in the X-ray spectrum (see Fig. 2). Other parameters are listed in the fourth row of Table 1. Yu et al. (2011) demonstrates that for X-ray CCD spectra, in the condition of , the X-ray redshifts closely agree with the optical spectroscopic redshifts, and the value of our data corresponds to an accuracy of . We note that the WHL galaxy cluster catalog (Wen et al. 2012), compiled based on Sloan Digital Sky Survey (SDSS) -III photometric redshifts, contains a source WHL J021648.6+703646 which overlaps spatially with ClG 0217+70. The brightest cluster galaxy (BCG) of this source is located from the X-ray peak and has . Therefore, although the quality of the SDSS photometric redshift is poor due to the high Galactic extinction, it is consistent with the presence of a cluster at .
With the updated redshift, the largest linear size (LLS) of the radio halo detected by the Very Large Array (VLA) (Brown et al. 2011) reaches 1.6 Mpc, making this cluster the sixth largest known radio halo (see Feretti et al. 2012 for comparison). The LLS of the western relic candidate (source C in Fig. 1) reaches 2.3 Mpc, becoming the second largest among the radio relics detected to date (see de Gasperin et al. 2014 for comparison). Recent Low Frequency Array (LOFAR) data shows that this relic candidate extends even farther to a size of 2.9 Mpc at 150 MHz (Hoang et al. in prep.). Additionally, if we assume the X-ray peak as the cluster center, the projected distance of the western relic candidate is 2.2 Mpc, which is the second largest among the currently known sample. The easternmost candidate (source G in Fig. 1), whose distance reaches 2.9 Mpc, becomes the record holder for the farthest radio relic known with respect to the center of any galaxy cluster, surpassing the southeastern relic in PSZ1 G287.00+32.90 (Bonafede et al. 2014) with Mpc.
3.2 X-ray morphology and surface brightness discontinuities
The X-ray flux map (Fig. 1) shows a single-peaked and irregular morphology inside . The X-ray core is elongated in the NW-SE orientation, and its location matches the peak of the radio halo. Unlike some other typical binary on-axis merging systems with double relics, for example Abell 3376 (Bagchi et al. 2006), ZwCl 0008.8+5215 (Di Gennaro et al. 2019), and El Gordo (Menanteau et al. 2012), the morphology of this cluster does not show an outbound subcluster, perhaps indicating a later merger phase.
Previous work shows that the presence of a radio halo is related to the dynamical state of a cluster, which can be quantified by X-ray morphological parameters (Cassano et al. 2010). Following the methods in Cassano et al. (2010), we calculate the centroid shift (Mohr et al. 1993; Poole et al. 2006) and the concentration parameter (Santos et al. 2008). The result is located in the quadrant where most of the clusters host a radio halo (see Fig. 1 in Cassano et al. 2010).
 |
 |
 |
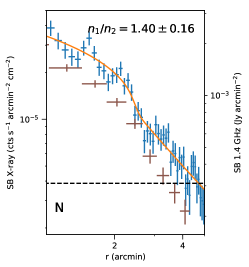
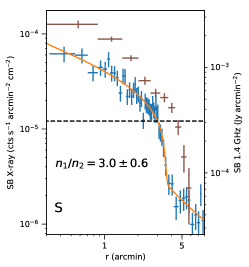
In addition, we find two X-ray surface brightness discontinuities about 460 kpc and 680 kpc toward the north and south of the core (see Fig. 1). We extract and fit the surface brightness profiles assuming an underlying spherically projected double power-law density model (Owers et al. 2009). To account for a possible mismatch between the extraction regions and the actual curvature of the edge, we smooth the projected model profile with a Gaussian kernel. The cosmic X-ray background is modeled as a constant count s-1 arcmin-2 cm-2, obtained by fitting the azimuthally averaged radial surface brightness profile using a double -model (Cavaliere & Fusco-Femiano 1976) plus a constant model.
The profiles and best-fit models are plotted in Fig. 3. The best-fit density jump of the southern and northern edges are and , respectively. We also overplot the VLA -band D configuration (Brown et al. 2011) radio surface brightness profiles. In the northern region the slope of the radio surface brightness profile changes from to at the radius of 400 kpc. The southern region shows a marked X-ray jump that is, however, misaligned with a steep drop-off in the radio brightness profile, which occurs kpc farther out. This sharp drop is unlikely due to the flux loss in interferometric observations. The largest angular scale of D configuration is . Only emission that is smooth on scales is subject to significant flux loss (on the order of or greater, Brown et al. 2011), while the features discussed here are on much smaller scales.
The thermodynamic properties of these edges are still unclear due to the short exposure time; however, for the southern edge to be a cold front, the temperature on the faint side would have to be very high, keV. If either of the two edges is confirmed as a shock front, this cluster could be another rare case where the X-ray shock is associated with the edge of a radio halo, for example Abell 520 (Hoang et al. 2019), the Bullet Cluster (Shimwell et al. 2014), the Coma Cluster (Brown & Rudnick 2011; Planck Collaboration et al. 2013), and the Toothbrush Cluster (van Weeren et al. 2016).
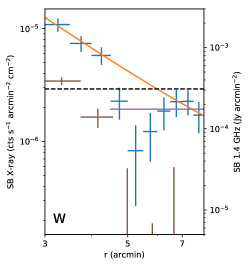
Apart from the two surface brightness discontinuities, we also find a large scale X-ray channel in the southwestern part of the cluster (the dashed region in Fig. 1). The length is at least 700 kpc and the width can be over 200 kpc. We use a single power-law density model to fit this profile, where we ignore the data points from 4.5 to 6 arcmin. The lowest point is below the power-law model by . Alternatively, the large difference between and can be interpreted as a surface brightness edge, with the channel being right outside the edge. In this case, if we use a constant model to fit the data points from 4.5 to 8 arcmin excepting the dip, the lowest point is below the model. The density in the channel region is of the power-law model and is of the constant model. The radio surface brightness also decreases sharply before the channel. Inside the channel, the upper limit of the radio emission is Jy arcmin-2.
4 Discussion
4.1 Radio halo scaling relations
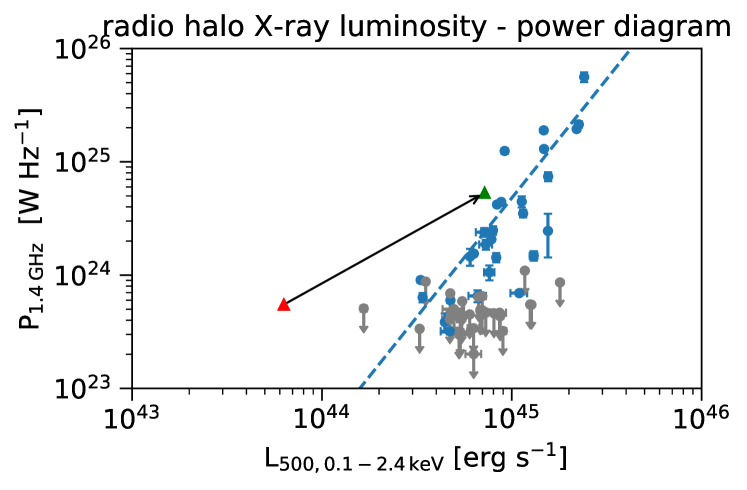
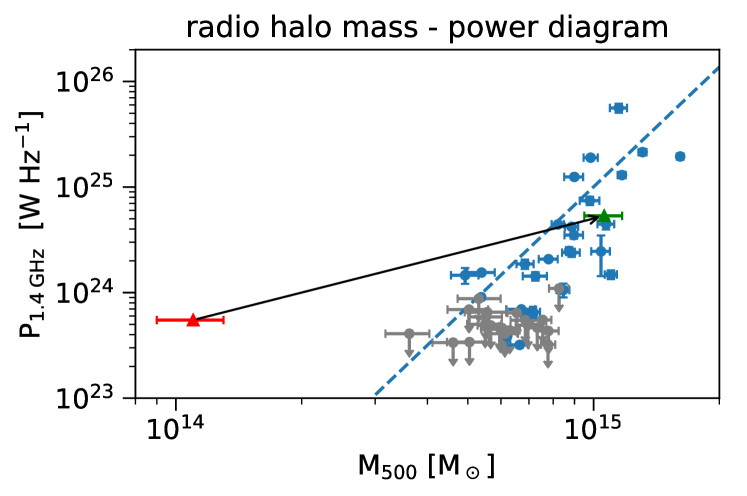
This cluster was believed to be an X-ray underluminous or a radio overluminous source in the radio halo diagram (Brown et al. 2011). Meanwhile, using the scaling relation (Pratt et al. 2009), Bonafede et al. (2017) found this object to be an outlier in the relation. The new redshift reported here leads to an updated 1.4 GHz radio power of W Hz-1 and an X-ray luminosity inside of erg s-1, bringing this cluster into agreement with the expected radio halo relationship. Furthermore, using the – scaling relation of Arnaud et al. (2007) we obtain . This cluster then also follows the scaling relation (Cassano et al. 2013) (see Fig. 4). The Sunyaev-Zeldovich (SZ) effect of such a massive cluster should be detected by Planck. However, due to its low Galactic latitude, it is not in the second Planck SZ catalog (Planck Collaboration et al. 2016).
The remaining two outliers on the scaling relation are Abell 1213 and Abell 523. In Abell 1213, the diffuse emission is on scales of only 200 kpc and is dominated by bright filamentary structures (Giovannini et al. 2009). Abell 523 has a unique linear structure unlike other radio halos (Giovannini et al. 2011). With the results presented here, there may thus be no known regular radio halo that does not follow these scaling relations.
4.2 Western X-ray channel
We observe an X-ray deficit in the western part of the cluster, where the gas density is about half of that in the inner region. This channel-like structure can be a compressed heated region between the main cluster and an in-falling group, as has been seen in Abell 85, for example (Ichinohe et al. 2015), or between colliding subclusters (e.g., Abell 521; Bourdin et al. 2013). Although no significant X-ray substructure is seen outside the channel in ClG 0217+70, an infalling group that has been stripped of its gas content early during the merger could still produce the observed feature.
Alternatively, non-thermal pressure, either in the form of turbulent motions or enhanced magnetic fields that push out the thermal gas, may play a role. This explanation has been proposed for similar substructures observed along a cold front in the Virgo Cluster (Werner et al. 2016), and in Abell 520 (Wang et al. 2016) and Abell 2142 (Wang & Markevitch 2018). Assuming the ICM is isothermal across the channel, to compensate the pressure deficit of at least 35%, the non-thermal pressure should be equal to the thermal pressure. If the magnetic field enhancement is alone responsible for this non-thermal pressure, G is required and the corresponding thermal-to-magnetic pressure ratio reaches . Such a considerable local magnetic field enhancement is indeed seen in MHD simulations of sloshing cold fronts (ZuHone et al. 2011). One might expect that this high magnetic field would lead to a detectable level of radio emission in the channel, which is disfavored by the current VLA observation. However, since the exact underlying relativistic electron distribution is unknown, this scenario cannot be ruled out. If on the other hand the non-thermal pressure is entirely due to turbulent motions, the turbulent Mach number (Werner et al. 2009) should be close to one, which is also very unlikely. In reality of course a combination of all the above factors is also possible.
4.3 Possible merging scenario
The western relic candidate C as well as the eastern relic candidates E, F, and G are likely to be accelerated by two spherical shocks that are centrally symmetric and moving towards NW and SE, respectively. The two spherical shocks are presumably created by the first core passage and then propagate to the outskirts of this system. The two discovered surface brightness jumps are in the N-S orientation, which is almost perpendicular to the previous merging axis. Additionally, the projected distance between the cluster center and the two surface brightness discontinuities is kpc, which is much less than the of the outermost relics. Both the orientation and the short of the surface brightness discontinuities suggest that they are not related to the first core passage event. A possible explanation of this merger might be that it starts as an off-axis merger, after which the two (or more) dark matter halos, as well as the ionized gas, move back to the centroid of the system. The collision of the ICM produces new shocks or cold fronts, but the orientation is different from the first passage.
5 Conclusion
We analyzed the 25 ks archival Chandra data of the merging galaxy cluster ClG 0217+70. The Chandra X-ray data allow us to measure the redshift of the system, which is . With the updated redshift, the projected physical sizes of the radio halo and radio relic candidates make them some of the largest sources ever discovered. Most of the radio relic candidates have projected distances . We measure the averaged temperature inside as keV. Using the scaling relation, we estimate . The centroid shift and the concentration parameter show that the ICM is still dynamically disturbed. Two surface brightness discontinuities are detected with density jumps of in the north and in the south. The southern edge has one of the largest density jumps ever detected in galaxy clusters. We also find a 700 kpc long and kpc wide surface brightness channel in the western part of the cluster, which may be indicative of significant compressed heated gas or non-thermal pressure from magnetic fields or turbulence.
In this work, X-ray spectroscopy shows its power of measuring the ICM redshift directly. Its strength will be remarkably exploited in future missions with X-ray microcalorimeters, for example XRISM and Athena.
Acknowledgements.
We thank the anonymous referee for helpful suggestions. The reproduction package of this research is openly available from Zenodo at 10.5281/zenodo.4032424. X.Z. acknowledges support from China Scholarship Council. SRON is supported financially by NWO, The Netherlands Organisation for Scientific Research. D.N.H. and C.S. acknowledges support from the ERC-StG DRANOEL, n. 714245. R.J.vW. acknowledges support from the VIDI research programme with project number 639.042.729, which is financed by the Netherlands Organisation for Scientific Research (NWO). Partial support for L.R. comes from US National Science Foundation grant AST17-14205 to the University of Minnesota. This research has made use of data obtained from the Chandra Data Archive and the Chandra Source Catalog, and software provided by the Chandra X-ray Center (CXC) in the application package CIAO.References
- Arnaud et al. (2007) Arnaud, M., Pointecouteau, E., & Pratt, G. W. 2007, A&A, 474, L37
- Bagchi et al. (2006) Bagchi, J., Durret, F., Neto, G. B. L., & Paul, S. 2006, Science, 314, 791
- Bonafede et al. (2017) Bonafede, A., Cassano, R., Brüggen, M., et al. 2017, MNRAS, 470, 3465
- Bonafede et al. (2014) Bonafede, A., Intema, H. T., Brüggen, M., et al. 2014, ApJ, 785, 1
- Bourdin et al. (2013) Bourdin, H., Mazzotta, P., Markevitch, M., Giacintucci, S., & Brunetti, G. 2013, ApJ, 764, 82
- Brown et al. (2011) Brown, S., Duesterhoeft, J., & Rudnick, L. 2011, ApJ, 727, L25
- Brown & Rudnick (2011) Brown, S. & Rudnick, L. 2011, MNRAS, 412, 2
- Brunetti et al. (2009) Brunetti, G., Cassano, R., Dolag, K., & Setti, G. 2009, A&A, 507, 661
- Brunetti & Jones (2014) Brunetti, G. & Jones, T. W. 2014, International Journal of Modern Physics D, 23, 1430007
- Cash (1979) Cash, W. 1979, ApJ, 228, 939
- Cassano et al. (2013) Cassano, R., Ettori, S., Brunetti, G., et al. 2013, ApJ, 777, 141
- Cassano et al. (2010) Cassano, R., Ettori, S., Giacintucci, S., et al. 2010, ApJ, 721, L82
- Cavaliere & Fusco-Femiano (1976) Cavaliere, A. & Fusco-Femiano, R. 1976, A&A, 500, 95
- Cuciti et al. (2018) Cuciti, V., Brunetti, G., van Weeren, R., et al. 2018, A&A, 609, A61
- de Gasperin et al. (2014) de Gasperin, F., van Weeren, R. J., Brüggen, M., et al. 2014, MNRAS, 444, 3130
- Di Gennaro et al. (2019) Di Gennaro, G., van Weeren, R. J., Andrade-Santos, F., et al. 2019, ApJ, 873, 64
- Feretti et al. (2012) Feretti, L., Giovannini, G., Govoni, F., & Murgia, M. 2012, A&A Rev., 20, 54
- Giovannini et al. (2009) Giovannini, G., Bonafede, A., Feretti, L., et al. 2009, A&A, 507, 1257
- Giovannini et al. (2011) Giovannini, G., Feretti, L., Girardi, M., et al. 2011, A&A, 530, L5
- Hales et al. (1995) Hales, S. E. G., Waldram, E. M., Rees, N., & Warner, P. J. 1995, MNRAS, 274, 447
- Henry et al. (2009) Henry, J. P., Evrard, A. E., Hoekstra, H., Babul, A., & Mahdavi, A. 2009, ApJ, 691, 1307
- Hoang et al. (2019) Hoang, D. N., Shimwell, T. W., van Weeren, R. J., et al. 2019, A&A, 622, A20
- Ichinohe et al. (2015) Ichinohe, Y., Werner, N., Simionescu, A., et al. 2015, MNRAS, 448, 2971
- Kaastra & Bleeker (2016) Kaastra, J. S. & Bleeker, J. A. M. 2016, A&A, 587, A151
- Kaastra et al. (1996) Kaastra, J. S., Mewe, R., & Nieuwenhuijzen, H. 1996, in UV and X-ray Spectroscopy of Astrophysical and Laboratory Plasmas, 411–414
- Kaastra et al. (2018) Kaastra, J. S., Raassen, A. J. J., de Plaa, J., & Gu, L. 2018, SPEX X-ray spectral fitting package. Zenodo. https://doi.org/10.5281/zenodo.2419563
- Kale et al. (2015) Kale, R., Venturi, T., Giacintucci, S., et al. 2015, A&A, 579, A92
- Lodders et al. (2009) Lodders, K., Palme, H., & Gail, H.-P. 2009, 4.4 Abundances of the elements in the Solar System: Datasheet from Landolt-Börnstein - Group VI Astronomy and Astrophysics · Volume 4B: “Solar System” in SpringerMaterials (https://doi.org/10.1007/978-3-540-88055-4_34)
- Menanteau et al. (2012) Menanteau, F., Hughes, J. P., Sifón, C., et al. 2012, ApJ, 748, 7
- Mohr et al. (1993) Mohr, J. J., Fabricant, D. G., & Geller, M. J. 1993, ApJ, 413, 492
- Owers et al. (2009) Owers, M. S., Nulsen, P. E. J., Couch, W. J., & Markevitch, M. 2009, ApJ, 704, 1349
- Planck Collaboration et al. (2013) Planck Collaboration, Ade, P. A. R., Aghanim, N., et al. 2013, A&A, 554, A140
- Planck Collaboration et al. (2016) Planck Collaboration, Ade, P. A. R., Aghanim, N., et al. 2016, A&A, 594, A27
- Poole et al. (2006) Poole, G. B., Fardal, M. A., Babul, A., et al. 2006, MNRAS, 373, 881
- Pratt et al. (2009) Pratt, G. W., Croston, J. H., Arnaud, M., & Böhringer, H. 2009, A&A, 498, 361
- Reiprich et al. (2013) Reiprich, T. H., Basu, K., Ettori, S., et al. 2013, Space Sci. Rev., 177, 195
- Rengelink et al. (1997) Rengelink, R. B., Tang, Y., de Bruyn, A. G., et al. 1997, A&AS, 124, 259
- Rudnick et al. (2006) Rudnick, L., Delain, K. M., & Lemmerman, J. A. 2006, Astronomische Nachrichten, 327, 549
- Santos et al. (2008) Santos, J. S., Rosati, P., Tozzi, P., et al. 2008, A&A, 483, 35
- Shimwell et al. (2014) Shimwell, T. W., Brown, S., Feain, I. J., et al. 2014, MNRAS, 440, 2901
- van Weeren et al. (2016) van Weeren, R. J., Brunetti, G., Brüggen, M., et al. 2016, ApJ, 818, 204
- van Weeren et al. (2019) van Weeren, R. J., de Gasperin, F., Akamatsu, H., et al. 2019, Space Sci. Rev., 215, 16
- Wang & Markevitch (2018) Wang, Q. H. S. & Markevitch, M. 2018, ApJ, 868, 45
- Wang et al. (2016) Wang, Q. H. S., Markevitch, M., & Giacintucci, S. 2016, ApJ, 833, 99
- Wen et al. (2012) Wen, Z. L., Han, J. L., & Liu, F. S. 2012, ApJS, 199, 34
- Werner et al. (2009) Werner, N., Zhuravleva, I., Churazov, E., et al. 2009, MNRAS, 398, 23
- Werner et al. (2016) Werner, N., ZuHone, J. A., Zhuravleva, I., et al. 2016, MNRAS, 455, 846
- Willingale et al. (2013) Willingale, R., Starling, R. L. C., Beardmore, A. P., Tanvir, N. R., & O’Brien, P. T. 2013, MNRAS, 431, 394
- Yu et al. (2011) Yu, H., Tozzi, P., Borgani, S., Rosati, P., & Zhu, Z. H. 2011, A&A, 529, A65
- Zhang et al. (2019) Zhang, C., Churazov, E., Forman, W. R., & Lyskova, N. 2019, MNRAS, 488, 5259
- ZuHone et al. (2011) ZuHone, J. A., Markevitch, M., & Lee, D. 2011, ApJ, 743, 16