generalglossnamefontemph \glssetcategoryattributegeneraltextformatemph \glssetcategoryattributeacronymglossnamefontemph \glssetcategoryattributecomponenttextformattextbf \glssetcategoryattributedata_structuretextformatemph \newabbreviationnlpNLPnatural language processing \newabbreviationaiAIartificial intelligence \newabbreviationposPOSpart-of-speech \newabbreviationjsonJSONJavaScript Object Notation \newabbreviationmlMLmachine learning \newabbreviationiaaIAAinter-annotator agreement \newabbreviationcovidCOVID-19Coronavirus disease 2019 \newabbreviationwntracWNTRACWorldwide Non-pharmaceutical Interventions Tracker for COVID-19 \newabbreviationnpiNPInon-pharmaceutical intervention \newabbreviationlstmLSTMlong short-term memory \newabbreviationrnnRNNrecurrent neural network \newabbreviationcnnCNNconvolutional neural network \newabbreviationgruGRUgated recurrent unit \newabbreviationbertBERTBidirectional Encoder Representations from Transformers \newabbreviationoxcgrtOxCGRTOxford COVID-19 Government Response Tracker
: AI Assisted Tracking of Non-pharmaceutical Interventions Implemented Worldwide for
Abstract
The global pandemic has transformed almost every facet of human society throughout the world. Against an emerging, highly transmissible disease with no definitive treatment or vaccine, governments worldwide have implemented to slow the spread of the virus. Examples of such interventions include community actions (e.g. school closures, restrictions on mass gatherings), individual actions (e.g. mask wearing, self-quarantine), and environmental actions (e.g. public facility cleaning). We present the , a comprehensive dataset consisting of over 6,000 implemented worldwide since the start of the pandemic. covers implemented across 261 countries and territories, and classifies measures into a taxonomy of sixteen types. measures are automatically extracted daily from Wikipedia articles using natural language processing techniques and manually validated to ensure accuracy and veracity. We hope that the dataset is valuable for policymakers, public health leaders, and researchers in modeling and analysis efforts for controlling the spread of .
Background & Summary
The pandemic has made an unprecedented impact on almost every facet of human civilization from healthcare systems, to economies and governments worldwide. As of August 2020, every country in the world has been affected, with more than 24M confirmed cases of infection and death toll approaching a million cases worldwide [jhu, who, worldometer]. The pandemic has triggered a wide range of responses across the world. With therapeutic and preventive interventions still in early stages of development, every country has resorted to as a primary strategy [c19hcc, ferguson2020report] for disease control. Examples of such interventions include community actions (e.g. school closures, restrictions on mass gatherings), individual actions (e.g. mask wearing, self-quarantine), and environmental actions (e.g. public facility cleaning). Such vary significantly in their implementation based on the maturity of the health infrastructure, robustness of the economy and cultural values unique to the region.
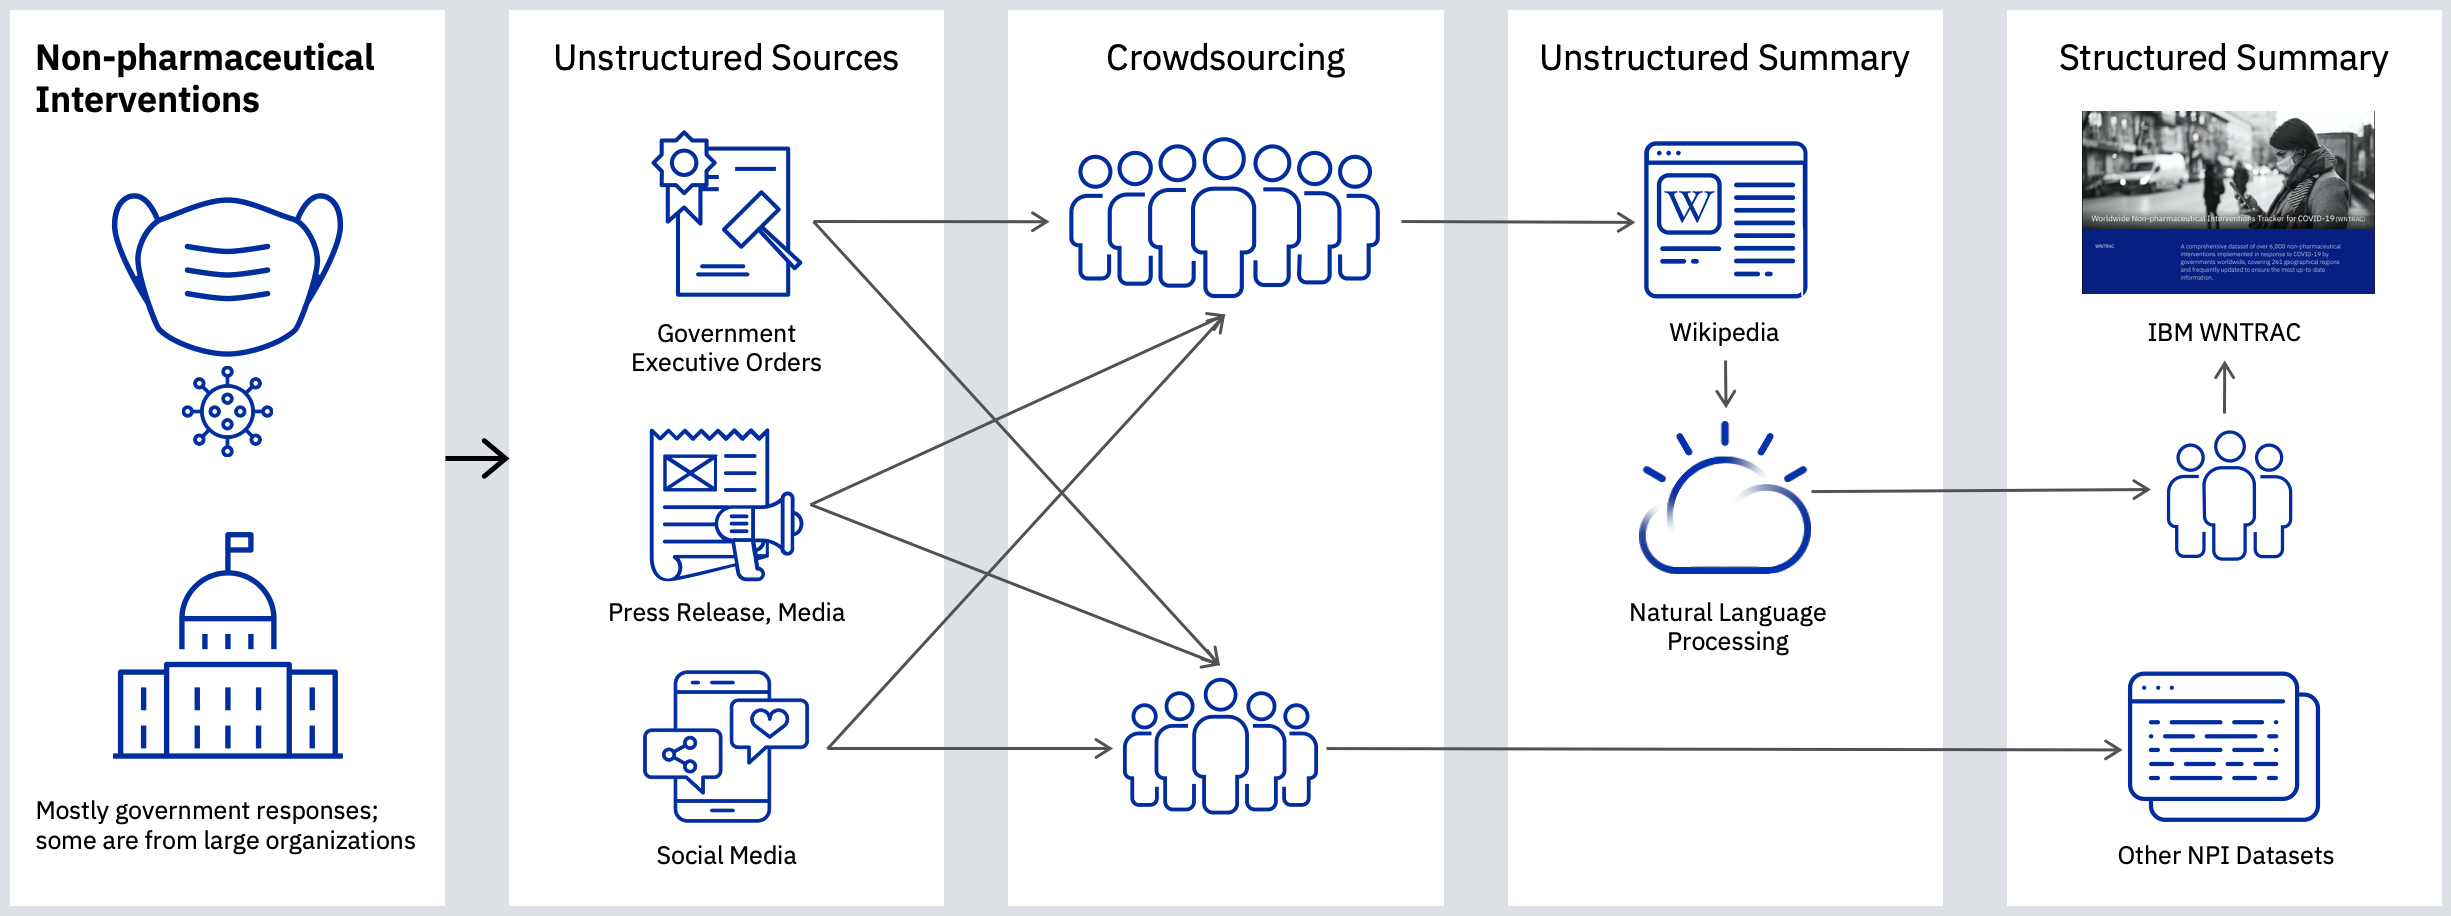
Public health policy makers worldwide are striving to introduce successful intervention plans to manage the spread of disease while balancing the socio-economic impacts [coibion2020cost, lancet2020india]. These initiatives will benefit from modeling the efficacy of different intervention strategies. The pandemic has sparked an ongoing surge of discovery and information sharing resulting in an unprecedented amount of data being published online [Wang2020CORD19TC]. This includes information about measures, which are available in a wide variety of unstructured data sources, including official government websites [us-chamber-of-commerce, us-csg], press releases, social media, and news articles. However such modeling requires the information about the to be available in a structured form.
To address this urgent need, several data collection initiatives have emerged in the recent months resulting in several publicly available datasets with varying degrees of coverage, data freshness, and sparsity. For example, the CoronaNet dataset [CoronaNet] contains the monadic and dyadic data on policy actions taken by governments across the world, manually curated by over 500 researchers covering sixteen types and is kept fairly up-to-date. The Complexity Science Hub, Vienna enlisted researchers, students and volunteers to curate the Complexity Science Hub COVID-19 Control Strategies List [Desvars-Larrive2020] dataset, of eight different types but covering only 57 countries. Similarly, the Oxford Government Response Tracker [hale2020oxford] dataset, takes a crowd-sourcing approach and covers 17 types, 186 regions, 52 US states and territories. Because all these datasets are assembled manually, each of them is constrained in one or more respects: geographical scope, taxonomic richness, frequency of updates or granularity of details, and evidential sources. An AI-assisted, semi-automated data collection approach, driven by a rich, extensible taxonomy, can help overcome these issues and may result in a larger, frequently updated dataset with less manual labor.
Wikipedia is one of the main sources of accessible information on the Internet. Since the start of , a dedicated global network of volunteers has been creating, updating, and translating Wikipedia articles with vital information about the pandemic [wiki-covid]. Over 5,000 new Wikipedia pages on have been written by more than 71,000 volunteers since the onset of the pandemic accumulating more than 440M page views by June 2020. Wikipedia articles, even though crowd-sourced, through the process of collective validation [jessen2012aggregated] and by citations of credible sources such as government websites, scientific literature, and news articles can serve as a reliable source of data. Further, these Wikipedia articles are constantly updated; have been edited more than 793,000 times as of August 2020 making it both a rich and up-to-date source. Based on this, we postulated that an approach based on automated information extraction from Wikipedia, followed by human validation to ensure accuracy and veracity, would result in a frequently updated dataset with a wider coverage compared to any of the existing datasets. We present the result of our work, , a comprehensive dataset consisting of over 6,000 implemented worldwide since the start of the pandemic. covers implemented across 261 countries and territories, and classifies measures into a taxonomy of sixteen categories. measures are automatically extracted daily from Wikipedia articles using techniques and manually validated to ensure accuracy and veracity.
In what follows, we explain the methods used to create the dataset, outline the challenges and key design choices, describe the format, provide an assessment of its quality and lay out our vision of how this dataset can be used by policy makers, public health leaders, and data scientists and researchers to support modeling and analysis efforts.
Methods
We built a semi-automated system to construct the dataset and keep it current. The measures are modeled as events and evidences for information extraction purposes. This is illustrated by a motivating example shown in the Figure 2. Each event corresponds to an imposition or lifting of a particular . An event is defined to be a 5-tuple (what, value, where, when, restriction), where
-
1.
What: the type of that was imposed or lifted. are grouped into sixteen major types. In the example, the type is school closure.
-
2.
Value: sub-category or attribute that further qualifies the type more specifically. In the example, the associated value is all schools closed. A detailed description of each type and the corresponding possible values is shown in Table LABEL:tab:taxonomy.
-
3.
Where: the region (country, territory, province, or state) in which the measure has been implemented or withdrawn. In this example, there are three distinct regions, namely, Punjab, Chhattisgarh, Manipur that are identified and three separate events will be extracted.
-
4.
When: The date from which the was imposed or lifted. In the example, the date will be 13 March, corresponding to the implementation of the , even if a likely date for the cancellation of the , 31 March, is indicated.
-
5.
Restriction: a flag indicating that the event corresponds to the introduction or withdrawal of the . It should be noted that the lifting of the is treated as a separate event. In the example, the restriction type is imposed.
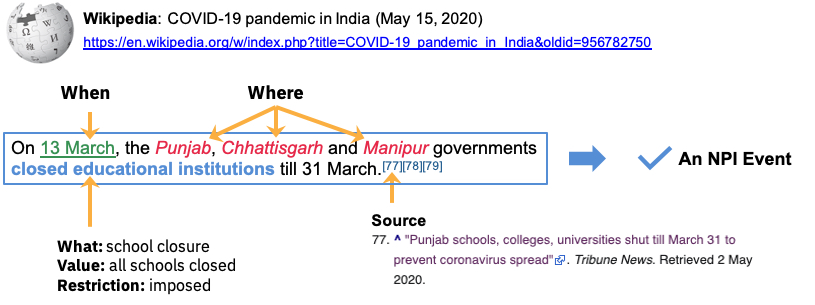
In addition to the mandatory fields described above, event contains one or more evidences. An evidence is a span of text extracted from Wikipedia that discusses a particular event. In the example, On 13 March, the Punjab, Chhattisgarh, and Manipur governments declared holidays in all schools and colleges till 31 March. is the evidence. An evidence may support more than one event. Each evidence is accompanied by a source type indicating the type of source of Wikipedia citation. More details about such additional attributes can be found in the data records section.
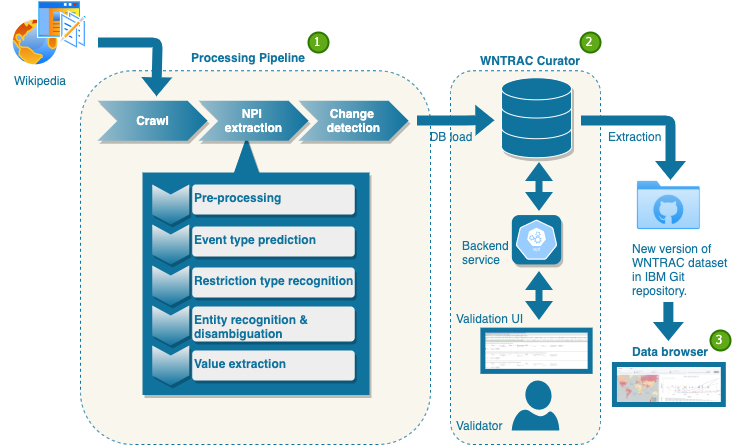
The system, shown in the Figure 3, is designed to be scalable for continuous gathering, extraction and validation of events. It consists of three subsystems: a data processing pipeline for capturing and extracting potential events from Wikipedia articles, a tool called Curator for human validation of events automatically extracted using the aforementioned pipeline and a data browser for visualizing the data. In the next section, we describe the system and its components at a high level, focusing on key design choices that have a bearing on the quality of the dataset, starting with a brief description of the data collection.
| Example | Value | Value description | |
|
changes in
prison-related policies |
On March 30, the GNA announced the release of 466 detainees in Tripoli, as part of an effort to stop the spread of the virus in prisons. | Integer | Number of prisoners that were released |
| confinement | On 19 March, President Alberto Fernández announced a mandatory lockdown to curb the spread of coronavirus. | Category | 1. Mandatory/advised for all the population 2. Mandatory/advised for people at risk |
| contact tracing | On 2 March, a case in Nimes was traced to the mid-February Mulhouse Megachurch event. | Category | 1. Tracing back 14 days of contacts of a confirmed patient through electronic information 2. Tracing contacts of a person who needs to be isolated as was in contact with a confirmed patient through electronic information |
| domestic flight restriction | On 1 April, the Government of Afghanistan suspended flights between Kabul and Herat. | String | Name of the state where the passenger is arriving from |
| economic impact | Up until 14 March, the Afghan government had spent $25 million to tackle the outbreak, which included $7 million of aid packages. | Category | 1. Stock market 2. Unemployment rate 3. Industrial production |
|
entertainment /
cultural sector closure |
On April 7, Rockland and Sullivan counties closed their parks. | Category | 1. Bars, restaurants, night clubs 2. Museums, theaters, cinema, libraries, festivities 3. Parks and public gardens 4. Gyms and pools 5. Churches |
|
freedom of movement
(nationality dependent) |
Iran was added to the list of countries whose nationals were suspended entry to Cambodia, making a total of six. | String | Name of the country the citizen is from |
|
international
flight restrictions |
With effect from midnight on 1 April, Cuba suspended the arrival of all international flights. | String | Name of the country or state where the passenger is arriving from |
|
introduction of
travel quarantine policies |
Israeli nationals returning from Egypt were required to enter an immediate 14-day quarantine. | String | Name of the country or state where the passenger travelled from |
| mask wearing | On April 15, Cuomo signed an executive order requiring all New York State residents to wear face masks or coverings in public places. | Category | 1. Mandatory 2. Mandatory in some public spaces 3. Recommended |
| mass gatherings | On 13 March, it was announced at an official press conference that a four-week ban on public gatherings of more than 100 persons would be put into effect as of Monday 16 March. | Integer | Maximum number of people in social gatherings allowed by the government |
| public services closure | On 19 March, Election Commissioner Mahinda Deshapriya revealed that the 2020 Sri Lankan parliamentary election will be postponed indefinitely until further notice due to the coronavirus pandemic. | Category | 1. Government/parliament system closed 2. Legal system closed |
| public transportation | On March 20, Regina Transit and Saskatoon Transit suspended fares for all bus service, but with reduced service. | Category | 1. Partial cancellation of routes/stops during the week/weekend 2. Total cancellation of transport (special case for some states in China) |
| school closure | On 13 March, the Punjab and Chhattisgarh governments declared holidays in all schools and colleges till 31 March. | Category | 1. All schools (general) closed 2. Only kindergartens/daycare closed 3. Only schools (primary/secondary) closed 4. Universities closed |
|
state of emergency
(legal impact) |
Governor Charlie Baker declared a state of emergency for the state of Massachusetts on March 10. | Category | 1. National guard joins the law enforcement 2. Army joins the law enforcement |
| work restrictions | On 10 April, Koike announced closure requests for six categories of businesses in Tokyo. | Category | 1. Suggestion to work from home for non-essential workers 2. Mandatory work from home enforcement for non-essential workers |
Data Collection
As stated earlier, Wikipedia includes a broad range of articles on covering a variety of topics, including the cause, transmission, diagnosis, prevention, management, economic impact, and national responses. Categories are used in Wikipedia to link articles under a common topic and are found at the bottom of the article page. This dataset was collected by automatically crawling Wikipedia articles discussing in different regions belonging to the category [wiki:catagory] pandemic by country 111For mask wearing type, Wikipedia articles were observed to be incomplete for some regions, so we augmented the dataset with hand-curated list of measures from web sources.. There are 156 subcategories and 198 articles directly under pandemic by country, and when retrieved recursively, there are 384 articles under this top-level category as of July 2020. Considering the limited availability of volunteers, and the volume of measures that had to be validated initially, we restricted the number of articles to a manageable size, covering 261 regions (i.e. countries and territories) as listed in the tables at the end of the paper.
Processing Pipeline
The first step in the data processing is to retrieve the aforementioned list of Wikipedia articles on a periodic basis. The crawler module implements this functionality. It uses the MediaWiki API [wiki-api] for downloading the articles. As part of this step, we extract the text content of each article, while at the same time preserving all the associated citations. This process produces a document for each article. Each sentence in a document is a candidate for extraction. As of August 2020, the aggregate crawled data contains over 55,000 sentences, with an average of 213 sentences per document. The second step in the pipeline is the extraction of the events from a document. It is broken into a sequence of steps described below.
-
•
Pre-processing: As the first step in processing a document, we use sentence boundary detection algorithms from libraries such as spaCy [honnibal2015improved], to identify where sentences begin and end. Although the sentences are used as logical units to extract events, we preserved the order in which they appear in the source document for reasons detailed below. Also, at this step, we extract and retain the citation URL, if available for each sentence.
-
•
Sentence classification: Next, we classify the sentence into one of the types such as school closure to identify potential events. If no is discussed in the sentence, we classify it as discarded. We use multiple learning algorithms, including logistic regression, Support Vector Machines, and [Devlin_Chang_Lee_Toutanova_2018], and employ an ensemble method to obtain better overall predictive performance. A small subset of the data (1490 sentences), was manually annotated to train the models. Independently, we also categorize the sentence as implying either the introduction or the withdrawal of an (restriction).
-
•
Named entity recognition and named entity disambiguation: After we identify the potential events in the previous step, we extract specific constituent entities for each candidate event from the sentence. We used state-of-the-art named-entity recognizers (such as spaCy [honnibal2015improved]) and normalizers to detect and normalize locations (Where : [Punjab, Chattisgarh, Manipal ]) and time expressions (When : March 13). In addition, we also link the location entities of type ‘GPE’ in the Wikipedia article title to the corresponding ISO codes [wiki:iso-3166-1, wiki:iso-3166-2]. Even though we use the sentence as a logical unit for the extraction of an event, the sentence itself may not include all the relevant information. For example, date or location may be available in sentences in the vicinity or in the header of the paragraph to which the sentence belongs. To address this key challenge, we developed a heuristic-based relation detection algorithm to associate one of the extracted dates or locations from the current document to each sentence.
-
•
Value extraction: The last step in event extraction, is determining the associated value. We use multiple rule-based algorithms that either operate independently or depend on information extracted by the previous steps. For example, given the sentence "On 13 March, it was announced at an official press conference that a four-week ban on public gatherings of more than 100.”, the event type is mass gathering and the associated value is maximum number of people in social-gathering allowed by the government. The value extraction is performed using parse-based rule engines [honnibal2015improved]. It is worth noting that the value extraction components should know the actual type mass gatherings before extracting the correct value "100". Similarly, given a sentence “On 1 April, the Government of USA suspended flights from New York to Texas”, the event type is domestic flight restriction and the associated value is name of the state where the passenger is arriving from. To correctly extract the value, the value extraction needs to know the correct type and normalized locations ("New York") respectively.
Thus, using the above procedure, we extract the unique 5-tuples that are the candidate events. Once extracted, they are presented to the volunteers for validation to ensure data quality. This process is repeated every day. In order to minimize manual labor, considering the small number of volunteers, we attempt to detect changes since the last time we crawled Wikipedia. We use a combination of syntactic similarity metrics such as Levenshtein Norm, and semantic similarity metrics such as event attribute matching to perform this daily change detection for each extracted document.
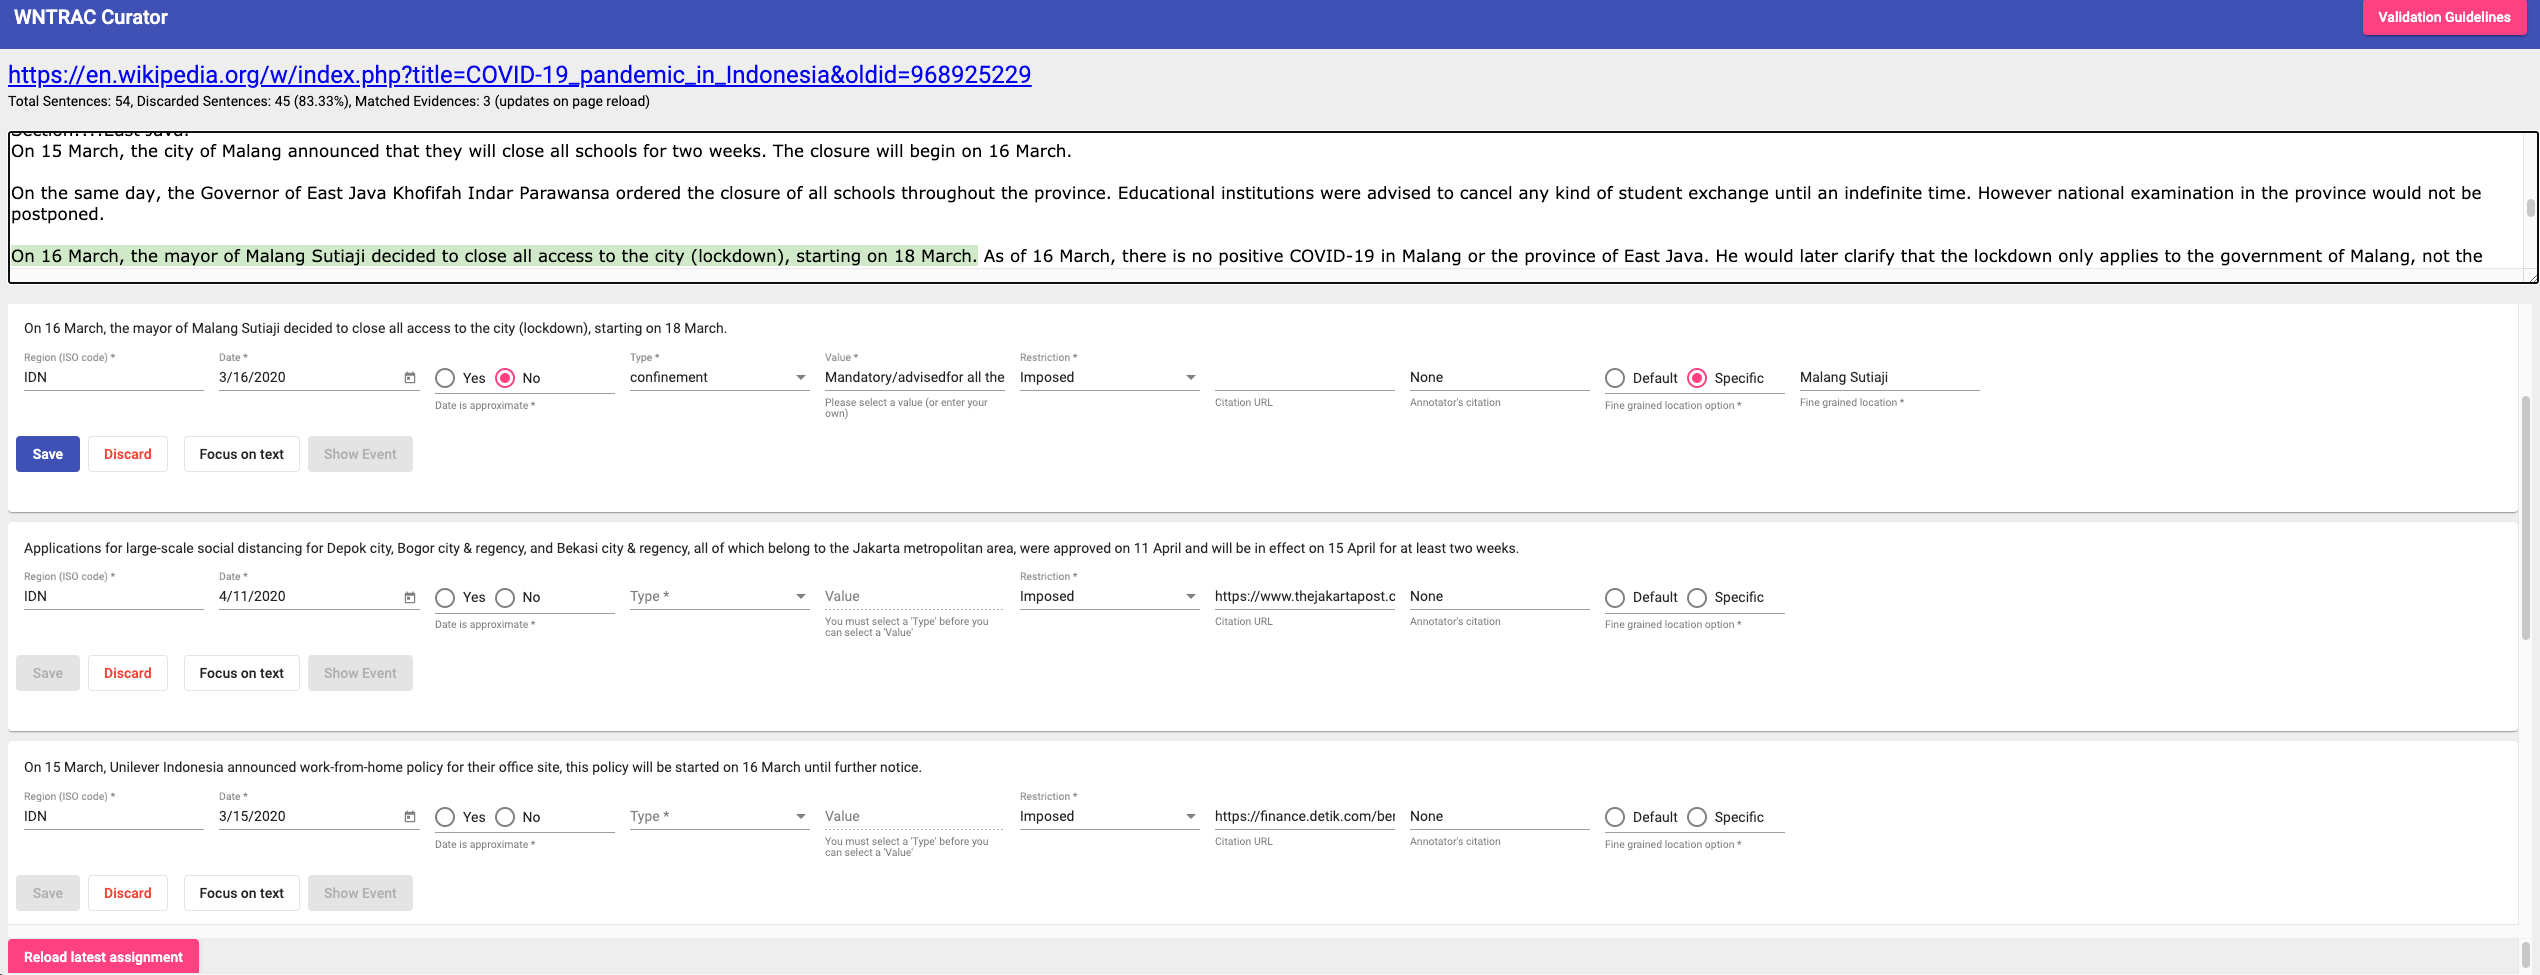
Curator
The events automatically extracted from the pipeline are vetted by volunteers using the Curator validation tool. The tool is a simple web-application backed by a database as shown in Figure 3. The tool is shown in Figure 4. At the top, it displays the complete Wikipedia document extracted by the processing pipeline. Below the document, each candidate event is shown to the volunteer in separate cards. The volunteer can adjudge the candidate event to be a brand new event or an evidence to an existing event or discard the candidate. They can also correct any of the attributes associated with the event extracted by the pipeline.
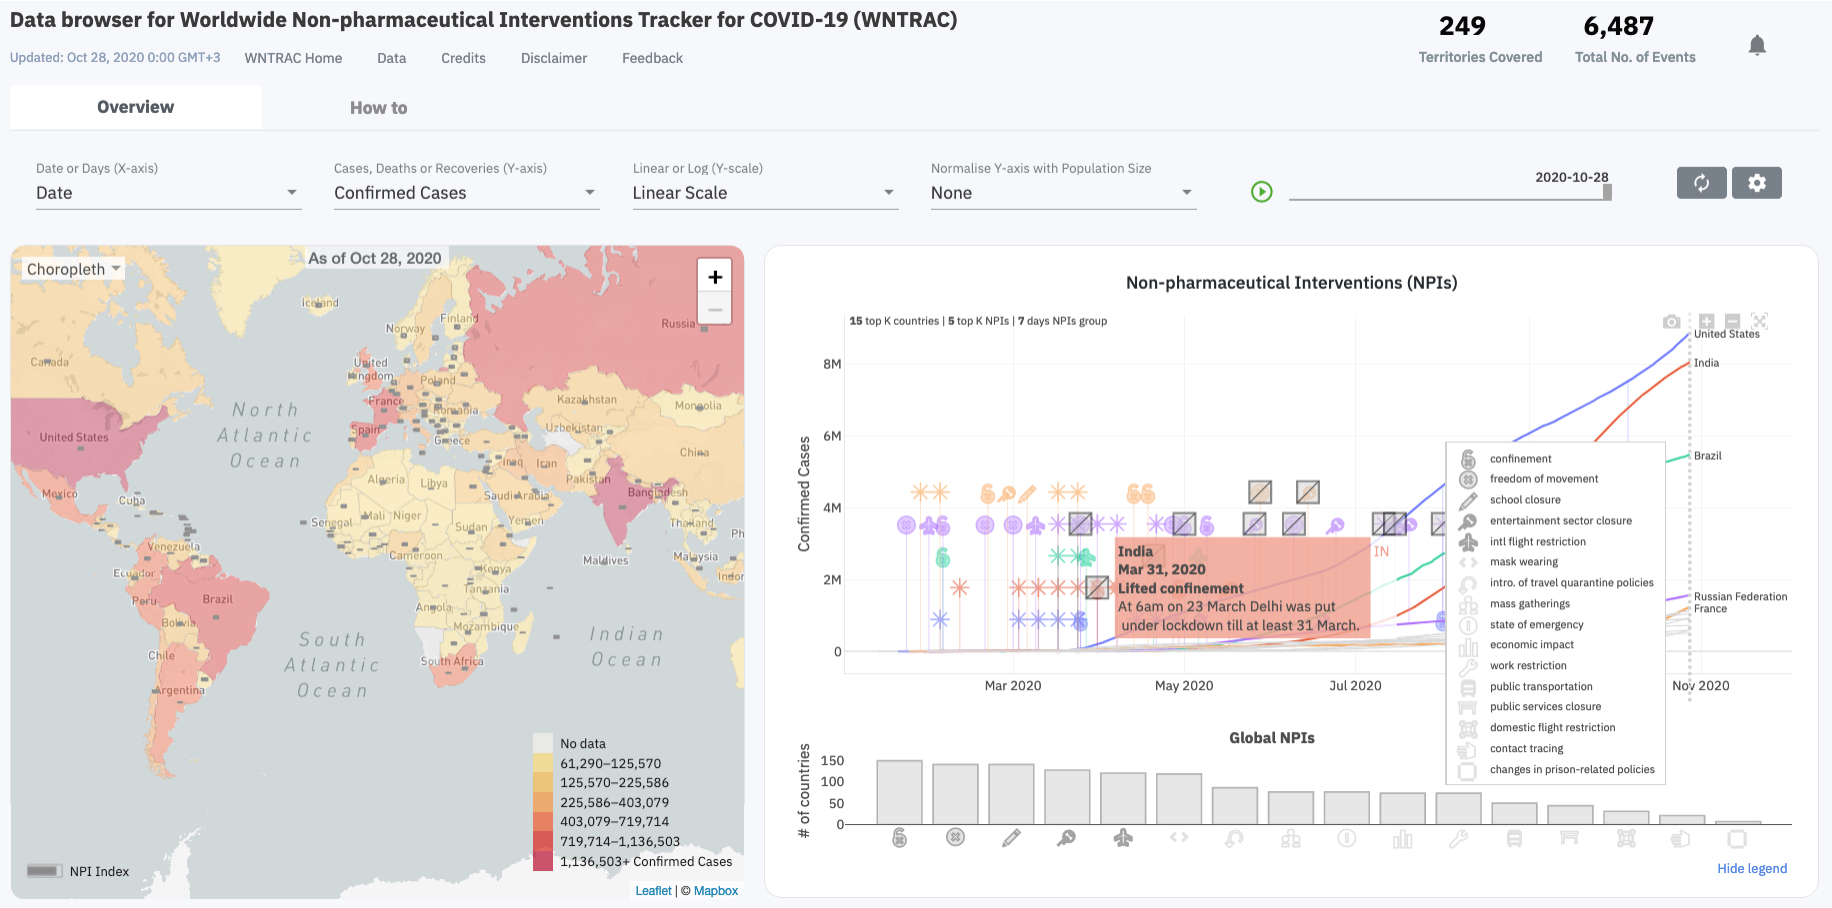
Data Browser
Figure 5 presents an interactive data browser [data-browser] that uses a chart, map, and histogram to provide a descriptive analyses of and outcomes such as confirmed cases and deaths. The browser has a control panel used to filter the data being visualized (e.g cases vs deaths), as well as how it is visualized (e.g. linear vs log scale). A play slider can be used to view the temporal evolution of