XMM-Newton study of X-ray sources in the field of Willman 1 dwarf spheroidal galaxy ††thanks: Based on observations obtained with XMM-Newton, an ESA science mission with instruments and contributions directly funded by ESA Member States and NASA.
Abstract
We present the results of the analysis of three XMM-Newton observations of the Willman 1 dwarf spheroidal galaxy (Wil 1). X-ray sources are classified on the basis of spectral analysis, hardness ratios, X-ray-to-optical flux ratio, X-ray variability, plus cross-correlation with available catalogues in optical and infrared wavelengths. We catalogued 97 sources in the field of Wil 1. Our classification shows the presence of a -type symbiotic star in Wil 1. We classified one M dwarf foreground star in the field of Wil 1. Moreover, fifty-four sources are classified as background AGNs and galaxies. Our study shows that the luminosity of the X-ray sources of Wil 1 does not exceed erg s-1 in the energy range of 0.2–12.0 keV, which is similar to observed luminosities of sources in nearby dwarf spheroidal galaxies.
keywords:
Binaries: symbiotic – X-rays: binaries – galaxies:dwarf galaxies1 Introduction
So far, about thirty dwarf galaxies have been discovered around the Milky Way, with the majority of them being dwarf spheroidal galaxies (dSphs) (e.g, McConnachie, 2012). Studies show that almost all nearby dSphs have an old stellar population, mainly late-type stars with low metallicities (e.g, Weisz
et al., 2014; Tolstoy
et al., 2009). These properties make them ideal targets to study the early stages of galaxy evolution. In X-rays, the population of nearby dSphs has been poorly studied so far in comparison to other types of nearby galaxies (Fabbiano, 2006). The close distance of dSphs together with the low absorption towards most of them give us a unique opportunity to search for the population of soft and low-luminosity (< erg s-1) X-ray sources, which are not detectable in distant nearby galaxies. Based on the very old stellar population of dSphs, theoretical models suggest that the presence of persistently bright X-ray binaries is rather unlikely in these galaxies (see e.g, Maccarone et al., 2005). In recent studies no X-ray binary was confirmed in dwarf galaxies (e.g, Manni
et al., 2014; Arnason et al., 2019; Saeedi
et al., 2016). However, some studies show the presence of low luminosity X-ray sources in these galaxies (Saeedi
et al., 2016; Ramsay &
Wu, 2006). Our deep study using the XMM-Newton observations confirmed the presence of four symbiotic stars in the Draco dSph (Saeedi et al., 2019). This result shows that in comparison to the X-ray binaries, the presence of accreting white dwarfs is more probable in dSphs, due to the similar time scale of the age of the galaxies and that of the formation of white dwarfs from late-type stars, which are the main population of dSph. Among the different types of accreting white dwarfs (Mukai, 2017), the symbiotic stars (i.e, accreting white dwarf or neutron star with a red giant companion) seem to be more likely to be detected in nearby dSphs. In X-rays, different types of symbiotic stars show a wide range of energy (0.1–100 keV) and luminosity ( erg s-1) (Luna et al., 2013; Mukai, 2017). Usually, X-ray sources with luminosities of –1033 erg s-1 are detectable in dSphs around the Milky Way owing to their small distances. Moreover, the optical brightness of red giants helps us to identify the nature of the companion star.
To confirm the results of Draco dSph and to provide a wider view of the population of accreting white dwarfs in dSphs, it is necessary to classify the X-ray sources of more dSphs with different stellar populations. Following this goal, we studied the X-ray sources in Willman 1 dSph (Wil 1, hereafter) applying the same multi-wavelength classification methods as for Draco dSph.
Wil 1 (RA=10h49m21s, DEC=+51∘03.00.0) is an old dSph, discovered in 2005 by Willman
et al. (2005). This galaxy has a stellar mass of 1.0 M☉ and is one of the the least massive Milky Way satellites (Martin et al., 2007) located at a distance of 387 kpc (McConnachie, 2012). Its half-light radius () is 2.3 (20 pc) (Willman
et al., 2011). The age of the galaxy is estimated to be 10–14 Gyr and its metallicity is [Fe/H] (Martin et al., 2007; Willman
et al., 2011). Draco and Wil 1 dSphs have similar ages and metallicities (McConnachie, 2012). However, with a stellar mass of 2.9 M☉ and of 220 pc for Draco dSph (McConnachie, 2012), the stellar density of Wil 1 is of that of Draco dSph.
Wil 1 has been observed three times with XMM-Newton in 2010 with the aim to detect an emission line from decaying dark matter (Loewenstein &
Kusenko, 2012). These observations had never been used for X-ray source classification in the field of Wil 1. The exposure time of XMM-Newton observations of Wil 1 was long enough to perform X-ray spectral and timing analyses for the bright X-ray sources in the field of this galaxy. As Willman
et al. (2011) have shown, the main stellar population of Wil 1 is located inside 3 of this dSph. Only 1 of stars, which belong to Wil 1 are exponentially distributed beyond 4. In this paper, we report the details of the X-ray analysis together with multi-wavelength studies, which have been performed to classify the X-ray sources in the field of Wil 1. In Sect. 2 we describe the data reduction and analysis of the XMM-Newton observations. In Sect. 4 and Sect. 5 we present the multi-wavelength studies and X-ray methods, which are used to classify the X-ray sources. In Sect. 6 we explain the properties and the classification of the detected sources in the field of Wil 1.
2 Data reduction
Wil 1 has been observed in three XMM-Newton observations, which are listed in Table 1. Full-frame mode and the thin filter were used for cameras EPIC-pn (Strüder et al., 2001) and EPIC-MOS1, 2 (Turner et al., 2001) in all observations. Data reduction and source detection were performed using the XMM-Newton Science Analysis System (SAS, V.17.0.0). High background caused by soft proton flares were screened from the event files. Threshold rate of 0.35 count s-1 for EPIC-MOS and rate 0.4 count s-1 for EPIC-pn are applied to find good time intervals. Light curves of clean event lists were also checked visually to remove possible background flares. Table 1 lists the net exposure time for each observation and EPIC camera. Source detection in the five standard energy-bands of XMM-Newton B1 (0.2–0.5 keV), B2 (0.5–1.0 keV), B3 (1.0–2.0 keV), B4 (2.0–4.5 keV), B5 (4.5–12.0 keV) was performed using the SAS task edetect-chain for each observation. We selected the minimum value of maximum likelihood () of 10 for the source detection. Probability of Poisson random fluctuations of the counts (), which is based on the raw counts of the source and the raw counts of the background maps is used to calculate the detection maximum likelihood =–ln.
| OBS-N0 | OBS-ID | OBS-Date | EXP.T∗ (ks) | ||
|---|---|---|---|---|---|
| pn | MOS1 | MOS2 | |||
| 1 | 0652810101 | 2010-10-22 | 14.1 | 22.5 | 22.4 |
| 2 | 0652810301 | 2010-10-25 | 20.6 | 27.8 | 27.5 |
| 3 | 0652810401 | 2010-10-31 | 26.5 | 32.3 | 32.7 |
| : Exposure time of EPICs after screening for high background. | |||||
| OBS-N0 | EPIC | RA () | DEC () |
|---|---|---|---|
| 1 | PN | -0.33 0.69 | 0.48 0.69 |
| MOS1 | -0.48 0.83 | -0.08 0.83 | |
| MOS2 | -0.29 0.63 | 0.29 0.63 | |
| 2 | PN | -0.20 0.54 | 0.53 0.54 |
| MOS1 | -0.02 0.57 | 0.68 0.57 | |
| MOS2 | -0.17 0.52 | 0.32 0.52 | |
| 3 | PN | 0.16 0.52 | -0.49 0.52 |
| MOS1 | 0.18 0.64 | -0.23 0.64 | |
| MOS2 | 0.33 0.50 | -0.01 0.50 |
3 Source catalogue
We cross-checked the detected sources of all observations/all EPICS with each other to obtain a final source catalogue. If the positions of the sources in different observations/EPICs were closer than the 3 statistical errors, we considered them as one source. The multiple XMM-Newton observations helped to remove the spurious sources caused by bad pixels, hot columns, gaps, edges of the CCD chips (Saxton et al., 2008).
The final catalogue of 97 X-ray sources in the field of Wil 1 is listed in Table LABEL:catalogue-x-ray. The catalogue shows ID, right ascension (RA), declination (Dec), position uncertainty, and the flux of different observations for each source. The list of the sources are sorted using their coordinates. In this paper, each source is named by its ID, which is presented in Table LABEL:catalogue-x-ray.
For the astrometrical correction of the position of X-ray sources, we selected 11 X-ray sources, which had bright optical counterpart (apparent magnitude <21 mag) and were already classified as AGNs in optical catalgues (see Sect.4.3). The weighted mean of the RA and the Dec between the positions of the optical and X-ray sources have been calculated to estimate the error of the position of X-ray sources for each observation (see Table 2). We found no significant instrumental shift in the RA and Dec of X-ray sources in none of the observations. Therefore, the coordinate and the positional error of each source were taken from the observation, in which the source was detected with the highest maximum likelihood.
To obtain the flux of the sources in each observation, we assumed an absorbed power law model with the Galactic foreground absorption in the direction of Wil 1 (= 1.17 cm-2, HI4PI
Collaboration et al., 2016) and a photon index of =2. The flux of the sources, for which spectral analysis was performed, are calculated using the best fit model to their spectrum (see Sect. 5.3). Table LABEL:catalogue-x-ray shows the weighted flux of all EPICs measurements for each observation.
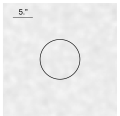
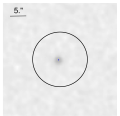
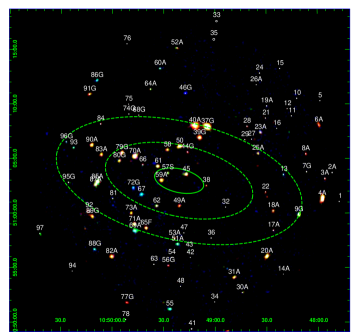
The mosaic image were created using the SAS task emosaicproc out of the calibrated event files of all observations/EPICs. The task transforms the event files of different observations/pointings to a common image center, and after filtering the soft proton flares, it creates the exposure maps (including vignetting), and the background maps and performs the source detection. Figure 1 shows the three-colour combined image of all observations. In Fig. 1, we show the main field of Wil 1 (1) and also the regions of 3 and 5 of Wil 1.
4 Cross-correlation with other catalogues
We cross-correlated the X-ray source list with catalogues at other wavelengths. A source, which was located within the 3 error circle of an X-ray source position, was considered to be its counterpart. We discuss the catalogues used in this work in the following.
4.1 Optical counterparts of X-ray sources
To study the optical counterparts of the X-ray sources, we have used the 11th and 12th released data of the Sloan Digital Sky Survey (Alam
et al., 2015, SDSS12). The catalogue includes photometric data in the energy bands from the near ultraviolet (UV) to the near infrared (=3551 Å, =4686 Å, =6165 Å, =7481 Å, =8931 Å) and allows a spectral study of the optical counterpart. For the , , , , and bands, the Galactic extinction of 0.04, 0.03, 0.02, 0.01, and 0.01 mag is used in the direction of the Wil 1, respectively (Schlafly &
Finkbeiner, 2011). Table 6 presents the SDSS12 magnitudes of the optical counterparts of the X-ray sources.
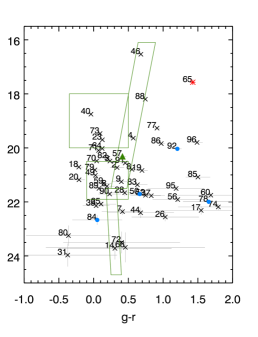
Figure 2 left image, shows the colour-magnitude diagram of the optical counterparts of the X-ray sources in the field of Wil 1. Logarithmic X-ray to optical flux ratio log, versus the X-ray flux and also hardness ratio (see Sect. 5.2) are plotted in Figure 3. The flux ratio log was calculated using the equation of Maccacaro et al. (1988) modified for SDSS bands (Saeedi
et al., 2016):
| (1) |
where is the X-ray flux and and are the SDSS magnitudes of the optical counterpart associated with the X-ray source.
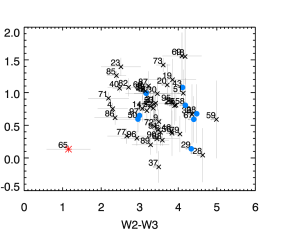
4.2 Infrared counterparts of X-ray sources
We searched for mid-infrared counterparts in the WISE All-Sky survey in four energy bands (3.4, 4.6, 12, and 22 m, named , , , and , respectively; Cutri & et al., 2014) and near-infrared counterparts in the 2MASS All-Sky Catalogue of Point Sources in the , , bands (Cutri et al., 2003). The Galactic extinction for the infrared bands in the direction of Wil 1 was negligible (Schlafly & Finkbeiner, 2011). Table 7 list the magnitudes of WISE and 2MASS counterparts of the X-ray sources. Figure 4 shows the colour-colour diagram of the WISE counterparts of the X-ray sources in the field of Wil 1. The colours are selected based on the study of Wright et al. (2010), which shows that many of background objects are expected to be red (>1.5) in WISE colour, while stars show (<1.5). In 2MASS near-infrared counterparts, background sources like e.g, AGNs and quasars are expected to have (see e.g, Masci et al., 2010). Only three sources had counterparts in the 2MASS near-infrared catalogue (see Table 7). These sources are classified as foreground star and galaxies as explained in Sect. 6.1 and Sect. 6.2.
4.3 Catalogues of AGNs and galaxies
Most of the background objects are AGNs. Many of these objects were already classified based on spectral properties in the optical and/or infrared surveys. The most updated optical/infrared catalogues of classified AGNs/quasars were considered in this work: The Million Quasars (Flesch, 2019), WISE AGN candidates catalogs (Assef et al., 2018), QSOs selection from SDSS and WISE (Richards et al., 2015), and known quasars of the Gaia mission (Liao et al., 2019). In addition, we considered the catalogues, which classified galaxies: Vasconcellos et al. (2011) used the photometric data of SDSS7 (Abazajian et al., 2009) survey and separated the stars and galaxies based on a functional tree algorithm. We also used the more updated classification of Alam et al. (2015), which provides a classification of stars and galaxies using redshifts and colour criteria as the details are explained in Alam et al. (2015) and Ahn et al. (2012). The sources, which have been classified as AGNs or galaxies in above catalogues are labeled in Table LABEL:catalogue-x-ray.
4.4 Gaia and GALEX catalogues
5 X-ray data analysis
We performed X-ray analysis for sources in the field of Wil 1. Following analyses were carried out for these sources.
5.1 X-ray timing analysis
To study the short-term variability of sources we have applied the Lomb-Scargle technique (Scargle, 1982) and the pulsation Z test (Buccheri
et al., 1983; Buccheri et al., 1988). We extracted the light curves of bright sources (i.e, counts > 300 in each observation) in the energy range of 0.2–12 keV, and calculated their Lomb-Scargle periodograms. We could not find a signal of periodicity for any of the sources. In addition, we applied the Z analysis for the barycentrically corrected event files of sources from each observation in the energy range of 0.2–12 keV and extracted the first and second harmonic periodograms. For none of the sources we found evidence for pulsation.
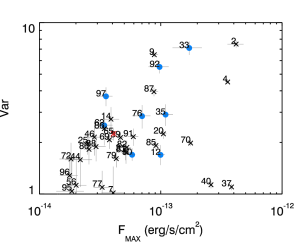
To study the long term variability, we checked the flux variation of sources over three XMM-Newton observations. Flux variation and its significance were calculated using
| (2) |
respectively (Primini et al., 1993). and are the maximum and minimum X-ray flux, and and are their corresponding errors. Due to the high background fluctuations, the energy band 5 (4.5–12.0 kev) was excluded in the calculation of the variability factor. The variability factor was calculated for the sources that were detected in at least two observations (see Table LABEL:catalogue-x-ray). The variability of a sources considered to be significant if was higher than 3. Figure 5 shows the variability factor of the sources with significant variability. As it is shown in the plot, none of sources shows a very high variability during three XMM-Newton observations.
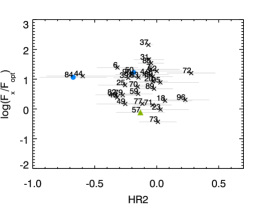
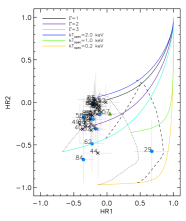
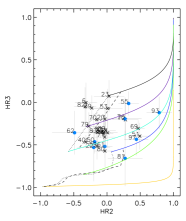
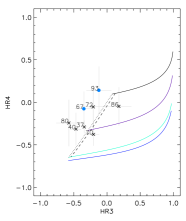
5.2 Hardness ratios
Hardness ratios (HRs) are useful parameters for the study of spectral properties of X-ray sources. The hardness ratio and its error are defined as
| (3) |
respectively, where is the count rate and is the corresponding error in the band . For each source we calculated the hardness ratio of the observation, in which the source had the highest detection likelihood. In the next step, the hardness ratio is calculated only for those energy bands, which had a detection likelihood higher than 6 (>3). Table LABEL:catalogue-x-ray shows the details of HRs for sources. Figure 6 shows the hardness ratio diagrams. We over-plotted the lines presenting the hardness ratios of different spectral models with various column densities from = cm-2 to = cm-2. We considered three power-law models with photon-index of 1, 2, 3 for the hard sources, e.g, X-ray binaries, AGNs, or galaxies. Three apec model with the temperature of of 0.2, 1.0, and 2.0 keV correspond to the spectra of soft plasma emissions detected in different sources, e.g, supernova remnant (SNR), foreground stars, and symbiotic stars. The models, which describe the emission of the soft source (i.e, apec model with the temperature of of 0.2, 1.0) have a negligible rate in harder energy bands and therefore we do not have these models in and . Sources are classified as hard source when it has >, or only and/or are defined and there is no other classification for the source (Pietsch et al., 2005) (see Table LABEL:catalogue-x-ray).
5.3 X-ray spectral analysis
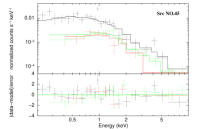
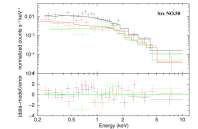


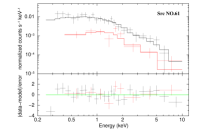
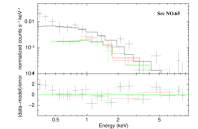

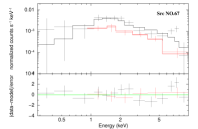
We extracted and analysed the X-ray spectra of bright sources in the field of Wil 1, which have not been classified as background objects (see Sect. 6). We extracted the spectra of the sources that had a net source counts of >500 in total. To improve the statistics of the spectrum of a source, we merged the spectra of all observations, in which the source was detected using the SAS task epicspeccombine. Before merging the spectra of different observation, we checked the variability of the source to exclude the spectrum of observation, in which the source showed a significantly different flux (see table LABEL:catalogue-x-ray). Figure 7 shows the spectrum of the X-ray sources and Table 3 the details of the models fitted to the spectrum of sources. We fitted an absorbed power-law model or an absorbed collisionally-ionised thermal gas model (APEC, Brickhouse et al., 2000) to the spectrum of sources. The model for each source is selected based on the best fit. The details of the spectral study of each source are discussed in Sect. 6. For those sources, which were too faint for the spectral analysis, the hardness ratios can be used to characterise the spectrum of the sources (see Sect. 5.2).
| Src-No | Model | Photon index | Abundance | (d.o.f) | Absorbed | |||
|---|---|---|---|---|---|---|---|---|
| cm-2 | keV | erg s-1 cm-2 | erg s -1 | |||||
| 45 | tbabs(po) | <0.13 | 2.00 | 1.07 (39) | 21.48 | 4.1 | ||
| 50(2) | tbabs(apec+apec) | <0.06 | =0.17 | <0.18 | 1.35 (44) | 41.49 | 7.9 | |
| =5.27 | ||||||||
| 57(3) | tbabstbabs(apec) | =0.012 frozen | 3.60 | <1.0 | 1.10 (10) | 10.43 | 2.0 | |
| =0.14 | ||||||||
| 58 | tbabs(apec) | <0.06 | 1.71 | <0.90 | 0.91 (9) | 6.80 | 1.6 | |
| 61 | tbabs(apec) | 0.04 | 4.36 | <1.01 | 1.07 (30) | 20.7 | 4.0 | |
| 65 | tbabs(apec) | <0.02 | 2.97 | <0.22 | 1.13 (26) | 10.33 | 3.3(4) | |
| 66 | tbabs(po) | <0.58 | 2.49 | 1.86 (5) | 4.45 | 8.5 | ||
| 67 | tbabs(po) | 0.54 | 1.34 | 1.02 (16) | 45.71 | 8.7 | ||
| (1): We assumed a distance of Wil 1 (40 kpc) to estimate the luminosity of the sources (see Sect. 1). | ||||||||
| (2): For the source No. 50 there are two temperatures of two apec models: and . | ||||||||
| (3): Source No. 57 has two absorption models, which show the Galactic absorption() and the intrinsic absorption (). | ||||||||
| (4): For the source No. 65, which is classified as a foreground M dwarf, the distance of 441 parsec is taken to estimate its | ||||||||
| luminosity (see Sect. 6). | ||||||||
6 classification of X-ray sources in the field of Wil 1
In following we explain the details of source classification in the field of Wil 1. Table 4 summarises the criteria of the source classification.
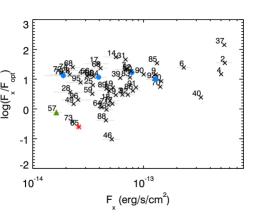
6.1 Classified AGN and galaxies
As Figure 4 shows, sources, which have been classified as background galaxies or AGNs (see Table. LABEL:catalogue-x-ray) show consistency with the properties of background objects in deep infrared studies as explained in Sect. 4.2. Only sources No. 46 and No. 88 have a 2MASS near-infrared counterpart, which has a similar colour of background sources in 2MASS survey (see Sect. 4.2). These two sources are the brightest background galaxies in the field of Wil 1 and their extent is visually observable in their optical counterpart (see Fig. 8). The classified background sources with optical counterpart have X-ray to optical flux ratio (see Fig. 3). It is also similar to the ratio of background sources in other studies (see e.g, Ducci et al., 2013; Saeedi et al., 2016). As Fig. 3 shows, for the majority of background sources the X-ray emission is more dominant than the optical emission, which is different from foreground stars or symbiotic stars. The HR diagrams of Fig. 6 show that most of the classified background sources have a hard spectrum (located in the area of power-law models with =1, 2).
| source type | classification critra |
|---|---|
| foreground stars | log<0, infrared counterpart with and/or , optical counterpart brighter |
| or redder (M dwarfs) than the steller isochrone of Wil 1, main X-ray emission <2.0 keV | |
| AGNs | -1<log<2, infrared counterpart with and/or , HR2>-0.5 |
| galaxies | -1<log<2, infrared counterpart with and/or , optically classifed as a |
| galaxy. | |
| symbiotic stars | log<0, infrared counterpart of an stellar object () and optical counterpart on the isochrone |
| of Wil 1 dSph or confirmed as member of Wil 1 dSph, X-ray emmsion similar to one of the types of | |
| symbiotic stars (Luna et al., 2013) | |
| hard sources | , or only and/or are defined |
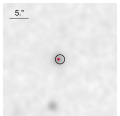
6.2 Sources No. 65, a foreground M dwarf
Source No. 65 has optical and infrared counterparts with , , and log<0. This makes its classification as a foreground star likely (Saeedi et al., 2016; Ducci et al., 2013; Salvato et al., 2018). The optical and infrared colours of the source with =1.400.01 =0.980.01, =0.520.01, and =1.290.05, =0.570.09, and =0.280.09 agree very well with the M dwarfs of the spectral type M2 according to West et al. (2011). It is located at the distance of pc based on the parallax measurement of Bailer-Jones et al. (2018)111 Gaia source ID: 835973362206830080. The spectrum of the source is fitted with an absorbed apec model (see Table 3 and Fig. 7) with a temperature of =2.97 keV, which is slightly higher than the typical temperature of classified M dwarfs in the field of Draco dSph (Saeedi et al., 2019). The flux of the source stays at similar values over the three XMM-Newton observations. In addition, the individual light curve of each observation shows no flare activity. The X-ray luminosity of the order erg s-1 is consistent with an M2 dwarf with an age of 0.01 Gyr (see Stelzer et al., 2013).
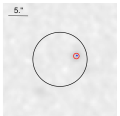
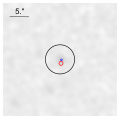
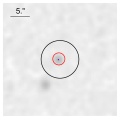
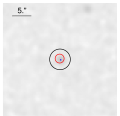
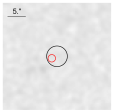
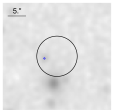
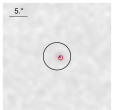
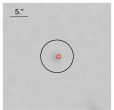
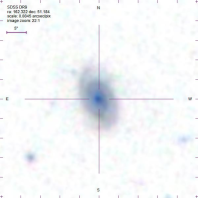
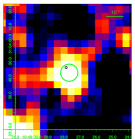
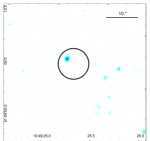
6.3 Source No. 57, symbiotic star in the Wil 1 dSph
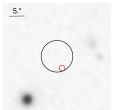
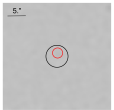
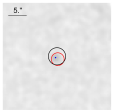
This source is located in the central region of the Wil 1. Figure 9 shows the 3 error circle of the X-ray source position in observation 3, where source No. 57 had the highest detection likelihood. Within this error circle position the source No. 57 has an optical counterpart, which is located in the red giant branch of the Wil 1 sources (see Fig. 2). In addition, this optical counterpart is classified as a member of the Wil 1 by Martin et al. (2007) with a radial velocity of -11.72.8 km s-1 and a metallicity of [Fe/H]=–1.6, which both are in a very good agreement with the systemic velocity (-12.81.0 km s-1) and the low metallicity of Wil 1 members (Martin et al., 2007; Willman et al., 2011). The source has log0., similar to stellar objects classified by Saeedi et al. (2019) in Draco dSph. Its X-ray spectrum is fitted well with an absorbed apec model (see Table 3 and Fig. 7 upper right). The temperature of the source of = keV is similar to the temperature of the -type symbiotic (Luna et al., 2013; Saeedi et al., 2019). The column density of the source is higher than the Galactic absorption in the direction of Wil 1 (=1.171020 cm-2). We assumed two absorption model for the source: a Galactic absorption, frozen to the in the direction of Wil 1, and the intrinsic absorption of =0.141022 cm-2 for the source itself, which can be related to colliding winds region of the symbiotic star (Luna et al., 2013). We classify this source as a symbiotic star in Wil 1.
6.4 Sources with optical counterpart
Only sources No. 50, 78, 84 and 92 are unclassified X-ray sources with an optical counterpart (see Fig. 2). Their optical counterpart is calssified as a stellar object in SDSS12 survey (Alam
et al., 2015). Among these four source only source No. 50 has a WISE infrared counterpart too (see Fig. 4).
Sources No. 50, 84: The optical counterpart of these two sources can be a main sequence star in Wil 1 (see Fig. 2). The X-ray spectrum of source No. 50 is fitted with an absorbed apec model with two components (see Fig. 7 and Table 3). The absorption of the source is consistent with the Galactic absorption towards Wil 1 and the abundance of the source is consistent with the low metallicity of Wil 1 members. The HR of source No. 84 shows that the main emission of the source is <2.keV (see Table LABEL:catalogue-x-ray) and it has a softer emission in comparison to the known background sources (see Fig. 6 and 3). As Fig. 3 shows both sources have log >1. Assuming that source No. 50 and No. 84 are located at the distance of Wil 1 (40 kpc), their luminosities are 7.9 and 2.0 erg s-1, respectively.
In the following, we discuss about the possibilities of these two sources being candidates for either cataclysmic variables (CVs, i.e, accreting white dwarf with a main sequence companion), or low mass X-ray binaries (LMXBs). The X-ray emission in CVs depends on the strength of the magnetic field of the white dwarf and the accretion rate. There are two main classes of magnetic and non-magnetic CVs. In non-magnetic CVs an accretion disk can form around the white dwarf. The disk -itself- is not hot enough to emit X-rays. However, if the boundary layer between the disk and surface of the white dwarf is optically thin, X-ray emission can be produced. In this case the X-ray emission is hard with a corresponding temperature of a few keV and an X-ray luminosity between 1029–1032 erg s-1 (Mukai, 2017; Kuulkers et al., 2006). If the system undergoes the nova eruption, the boundary layer becomes optically thick, therefore the system shows a soft X-ray emission of 0.1–0.5 keV and higher luminosities (Mukai, 2017). Magnetic CVs have two sub-classes of polars (with strong magnetic field) and intermediate polars (with weakly magnetic white dwarf). Polars have no accretion disk and materials follows the magnetic lines to reach to the surface of the white dwarf. Polars are characterised by a dominant soft X-ray emission and a bolometric luminosity of 1032 erg s-1 (Mukai, 2017). There are cases, in which polars show emission up to 10 keV, however, in these cases the bolometric luminosity decreases around two orders of magnitude (e.g, Ramsay et al., 2004). In case of intermediate polars, a truncated accretion disk can form. The attachment of the inner part of the accretion disk with the magnetic field of white dwarf forms accretion curtains above the poles of the white dwarfs, where the materials experience strong shocks, and therefore, a hard X-ray emission of 5–50 keV, with a X-ray luminosity up to a few 1033 erg s-1 is produced (Mukai, 2017; Balman, 2012). Fluorescent Fe K lines were observed in most of the intermediate polars (Kuulkers et al., 2006). On the basis of the samples of Mukai (2017), CVs have a log<1.0 and magnetic CVs generally have a log larger than that of non-magnetic CVs. According the above characteristics of spectrum and luminosity of different types of the CVs, source No. 50 and No. 84 do not fit to any class of them.
On the other hand, The low luminosity of the sources suggests that they are no persistent LMXBs, which normally have X-ray luminosities > erg s-1. However, they might be transient LMXBs. Observational studies show that transient LMXBs are low luminosity X-ray sources ( erg ) with soft X-ray emissions (< 5.0 keV) (e.g, Yokogawa et al., 2000; Campana et al., 1998). The models behinds these very faint accretors are explained in the work of e.g, King &
Wijnands (2006) Simulations predict that transient LMXBs are common X-ray sources in galaxies and can be observed several million years after the star formation (Bogomazov &
Lipunov, 2008; van Haaften et al., 2015). Sources No. 50 and 84 show no pulsation. Also, their optical counterparts are not confirmed as Wil 1 members in the studies of Martin et al. (2007) and Willman
et al. (2011). Therefore, these sources remain unclassified being, either transient LMXBs or background objects.
Sources No. 78, 92: Source No. 92 is a variable source (see Fig. 5). X-ray to optical flux ratio of both sources are log >1. The position of the optical counterparts of these two sources in the colour-magnitude diagram (see Fig. 2) and also the location of them (out of the 5 of the field of Wil 1; see Fig. 1 and Sect. 1) make them rather unlikely members of Wil 1.
6.5 Sources with WISE infrared counterpart
Sources No. 29, 38, 43, 45, 58, 67, 97 have only an infrared counterpart in WISE survey, and no optical counterpart is found for theses sources. The position of all these sources in colour-colour WISE diagram shows that they all have infrared colours similar to the background objects (see Fig. 4). The spectral analysis of source No. 45 and 67 (see Fig. 7 and Table. 3) shows that an absorbed power-law model is fitted to the spectrum of these two sources. Source No. 97 is also a hard variable source (see Table LABEL:catalogue-x-ray, and Fig. 5). Source No. 97 and also 43, which is located outside of the of the 5 of the main field of Wil 1 can be candidate for a background source. However, in case of sources No. 45, and 67 the classification needs more criteria, since they can be the members of Wil 1.
Source No. 58 has a soft X-ray spectrum. An absorbed apec model with a temperature of 1.4 keV (see table. 3 and Fig. 7) is fitted to the spectrum. For the sources No. 29, 38 the HRs show that their main emission is observed <2. keV. They remain unclassified since there is not enough information for their classification.
6.6 Sources without counterpart
The rest of the X-ray sources in the field of Wil 1 have no optical/infrared counterparts. Among them, sources No. 22, 55, 61, 62, 76, 81, 93 are classified as hard X-ray sources using the HRs criteria (see Sect. 5.2). Also, source No. 22, 61, 62, 66, 81, 93 are located within the 5 of Wil 1. For sources 61, 66 we have performed a spectral analysis. An absorbed power-law model is fitted to the spectrum of source No. 61. As for source No. 66, poor statistics of the spectrum do not allow to determine a significant temperature for the source. Since there is no optical/infrared counterpart for these sources, no advanced classification is possible for them.
7 Summary
We have detected and performed a classification of X-ray sources in the field of Wil 1 using three XMM-Newton observations and multi-wavelength studies. Our study shows that most of the X-ray sources in the field of Wil 1 are background galaxies and AGNs. This result is consistent with the results, which have been obtained for other dSphs (e.g, Manni et al., 2015; Saeedi
et al., 2016; Maccarone et al., 2005). Only one foreground star (M dwarf) is detected in the field of Wil 1.
Also, we classified a symbiotic star in Wil 1. This is consistent with the result of our recent deep X-ray study of the Draco dSph (Saeedi et al., 2019) and confirms the detection of accreting white dwarfs in these old population of dSphs. Moreover, eleven sources are classified as hard sources in the field of Wil 1.
We could not confirm the presence of any LMXB in Wil 1. So far, no LMXBs have been detected in nearby dSph. However, theoretically, transient LMXBs can exist for a long time in galaxies and be detectable as soft and low luminosity X-ray sources. Additional X-ray studies of different nearby dSphs with different age, star formation, and distance are necessary to verify the existence of LMXBs in dSphds.
Acknowledgements
This research was funded by the DLR research grant BWWI/DLR 500R1907 and DFG SA 2131/12-1. This study is based onobservations obtained with XMM-Newton, an ESA science mission with instruments and contributions directly funded by ESA Member States and NASA. This research has made use of the SIMBAD and VIZIER database, operatedat CDS, Strasbourg, France, and of the NASA/IPAC Extragalactic Database (NED), which is operated by the Jet Propulsion Laboratory, California Institute of Technology, under contract with the National Aeronautics and Space Administration. This publication makes use of data products from the Wide field Infrared Survey Explorer, which is a joint project of the University of California, Los Angeles, and the Jet Propulsion Laboratory/California Institute of Technology, funded by the National Aeronautics and Space Administration. This publication has made use of data products from the Two Micron All Sky Survey, which is a joint project of the University of Massachusetts and the Infrared Processing and Analysis Center, funded by the National Aeronautics and Space Administration and the National Science Foundation. Funding for SDSS and SDSS-III has been provided by the Alfred P. Sloan Foundation, the Participating Institutions, the National Science Foundation, and the US Department of Energy Office of Science. The SDSS-III web site ishttp://www.sdss3.org/.SDSS-III is managed by the Astrophysical Research Consortium for the Participating Institutions of the SDSS-III Collaboration including the University of Arizona, the Brazilian Participation Group, Brookhaven National Laboratory, University of Cambridge, University of Florida, the French Participation Group, the German Participation Group, the Instituto de Astrofisica de Canarias, the Michigan State/Notre Dame/JINA Participation Group, Johns Hopkins University, Lawrence Berkeley National Laboratory, Max Planck Institute for Astrophysics, New Mexico State University, New York University, Ohio State University, Pennsylvania State University, University of Portsmouth, Princeton University, the Spanish Participation Group, University of Tokyo, University of Utah, Vanderbilt University, University of Virginia, University of Washington, and Yale University. This research has made use of SAO Image DS9, developed by Smithsonian Astrophysical Observatory.
References
- Abazajian et al. (2009) Abazajian K. N., et al., 2009, ApJS, 182, 543
- Ahn et al. (2012) Ahn C. P., et al., 2012, ApJS, 203, 21
- Alam et al. (2015) Alam S., et al., 2015, ApJS, 219, 12
- Arnason et al. (2019) Arnason R. M., Barmby P., Bahramian A., Maccarone T. J., Zepf S. E., 2019, MNRAS, 485, 2259
- Assef et al. (2018) Assef R. J., Stern D., Noirot G., Jun H. D., Cutri R. M., Eisenhardt P. R. M., 2018, ApJS, 234, 23
- Bailer-Jones et al. (2018) Bailer-Jones C. A. L., Rybizki J., Fouesneau M., Mantelet G., Andrae R., 2018, AJ, 156, 58
- Balman (2012) Balman S., 2012, Mem. Soc. Astron. Italiana, 83, 585
- Bianchi et al. (2017) Bianchi L., Shiao B., Thilker D., 2017, ApJS, 230, 24
- Bogomazov & Lipunov (2008) Bogomazov A. I., Lipunov V. M., 2008, Astronomy Reports, 52, 299
- Brickhouse et al. (2000) Brickhouse N. S., Smith R. K., Raymond J. C., Liedahl D. A., 2000, in AAS/High Energy Astrophysics Division #5. p. 27.01
- Buccheri et al. (1983) Buccheri R., et al., 1983, A&A, 128, 245
- Buccheri et al. (1988) Buccheri R., di Gesu V., Maccarone M. C., Sacco B., 1988, A&A, 201, 194
- Campana et al. (1998) Campana S., Colpi M., Mereghetti S., Stella L., Tavani M., 1998, A&ARv, 8, 279
- Cutri & et al. (2014) Cutri R. M., et al. 2014, VizieR Online Data Catalog, p. II/328
- Cutri et al. (2003) Cutri R. M., et al., 2003, VizieR Online Data Catalog, p. II/246
- Ducci et al. (2013) Ducci L., Sasaki M., Haberl F., Pietsch W., 2013, A&A, 553, A7
- Fabbiano (2006) Fabbiano G., 2006, ARA&A, 44, 323
- Flesch (2019) Flesch E. W., 2019, VizieR Online Data Catalog, p. VII/283
- Gaia Collaboration et al. (2018) Gaia Collaboration et al., 2018, A&A, 616, A1
- HI4PI Collaboration et al. (2016) HI4PI Collaboration et al., 2016, A&A, 594, A116
- King & Wijnands (2006) King A. R., Wijnands R., 2006, MNRAS, 366, L31
- Kuulkers et al. (2006) Kuulkers E., Norton A., Schwope A., Warner B., 2006, X-rays from cataclysmic variables. pp 421–460
- Liao et al. (2019) Liao S.-L., Qi Z.-X., Guo S.-F., Cao Z.-H., 2019, Research in Astronomy and Astrophysics, 19, 029
- Loewenstein & Kusenko (2012) Loewenstein M., Kusenko A., 2012, ApJ, 751, 82
- Luna et al. (2013) Luna G. J. M., Sokoloski J. L., Mukai K., Nelson T., 2013, A&A, 559, A6
- Maccacaro et al. (1988) Maccacaro T., Gioia I. M., Wolter A., Zamorani G., Stocke J. T., 1988, ApJ, 326, 680
- Maccarone et al. (2005) Maccarone T. J., Kundu A., Zepf S. E., Piro A. L., Bildsten L., 2005, MNRAS, 364, L61
- Manni et al. (2014) Manni L., Nucita A., De Paolis F., 2014, in The X-ray Universe 2014. p. 280
- Manni et al. (2015) Manni L., Nucita A. A., De Paolis F., Testa V., Ingrosso G., 2015, MNRAS, 451, 2735
- Martin et al. (2007) Martin N. F., Ibata R. A., Chapman S. C., Irwin M., Lewis G. F., 2007, MNRAS, 380, 281
- Masci et al. (2010) Masci F. J., Cutri R. M., Francis P. J., Nelson B. O., Huchra J. P., Heath Jones D., Colless M., Saunders W., 2010, Publ. Astron. Soc. Australia, 27, 302
- McConnachie (2012) McConnachie A. W., 2012, AJ, 144, 4
- Mukai (2017) Mukai K., 2017, PASP, 129, 062001
- Pietsch et al. (2005) Pietsch W., Freyberg M., Haberl F., 2005, A&A, 434, 483
- Primini et al. (1993) Primini F. A., Forman W., Jones C., 1993, ApJ, 410, 615
- Ramsay & Wu (2006) Ramsay G., Wu K., 2006, A&A, 459, 777
- Ramsay et al. (2004) Ramsay G., Cropper M., Wu K., Mason K. O., Córdova F. A., Priedhorsky W., 2004, MNRAS, 350, 1373
- Richards et al. (2015) Richards G. T., et al., 2015, ApJS, 219, 39
- Saeedi et al. (2016) Saeedi S., Sasaki M., Ducci L., 2016, A&A, 586, A64
- Saeedi et al. (2019) Saeedi S., Sasaki M., Stelzer B., Ducci L., 2019, A&A, 627, A128
- Salvato et al. (2018) Salvato M., et al., 2018, MNRAS, 473, 4937
- Saxton et al. (2008) Saxton R. D., Read A. M., Esquej P., Freyberg M. J., Altieri B., Bermejo D., 2008, A&A, 480, 611
- Scargle (1982) Scargle J. D., 1982, ApJ, 263, 835
- Schlafly & Finkbeiner (2011) Schlafly E. F., Finkbeiner D. P., 2011, ApJ, 737, 103
- Stelzer et al. (2013) Stelzer B., Marino A., Micela G., López-Santiago J., Liefke C., 2013, MNRAS, 431, 2063
- Strüder et al. (2001) Strüder L., et al., 2001, A&A, 365, L18
- Tolstoy et al. (2009) Tolstoy E., Hill V., Tosi M., 2009, ARA&A, 47, 371
- Turner et al. (2001) Turner M. J. L., et al., 2001, A&A, 365, L27
- Vasconcellos et al. (2011) Vasconcellos E. C., de Carvalho R. R., Gal R. R., LaBarbera F. L., Capelato H. V., Frago Campos Velho H., Trevisan M., Ruiz R. S. R., 2011, AJ, 141, 189
- Weisz et al. (2014) Weisz D. R., Dolphin A. E., Skillman E. D., Holtzman J., Gilbert K. M., Dalcanton J. J., Williams B. F., 2014, ApJ, 789, 147
- West et al. (2011) West A. A., et al., 2011, AJ, 141, 97
- Willman et al. (2005) Willman B., et al., 2005, AJ, 129, 2692
- Willman et al. (2011) Willman B., Geha M., Strader J., Strigari L. E., Simon J. D., Kirby E., Ho N., Warres A., 2011, AJ, 142, 128
- Wright et al. (2010) Wright E. L., et al., 2010, AJ, 140, 1868
- Yokogawa et al. (2000) Yokogawa J., Paul B., Ozaki M., Nagase F., Chakrabarty D., Takeshima T., 2000, ApJ, 539, 191
- van Haaften et al. (2015) van Haaften L. M., Nelemans G., Voss R., van der Sluys M. V., Toonen S., 2015, A&A, 579, A33
Appendix A Source catalogue
| Src-NO | RA | DEC | r1 | Flux(0.2–12. keV) | Hardness ratio | Var | Classification† | |||||
|---|---|---|---|---|---|---|---|---|---|---|---|---|
| (J2000) | (J2000) | () | ( erg s-1 cm-2) | |||||||||
| OBS1 | OBS2 | OBS3 | HR1 | HR2 | HR3 | HR4 | ||||||
| 1 | 10 47 47.61 | +51 01 03.3 | 1.73 | 0.61 0.20 | N | 0.75 0.15 | – | – | – | – | 1.24 0.47 | |
| 2 | 10 47 51.63 | +51 03 42.6 | 2.35 | 5.42 0.93 | N | 0.91 0.22 | -0.44 0.17 | – | – | – | 7.48 0.35 | AGN2,5,6 |
| 3 | 10 47 55.99 | +51 03 10.4 | 2.85 | N | 0.65 0.20 | 0.40 0.09 | – | – | – | – | 1.05 0.43 | AGN1,4 |
| 4 | 10 47 57.51 | +51 01 20.9 | 0.40 | 3.46 0.19 | 4.02 0.17 | 5.02 0.17 | -0.11 0.04 | -0.09 0.05 | -0.35 0.06 | – | 4.49 0.08 | AGN2,5,6 |
| 5 | 10 47 58.61 | +51 10 18.3 | 1.60 | 0.58 0.22 | N | N | – | – | – | – | – | |
| 6 | 10 47 59.34 | +51 08 04.5 | 1.09 | 1.85 0.36 | 2.31 0.31 | 1.36 0.22 | -0.14 0.12 | -0.31 0.16 | 0.00 0.23 | – | 1.54 0.25 | AGN1,4 |
| 7 | 10 48 06.61 | +51 03 47.7 | 2.10 | <16.40 | 0.54 0.11 | 0.69 0.13 | -0.18 0.18 | -0.05 0.23 | – | – | 1.00 0.43 | galaxy6 |
| 8 | 10 48 07.04 | +51 05 26.2 | 2.22 | 0.49 0.10 | 0.30 0.06 | 0.46 0.11 | -0.38 0.19 | – | – | – | 2.46 0.44 | AGN1,2,3,4 |
| 9 | 10 48 11.30 | +50 59 52.7 | 1.26 | 1.03 0.10 | 1.29 0.09 | 1.21 0.11 | -0.19 0.14 | -0.051 0.14 | -0.37 0.16 | – | 6.47 0.21 | galaxy6 |
| 10 | 10 48 12.18 | +51 10 31.9 | 1.96 | 0.83 0.26 | <12.96 | <10.32 | – | – | – | – | – | |
| 11 | 10 48 15.33 | +51 08 55.3 | 1.77 | <14.62 | <11.24 | 0.56 0.13 | – | – | – | – | – | |
| 12 | 10 48 17.79 | +51 09 35.4 | 1.42 | <11.18 | 1.29 0.14 | 0.90 0.16 | – | – | – | – | 1.69 0.22 | |
| 13 | 10 48 20.12 | +51 03 33.4 | 1.75 | N | 0.29 0.08 | 0.30 0.07 | – | – | – | – | 1.04 0.49 | |
| 14 | 10 48 20.30 | +50 54 20.6 | 0.85 | N | 0.56 0.13 | 0.25 0.09 | -0.08 0.31 | – | – | – | 2.72 0.48 | AGN2 |
| 15 | 10 48 22.11 | +51 13 16.1 | 1.71 | 0.52 0.17 | 1.12 0.22 | <8.54 | – | – | – | – | 1.54 0.41 | |
| 16 | 10 48 23.95 | +51 07 46.9 | 1.37 | 0.68 0.13 | <9.21 | <7.86 | – | – | – | – | – | |
| 17 | 10 48 26.11 | +50 58 26.2 | 2.22 | <10.13 | 0.39 0.10 | N | – | – | – | – | – | AGN2 |
| 18 | 10 48 26.17 | +51 00 14.3 | 1.63 | 0.50 0.12 | 0.27 0.04 | 0.30 0.06 | – | 0.06 0.22 | – | – | 1.80 0.35 | AGN1,2,3,4 |
| 19 | 10 48 29.82 | +51 09 50.6 | 1.98 | <10.56 | 0.53 0.11 | 0.43 0.10 | -0.41 0.16 | – | – | – | 1.01 0.43 | AGN1,2,3,4 |
| 20 | 10 48 29.97 | +50 56 03.6 | 0.89 | 1.40 0.10 | 1.45 0.09 | 1.15 0.10 | -0.15 0.09 | -0.03 0.11 | -0.19 0.13 | – | 2.23 0.14 | AGN1,2,3,4 |
| 21 | 10 48 30.55 | +51 08 43.9 | 1.78 | 0.52 0.12 | N | <6.45 | – | – | – | – | – | |
| 22 | 10 48 30.62 | +51 01 57.7 | 1.43 | 0.33 0.06 | <7.13 | 0.40 0.07 | -0.20 0.16 | -0.19 0.24 | -0.53 0.39 | – | 1.10 0.33 | Hard source |
| 23 | 10 48 33.50 | +51 07 25.1 | 1.00 | 0.46 0.07 | 0.36 0.05 | 0.42 0.05 | -0.18 0.20 | 0.03 0.22 | 0.07 0.18 | – | 1.54 0.26 | AGN1,2,3,4 |
| 24 | 10 48 33.93 | +51 12 51.0 | 2.11 | <13.69 | <6.45 | 0.52 0.10 | – | – | – | – | – | |
| 25 | 10 48 34.91 | +51 05 30.1 | 1.27 | 0.35 0.05 | 0.33 0.05 | 0.34 0.04 | -0.24 0.17 | -0.25 0.21 | – | – | 1.96 0.27 | AGN2,6 |
| 26 | 10 48 35.85 | +51 11 47.1 | 1.28 | <8.60 | <7.00 | 0.22 0.07 | – | – | – | – | – | AGN2 |
| 27 | 10 48 38.67 | +51 06 47.9 | 1.61 | 0.45 0.11 | <10.20 | 0.17 0.06 | – | – | – | – | 2.59 0.62 | |
| 28 | 10 48 41.34 | +51 07 59.1 | 2.05 | <13.76 | <6.14 | 0.22 0.06 | – | – | – | – | – | |
| 29 | 10 48 42.64 | +51 06 45.5 | 1.73 | <11.97 | N | 0.13 0.04 | 0.67 0.27 | -0.57 0.36 | – | – | – | |
| 30 | 10 48 44.29 | +50 52 44.5 | 1.19 | N | 0.26 0.07 | 0.45 0.07 | – | -0.21 0.21 | – | – | 1.62 0.42 | AGN2 |
| 31 | 10 48 49.01 | +50 54 08.4 | 0.67 | 0.54 0.10 | 0.39 0.05 | 0.69 0.05 | -0.11 0.09 | -0.06 0.12 | – | – | 1.77 0.20 | AGN2 |
| 32 | 10 48 53.88 | +51 00 34.7 | 1.44 | 0.36 0.07 | N | N | – | – | – | – | – | |
| 33 | 10 48 59.08 | +51 17 37.2 | 4.65 | <11.79 | 1.29 0.33 | 9.07 1.49 | – | – | – | – | 7.10 0.64 | |
| 34 | 10 49 00.32 | +50 51 53.0 | 1.38 | N | 0.16 0.07 | N | 0.02 0.33 | – | – | – | – | |
| 35 | 10 49 00.65 | +51 15 57.4 | 5.63 | <7.61 | 0.66 0.24 | 1.80 0.47 | – | – | – | – | 2.90 0.42 | |
| 36 | 10 49 02.34 | +50 57 44.4 | 1.97 | 0.24 0.07 | 0.13 0.03 | <3.56 | -0.21 0.27 | – | – | – | 1.40 0.50 | |
| 37 | 10 49 04.45 | +51 07 59.3 | 0.33 | 5.36 0.14 | 5.19 0.12 | 4.73 0.10 | -0.14 0.02 | -0.06 0.03 | -0.34 0.04 | -0.28 0.07 | 1.08 0.04 | galaxy6 |
| 38 | 10 49 05.16 | +51 02 34.1 | 1.01 | <5.10 | 0.18 0.04 | <3.38 | -0.63 0.18 | – | – | – | – | |
| 39 | 10 49 09.12 | +51 06 57.2 | 0.53 | 0.43 0.03 | 0.60 0.03 | 0.62 0.03 | -0.32 0.08 | -0.22 0.12 | -0.06 0.14 | – | 2.12 0.17 | galaxy6 |
| 40 | 10 49 11.81 | +51 08 04.8 | 0.24 | 3.23 0.10 | 3.30 0.09 | 3.07 0.09 | -0.36 0.03 | -0.32 0.05 | -0.46 0.08 | -0.31 0.19 | 1.12 0.05 | AGN1,2,3,4 |
| 41 | 10 49 13.79 | +50 49 24.9 | 2.71 | <7.86 | 0.79 0.17 | 0.59 0.13 | – | – | – | – | 1.00 0.34 | |
| 42 | 10 49 14.51 | +50 55 57.4 | 1.20 | 0.29 0.06 | <5.16 | 0.32 0.05 | – | – | – | – | 1.11 0.32 | |
| 43 | 10 49 15.19 | +50 56 38.0 | 1.47 | 0.29 0.04 | <4.30 | <4.42 | -0.10 0.22 | -0.14 0.25 | – | – | – | |
| 44 | 10 49 16.13 | +51 05 37.9 | 1.56 | 0.31 0.06 | 0.20 0.04 | 0.17 0.04 | -0.13 0.21 | -0.59 0.29 | – | – | 1.57 0.48 | galaxy6 |
| 45 | 10 49 16.91 | +51 03 35.8 | 0.74 | 0.34 0.03 | 0.32 0.03 | 0.32 0.02 | -0.17 0.11 | -0.31 0.13 | – | – | 1.21 0.20 | Hard source |
| 46 | 10 49 17.37 | +51 11 00.9 | 1.46 | 0.28 0.08 | 0.52 0.09 | 0.47 0.08 | – | – | – | 0.58 0.13 | 2.13 0.47 | galaxy5,6 |
| 47 | 10 49 18.24 | +50 58 13.0 | 1.70 | 0.28 0.06 | <6.20 | <5.96 | – | – | – | – | – | |
| 48 | 10 49 20.21 | +50 53 19.0 | 1.51 | <4.24 | 0.34 0.07 | <3.50 | – | – | – | – | – | |
| 49 | 10 49 20.92 | +51 00 41.4 | 1.26 | 0.23 0.02 | 0.15 0.03 | 0.17 0.02 | -0.40 0.14 | -0.25 0.23 | – | – | 1.29 0.38 | AGN1,4 |
| 50 | 10 49 20.77 | +51 06 10.0 | 1.19 | 0.72 0.05 | 0.78 0.04 | 0.63 0.05 | -0.24 0.08 | -0.18 0.11 | -0.46 0.13 | – | 1.69 0.14 | Hard source |
| 51 | 10 49 21.93 | +50 57 12.0 | 1.17 | 0.28 0.03 | 0.30 0.03 | 0.30 0.03 | – | 0.49 0.16 | -0.39 0.15 | – | 1.24 0.21 | AGN2 |
| 52 | 10 49 22.24 | +51 15 10.4 | 1.32 | 0.65 0.13 | 0.77 0.12 | 0.42 0.07 | -0.02 0.22 | -0.01 0.20 | – | – | 1.88 0.31 | AGN2 |
| 53 | 10 49 23.67 | +50 57 43.7 | 1.29 | 0.24 0.05 | 0.16 0.02 | 0.20 0.02 | -0.19 0.19 | 0.01 0.22 | -0.07 0.23 | – | 1.40 0.32 | AGN2 |
| 54 | 10 49 25.23 | +50 55 57.5 | 1.95 | 0.19 0.06 | <8.29 | <7.19 | – | – | – | – | – | |
| 55 | 10 49 26.50 | +50 51 15.0 | 1.01 | 0.44 0.06 | 0.54 0.06 | 0.61 0.05 | – | 0.32 0.15 | -0.01 0.14 | – | 1.16 0.20 | Hard source |
| 56 | 10 49 27.41 | +50 55 14.3 | 1.48 | 0.25 0.07 | 0.32 0.07 | 0.31 0.06 | -0.34 0.17 | – | – | – | 1.11 0.48 | galaxy6 |
| 57 | 10 49 27.67 | +51 03 43.1 | 1.67 | 0.27 0.06 | 0.16 0.02 | 0.16 0.02 | 0.04 0.20 | -0.13 0.19 | – | – | 1.41 0.42 | Symbiotic star |
| 58 | 10 49 27.90 | +51 05 49.9 | 1.29 | 0.29 0.03 | 0.18 0.02 | 0.19 0.02 | -0.35 0.17 | -0.17 0.24 | – | – | 1.37 0.24 | |
| 59 | 10 49 31.43 | +51 03 03.1 | 0.78 | 0.35 0.03 | 0.32 0.03 | 0.33 0.03 | -0.21 0.09 | -0.14 0.11 | -0.51 0.15 | – | 1.18 0.18 | AGN1,3,4 |
| 60 | 10 49 32.18 | +51 13 17.3 | 2.19 | 0.41 0.07 | 0.33 0.06 | 0.25 0.05 | – | – | – | – | 1.53 0.29 | AGN2,6 |
| 61 | 10 49 33.55 | +51 04 20.1 | 0.78 | 0.28 0.04 | 0.32 0.03 | 0.35 0.04 | -0.19 0.09 | -0.03 0.11 | -0.51 0.13 | – | 1.06 0.24 | Hard source |
| 62 | 10 49 34.16 | +51 00 41.5 | 1.60 | 0.44 0.07 | 0.21 0.02 | 0.18 0.02 | -0.22 0.17 | -0.48 0.33 | -0.35 0.25 | – | 2.51 0.30 | Hard source |
| 63 | 10 49 35.72 | +50 55 19.8 | 2.09 | <8.60 | <7.06 | 0.25 0.06 | – | – | – | – | – | |
| 64 | 10 49 37.81 | +51 11 23.8 | 1.98 | 0.42 0.06 | 0.37 0.05 | <3.56 | – | – | – | – | 1.41 0.31 | AGN1,3,4 |
| 65 | 10 49 40.31 | +50 58 40.6 | 0.95 | 0.33 0.04 | 0.34 0.03 | 0.26 0.02 | -0.37 0.12 | – | – | – | 2.23 0.19 | Foreground star |
| 66 | 10 49 42.29 | +51 04 27.5 | 1.37 | 0.21 0.05 | 0.14 0.04 | 0.28 0.04 | -0.45 0.15 | – | – | – | 1.93 0.44 | |
| 67 | 10 49 43.05 | +51 01 44.8 | 0.94 | 0.28 0.03 | 0.23 0.03 | 0.27 0.02 | – | – | -0.34 0.12 | -0.07 0.20 | 1.57 0.25 | Hard source |
| 68 | 10 49 44.60 | +51 09 00.3 | 1.55 | N | 0.23 0.04 | <3.44 | – | – | – | – | – | galaxy6 |
| 69 | 10 49 46.66 | +50 58 24.5 | 0.72 | 0.46 0.07 | 0.51 0.05 | 0.56 0.04 | – | 0.46 0.09 | -0.30 0.09 | – | 2.06 0.23 | AGN2 |
| 70 | 10 49 46.89 | +51 05 14.8 | 0.40 | 1.42 0.07 | 1.34 0.05 | 1.21 0.05 | -0.22 0.05 | -0.15 0.07 | -0.20 0.08 | -0.37 0.13 | 1.97 0.08 | AGN1,2,3,4 |
| 71 | 10 49 47.06 | +50 58 59.1 | 1.39 | 0.43 0.05 | 0.48 0.05 | 0.46 0.04 | -0.11 0.12 | -0.03 0.15 | -0.40 0.18 | – | 1.12 0.23 | AGN1,2,3,4 |
| 72 | 10 49 47.73 | +51 02 19.8 | 1.32 | 0.18 0.05 | 0.18 0.03 | 0.18 0.02 | – | 0.27 0.19 | -0.20 0.19 | -0.05 0.25 | 1.59 0.38 | galaxy6 |
| 73 | 10 49 48.94 | +51 00 01.2 | 0.90 | <6.82 | 0.21 0.04 | 0.23 0.02 | -0.11 0.12 | 0.01 0.15 | -0.35 0.17 | – | 1.08 0.33 | AGN1,2,3,4 |
| 74 | 10 49 50.40 | +51 09 06.5 | 1.83 | <8.41 | 0.21 0.05 | <5.10 | – | – | – | – | – | galaxy6 |
| 75 | 10 49 50.53 | +51 10 00.8 | 1.26 | 0.24 0.07 | N | 0.21 0.06 | -0.19 0.27 | – | – | – | 1.89 0.62 | |
| 76 | 10 49 51.56 | +51 15 32.6 | 1.47 | 0.93 0.19 | 1.03 0.17 | 0.31 0.08 | – | 0.27 0.24 | -0.19 0.25 | – | 2.84 0.44 | Hard source |
| 77 | 10 49 51.36 | +50 51 50.4 | 1.09 | N | 0.52 0.08 | 0.48 0.05 | -0.08 0.13 | -0.12 0.17 | – | – | 1.08 0.26 | galaxy5,6 |
| 78 | 10 49 52.10 | +50 50 16.5 | 1.84 | <6.27 | <4.55 | 0.19 0.06 | – | – | – | – | – | |
| 79 | 10 49 54.59 | +51 05 33.5 | 1.94 | 0.55 0.06 | 0.56 0.04 | 0.35 0.04 | -0.31 0.07 | -0.27 0.11 | -0.28 0.16 | – | 1.56 0.17 | galaxy5,6 |
| 80 | 10 49 55.99 | +51 04 49.3 | 1.02 | 0.24 0.04 | 0.18 0.04 | 0.35 0.03 | -0.20 0.11 | -0.03 0.15 | -0.57 0.18 | -0.24 0.27 | 1.81 0.33 | galaxy6 |
| 81 | 10 49 59.73 | +51 01 21.7 | 1.80 | N | 0.17 0.05 | 0.17 0.05 | – | 0.27 0.26 | -0.65 0.32 | – | 1.19 0.56 | Hard source |
| 82 | 10 50 00.33 | +50 56 03.0 | 0.96 | 0.72 0.08 | 0.69 0.06 | 0.39 0.04 | -0.23 0.12 | -0.32 0.16 | -0.05 0.22 | – | 1.86 0.18 | AGN1,2,3,4 |
| 83 | 10 50 06.53 | +51 05 22.9 | 1.25 | 0.75 0.07 | 0.67 0.06 | 0.42 0.06 | -0.25 0.10 | -0.14 0.13 | -0.35 0.16 | – | 1.73 0.24 | AGN2,6 |
| 84 | 10 50 06.93 | +51 08 11.5 | 2.46 | 0.35 0.09 | 0.39 0.07 | 0.26 0.07 | -0.35 0.15 | -0.67 0.27 | – | – | 1.55 0.44 | |
| 85 | 10 50 08.82 | +51 02 53.0 | 0.64 | 0.90 0.06 | 1.33 0.08 | 0.68 0.04 | -0.12 0.10 | -0.05 0.10 | -0.35 0.11 | – | 1.90 0.13 | AGN2,6,4 |
| 86 | 10 50 09.15 | +51 12 10.6 | 0.84 | 0.80 0.14 | 0.20 0.07 | 0.62 0.10 | – | – | 0.17 0.18 | -0.04 0.22 | 2.39 0.48 | galaxy5,6 |
| 87 | 10 50 09.77 | +51 02 37.4 | 0.95 | 0.45 0.06 | 0.31 0.05 | 0.31 0.04 | -0.15 0.27 | -0.14 0.23 | – | – | 3.94 0.23 | AGN2 |
| 88 | 10 50 10.27 | +50 56 42.9 | 1.37 | 0.26 0.06 | 0.46 0.09 | 0.25 0.04 | – | – | -0.24 0.16 | – | 1.87 0.33 | galaxy5,6 |
| 89 | 10 50 11.67 | +50 59 43.5 | 0.94 | 0.46 0.05 | 0.42 0.04 | 0.35 0.04 | -0.16 0.13 | -0.02 0.15 | -0.32 0.18 | – | 1.13 0.21 | galaxy6 |
| 90 | 10 50 12.05 | +51 06 16.0 | 0.81 | 1.01 0.09 | 0.82 0.06 | 0.80 0.06 | -0.25 0.09 | -0.20 0.12 | – | – | 1.37 0.17 | AGN1 |
| 91 | 10 50 13.46 | +51 10 55.4 | 1.49 | 0.46 0.10 | 0.86 0.08 | 0.43 0.06 | – | – | – | – | 2.14 0.24 | galaxy5,6 |
| 92 | 10 50 13.57 | +51 00 10.5 | 6.70 | 1.29 0.24 | 0.24 0.06 | 0.76 0.15 | – | – | – | – | 5.51 0.46 | |
| 93 | 10 50 22.62 | +51 06 00.5 | 1.39 | 0.29 0.07 | 0.41 0.09 | 0.27 0.05 | – | 0.78 0.19 | -0.12 0.18 | 0.14 0.28 | 1.77 0.41 | Hard source |
| 94 | 10 50 23.25 | +50 54 42.0 | 1.12 | <14.31 | 0.43 0.09 | <6.88 | -0.13 0.24 | – | – | – | – | |
| 95 | 10 50 25.57 | +51 02 50.0 | 1.99 | <9.76 | 0.27 0.07 | 0.27 0.07 | -0.16 0.27 | 0.03 0.31 | – | – | 1.03 0.52 | galaxy6 |
| 96 | 10 50 27.00 | +51 06 32.8 | 1.55 | 0.25 0.08 | N | 0.24 0.04 | – | 0.23 0.19 | – | – | 1.27 0.38 | galaxy5,6 |
| 97 | 10 50 42.20 | +50 58 07.9 | 1.51 | 0.53 0.13 | 0.51 0.08 | 0.48 0.06 | – | 0.44 0.18 | -0.43 0.18 | – | 3.71 0.46 | Hard source |
| : Sources, which are classified in the optical/infrared studies as AGNs or background galaxies. Refrences of the class of object in the avaible calatlogues are (1):The Million | ||||||||||||
| Quasars catalogue (Flesch, 2019), (2): The WISE AGN candidates catalogs (Assef et al., 2018), (3): Quasars selection from SDSS and WISE surveys (Richards et al., 2015), | ||||||||||||
| (4):known QSOs for the Gaia mission (Liao et al., 2019), (5): Star/Galaxy Separation (Vasconcellos et al., 2011), and (6): SDSS11/12 spectroscopic data (Alam et al., 2015). | ||||||||||||
| The details of the publications are given Sect. 4.3. For all these sources the classification was consistent with the classification based on our criteria for background sources. | ||||||||||||
| : ’<’ means 3 upper limits are reported in case of non-detection of the source in the 0.2–12.0 keV band in EPIC-pn and EPIC-MOS cameras. | ||||||||||||
| : ’N’ means that source is located on the gap, damaged pixel, or outside the EPIC field of view. | ||||||||||||
| Src-No | mag | mag | mag | mag | mag |
|---|---|---|---|---|---|
| 2 | 21.45 0.16 | 21.09 0.04 | 20.76 0.05 | 20.24 0.05 | 20.18 0.17 |
| 3 | 21.58 0.11 | 20.75 0.02 | 20.51 0.03 | 20.44 0.04 | 20.25 0.11 |
| 4 | 20.58 0.06 | 20.24 0.02 | 19.67 0.02 | 19.22 0.02 | 18.77 0.04 |
| 6 | 22.17 0.21 | 21.64 0.05 | 21.45 0.05 | 21.34 0.08 | 20.44 0.13 |
| 7 | 23.71 0.64 | 22.80 0.14 | 22.38 0.15 | 22.32 0.23 | 21.59 0.37 |
| 8 | 22.11 0.20 | 21.37 0.04 | 20.82 0.03 | 20.62 0.04 | 20.61 0.15 |
| 9 | 22.26 0.24 | 21.68 0.06 | 21.28 0.07 | 20.50 0.05 | 20.29 0.15 |
| 14 | 23.83 0.61 | 24.05 0.37 | 23.74 0.44 | 22.18 0.18 | 21.57 0.34 |
| 17 | 24.68 1.15 | 23.89 0.41 | 22.34 0.18 | 22.27 0.29 | 23.03 0.76 |
| 18 | 20.54 0.05 | 20.52 0.02 | 20.74 0.03 | 20.55 0.04 | 20.48 0.14 |
| 19 | 25.61 0.66 | 21.56 0.04 | 20.86 0.03 | 20.81 0.05 | 20.53 0.14 |
| 20 | 21.06 0.07 | 21.00 0.03 | 21.21 0.05 | 20.99 0.06 | 20.81 0.17 |
| 23 | 20.07 0.04 | 19.85 0.01 | 19.73 0.01 | 19.55 0.02 | 19.55 0.06 |
| 25 | 22.67 0.29 | 22.21 0.09 | 22.10 0.12 | 21.38 0.11 | 20.86 0.22 |
| 26 | 25.36 0.94 | 23.62 0.29 | 22.58 0.18 | 22.25 0.22 | 22.46 0.70 |
| 28 | 24.10 1.80 | 22.14 0.15 | 21.69 0.15 | 20.78 0.11 | 20.55 0.34 |
| 31 | 23.91 0.61 | 23.62 0.25 | 23.99 0.45 | 22.96 0.34 | 22.80 0.55 |
| 37 | 25.78 0.58 | 22.63 0.11 | 21.80 0.08 | 20.99 0.06 | 20.33 0.12 |
| 39 | 22.92 0.30 | 22.20 0.08 | 22.17 0.11 | 21.49 0.10 | 21.69 0.35 |
| 40 | 18.93 0.02 | 18.74 0.01 | 18.78 0.01 | 18.87 0.01 | 18.75 0.03 |
| 44 | 23.58 0.74 | 23.10 0.26 | 22.43 0.21 | 23.71 0.97 | 22.20 0.78 |
| 46 | 18.73 0.03 | 17.24 0.01 | 16.56 0.01 | 16.13 0.01 | 15.91 0.01 |
| 49 | 22.32 0.18 | 21.07 0.03 | 21.04 0.04 | 20.85 0.06 | 20.82 0.17 |
| 50 | 22.56 0.23 | 22.40 0.09 | 21.73 0.07 | 21.66 0.12 | 21.41 0.28 |
| 52 | 22.04 0.21 | 22.53 0.12 | 21.78 0.09 | 21.8 0.16 | 21.29 0.35 |
| 56 | 23.06 0.52 | 23.15 0.23 | 21.94 0.12 | 21.46 0.13 | 20.63 0.21 |
| 57 | 21.88 0.13 | 20.75 0.02 | 20.34 0.02 | 20.22 0.03 | 19.95 0.08 |
| 59 | 21.68 0.11 | 21.50 0.04 | 21.35 0.05 | 21.25 0.09 | 20.83 0.19 |
| 60 | 25.58 1.10 | 23.46 0.38 | 21.78 0.13 | 21.07 0.12 | 20.07 0.17 |
| 64 | 20.32 0.05 | 20.17 0.01 | 20.05 0.02 | 20.14 0.03 | 20.10 0.10 |
| 65 | 21.49 0.09 | 19.02 0.00 | 17.60 0.01 | 16.62 0.01 | 16.10 0.01 |
| 68 | 23.76 0.78 | 24.16 0.56 | 23.71 0.58 | 21.86 0.20 | 21.49 0.47 |
| 70 | 20.79 0.05 | 20.56 0.02 | 20.51 0.02 | 20.63 0.05 | 20.38 0.12 |
| 71 | 20.44 0.04 | 20.19 0.01 | 20.12 0.02 | 19.91 0.02 | 19.94 0.08 |
| 72 | 22.99 0.38 | 23.93 0.41 | 23.53 0.43 | 21.82 0.17 | 21.02 0.26 |
| 73 | 19.70 0.02 | 19.59 0.01 | 19.49 0.01 | 19.35 0.01 | 19.10 0.04 |
| 74 | 24.92 0.84 | 24.01 0.43 | 22.21 0.14 | 21.48 0.12 | 21.34 0.34 |
| 77 | 20.81 0.09 | 20.21 0.02 | 19.29 0.01 | 18.86 0.01 | 18.50 0.04 |
| 78 | 24.84 0.80 | 23.68 0.27 | 22.02 0.09 | 21.28 0.08 | 21.27 0.27 |
| 79 | 21.31 0.09 | 20.86 0.03 | 20.84 0.04 | 20.63 0.06 | 20.54 0.17 |
| 80 | 22.98 0.42 | 22.91 0.20 | 23.27 0.40 | 22.22 0.27 | 21.56 0.47 |
| 82 | 20.86 0.07 | 20.61 0.02 | 20.41 0.02 | 20.37 0.03 | 20.40 0.15 |
| 83 | 22.12 0.17 | 22.02 0.07 | 21.39 0.06 | 21.27 0.09 | 21.22 0.28 |
| 84 | 23.94 0.69 | 22.75 0.14 | 22.69 0.21 | 22.54 0.29 | 21.63 0.40 |
| 85 | 23.93 0.65 | 22.61 0.12 | 21.11 0.05 | 20.42 0.04 | 20.11 0.10 |
| 86 | 23.26 0.61 | 20.84 0.03 | 19.87 0.02 | 19.45 0.02 | 19.19 0.05 |
| 88 | 20.02 0.06 | 18.97 0.01 | 18.22 0.01 | 17.81 0.01 | 17.54 0.02 |
| 89 | 21.56 0.11 | 21.60 0.05 | 21.53 0.07 | 21.30 0.09 | 21.38 0.33 |
| 90 | 22.12 0.17 | 21.96 0.07 | 21.73 0.08 | 21.39 0.10 | 21.30 0.29 |
| 91 | 21.45 0.09 | 21.04 0.03 | 20.59 0.03 | 20.34 0.03 | 19.82 0.08 |
| 92 | 23.33 0.41 | 21.27 0.03 | 20.06 0.02 | 19.58 0.02 | 19.44 0.05 |
| 95 | 24.75 1.55 | 22.72 0.26 | 21.53 0.14 | 21.13 0.16 | 20.55 0.31 |
| 96 | 21.79 0.17 | 21.31 0.05 | 19.82 0.02 | 19.28 0.02 | 18.95 0.06 |
| Src-No | mag | mag | mag | mag | mag | mag | mag |
| 2 | 16.77 0.08 | 15.98 0.15 | <12.69∗ | <9.06∗ | |||
| 4 | 15.34 0.03 | 14.59 0.05 | 12.29 0.33 | <8.53∗ | |||
| 6 | 16.33 0.06 | 15.94 0.13 | <12.40∗ | <8.34∗ | |||
| 8 | 16.40 0.06 | 15.36 0.08 | <12.29∗ | <8.79∗ | |||
| 9 | 16.23 0.06 | 15.68 0.12 | <12.18∗ | <8.83∗ | |||
| 14 | 16.65 0.07 | 15.89 0.12 | <12.83∗ | <9.32∗ | |||
| 17 | 16.54 0.07 | 15.82 0.12 | <12.63∗ | <9.13∗ | |||
| 18 | 17.89 0.21 | 16.34 0.20 | <12.17∗ | <9.09∗ | |||
| 19 | 17.46 0.14 | 16.26 0.17 | 12.41 0.43 | <8.91∗ | |||
| 20 | 17.38 0.14 | 16.26 0.17 | <12.55∗ | <8.64∗ | |||
| 23 | 16.43 0.06 | 15.03 0.07 | 12.52 0.44 | 8.78 0.37 | |||
| 25 | 16.83 0.08 | 16.02 0.15 | <12.08∗ | <8.90∗ | |||
| 26 | 17.10 0.10 | 16.30 0.18 | <12.40∗ | <8.80∗ | |||
| 28 | 16.88 0.09 | 16.84 0.31 | <12.21∗ | <9.09∗ | |||
| 29 | 16.91 0.09 | <16.78∗ | <12.44∗ | <9.08∗ | |||
| 30 | 17.08 0.10 | 16.09 0.15 | 12.64 0.45 | <8.87∗ | |||
| 31 | 16.76 0.08 | 15.92 0.13 | 12.51 0.44 | <8.78∗ | |||
| 37 | 16.23 0.05 | 16.36 0.18 | <12.87∗ | <9.13∗ | |||
| 38 | 17.54 0.15 | 16.84 0.29 | <12.36∗ | <8.86∗ | |||
| 39 | 17.46 0.15 | 16.79 0.30 | <12.43∗ | <8.77∗ | |||
| 40 | 14.87 0.03 | 13.81 0.03 | 11.33 0.14 | 8.59 0.24 | |||
| 43 | 17.86 0.20 | <16.78∗ | <12.67∗ | <8.86∗ | |||
| 45 | 16.63 0.07 | 15.64 0.10 | 12.47 0.42 | <8.60 ∗ | |||
| 46 | 15.76 0.11 | 15.28 0.13 | 14.62 0.10 | 13.79 0.04 | 13.38 0.05 | 9.56 0.06 | 7.08 0.13 |
| 50 | 16.14 0.06 | 15.55 0.13 | 12.59 0.50 | 9.29 0.52 | |||
| 51 | 17.42 0.14 | 16.43 0.21 | <12.31∗ | <9.18∗ | |||
| 52 | 16.90 0.08 | 16.14 0.16 | <12.79∗ | <9.12∗ | |||
| 53 | 16.88 0.09 | 16.06 0.15 | <12.69∗ | <9.12∗ | |||
| 56 | 16.92 0.10 | 16.55 0.24 | <12.71∗ | <8.76∗ | |||
| 58 | 17.45 0.15 | 16.64 0.26 | <12.45∗ | <8.46∗ | |||
| 59 | 17.77 0.19 | 17.19 0.39 | <12.20∗ | <8.71∗ | |||
| 60 | 15.66 0.04 | 14.60 0.04 | 11.51 0.17 | 9.00 0.46 | |||
| 65 | 14.81 0.04 | 14.23 0.04 | 13.95 0.04 | 13.83 0.03 | 13.69 0.03 | 12.54 0.53 | <9.07∗ |
| 67 | 17.13 0.11 | 16.54 0.24 | <12.14∗ | <8.76∗ | |||
| 69 | 17.72 0.18 | 16.16 0.17 | 12.06 0.33 | <8.54∗ | |||
| 71 | 15.57 0.04 | 14.65 0.05 | 12.46 0.47 | <8.39∗ | |||
| 72 | 16.60 0.07 | 16.12 0.16 | <12.74∗ | <9.06∗ | |||
| 73 | 16.03 0.05 | 14.60 0.05 | 10.99 0.12 | <8.64∗ | |||
| 77 | 15.45 0.03 | 15.12 0.07 | 12.46 0.42 | <8.46∗ | |||
| 79 | 16.70 0.08 | 16.33 0.19 | <12.29∗ | <8.96∗ | |||
| 82 | 16.31 0.06 | 15.23 0.07 | 12.52 0.46 | <8.59∗ | |||
| 83 | 16.58 0.07 | 15.56 0.10 | <12.41∗ | <9.07∗ | |||
| 85 | 15.21 0.03 | 13.96 0.03 | 11.56 0.21 | <8.42∗ | |||
| 86 | 15.69 0.04 | 15.07 0.06 | 12.71 0.46 | <9.22∗ | |||
| 87 | 16.96 0.09 | 15.86 0.12 | <12.63∗ | <8.52∗ | |||
| 88 | 16.72 0.14 | <15.67∗ | 15.40 0.18 | 14.90 0.03 | 14.63 0.06 | 11.05 0.12 | <9.07∗ |
| 89 | 15.80 0.04 | 15.60 0.10 | 12.31 0.37 | <8.78∗ | |||
| 90 | 16.38 0.06 | 16.08 0.15 | 12.64 0.42 | <8.61∗ | |||
| 91 | 16.38 0.05 | 15.95 0.12 | <12.47∗ | <8.80∗ | |||
| 95 | 17.48 0.14 | 16.62 0.24 | <12.79∗ | <9.10∗ | |||
| 96 | 15.50 0.04 | 15.20 0.07 | 12.28 0.34 | <8.51∗ | |||
| 97 | 15.66 0.04 | 15.01 0.07 | <12.02∗ | <8.55∗ | |||
| : Upper limit reported in the WISE catalogue. | |||||||
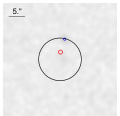
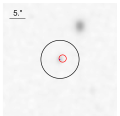
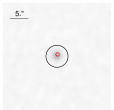
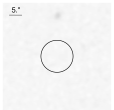
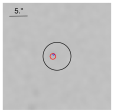
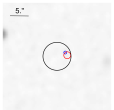
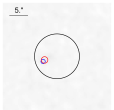
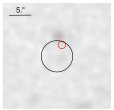
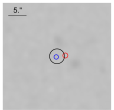
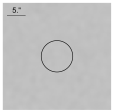
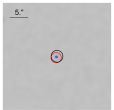
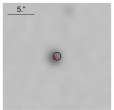
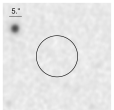
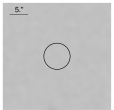
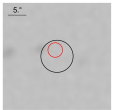
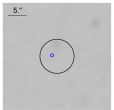
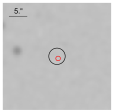
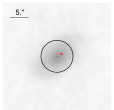
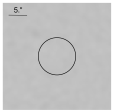
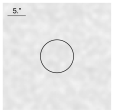
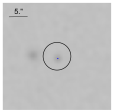
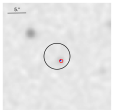
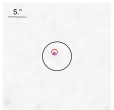
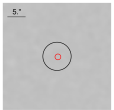
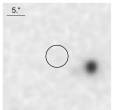
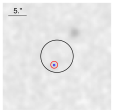
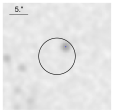
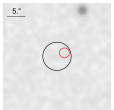
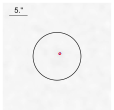
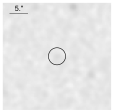
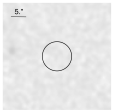
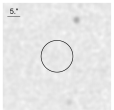
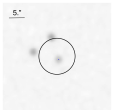
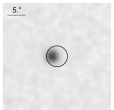
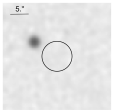
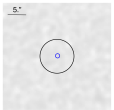
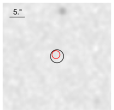
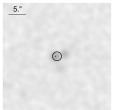
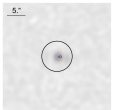
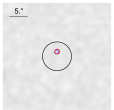
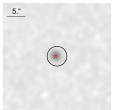
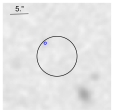
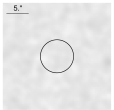
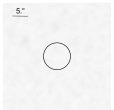
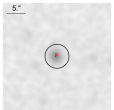
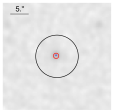
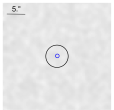
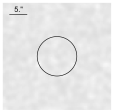
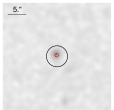
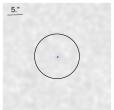
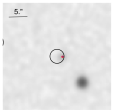
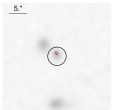
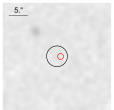
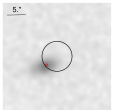
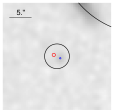
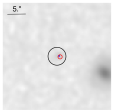
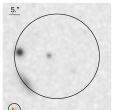
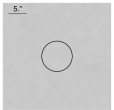
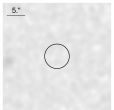
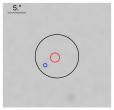
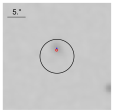
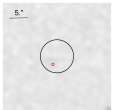
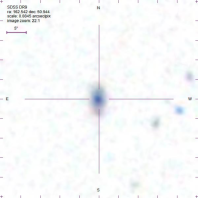
Appendix B Image of optical SDSS9 counterparts
The optical image of the counterpart of the X-ray sources from the SDSS9 survey. The images are the band of SDSS survey. Images shows 3 circle error of X-ray sources (black), optical counterparts (blue) and infrared counterpart (red).