Rotational spectral modulation of cloudless atmospheres for L/T Brown Dwarfs and Extrasolar Giant Planets
Abstract
Aims. The rotational spectral modulation (spectro-photometric variability) of brown dwarfs is usually interpreted as a sign of the presence of inhomogeneous cloud covers in the atmosphere. This paper aims at exploring the role of temperature fluctuations in these spectral modulations. These fluctuations could naturally arise in a convective atmosphere impacted by diabatic processes such as complex chemistry, i.e. the recently proposed mechanism to explain the L/T transition: CO/CH4 radiative convection.
Methods. After exploring the observed spectral-flux ratios between different objects along the cooling sequence, we use the 1D radiative/convective code ATMO with ad-hoc modifications of the temperature gradient to model the rotational spectral modulation of 2MASS 1821, 2MASS 0136, and PSO 318.5-22. We also explore the impact of CH4 abundance fluctuations on the spectral modulation of 2MASS 0136.
Results. The spectral-flux ratio of different objects along the cooling sequence and the rotational spectral modulation within individual objects at the L/T transition have similar characteristics. This strongly suggests that the main parameter varying along the cooling sequence, i.e. temperature, might play a key role in the rotational spectral modulations at the L/T transition. Modeling the spectral bright-to-faint ratio of the modulation of 2MASS 1821, 2MASS 0136, and PSO 318.5-22 shows that most spectral characteristics can be reproduced by temperature variations alone. Furthermore, the approximately anti-correlated variability between different wavelengths can be easily interpreted as a change in the temperature gradient in the atmosphere which is the consequence we expect from CO/CH4 radiative convection to explain the L/T transition. The deviation from an exact anti-correlation could then be interpreted as a phase shift similar to the hot-spot shift a different bandpasses in the atmosphere of hot Jupiters.
Conclusions. Our results suggest that the rotational spectral modulation from cloud-opacity and temperature variations are degenerate. If the nearly anti-correlated signal between different wavelengths is indeed a strong sign of a change in the temperature gradient, the detection of direct cloud spectral signatures, e.g. the silicate absorption feature at 10 m, would help to confirm the presence of clouds and their contribution to spectral modulations (which does not exclude temperature variations or other mechanisms to be also at play). Future studies looking at the differences in the spectral modulation of objects with and without the silicate absorption feature may give us some insight on how to distinguish cloud-opacity fluctuations from temperature fluctuations.
Key Words.:
(Stars:) brown dwarfs, planets and satellites: gaseous planets, planets and satellites: atmospheres, convection1 Introduction
One of the key feature of brown dwarfs at the L/T transition is the rotational spectral modulation (spectroscopic variability) of the object (see Biller, 2017; Artigau, 2018, for a review). Spectral modulations are of great interest since they open the possibility to probe spatial variations in the vertical structure of the atmospheric columns, as different wavelengths probe different pressure levels. Up to now, most of the spectroscopic modulations have been observed using the Wide Field Camera 3 aboard the Hubble Space Telescope (HST) (e.g., Buenzli et al., 2012; Apai et al., 2013), and a wealth of new data will be brought to the community by the James Webb Space Telescope (JWST). Among the principal characteristics of the rotational spectral modulations observed by HST is the presence of increased variability amplitude within the 1.45 m water absorption feature and, for L-type dwarfs, the apparent absence of differential modulations in- and out of the water band (Yang et al., 2015). Simultaneous HST and Spitzer time-resolved observations found prominent phase shifts between lightcurves observed at different wavelength (i.e., pressure levels). Buenzli et al. (2012) found a pressure-dependent phase shift pattern in the late-T dwarf 2M2228, a pattern that was found again, years later (Yang et al., 2016). Similarly, Biller et al. (2018) detected very large phase shifts in the planetary-mass brown dwarf PSO 318.5-22. Yang et al. (2016) reported phase shifts in some brown dwarfs (with values ranging from 30 to 180 degrees). In contrast, Apai et al. (2013) showed that no phase shifts are present in two L/T transition brown dwarfs. These patterns are not yet understood, but the fact that they appear to be stable for a given object over hundreds of rotational periods suggests that the large-scale horizontal-vertical structures they trace are characteristic to the objects and, thus, may hold important clues to the nature of the spatial-spectral differences observed (although Luhman 16B can show really significant changes from night to night, e.g. Gillon et al., 2013). Medium-resolution spectroscopy (at spectral resolving power R 4,000) has also been used to study spectral variability on Luhman 16AB exploring variability at the resolution of spectral lines (e.g. KI absorption feature Faherty et al., 2014; Kellogg et al., 2017). High-resolution spectroscopy enabled Doppler imaging to create possible maps of the the brightness variations of Luhman 16B (Crossfield et al., 2014).
The observed photometric and spectral modulations are often interpreted as due to the presence of an inhomogeneous cloud cover in the atmosphere (e.g. Marley et al., 2010). While highest-amplitude (J-band) modulations are found at the L/T transition for old field objects (Radigan et al., 2014) and should probe deep clouds in the atmosphere of old, high surface gravity objects, a physical understanding of why the spatial structure of clouds should change at the L/T transition is still currently lacking. Robinson & Marley (2014) has also proposed that temperature fluctuations can also be responsible for spectroscopic variability and could potentially explain, in part, the pressure-dependent phase shifts observed in 2M2228 by Buenzli et al. (2012). However, Radigan et al. (2012); Apai et al. (2013) looked into effective temperature variations only (i.e., by modeling the spectral modulations via linear combinations of two one-dimensional atmosphere models that differed in effective temperature, but not in the cloud prescription) and have found that it cannot explain the changes in broadband, near-infrared colors.
Tremblin et al. (2015, 2016, 2017) have shown that the spectra and luminosity of L/T transition brown dwarfs, along with the reddest low-gravity objects, can be reproduced by cloudless models with a reduced temperature gradient. So far, spectroscopic variability arising from a change in the temperature gradient of the atmosphere (which is different from a change of effective temperature) has never been explored in the literature. Tremblin et al. (2019) has shown that such a reduced gradient should indeed be expected when convection is impacted by thermal and compositional diabatic processes: diabatic convection leads to thermohaline and moist convection in Earth’s atmosphere and oceans, reducing their temperature gradient. In brown dwarfs, CO/CH4 (and N2/NH3) radiative convection is a direct analog and should also reduce the temperature gradient of the atmosphere. When CO in the atmosphere is converted into CH4 the diabatic processes stop and the convective system switches between the diabatic and adiabatic convective behavior (a so-called “cooling crisis” by analogy to the boiling crisis in two-phase convective flows Tremblin et al., 2019).This could naturally explain the L/T transition with an increase of the temperature that could also naturally reproduce the J-band brightening and FeH resurgence at the transition. Since we expect a change in the temperature gradient of the atmosphere at the L/T transition in this scenario, it is natural to expect rotational spectral modulations to arise from spatial thermal inhomogeneities in the atmosphere.
In this paper, we explore the possibility of reproducing representative examples of observed spectral modulations by introducing temperature variations in the atmosphere. We first study the HST spectral evolution of different objects along the cooling sequence of brown dwarfs and describe the model used for the spectral modeling (Sect. 2). Then we model the HST rotational spectral modulation of the L dwarf 2MASS J18212815+1414010 (2MASS 1821 hereafter) and the T dwarf 2MASS J01365662+0933473 (2MASS 0136 hereafter) (Sect. 3.1), and the HST and Spitzer variability of PSO 318.5-22 (Sect. 3.2). We finally discuss the impact of the modulations on the JWST spectral coverage (Sect. 3.3) and the impact of CH4 variations in the T-dwarf regime (Sect. 3.4) before reaching our conclusions and discussion (Sect. 4).
2 Spectral evolution along the cooling sequence and model description
2.1 Spectral evolution along the cooling sequence of brown dwarfs
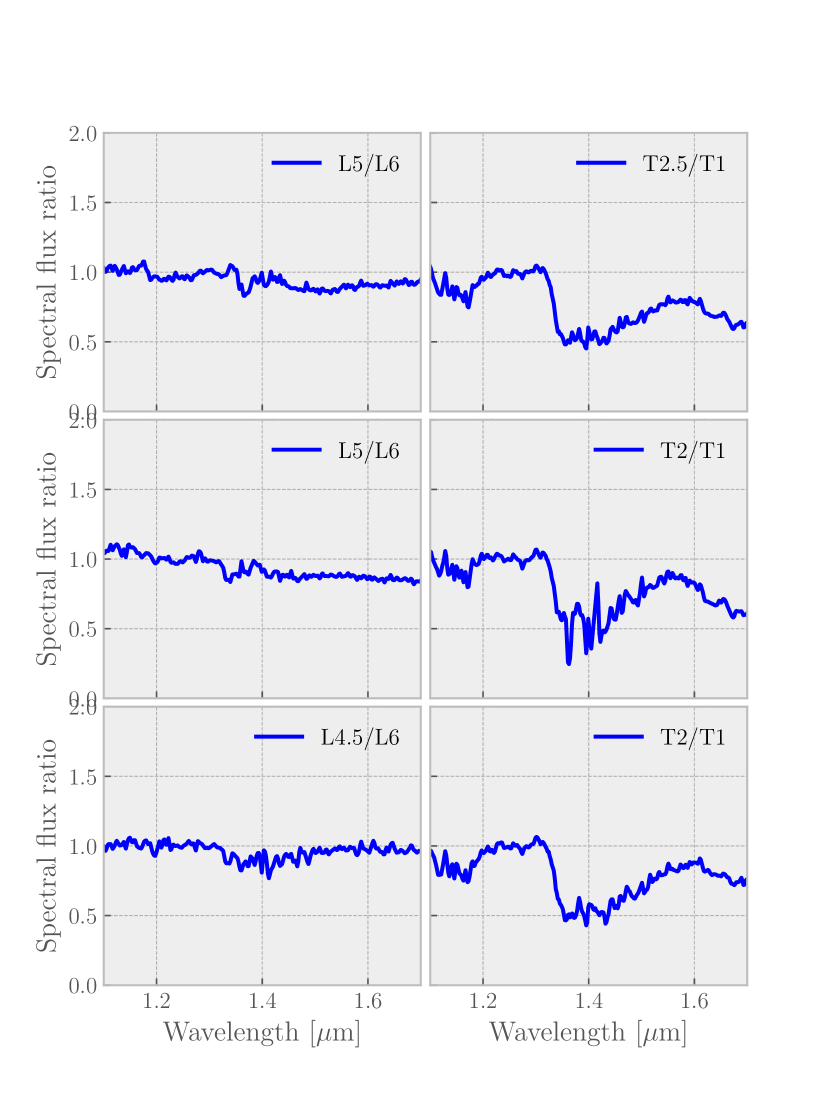
We first look at the spectral evolution of objects of different spectral types along the cooling sequence. We assume that they do not show internal spectroscopic modulations but look at the relative change between different spectral types at different stages in the cooling sequence. Figure 1 shows the observed spectral-flux ratios in WFC3/IR/G141 bandpass for different objects along the cooling sequence, at the L/T transition, for late L dwarfs (ratio of L4.5/L5 to a L6) and early T dwarfs (ratio of T2/T2.5 to a T1). The spectral ratio for L dwarfs is essentially flat with no spectral signature. On the contrary, a strong signature can be identified in the spectral ratio for T dwarfs with a suppressed absorption amplitude in the 1.4-m water band relative to the adjacent continuum. Therefore, the evolution of the relative water amplitude as a function of spectral type along the cooling sequence is similar to the spectral modulations of this feature in individual mid-L and T brown dwarfs (e.g. Yang et al., 2015). This similarity between the spectral evolution along the cooling sequence and the rotational spectral modulations within individual objects has also been pointed out by Kellogg et al. (2017).
Given the similarity, we can expect that the main parameter changing along the cooling sequence (i.e., temperature) might also play a significant role in the rotational spectral modulations of individual objects. Thus, this similarity suggests that spatial variations may exist in the pressure-temperature profiles within individual brown dwarfs. Although Radigan et al. (2012) and Apai et al. (2013), among others, have shown that variations in the effective temperature alone cannot reproduce the observed rotational color modulations, it is likely that a combination of the parameters evolving along the cooling sequence and including the effective temperature can reproduce the spectral modulations. The recent introduction of temperature gradient modifications (Tremblin et al., 2015) motivates the exploration of temperature-gradient fluctuations as such a possible source of spectral modulations in the atmospheres of brown dwarfs.
2.2 Model description
Although spatial inhomogeneities leading to rotational modulations can be long-lived stationary patterns, it is likely that, in general, such inhomogeneities are associated with a time-dependent process on some finite timescale. Strictly speaking, this implies that one should model these patterns with a multi-dimensional, time-dependent simulation that is capable of capturing the appropriate physics on the adequate length- and timescales (e.g., hydrodynamics including convection, chemical reactions, radiative transfer). Strictly speaking, stationary 1D codes are not appropriate for such studies since spatial inhomogeneities and time variability violate the homogeneous and stationary assumptions. Nonetheless, 3D time-dependent tools are very challenging to build (if not impossible depending on the needed length- and timescales) and in this paper, we adopt a much simpler approach, based on 1D models. This simpler and more efficient approach, however, comes with some caveats.
We use the 1D atmospheric code ATMO that has been previouly used to model the spectra of a broad range of different brown dwarfs (Tremblin et al., 2015, 2016, 2017; Phillips et al., 2020). The radiative transfer scheme is described in Amundsen et al. (2014, 2016) and the chemistry scheme in Drummond et al. (2016) and Goyal et al. (2018) for rainout. The chemistry includes 279 species for gas phase chemistry, ions chemistry, and condensible species. The radiative transfer uses 22 opacity sources (H2-H2 CIA, H2-He CIA, H2O, CO, CO2, CH4, NH3, Na, K, L, Rb, Cs, TiO, VO, FeH, PH3, H2S, HCN, C2H2, SO2, Fe, H- free-free and bound-free) including also Rayleigh scattering.
Depending on global parameters such, as effective temperature and surface gravity log(g), the code finds a time-independent pressure/temperature (PT) structure that satisfies hydrostatic equilibrium and energy conservation either with radiative energy transport or convective energy transport (often referred as 1D self-consistent model). Tremblin et al. (2016) has found that the observed low near-infrared fluxes can be very well reproduced if the temperature in the atmosphere is lower than what is predicted by radiative/convective equilibrium-based model. This effect is a possible natural consequence of diabatic convection in the form of CO/CH4 radiative convection in the brown dwarf context. This is mimicked in ATMO by a reduction of the adiabatic index to an effective index in between two pressure levels and that reduces the adiabatic gradient followed by convection in a given region.
For clarity, we list below the different approximations to keep in mind when using such a code to study rotational modulations:
-
•
Since the code is stationary and 1D, a first approximation is to model the bright and faint states of the spectral modulation with a combination of 1D PT profiles. Since the code only solves for the hydrostatic balance in 1D, we can only model local ad-hoc temperature and compositional variations and we cannot self-consistently model 3D dynamical processes like convection and winds and explore directly the lightcurve time evolution. We therefore focus our study on modeling the spectral characteristics of the bright-to-faint ratio of the spectral modulations.
-
•
Since the code finds a solution for some global parameters, we will modify the PT profile in an ad-hoc way to mimick a bright or faint modulation (Sect. 3.1) or modify directly the global parameters to model the hemispherically averaged bright state (Sect. 3.2). The exact value of these parameters is therefore not really meaningful (also probably degenerate) and only the resulting difference in the PT profile in the regions that do impact the observed spectrum really makes sense.
-
•
In ATMO, chemistry is solved at equilibrium or is coupled to a full chemical network (Venot et al., 2012), finding the stationary solution of the chemical kinetic equations on a very long timescale (typically 1012 s) with vertical quenching (see for details Tremblin et al., 2015). Since we do not know a-priori the impact of horizontal quenching caused by winds and convection, we do not know which chemical species is at chemical equilibrium or horizontally-quenched by the dynamics. Therefore, for simplicity, we assume the two limit cases: chemical abundances are at equilibrium in the modulation or are kept constant to the abundances of the background PT profile. Furthermore we simplify vertically-quenched out-of-equilibrium chemistry by assuming a fixed and constant abundance profile of CH4 needed to reproduce the spectrum. In Sect. 3.1 and Sect. 3.2, the CH4 abundance is therefore kept constant and we explore the variability associated to CH4 abundance fluctuations in Sect. 3.4.
| 2M 1821 | 2M 0136 | |
|---|---|---|
| Teff | 1650 | 1400 |
| logg | 4.5 | 5 |
| 1.05 | 1.15 | |
| [bar] | 6.310-1 | 1.5 |
| [bar] | 6.3101 | 5102 |
| [M/H] | 0 | 0 |
| X(CH4) | 810-5 | |
| [bar] | 7.110-1 | 3.7 |
| [bar] | 2.8102 | 5.4101 |
| [K] | ||
| [K] | 138 | 440 |
| 0.07 | 0.16 |
3 Results on spectral variability modeling
3.1 Variability of 2MASS 1821 and 2MASS 0136
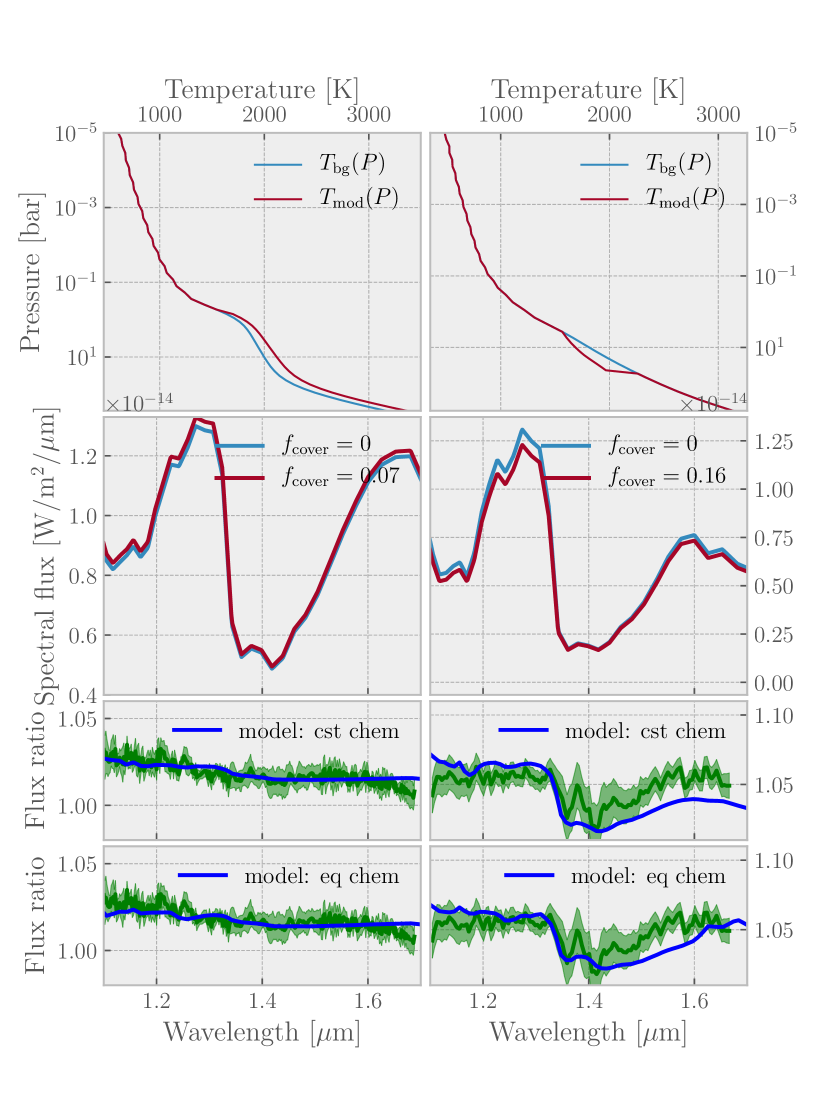
As a first application, we study the spectral modulations observed by HST in the L5 dwarf 2M 1821 and in the T2 dwarf 2M 0136 (Yang et al., 2015). For these objects, we first compute a background model with a PT profile given by and a parametrization of the PT profile of a modulation, given by Eq. 1.
| (1) |
with the optical depth profile at a wavelength of 1.25 m. We then compute the total flux by
| (2) |
with and the surface fluxes computed with the background and modulation PT profile, respectively. In Tab. 1, we summarize the parameters that we have used to model the bright and faint states of these two dwarfs. The abundance of CH4 used for 2M 1821 is low because CH4 is not sufficiently abundant in the L-dwarf regime to be observable yet. In the T-dwarf regime, for 2M 0136, CH4 begins to be observable. We keep its abundance constant in this section but explore the effect of spatial variations in its abundance in a dedicated section (Sect. 3.4). in Fig. 2, we show the resulting PT profiles, spectra, modeled spectral ratio, compare it to the observed spectral ratio from Yang et al. (2015). We find that a covering fraction between 7 % and 16 % is needed to reproduce the observations, however, the covering fraction is highly degenerate with the magnitude of the modulations in the PT profiles. Both models seem to reproduce well the 1.1-1.5 m part of the spectrum, but deviate in the 1.5-1.7 m region. Nevertheless, we find that the main characteristics i.e. the presence/absence of increased variability amplitude within the 1.45 m water absorption feature, are well reproduced. Overall, assuming constant abundances from the background PT profile or chemical equilibrium in the modulation profile does not seem to significantly change the flux ratio in the HST WFC3 bandpass (see Sect. 3.3 and 3.4 for the impact on the JWST spectral coverage). Equilibrium chemistry seems to produce a slightly better agreement with the data. This level of agreement is relatively good since the parameter is explored manually, a better match could potentially be achieved by automatic algorithms and bayesian analysis. However, we emphasize again that these modifications are probably degenerate and another combination could lead to a similar result. We point out that 2M 0136 is likely a member of the Carina-Near moving group (Gagné et al., 2017) whith an estimated age of 200 Myr. Looking at evolutionary models between 120 and 500 Myr (Phillips et al., 2020), we expect a surface gravity of 4.5-5.0 for the effective temperature of 2M 0136, which is consistent with the surface gravity we have used in the model. Despite being a moving group member, 2M 0136 is not necessary a low-surface gravity object, hence we do not expect our results to be affected by its young age.
| PSO 318.5-22 | ||
| bright | faint | |
| Teff | 1275 | 1275 |
| 1.028 | 1.03 | |
| Pγ,min [bar] | 710-2 | 610-2 |
| Pγ,max [bar] | 10 | |
| logg | 3.7 | |
| [M/H] | 0.4 | |
| X(CH4) | ||
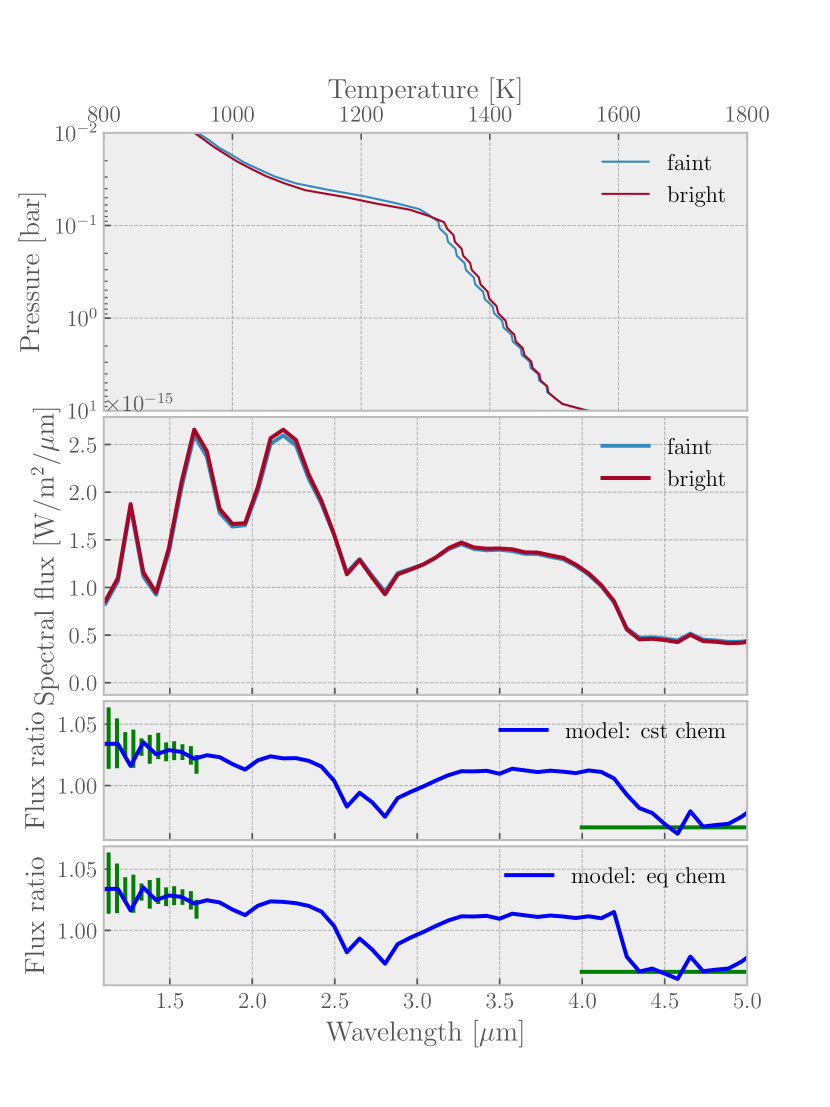
3.2 Variability of PSO 318.5-22
We now turn to the spectroscopic variability of PSO 318.5-22 and its observed 200∘ phase shift between near- and mid-infrared signals. The simultaneous HST-WFC3 (G141 grism) and Spitzer-IRAC (channel 2, central wavelength 4.5 m) modulations of the free-floating planetary-mass object PSO 318.5-22 has been recently observed by Biller et al. (2018). These HST observations were five orbits long and catch a lightcurve maximum in orbit 3 and get close to two minima with different modulations in orbit 1 and 5. The strong reddening and absence of strong CH4 signature in the spectrum of PSO 318.5-22 suggests that this object falls into the L-dwarf regime (Tremblin et al., 2017). This seems to be confirmed by the absence of increased variability in the 1.4-m water feature for the orbit 3/orbit 5 ratio in Biller et al. (2018) (uncertainties about this absence remain given the error bars and the orbit 3/orbit 1 ratio). As such, the spectral signatures of CH4 are essentially absent and we use similarly to 2M 1821 a low CH4 abundance to reproduce the main spectral characteristics (see Tab. 2). The other parameters, e.g., effective temperature, surface gravity, metallicity, are similar to the model used in Tremblin et al. (2019).
Given the uncertainties in the modulations observed in PSO 318.5-22, we have obtained a good model match with a simple 1D hemispheric-averaged bright and faint state, hence we do not use here a more complex model. In Fig. 3, we show the PT structures, spectra, and the modeled and observed spectal ratios. The observational data are taken from Biller et al. (2018), using the orbit 3/orbit 5 ratio of the WCF3 observations and a ratio of -3.40.1% in Spitzer IRAC channel 2, under the approximation that HST and Spitzer data are nearly anti-correlated. The modeled spectral ratio shows that we can reproduce relatively well the spectral modulations in the WCF3 bandpass and, at the same time, the anti-correlated variability in IRAC Channel 2. This mechanism can be described easily: since HST and Spitzer data are probing different pressure levels, an increase in the HST flux and a decrease in the Spitzer flux can be interpreted as an increase of temperature in the layers probed by HST and a decrease of temperature in the layers probed by Spitzer. This can be interpreted as a change in the temperature gradient between the two pressure levels. Indeed, the PT structures in Fig. 3 shows that the temperature for pressures lower than 10-1 bar is decreasing going from faint to bright whereas the temperature is increasing for pressures higher than 10-1 bar. Such a change in the temperature gradient has been proposed to be at the origin of the L/T transition in Tremblin et al. (2016) and has been shown to be a natural consequence of CO/CH4 radiative convection in Tremblin et al. (2019). We will discuss in Sect. 4 the possible implications of the departure from an exact anti-correlation between HST and Spitzer data since we cannot address this point with a simplistic 1D approach.
3.3 Extrapolation for the JWST spectral coverage
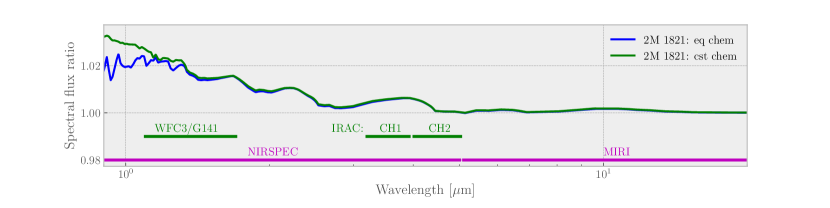
We show in the top panel of Fig. 4, the models for the spectral ratio of 2M 1821 assuming equilibrium chemistry or constant chemistry in the modulation between 0.9 and 20 m. While the differences between the two types of model are small in the HST WFC3 bandpass, they are relatively large in the spectral window that can be explored with NIRSPEC at short wavelengths. The bright-to-faint spectral ratio of 2M 1821 is smaller for equilibrium chemistry at wavelengths smaller than 1.1 m that can be explored with NIRSPEC. The smaller spectral ratio is because of the larger difference in FeH abundance between the bright and faint states in the equilibrium chemistry model. NIRSPEC will therefore be able to probe the impact of FeH on spectral modulations of brown dwarfs and give constrains on the timescale and kinetics on which the molecule is able to form in the modulations. The bright-to-faint spectral ratio of 2M 0136 is mainly impacted by CH4 abundance variations and will be investigated in a dedicated section (Sect. 3.4) since the carbon chemistry is known to be out-of-equilibrium in brown-dwarf atmospheres (Fegley & Lodders, 1996).
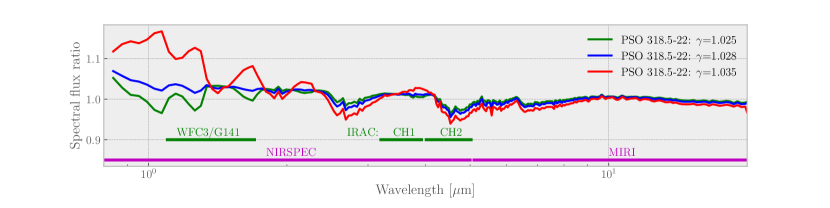
We show in the bottom panel of Fig. 4, the models for the spectral ratio of PSO 318.5-22 with different values (different temperature gradient) in the bright state, between 0.9 and 20 m. An increase in the temperature gradient in the bright phase (= 1.035) results in a larger spectral ratio in the NIRSPEC spectral coverage relative to the MIRI bandpass, which enhances the difference in anti-correlated spectral ratios between the near-IR and mid-IR. A decrease in the temperature gradient in the bright phase (=1.025), however, can remove the anti-correlation between the window at 1.05-1.25 m and mid-IR. The difference in the spectral ratio between near-IR and mid-IR is therefore quite sensitive to modulations in the tempetature gradient in the atmopshere.
We point out that the models presented in this paper have been constrained to reproduce the bright-to-faint spectral ratios in the HST WFC3 and Spitzer channel 2 bandpasses. The spectral ratios at other wavelengths are extrapolations and not really predictions: observed deviations to these models might simply mean that the models need to include temperature-gradient modulations e.g. higher up in the atmosphere to reproduce longer wavelengths that generally probe lower pressures. Nonetheless, it is interesting to note that our models have little variability at long wavelengths around 10 m. This window could therefore be used to probe modulations that could arise from spatial inhomogeneities in the abundance of silicates. It could, therefore, help to disentangle between spatial inhomogeneities of the temperature gradient and spatial inhomogeneities of a silicate cloud layer. Additional models that include clouds and reproduce the 10-m silicate feature will be needed to constrain the amplitude of the homogenities required to have a sufficiently high SNR to detect with MIRI a potential modulation at 10 m caused by clouds.
3.4 Variability associated with CH4 abundance variations
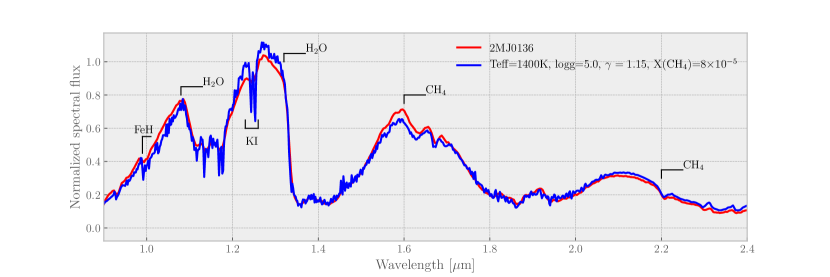
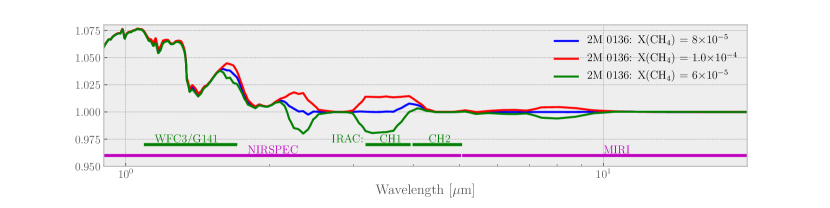
In Sect. 2 and 3, we have modeled out-of-equilibrium chemistry by keeping the CH4 abundance constant. This is justified for 2M 1821 and PSO 318.5-22 since these dwarfs are in the L-dwarf regime: CH4 is not sufficiently abundant to impact significatively the spectrum, hence there is no modulations associated to CH4 abundance fluctuations to expect. This is not the case for 2M 0136 which is in the T-dwarf regime. Figure 5 shows the observed SpeX prism spectrum of 2M 0136 and the ATMO model that we have used for the background state. In addition to FeH, H2O, and the KI lines, CH4 spectral signatures are clearly visible at 1.6 and 2.2 m. We have constrained an abundance of 810-5 (mole fraction) to reproduce the observed spectrum. The equilibrium abundance profile of CH4 reaches such an abundance at a pressure level of 1.5 bar. We have estimated a difference of 1 % in the CH4 mole fraction at this level induced by the modulation. This is mainly because the quenching pressure is higher than the regions in which we change the temperature (top pressure is at 3.7 bar see Tab. 1). Under the assumption of vertical quenching of CO/CH4 chemistry, we would expect the same level of difference in the quenched part of the CH4 abundance profile. By varying the CH4 abundance at 1 % with respect to the background quenched value, we have observed negligible differences in the spectral modulation. We have therefore computed models with a much larger fluctuation with a reduced or increased CH4 abundance of 25 % to explore the impact of CH4 on spectral modulations in the JWST spectral coverage. The resulting spectral ratio are shown in Fig. 6. This large-amplitude (25%-level) abundance modulation has a clearly visible impact at 1.6-1.7, 2.0-2.5, 3.0-4.0, and 7.0-9.5 m. A 25%-level modulation in CH4 abundance can be expected if we extend the modulation of the temperature gradient to higher up in the atmosphere, such a level is obtained for bar for the 2M 0136 model. Such modulations of the temperature gradient in the region around one bar could, therefore, explain the possible CH4 variability detection in the spectrum of the very red L-dwarf companion VHS J1256-1257b obtained by Zhou et al. (2020) and could be further constrained with future JWST observations.
4 Conclusions and discussion
We have shown in this paper that:
-
•
The evolution of the HST spectral-flux ratio between different objects along the cooling sequence of brown dwarfs from late-L to early-T has similar characteristics to the spectral rotational modulations in individual objects at the L/T transition. This suggests that the main parameter that varies during the cooling sequence, i.e. temperature, might play a significant role in the rotational modulations of objects at the L/T transition.
-
•
By varying the temperature gradient in the structure of T and L dwarfs cloudless models, we are indeed able to reproduce the presence or absence of increased variability amplitude within the 1.45 um water absorption feature in the HST spectral modulation.
-
•
By changing the temperature gradient in the atmosphere, we are also able to reproduce the nearly anti-correlated modulation between HST and Spitzer data for PSO 318.5-22. This signature fits with our interpretation that a modification of the temperature gradient is responsible for the L/T transition and could be the natural consequence of CO/CH4 radiative convection.
-
•
The impact of CH4 abundance variations is negligible for the spectral modulations of the objects studied in this paper (around 1 % abundance variations), however, temperature variations higher up in the atmosphere could lead to stronger variability associated to such CH4 abundance variations.
Future spectral-modulation studies with the large spectral coverage of, e.g., JWST on early and late T dwarfs might help identifying spectral modulations associated to CH4. For early T dwarfs, CH4 abundance fluctuations can impact a large part of the atmosphere because of out-of-equilibrium chemistry and these signatures could be interesting to probe vertical and horizontal quenching induced by winds and convection.
We show here that the representative pressure-temperature modulations we introduced in the modeled atmospheres can lead to near-anti-correlated phase shifts between 1.1-1.7 m and 3-5 m rotational lightcurves, similar to the phase shifts observed for the L7 dwarf PS 318.5-22 (Biller et al., 2018) and for the T6.5 dwarf 2M2228 (Buenzli et al., 2012). An anti-correlation could be the sign of a change of the temperature gradient in the atmosphere, possibly also at the origin of the L/T transition and induced by CO/CH4 radiative convection. Such modifications of the PT profile could also be at the origin of the unexpected behavior of the KI-lines modulation in Luhman 16B, as suggested by Kellogg et al. (2017). In general, modulations at the resolution of spectral lines might be much easier to produce with temperature changes than cloud (continuum) opacity changes.
The 200 degree phase shift between the 1.1-1.7 m and 3-5 m lightcurves observed for PSO 318.5-22 (Biller et al., 2018) may, however, not be typical. Although Buenzli et al. (2012) identified a similar magnitude phase shift in the lightcurves of the T6.5-type 2M2228, the five simultaneous lightcurves in that source showed pressure-dependent offsets (also confirmed in Yang et al., 2016). In addition, Yang et al. (2016) founds smaller phase shifts (10-25 degrees) in late L dwarfs and L/T transition dwarfs, demonstrating that different brown dwarfs likely have different vertical-longitudinal atmospheric structures. If we explain an exact anti-correlation with a change in the temperature gradient in a region of the surface of the brown dwarf, the 20∘ lag from the exact anti-correlation for PSO 318.5-22 could be the sign of wind advection of this region probed at different depth by HST and Spitzer data (hence at different radiative timescales). This shift could be similar to the shift of the hot-spot at different bandpasses caused by Hot Jupiters atmospheric circulation and is of the order of what is observed in the Hot Jupiter regime. The shape of the “spot” may be, however, more complex since high-temperature spots qualitatively similar to the Great Red Spot in Jupiter atmosphere have been excluded by the lightcurve evolution data (see Apai et al., 2017). The wind speed for brown dwarfs (e.g. 650310 m/s Allers et al., 2020) may be relatively smaller than the zonal jet in Hot Jupiters (e.g. 3-4 km/s Showman et al., 2008). Hence this link is relatively speculative at this stage and further studies are needed to see if the atmospheric circulation in brown dwarfs could lead to such phase shifts at different bandpasses.
In general, we have mainly focused our study on reproducing the spectral characteristic of the bright-to-faint spectral ratios of the modulation. A future line of work is indeed to look further into multi-dimensional time-dependent simulations of diabatic convection and also study if they can reproduce the typical lifetime of the features responsible of the rotational modulations and the lightcurve time evolution (typically 5-40 hours Apai et al., 2017). However we point out that if a switch at the global scale between diabatic and adiabatic convection is responsible for the L/T transition when CO is converted into CH4, it is likely going to produce large-scale inhomogeneities in the form of waves and large-scale circulation patterns. Assuming large-scale features with sizes of the order of half the radius of Jupiter (assuming a 10 % cover fraction of a brown dwarf visible disk) and typical convective velocities between 104 and 105 cm/s (Atkinson et al., 1997), the typical order of magnitude of the lifetime of these large-scale features would be between 10 hours and 4 days which is fairly consistent with the observed lifetime. As a consequence, a switch between diabatic and adiabatic convection could indeed explain relatively well the time evolution of the spectra of brown dwarfs at the L/T transition. The magnitude of the temperature fluctuations expected for standard convection is relatively modest (typically a few percent, e.g. Aurnou et al., 2008) and is mainly a function of the level of super-adiabaticity. This could be much larger for diabatic convection that can get a larger temperature fluctuation associated to a compositional fluctuation for the same level of “super-diabacity” (defined as the difference of the unstable diabatic potential temperature gradient to the stable potential temperature gradient). Numerical simulations are required to study in more details the magnitude, lengthscale and timescale of the temperature fluctuations associated to diabatic convection.
This paper demonstrates that some key observed spectral charateristics of rotational modulations, based on low-resolution time-resolved NIR spectrophotometry, can be interpreted in term of temperature variations. This result suggests that modulations from temperature variations and cloud-opacity variations are degenerate. We are not arguing that no modulations is coming from clouds: if present and not homogeneous they are likely to cause rotational modulations (see e.g. Tan & Showman, 2019, for 1D time-dependent models). Furthermore, clouds can induce temperature fluctuations because of radiative heating and cooling. However these modulations on their owns are not a particularly strong sign of the presence of clouds especially in a convective atmosphere with complex chemistry (e.g. CO/CH4 radiative convection). The detection of direct cloud spectral signatures, e.g. the silicate absorption feature at 10 m, would help to confirm that the observed variability can be driven by clouds although it will not necessarly exclude temperature variations or other mechanisms to be at play. Future studies (e.g. with JWST) looking at the differences in the rotational spectral modulation of objects with and without the silicate absorption feature may give us some insight on how to distinguish cloud-opacity fluctuations from temperature fluctuations.
Acknowledgements.
PT and AE acknowledges supports by the European Research Council under Grant Agreement ATMO 757858. PT thanks S. A. Metchev for useful discussions about the observations of spectral modulations at the Exoclime conference. This work is also partly supported by the ERC grant 787361-COBOM.References
- Allers et al. (2020) Allers, K. N., Vos, J. M., Biller, B. A., & Williams, P. K. G. 2020, Science, 368, 169
- Amundsen et al. (2014) Amundsen, D. S., Baraffe, I., Tremblin, P., et al. 2014, A&A, 564, A59
- Amundsen et al. (2016) Amundsen, D. S., Mayne, N. J., Baraffe, I., et al. 2016, A&A, 595, A36
- Apai et al. (2017) Apai, D., Karalidi, T., Marley, M. S., et al. 2017, Science, 357, 683
- Apai et al. (2013) Apai, D., Radigan, J., Buenzli, E., et al. 2013, ApJ, 768, 121
- Artigau (2018) Artigau, É. 2018, Variability of Brown Dwarfs, 94
- Atkinson et al. (1997) Atkinson, D. H., Ingersoll, A. P., & Seiff, A. 1997, Nature, 388, 649
- Aurnou et al. (2008) Aurnou, J., Heimpel, M., Allen, L., King, E., & Wicht, J. 2008, Geophysical Journal International, 173, 793
- Biller (2017) Biller, B. 2017, The Astronomical Review, 13, 1
- Biller et al. (2018) Biller, B. A., Vos, J., Buenzli, E., et al. 2018, AJ, 155, 95
- Buenzli et al. (2012) Buenzli, E., Apai, D., Morley, C. V., et al. 2012, ApJ, 760, L31
- Burgasser (2014) Burgasser, A. J. 2014, in Astronomical Society of India Conference Series, Vol. 11, Astronomical Society of India Conference Series, 7–16
- Burgasser et al. (2008) Burgasser, A. J., Liu, M. C., Ireland, M. J., Cruz, K. L., & Dupuy, T. J. 2008, ApJ, 681, 579
- Crossfield et al. (2014) Crossfield, I. J. M., Biller, B., Schlieder, J. E., et al. 2014, Nature, 505, 654
- Drummond et al. (2016) Drummond, B., Tremblin, P., Baraffe, I., et al. 2016, A&A, 594, A69
- Faherty et al. (2014) Faherty, J. K., Beletsky, Y., Burgasser, A. J., et al. 2014, ApJ, 790, 90
- Fegley & Lodders (1996) Fegley, Bruce, J. & Lodders, K. 1996, ApJ, 472, L37
- Gagné et al. (2017) Gagné, J., Faherty, J. K., Burgasser, A. J., et al. 2017, ApJ, 841, L1
- Gillon et al. (2013) Gillon, M., Triaud, A. H. M. J., Jehin, E., et al. 2013, A&A, 555, L5
- Goyal et al. (2018) Goyal, J. M., Mayne, N., Sing, D. K., et al. 2018, MNRAS, 474, 5158
- Kellogg et al. (2017) Kellogg, K., Metchev, S., Heinze, A., Gagné, J., & Kurtev, R. 2017, ApJ, 849, 72
- Marley et al. (2010) Marley, M. S., Saumon, D., & Goldblatt, C. 2010, ApJ, 723, L117
- Phillips et al. (2020) Phillips, M. W., Tremblin, P., Baraffe, I., et al. 2020, A&A, 637, A38
- Radigan et al. (2012) Radigan, J., Jayawardhana, R., Lafrenière, D., et al. 2012, ApJ, 750, 105
- Radigan et al. (2014) Radigan, J., Lafrenière, D., Jayawardhana, R., & Artigau, E. 2014, ApJ, 793, 75
- Robinson & Marley (2014) Robinson, T. D. & Marley, M. S. 2014, ApJ, 785, 158
- Showman et al. (2008) Showman, A. P., Cooper, C. S., Fortney, J. J., & Marley, M. S. 2008, ApJ, 682, 559
- Tan & Showman (2019) Tan, X. & Showman, A. P. 2019, ApJ, 874, 111
- Tremblin et al. (2016) Tremblin, P., Amundsen, D. S., Chabrier, G., et al. 2016, ApJ, 817, L19
- Tremblin et al. (2015) Tremblin, P., Amundsen, D. S., Mourier, P., et al. 2015, ApJ, 804, L17
- Tremblin et al. (2017) Tremblin, P., Chabrier, G., Baraffe, I., et al. 2017, ApJ, 850, 46
- Tremblin et al. (2019) Tremblin, P., Padioleau, T., Phillips, M. W., et al. 2019, ApJ, 876, 144
- Venot et al. (2012) Venot, O., Hébrard, E., Agúndez, M., et al. 2012, A&A, 546, A43
- Yang et al. (2016) Yang, H., Apai, D., Marley, M. S., et al. 2016, ApJ, 826, 8
- Yang et al. (2015) Yang, H., Apai, D., Marley, M. S., et al. 2015, ApJ, 798, L13
- Zhou et al. (2020) Zhou, Y., Bowler, B. P., Morley, C. V., et al. 2020, AJ, 160, 77