Wind- and Gravity-Forced Drop Depinning
Abstract
Liquid drops adhere to solid surfaces due to surface tension but can depin and run back along the surface due to wind or gravity forcing. This work develops a simple mechanistic model for depinning by combined gravity and high-Reynolds-number wind forcing and tests that model using water drops on a roughened aluminum surface. On non-inclined surfaces, drops depin at a constant critical Weber number, , for the present wettability conditions. On inclined surfaces, decreases linearly with the product of the Bond number and the width-to-height aspect ratio of the unforced drop. The linear slope is different in distinct wind- and gravity-dominated forcing regimes above and below . Contact line shapes and drop profile shapes are measured at depinning conditions but do not adequately explain the differences between the two forcing regimes.
I Introduction
When a liquid drop rests on a solid surface in the presence of wind or if the surface is inclined, the drop may remain fixed in place or depin and run back along the surface. When forcing is low, surface tension balances the wind and gravity forces and the drop remains pinned in place. As forcing increases, it eventually exceeds the maximum pinning force surface can provide and the drop depins and runs downstream.
Whether a drop depins involves a complex balance of forces at the three-phase contact line. Contact angle hysteresis is critical as it provides the drop with a range of metastable configurations and determines the criterion for depinning of the contact line Macdougall and Ockrent (1942). The advancing contact angle, , is the maximum angle on the advancing side of the drop; the receding contact angle, , is the minimum contact angle on the receding side. Because the advancing angle exceeds the receding angle, surface tension exerts a net force in the direction opposing motion. The maximum pinning force is largely determined by the difference between the cosines of these angles, .
When a drop rests on a surface inclined at angle , the downhill force is , where is the drop density. Wind forcing involves the interface pressure and viscous stress imposed on the drop by air. These depend strongly on drop shape which is affected by contact angle and the impinging flow field. When a drop is very small or the air (or other fluid) velocity is low, the forcing on the drop is mainly due to shear stress. When the drop is large or the air velocity is high, the dynamic pressure stress imposed by the air becomes dominant. Whether shear stress or pressure is more important is characterized by a Reynolds number, , based on the drop height, , a characteristic air velocity, , at that height, and the viscosity, , and density, of the air. The present interest is high Reynolds numbers. In the high- regime, flow over a drop separates, vortices are shed Acarlar and Smith (1987), and pressure fluctuations may cause drop-shape unsteadiness White and Schmucker (2008).
The objective of this work is to develop and test a simple mechanistic model of drop depinning limits with combined gravity and high--wind forcing. Although both forcing types may act simultaneously on drops, mixed forcing results do not appear to be addressed elsewhere. Examining mixed forcing enables a systematic study of whether depinning characteristics depend on forcing modality. This may provide new insight into how laboratory depinning studies using tilted plates may or may not apply to industrial applications in which high- forcing is most important.
The paper is organized as follows. After a brief literature review in Sec. II, a model for depinning limits is developed in Sec. III. Section IV provides an overview of the experimental approach using a small tiltable wind tunnel. Drop depinning results and a discussion of implications for the model are given in Sec. V. Section VI provides data on drop shapes under different forcing conditions as a potential explanation for the results presented in Sec. V. Conclusions are discussed in Sec. VII.
II Background
Early gravity-forced experiments on inclined surfaces without wind forcing were by Macdougall and Ockrent Macdougall and Ockrent (1942), Bikerman Bikerman (1950), and Furmidge Furmidge (1962). These experiments revealed that larger contact angle hysteresis increases a drop’s ability to resist depinning. To capture this behavior, Macdougall and Ockrent proposed a depinning model equation equivalent to
| (1) |
in which is the surface tension, and are the drop volume and width, and is the angle at which the pinning force equals the gravity force in the downhill direction. Bikerman observed modifications to the contact line and contact angle as the critical inclination is approached. These changes are required to maintain equilibrium between the gravity and surface tension before the gravity force exceeds the maximum available pinning force.
Since that early work, multiple researchers have studied the problem of drops depinning on inclined planes. Seminal analytical studies were by Dussan V. and Chow Dussan V. and Chow (1983); Dussan V. (1985). The former study considered the depinning problem for small contact angles in the lubrication limit. The latter relaxed the lubrication assumption and only required to be small. More recent studies are by Quéré et al. Quéré et al. (1998), ElSherbini and Jacobi ElSherbini and Jacobi (2006), Berejnov and Thorne Berejnov and Thorne (2007), Chou et al. Chou et al. (2012), and others. Quéré et al. develop and test a depinning model for drops with small contact-angle hysteresis in the low-Bond-number limit over a wide range of advancing and receding contact angles. ElSherbini and Jacobi provide an analytical model that predicts a critical angle based on the receding contact angle. As tilt angle increases, multiple critical angles exist as drops transition between different metastable configurations prior to depinning Berejnov and Thorne (2007); Chou et al. (2012). Berejnov and Thorne show experimental results on modifications to the contact line shape and the uphill and downhill contact angles as inclination increases. Chou et al. observe the same behavior in experiments and numerical simulations.
Wind-forced depinning is substantially more complex than the gravity-forced depinning because the wind profile can be an important factor. At high Reynolds numbers, wind forcing can also be unsteady and lead to drop interface oscillations White and Schmucker (2008). Milne and Amirfazli Milne and Amirfazli (2009) give a review of the wind-forced depinning literature. Recently, Razzaghi et al. Razzaghi et al. (2018) considered how critical wind velocity is affected when drops are positioned in closely spaced arrays.
Milne and Amirfazli Milne and Amirfazli (2009) propose a high- depinning model that predicts the wind velocity at which aerodynamic drag, , becomes equal to the maximum drop adhesion force which they characterize as . The drag depends on the drop projected area before wind forcing and drag coefficient which depends on the drop’s volume and shape. The shape depends on the forcing magnitude, surface tension, and contact angle limits. The pinning force depends on , the drop base length (diameter) before forcing is applied, the advancing and receding contact angles, plus a parameter that accounts for contact-angle variations about the drop’s contact line. Similar to , depends on parameters that may change as depinning is approached. Milne and Amirfazli equate the drag and pinning forces and solve for a critical depinning velocity, that is proportional to and involves the advancing and receding contact angles, surface tension, air density, and the unknown ratio .
Working with four different liquid/solid combinations, Milne and Amirfazli found depinning data did not readily fit the form and instead found a function to be more successful. The fitting parameters and are different for each different liquid/solid pair. The fact that does not appear to the 1/2 power but instead inside an exponential indicates that the term is sensitive to plus, potentially, other parameters. Later analysis by Roisman et al. Roisman et al. (2015) showed Milne and Amirfazli’s depinning data to collapse along curves which accounts for the variability in the drop size relative to the shear-layer thickness.
III Mixed-Forcing Depinning Model
The proposed model for depinning limits derives from a simple force balance similar to the gravity-only model proposed by Macdougall and Ockrent Macdougall and Ockrent (1942) plus the wind-only model suggested by Milne and Amirfazli Milne and Amirfazli (2009). Detailed drop shapes, wettablity characteristics, and high- unsteadiness are not explicitly included. Instead, their various effects are lumped into model coefficients that are experimentally measured.
Using this approach, the pinning force provided by surface tension is modeled as where is the initial width of the circular drop contact line and is an coefficient that accounts for the contact line shape and the contact angle distribution about the contact line. This model is similar to the exact equations developed by ElSherbini and Jacobi ElSherbini and Jacobi (2006) but lumps the contact line shape and contact angle variability into the unknown parameter . The use of is consistent with those authors’ finding that the equivalent drop radius is most appropriate for that purpose.
Because depends on drop shape, it increases as forcing increases to maintain equilibrium. How it does so may depend on the forcing mode. Depinning occurs when forcing exceeds the maximum available pinning force. The maximum is expected to be proportional to .
The gravity force on a drop is . The initial drop height is and is an constant that relates the actual drop volume to . Because the drop volume is fixed, does not depend on forcing but only the initial drop shape. At low Bond numbers when drops have the shape of spherical caps, can be computed exactly using the measured drop height and width. The aerodynamic force is where is a characteristic wind speed and is an drag coefficient that depends on the instantaneous drop shape. is expected to change markedly as air velocity is increased and the drop shape evolves in response to this forcing.
Combining the force terms into a single equation yields
| (2) |
for a pinned drop up to the maximum value of . Once the right-hand side exceeds the maximum value, the drop depins. Equation 2 can be recast as
| (3) |
in which and are the Bond and Weber numbers, is the initial drop aspect ratio, and the unknown coefficients are combined as and . The coefficient is absorbed into and because it does not change as forcing increases. The Bond number is defined . The Weber number is defined .
Equation 3 reveals the role of the Bond and Weber numbers in depinning and presents an immediate implication for gravity-only forcing. The critical depinning angle is
| (4) |
which is essentially the same as Eqn. (1) and a result by ElSherbini and Jacobi ElSherbini and Jacobi (2006) who find a critical tilt angle based on the Bond number. The aspect ratio and Bond number are known based on initial conditions. is unknown and may depend on the initial and final drop shape which, for gravity-only forcing, could only depend on drop volume and wettability parameters. The degree to which depends on volume in gravity-only forcing can be assessed by conducting gravity-only depinning tests and evaluating the quality of a fit to the Eqn. (4) model assuming is constant.
Considering situations with subcritical tilt, Eqn. (3) can be rearranged to yield the critical Weber number
| (5) |
It is immediately apparent that the critical Weber number is for non-tilted surfaces. This is a sensible result because a stronger pinning force requires more wind velocity to depin a drop while a higher drag coefficient requires less. The value of and the ratio may only be weak functions of Bond number. How they vary can be assessed using wind-only depinning tests at various Bond numbers and observing the manner in which the critical Weber number depends on . Milne and Amirfazli Milne and Amirfazli (2009) cite evidence that, at least over small volume ranges, critical Weber numbers may be constant for . More generally, Eqn. (5) suggests that the critical Weber number is a linearly decreasing function of if the unknown coefficients are not strong functions of .
The sections below present experimental tests of the depinning model as represented by Eqns. (4) and (5). The key questions this work aims to address are: Is this simple mechanistic model a useful representation of wind-forced depinning with various degrees of surface inclination? If yes, what are the values of the unknown parameters and and are they functions of Bond number or other factors? And, finally, can the values of and be rationalized with respect to contact-line shape and contact-angle variability in different forcing and Bond-number regimes?
IV Experimental Setup and Procedures
IV.1 Wind Tunnel and Flow Conditions
The experiments seek to quantify wind- and gravity-forced depinning limits in the air/water/aluminum system using a small tiltable wind tunnel. The tunnel was developed by Schmucker Schmucker (2012) and was used previously by Hooshanginejad and Lee Hooshanginejad and Lee (2017). Drops are placed on the floor of the wind-tunnel test section that consists of a roughened aluminum substrate. Side- and top-view cameras are included on the tilting platform to provide the nonintrusive drop-shape measurements developed by Schmucker and coworkers Schmucker (2012); Schmucker et al. (2012).
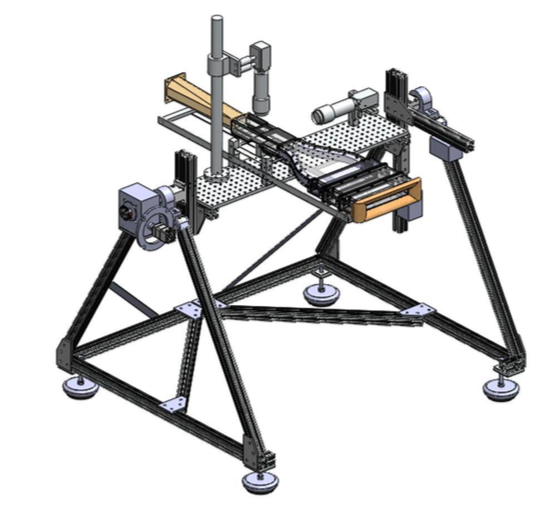
The wind tunnel is designed according to typical wind tunnel paradigms Barlow et al. (1999). A schematic is shown in Fig. 1. It is an open-return design with an inlet cross section 25 mm tall by 200 mm wide. After passing through a honeycomb and two screens for flow conditioning, a 250-mm-long contraction decreases the cross section to 25 mm tall by 50 mm wide. Interchangeable surface samples 25 mm wide by 50 mm long fit flush into the tunnel floor. The sandblasted aluminum surface has a rms surface roughness of 3.26 m. Downstream of the test section, the flow passes through a diffuser and an 80-mm-diameter fan. The wind-tunnel rotation axis passes through the test-section so the linear acceleration of a drop is essentially zero while the tunnel is rotated to different inclination angles. The pressure drop across the contraction is measured to control the test-section flow velocity. Surface inclination is measured using a rotary encoder.
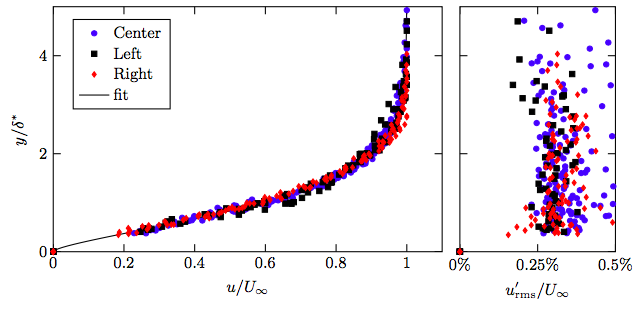
A hotwire anemometer was used to measure the wind-tunnel floor boundary layer. Normalizing the height above the surface, , by the boundary-layer displacement thickness, , and the flow velocity by the freestream velocity, , the data collapse to a self-similar curve shown in Fig. 2. The displacement thickness was found to vary as where . As seen in Fig. 2, velocity fluctuations are between 0.2 and 0.5% of the freestream speed.
IV.2 Test Procedures
To begin a depinning experiment, the aluminum substrate is cleaned with acetone. Once it evaporates, an image of the dry aluminum is captured using the top-view camera. Next, a distilled water drop of a particular volume, , is applied on the surface. Drops are applied by hand using a graduated syringe. Careful drop application is essential to produce nearly circular contact lines with contact angles close to . A second top-view image is captured once the drop is applied. Next, the wind tunnel is brought to a sub-critical inclination angle at 1∘ per second. Once the target inclination is reached, wind speed is slowly increased until the critical speed is reached and the drop depins. Top- and side-view images are captured at multiple subcritical flow speeds.
Depinning is identified using side- and top-view images collected during the experiments. Depinning is judged to occur at the velocity or inclination at which motion is first observed on the receding portion of the contact line. This corresponds to the second of three depinning events identified by Berejnov and Thorne Berejnov and Thorne (2007). Consistent with observations by Berejnov and Thorne, the advancing side of a drop is usually observed to move first in response to subcritical forcing. This allows the drop to temporarily achieve a meta-stable configuration before stronger forcing eventually causes depinning.
IV.3 Drop Geometry
Side-view images obtained at and m/s at the start of each test are used to measure the initial height, , and width, , of each drop. Before forcing is applied, the drop width is the diameter of the nearly circular contact line. As shown in Fig. 3, these measurements both scale as at low Bond numbers where drops take the shape of spherical caps. At large drop volumes, the initial heights approach a constant value of 2.92 mm, approximately equal to the capillary length mm. At larger volumes, increases as .
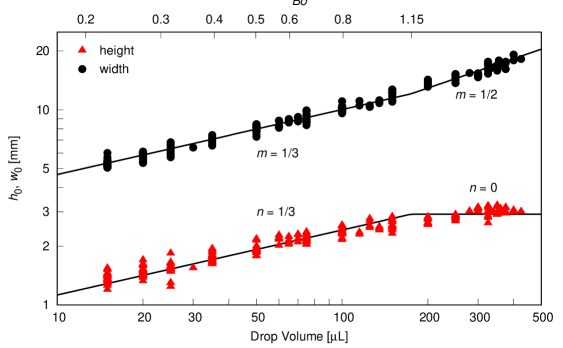
The data in Fig. 3 are fit to power-law forms and in two ranges with a break at L, the cutoff between low and high Bond numbers. This volume corresponds to . Although there is actually a smooth transition between these regimes, a piecewise-continuous fit successfully models the data within measurement uncertainty. The break at L plus the proportionality constants for and in the low-Bond regime are the three fit parameters. Bond numbers corresponding to each volume are shown at the top of the figure. Because is constant above , no further increase in the Bond number occurs at higher volumes. The initial drop aspect ratio is constant in the low-Bond regime, . This result implies that for . At higher Bond numbers the drop is no longer a spherical cap so increases as and increases.
As the tests proceed, side-view images are used to measure advancing and receding contact angles. The mean values across all the recorded data are and . Using these data, . Using the data it is possible to calculate the contact angle of the initial drop application in the low-Bond, spherical-cap limit. Using a fit to the data for all drops below L yields a contact angle of , somewhat less than the measured advancing contact angle.
The height of the drop relative to the boundary layer thickness determines the appropriate velocity scale for the and . At critical conditions, nearly all the values equal or exceed , the height in the boundary layer at which . Therefore, is used as the reference velocity. Other constant physical parameters correspond to conditions at C: N/m, kg/m3, kg/m3, and kg/ms.
V Depinning Limits
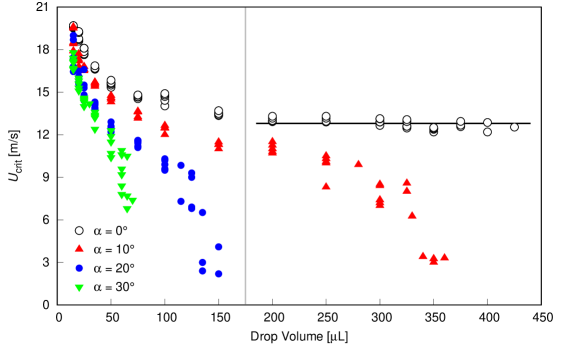
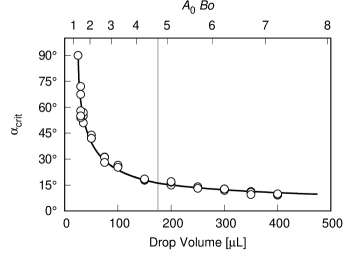
To test the model represented by Eqn. (5), depinning experiments were conducted using 220 drops ranging in volume from 15 to L and at surface inclination angles of , 10∘, 20∘, and 30∘. Data for critical depinning wind velocity, , is plotted as a function of drop volume in Fig. 4. For small volumes, decreases rapidly as volume increases. As volume increases further, drops on the surface reach a constant value, m/s indicated by the horizontal black line. As inclination increases, the gravity force increases and this reduces the wind velocity required for depinning.
To evaluate pure gravity-forced runback, a series of tests was conducted in which the surface inclination was increased at a rate of 1∘ per second until a critical runback angle was reached. Results are shown in Fig. 5 with a best-fit curve to Eqn. (4). This fit yields for this set of wettability conditions. The fit is successful across the entire range of in spite of varying above L or . Because varies, must as well but the variations are sufficiently small to allow a successful data fit.
For gravity-forced drops, the critical pinning force is . Using the result from the inclined surface tests and the small- value yields . This value is expected to be close to and the match is outstanding for these experiments: .
Returning to experiments with wind forcing, depinning threshold data from Fig. 4 is presented in nondimensional form in Fig. 6. Data for the limit is generated using Eqn. (4) with , 20∘, and 30∘. When the surface is horizontal, , drops run back at an essentially constant Weber number, . This finding is consistent with the model represented by Eqn. (5) and indicates that the ratio is not a strong function of . This, in turn, suggests that neither the drag coefficient nor the surface-tension pinning coefficient are strong functions of the drop volume.
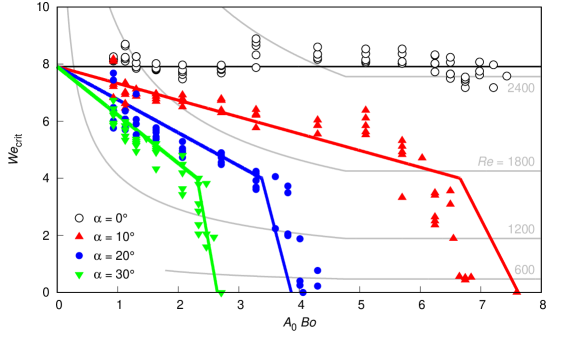
Large-volume drops subject to pure wind forcing demonstrate significant interface oscillations, even at wind speeds below . For all but the smallest drops, critical conditions occur above where significant vortex shedding is expected Acarlar and Smith (1987). The and 30∘ inclined-surface tests show depinning at and drops in these tests do not undergo significant interface-shape oscillations. While unsteady vortex shedding likely occurs in the drop wakes at these Reynolds numbers, it seems insufficiently strong to cause significant drop-shape unsteadiness.
For the three inclined-surface data sets, the critical Weber number decreases linearly with increasing as predicted by Eqn. (5) but does so in two distinct stages. Using the combined data from all four surface inclination angles but restricting to drops for which , Eqn. (5) is fit successfully using and . These coefficients apply to all four values and to drops both in the small- range, and in the large- range, . The ratio yields for .
Figure 6 shows distinctly different slopes for drops with and this requires different values for and . will be referred to as the gravity-dominated forcing regime while will be referred to as the wind-dominated forcing regime. in the gravity-dominated forcing regime is taken to be , the value found in the critical-tilt experiments. Proceeding from this, is determined by requiring the curves be continuous at . This yields .
The choice of as a cutoff between the forcing regimes provides the best match to the data. However, the quality of the fits presented in Fig. 6 are not especially sensitive to that Weber number; values between 3.75 and 4.25 give essentially the same fit quality. Notably, the different forcing regimes do not appear related to drop volume. Both wind- and gravity-dominated depinning occurs at small and large Bond numbers and the different critical coefficient values are associate with different regimes, not different regimes.
The coefficient in the gravity-dominated forcing regime has a larger relative uncertainty than the other coefficients. This is reflected in the worse data fit in the gravity-dominated regime, especially for . This may occur because the data in the gravity-dominated regime is not used to determine the corresponding and values. Again, the lines below in Fig. 6 use the value of from the critical tilt tests plus the value of that yields piecewise-continuous extensions of the lines above . The relatively poor fit for may also occur because the entire subset of the data for gravity-dominated forcing occurs at where the initial drop shapes are not spherical caps and and are expected to depend at least weakly on .
To summarize these findings, the data and fit curves presented in Fig. 6 show that the simple mechanistic model of mixed-mode depinning is successful but must be considered in distinct wind- and gravity-dominated forcing regimes. The choice to represent the data in two linear segments is arbitrary. A more sophisticated model would include values of and that are continuous functions of , , or other parameters. The present model does not attempt to predict coefficient values as, say, functions of , , Bond number, or Reynolds number. However, once the coefficients are empirically determined, they suggest the relative strengths of wind and pinning forces as compared to the gravity force.
An unexpected result is that is substantially larger in the wind-dominated forcing regime as compared to the gravity-dominated regime: for wind-dominated forcing as compared to for the gravity-only tests. The gravity-only value is essentially equal to . This finding was expected based on previous work dating to Macdougall and Ockrent Macdougall and Ockrent (1942). The fact that is 75% larger for wind-dominated forcing means that surface tension is 75% more effective at resisting wind-dominated forcing than gravity-only forcing. This suggests results from tilted plate tests may not be suitable for predicting the maximum surface-tension pinning force in wind-forced situations.
The different values of and above and below may arise because of different drop shapes in the wind- and gravity-dominated forcing modalities. Different drop shapes also exist in the small- and large- ranges below and above . However, those changes are accommodated using constant critical coefficients across the entire range of . Different contact-line shapes and contact-angle distributions about the contact line would affect while different drop interface shapes would affect the drag coefficient, . To explore this possibility, data on drop shapes under the different forcing modalities are presented in the next section.
VI Drop Shapes at Critical Depinning Conditions
To investigate why depinning conditions may differ between the two forcing regimes, drop images were recorded using side- and top-view cameras. Top-view images were analyzed using the laser-speckle interface measurement technique developed by Schmucker and coworkers Schmucker (2012); Schmucker et al. (2012). That analysis consists of finding the contact line, measuring the deformation of a laser speckle image caused by refraction of light at the air/water interface, then numerically reconstructing the interface shape using a simulated annealing optimization procedure. Results are used to measure the contact-line shape and side-view drop profile, both of which are measured with good accuracy. Receding contact angles proved difficult to measure with good accuracy using this approach. Receding and advancing contact angles reported in Sec. IV were measured using conventional side-view images and are accurate to within the quoted uncertainty.
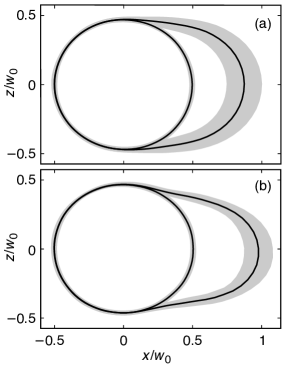
Mean initial and final contact line shapes for drops that depin due to mainly wind forcing are shown in Fig. 7(a) while the equivalent mean shapes for the gravity-only drops are shown in Fig. 7(b). Each drop’s geometry is scaled by its initial width in the streamwise direction, . Although the differences between gravity-only forcing and wind-dominated forcing are small, drops subjected to gravity-only forcing elongate somewhat more than the wind-forced drops. The most-downstream point of the gravity-only drops is from the initial drop center as compared to for the wind-forced drops. Additionally, the radius of curvature at the advancing part of the contact line is smaller for gravity-forced drops, , than for wind-forced drops, . The drops’ maximum transverse width was not observed to decrease for either forcing type.
Sideview profiles of the final subcritical drop configurations are shown in Fig. 8. The plots are scaled by each drop’s final streamwise length. Dashed lines are drops that depin in the gravity-dominated forcing regime; solid-lines represent wind-dominated forcing. Concave interface curvature is present on the windward portion of the drop interface at high wind speeds. This shows the wind pressure imposed on that portion of the drop exceeds the capillary pressure that would be present if the drop was able to maintain its spherical cap shape. Again, the receding contact angles are not captured accurately using the top-view laser speckle technique; the receding contact angles are larger than what is observed in the side-view profiles.

One difference between the forcing regimes that is not highlighted by Fig. 8 is the difference in final drop length and height. Gravity-forced drops are approximately 13% longer than same-volume wind-forced drops just before depinning. Because the side-view profiles are nearly unchanged for the two regimes, this means the maximum drop height is larger by approximately the same amount. The larger height might be expected to result in a larger value of (the drag coefficient) for primarily gravity-forced drops as compared to primarily wind-forced drops. However, this is not the case. Wind-forced drops have a substantially larger value of . This could be a consequence of interface shape differences or the increased interface unsteadiness at higher Reynolds numbers.
Ultimately, the reasons for the different and values are not clear. Drops do exhibit different contact line shapes and profiles just prior to depinning in the two forcing regimes. However, the differences do not suggest an obvious connection to the different critical coefficient values. To provide more information on this issue, higher-accuracy measurements of the contact angle distribution about the contact line are needed.
VII Conclusions
The objective of this work is to develop and test a simple mechanistic model of gravity- and high- wind-forced drop depinning using straightforward formulations of surface-tension, gravity, and aerodynamic forces. To test the model, depinning experiments were performed using water drops ranging from 15 to 450 L on a roughened aluminum surface inclined at 0∘, 10∘, 20∘, and 30∘ in combination with wind forcing. Tests of critical tilt angle without wind forcing were also performed. Critical tilt experiments yield the critical pinning-force coefficient for gravity-only forcing. Tests with wind-only forcing on the non-inclined surface resulted in a constant critical Weber number. Combined wind and gravity forcing experiments give critical pinning and drag coefficients under mixed forcing conditions. Overall, the model is judged to be successful.
When the surface is inclined, the model predicts the critical Weber number decreases linearly with increasing , the product of the initial drop aspect ratio and Bond number. The unknown model coefficients and do not depend strongly on either Bond number or surface inclination. However, they do take markedly different values above and below which is identified as a boundary between wind- and gravity-dominated forcing regimes for the present wettability conditions. The existence of different regimes has not been previously identified and has important implications for predicting drop depinning due to wind forcing using data obtained from critical tilt experiments.
Contact line shape and side-yield profile shapes were measured in an attempt to explain the different values of and in the different forcing regimes. In both forcing modalities, the contact lines of the final drop shapes appear as semicircular arcs connected by nearly straight-line segments. Compared to drops that depin in the wind-dominated forcing regime, gravity-forced drops extend somewhat more in the streamwise direction before depinning and their contact lines have a smaller radius of curvature on the advancing side.
Overall, the difference in the model coefficients in the wind- and gravity-regimes is not clearly explained by the shape measurements presented here. Continuing work aims to improve receding contact angle measurements and this may provide additional information that could improve understanding. Separately, the role of Reynolds number and drop interface unsteadiness remains under active investigation.
Acknowledgements
The authors wish to thank Sungyon Lee, Alireza Hooshanginejad, and Roger Simon for multiple fruitful conversations regarding this work. The authors also with to thank the U.S. National Science Foundation for support from grants CBET-0828469 and CBET-1839103.
References
- Macdougall and Ockrent (1942) G. Macdougall and C. Ockrent, Surface energy relations in liquid/solid systems I. The adhesion of liquids to solids and a new method of determining the surface tension of liquids, Proceedings of the Royal Society of London. Series A. Mathematical and Physical Sciences 180, 151 (1942).
- Acarlar and Smith (1987) M. Acarlar and C. Smith, A study of hairpin vortices in a laminar boundary layer. Part 1. Hairpin vortices generated by a hemisphere protuberance, Journal of Fluid Mechanics 175, 1 (1987).
- White and Schmucker (2008) E. B. White and J. A. Schmucker, A runback criterion for water drops in a turbulent accelerated boundary layer, Journal of Fluids Engineering 130, 061302 (2008).
- Bikerman (1950) J. Bikerman, Sliding of drops from surfaces of different roughnesses, Journal of Colloid Science 5, 349 (1950).
- Furmidge (1962) C. Furmidge, Studies at phase interfaces I. The sliding of liquid drops on solid surfaces and a theory for spray retention, Journal of Colloid Science 17, 309 (1962).
- Dussan V. and Chow (1983) E. Dussan V. and R. T.-P. Chow, On the ability of drops or bubbles to stick to non-horizontal surfaces of solids, Journal of Fluid Mechanics 137, 1 (1983).
- Dussan V. (1985) E. B. Dussan V., On the ability of drops or bubbles to stick to non-horizontal surfaces of solids. Part 2. Small drops or bubbles having contact angles of arbitrary size, Journal of Fluid Mechanics 151, 1–20 (1985).
- Quéré et al. (1998) D. Quéré, M.-J. Azzopardi, and L. Delattre, Drops at rest on a tilted plane, Langmuir 14, 2213 (1998).
- ElSherbini and Jacobi (2006) A. ElSherbini and A. Jacobi, Retention forces and contact angles for critical liquid drops on non-horizontal surfaces, Journal of Colloid and Interface Science 299, 841 (2006).
- Berejnov and Thorne (2007) V. Berejnov and R. E. Thorne, Effect of transient pinning on stability of drops sitting on an inclined plane, Physical Review E 75, 066308 (2007).
- Chou et al. (2012) T.-H. Chou, S.-J. Hong, Y.-J. Sheng, and H.-K. Tsao, Drops sitting on a tilted plate: Receding and advancing pinning, Langmuir 28, 5158 (2012).
- Milne and Amirfazli (2009) A. Milne and A. Amirfazli, Drop shedding by shear flow for hydrophilic to superhydrophobic surfaces, Langmuir 25, 14155 (2009).
- Razzaghi et al. (2018) A. Razzaghi, S. A. Banitabaei, and A. Amirfazli, Shedding of multiple sessile droplets by an airflow, Physics of Fluids 30, 087104 (2018).
- Roisman et al. (2015) I. V. Roisman, A. Criscione, C. Tropea, D. K. Mandal, and A. Amirfazli, Dislodging a sessile drop by a high-Reynolds-number shear flow at subfreezing temperatures, Physical Review E 92, 023007 (2015).
- Schmucker (2012) J. A. Schmucker, Experimental investigation of wind-forced drop stability, Ph.D. thesis, Texas A&M University (2012).
- Hooshanginejad and Lee (2017) A. Hooshanginejad and S. Lee, Droplet depinning in a wake, Phys. Rev. Fluids 2, 031601 (2017).
- Schmucker et al. (2012) J. A. Schmucker, J. C. Osterhout, and E. B. White, Speckle technique for dynamic drop profile measurement on rough surfaces, Experiments in Fluids 52, 123 (2012).
- Barlow et al. (1999) J. B. Barlow, W. H. Rae, Jr., and A. Pope, Low Speed Wind Tunnel Testing, 3rd ed. (John Wiley & Sons, 1999).