Present address: ]TUD
Intra- and Intermolecular Inhomogeneities in the Course of Glassy Densification of Polyalcohols
Abstract
To test basic assumptions inherent to most theories of molecular liquids and glasses, Infrared spectroscopy is carried out on short polyalcohols at temperatures ranging from far above to far below their glass transition. By analyzing specific vibrations, the thermal expansion of covalent bonds and hydrogen bridges is determined revealing striking differences. A comparison with density verifies the negligibility of intramolecular expansion but exposes severe inhomogeneities on intermolecular scale. This signals distinct roles in glassy densification and promotes an atomistic understanding.
The vitrification of a (super-cooled) liquid into a disordered solid is a central subject of experimental and theoretical soft condensed matter research Wong and Angell (1976); Anderson (1979); Donth (1981); Zallen (1983); Elliott (1990); Donth (1992, 2001); Kremer and Schönhals (2002); Lubchenko and Wolynes (2007); Ngai (2011); Götze (2012); Kremer and Loidl (2018). A distinctive feature of super-cooled liquids and glasses is their diverging molecular fluctuation rate. Even simple concepts like the free volume model Fox and Flory (1950, 1951, 1954); Turnbull and Cohen (1961) relate this to the reduction of intermolecular volume, in other words an increase in density, reflected in the term glassy densification. While the free volume model uses the inhomogeneity of the density only conceptually, early microscopic theories of liquids identify it as an additional key quantity Bernal (1937). This has also been established for glasses Ediger (1998); Donth (2002); Rissanou and Harmandaris (2015), and it became clear that heterogeneity in time and space, in other words a varying temporal and spatial scale on which molecules fluctuate Ediger (2000); Richert (2002) is a fundamental attribute of both liquids and glasses. Consequently, modern theoretical approaches like the random first order transition (RFOT) theory Xia and Wolynes (2000); Stevenson and Wolynes (2005); Lubchenko and Wolynes (2007) incorporate an inhomogeneous density in their description.
Interestingly, even RFOT theory, one of the most sophisticated concepts of molecular glasses, is based on abstract beads and their packing density Lubchenko and Wolynes (2007), i.e. particular intermolecular interactions are not specifically considered. Hence, this approach assumes that the impact of intermolecular interactions on structural relaxation is described by (packing) density. This means that certain presumptions are inherent to this model (similar to most other theoretical descriptions Dyre (2006); Mirigian and Schweizer (2014); Mauro et al. (2009); Lubchenko and Wolynes (2007); Bosse et al. (1978); Adam and Gibbs (1965)): i) intramolecular expansion is neglected foo , i.e. density changes are fully or almost fully ascribed to intermolecular expansion, and ii) no directionality or inhomogeneity of the intermolecular interactions is accounted for, i.e. the thermal expansion even on molecular scale is considered isotropic. While the first conjecture appears rather plausible, the second one is questionable for a vast range of systems involving directional interactions e.g. hydrogen (H-) bridges as in glycerol, one of the most studied model glass formers Schneider et al. (1998); Wuttke et al. (1994); Klieber et al. (2013); Jensen et al. (2018); Capponi et al. (2010); Ryabov et al. (2003); Beevers et al. (1980); Mehl (1996); Gabriel et al. (2019). Despite their essential nature, to the best of our knowledge these two conjectures, negligibility of intramolecular expansion and intermolecular bond directionality, have not yet been tested experimentally.
Here, we reexamine our previously published Infrared (IR) spectroscopy data of short polyalcohols from a wide temperature range above and below the calorimetric glass transition temperature Kremer et al. (2018). These molecules (glycerol, threitol, xylitol, and sorbitol) have a regular structure but the orientation of the hydroxy groups, which associate and form a H-bridge network, gives rise to a significant anisotropy. This intramolecular inhomogeneity leads to weak and strong intermolecular H-bridges, and with a novel extensive analysis we reveal their individual thermal expansions. Despite the supramolecular network formed by the mildly expanding strong H-bridges, the profoundly expanding weak H-bridges surprisingly allow for considerable changes in density. A consequence of this inhomogeneity of the intermolecular interactions is a decoupling of the structural relaxation (governed by strong bridges) from the thermal expansivity and density (dominated by weak bridges).
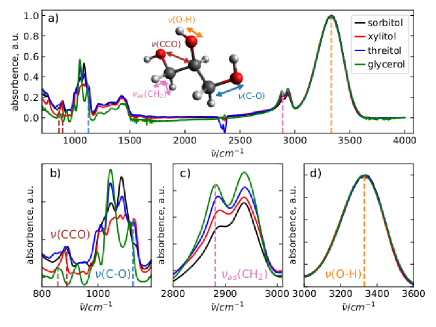
IR spectra were recorded using a Fourier transform infrared (FTIR) spectrometer (Bio–Rad FTS 6000) combined with an IR microscope (UMA 500) and a liquid nitrogen-cooled mercury-cadmiumtelluride (MCT) detector (Kolmar Technologies, Inc, USA) while a THMS 350V stage (Linkam Scientific Instruments, UK) flushed with dry nitrogen controlled the sample temperature; further information can be found elsewhere Kremer et al. (2018). Comparing the spectra of the polyalcohols under study reveals their molecular characteristics (Fig. 1a). In the low frequency range () the CO stretching vibration (CO) at and a combined CCO stretching vibration (CCO) at exhibit bands distinctive for each substance (Fig. 1b). The (CO) vibration shows only minor changes, i.e. a shift to higher frequencies with increasing molecular weight by from glycerol to sorbitol. In contrast, the (CCO) band not only shifts by but also undergoes pronounced changes in shape for each material due to superimposing complex structural oscillations. Density functional theory (DFT) calculations of glycerol reveal distinct spectra for the various conformers in this frequency range Chelli et al. (2000). Since a change in molecular weight alters not only the number of conformers but also their probability distribution, such spectral differences are expected, and, due to their complexity, the absorption bands cannot be unraveled any further.
At higher frequencies, the vibrations become more localized and hence less complex, but also less distinct in the homologous series. Thus, the spectral region indicative of CH stretching vibrations () exhibits only minor differences (Fig. 1c). The asymmetric CH2 stretching vibration (CH2) at shifts by less than from glycerol to sorbitol; its absorbance reduces with increasing molecular weight since CH2 stretching happens only at terminal carbons. Conversely, the absorbance of CH stretching (CH) (from non-terminal carbons) at increases; however, since it is superimposed by the symmetric CH2 stretching vibration (CH2) at and the tail of the OH stretching vibration band (OH), only (CH2) is analyzed quantitatively. At even higher frequencies (), the broad (OH) peak, typical for alcohols Bauer et al. (2015), at is prominent and identical in shape in all four polyalcohols (Fig. 1d).
From the spectra, peak frequencies of the (OH), (CH2), and (CO) band were determined in a wide temperature range (Fig. 2). The (OH) band exhibits a large red-shift with decreasing temperature (Fig. 2a) amounting to above in all substances. Further, the temperature dependence of the peak frequency has a distinct change of slope at (similar to density). In contrast, the red-shift upon temperature reduction observed in the (CH2) band is as small as in the entire range (), and shows no distinct feature at (Fig. 2b). The (CO) bands exhibit a small ( in the whole range) blue-shift as temperature decreases (Fig. 2c) with a gradually changing slope above (though not as distinct as in (OH)).
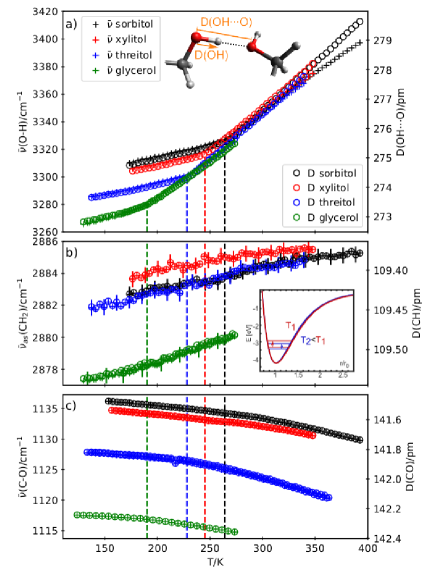
A shift in IR absorption frequency of a stretching vibration typically reflects a change in bond length foo ; Schrader (1995). Consequently, the large shift in (OH) means that the overall intramolecular thermal expansion is dominated by changes in OH length while variations in CH and CO lengths have only minor impact. Since a red-shift indicates an expansion (weakening of the bond), both OH and CH bond lengths increase upon cooling (Fig. 2a & b). This is caused by the respective intermolecular interactions, i.e. strong (OHO) and weak (CHO) H-bridges. A densification with decreasing temperature reduces intermolecular distances and brings the oxygen atoms of surrounding molecules (H-bridge acceptors) closer. Hence, the (intermolecular) H-bridges become stronger while the (intramolecular) covalent bonds are stretched foo ; *Towey:2011. In contrast, the blue-shift upon cooling in (CO) (Fig. 2c) implies a contraction of the covalent bonds in the backbone (i.e. normal thermal expansion).
In a simple quantitative approach, the change in bond length is approximated by employing the Morse potential Morse (1929); Dahl and Springborg (1988); de Lima and Hornos (2005) to describe molecular vibrations (Fig. 2 inset):
| (1) |
Here, represents the dissociation energy and the inverse width of the potential. The latter can be related analytically to the difference of the energy eigenvalues in the ground state and the first excited state :
| (2) |
Therein, is the reduced mass and the reduced Planck constant. Using typical dissociation energies (e.g. from dimethylether Pacey (1975) and methane Benson and O’Neal (1970)) and inserting the measured IR absorption frequencies via yields , an estimate for the change in interatomic (i.e. intramolecular) distance with temperature. In order to approximate the absolute length of a bond (Fig. 2b & c), the respective interatomic distance obtained from DFT calculations Neese (2018) of glycerol were used for a calibration at the reference temperature with the correction (, and with , and respectively). Extended DFT calculations to reproduce a temperature dependence fail since intermolecular interactions are missing. (The latter are required to model an equilibrated, i.e. energetically minimized bond at different lengths). Therefore, eq. (2) is used to quantify the bond lengths and Steiner (1995).
For the OH bond as well as the respective OHO bridge however, there exists a vast record of experimental work on lengths, among them also correlations to IR absorption frequencies. Studies of crystalline H-bonding materials combined X-ray and neutron diffraction with IR spectroscopy to deduce the relation between the intermolecular OHO distance and the peak position (OH) (i.e. the respective intramolecular OH vibration) Libowitzky (1999); Steiner (2002). The found empirical relation Libowitzky (1999) to extract D(OHO) (Fig. 2a) is given by:
| (3) |
Furthermore, these structural investigations established a relation between and Steiner (2002) which is used to obtain also the temperature dependence of the latter. The thermal expansion of both and exhibits a characteristic kink at (Fig. 3a & b), like the underlying peak frequency of (OH). Changes in density (indicating ) originate from inter- and intramolecular expansion; however, their respective contribution is yet unknown. For quantitative evaluation, we use the cubic root of the specific volume obtained from the mass density of glycerol Blazhnov et al. (2004) and its molar mass as reference. The resulting length (where is Avogardo’s number) resembles the average distance between the centers of adjacent molecules (i.e. a 1-dimensional equivalent to specific volume).
While vibrational spectroscopy provides no direct access to bond lengths (i.e. structural methods are required to establish a correlation), its extremely high resolution is excellent to trace changes Deng and Callender (1999). Consequently, in the following we focus on these (absolute) changes using the respective value at as reference (). A comparison of with , , and reveals that all these intramolecular lengths exhibit a much weaker thermal expansion (about a factor of 20 for and more than a factor of 100 for and ), and thus are negligible in the densification of the material (Fig. 3a). Consequently, the expansion of intermolecular bridges must dominate densification. However, the change in is by about a factor of 3 smaller than in . Considering the chemical structure of glycerol, the only other intermolecular interactions are of van der Waals type and weak CHO H-bridges Steiner (1995). The red-shift of (CH2) with decreasing temperature indicates the latter. It is known that this type of bridge has a length of Steiner (1995), considerably longer than (). Attempts to establish a relation between (CH2) and , based on studies of crystalline materials Steiner (1995); Braga et al. (1995), in order to extract a reliable temperature dependence fail because of too much scattering of the data. Additionally, due to the low polarity of the CH bond, its length is rather insensitive to the presence of H-bridge acceptors (in weak H-bridges longer than , the distance between hydrogen and the H-bridge acceptor varies strongly, i.e. several tens of , while the change in donor bond length is Steiner (1998), for -CHO even Sosa et al. (2002); Braga et al. (1995)).
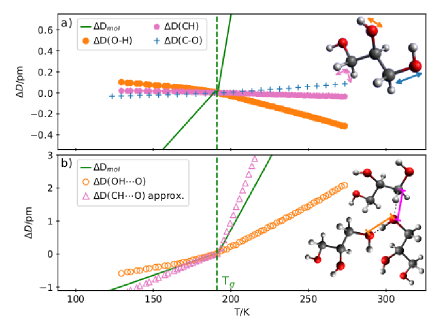
The overall thermal expansion is an average of all intra- and intermolecular expansivities. Since the former are negligible compared to the latter, we approximate as composition of intermolecular expansions only:
| (4) |
Here, and are weighing factors representing the fraction of OH and CH donors per molecule, respectively (e.g. for glycerol and = 5/8). Insertion of obtained from density and calculated from eq. (3) yields an approximation for the thermal expansion (Fig. 3b) which is by about a factor of 6 larger than . Despite the lack of direct experimental data it is conceivable: due to their increased length and low polarity the CHO bridges are more susceptible to temperature change than the OHH bridges. Also, studies of semi-crystalline poly(3-hydroxybutyrate) reported thermally induced changes of inter-chain distance in the crystallites, which is governed by CHO contacts (of methyl groups and ketones, i.e. different chemical structure), of accompanied by shifts in (CH2) of Sato et al. (2006) (the expansion of estimated from eq. (4) is ).
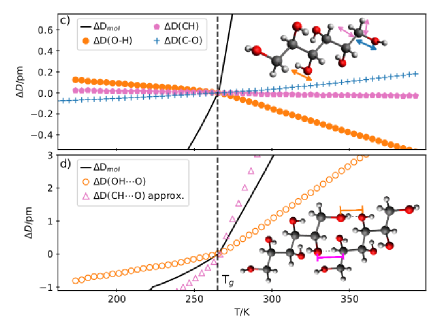
In sorbitol, the thermal expansion of the different intra- and intermolecular lengths is almost identical to those in glycerol (Fig. 3). The only deviation is a slightly larger rate of in sorbitol, probably due to the elevated temperature. This striking similarity indicates that, despite increased molecular weight and number of conformations, density is controlled by the same mechanism. Although we have no extended density data for xylitol and threitol available, the similarity of their IR band evolution suggest an analogous picture. Hence, the view foo ; *Lunkenheimer:2002a; *Geirhos:2018; *Kudlik:1999; *Loidl2018 is corroborated that glassy densification in these polyalcohols follows the same physical mechanisms Döß et al. (2002); Hensel-Bielowka et al. (2004); Pronin et al. (2010).
Despite the fact that the biggest thermal expansion of these polyalcohols is found in the CHO bridges, does not exhibit a characteristic feature at - in contrast to the pronounced kink at in . Consequently, the picture is nurtured that the OHO bridges govern dynamics since these pose the largest energetic barriers to structural relaxation while their impact on overall thermal expansion is small (evidenced by the reduced temperature dependence of density with increasing number of H-bridging groups Gromnitskaya et al. (2019)). That is because (weak) CHO bridges enable considerable changes in average intermolecular distance and thus density (Fig. 4) while the network topology is stabilized by mildly expanding (strong) OHO bridges.
That may illuminate a yet unresolved observation reported in the frame of the density scaling concept Floudas et al. (2010); Grzybowski and Paluch (2018). In this empirical approach, the structural relaxation time is considered to scale with the term with the exponent Floudas et al. (2010); Ingebrigtsen et al. (2012). While many van der Waals liquids obey this scaling Paluch et al. (2014); Hensel-Bielowka et al. (2004), particularly associating liquids (and some polymers) defy it Floudas et al. (2010); Pawlus et al. (2011); Paluch et al. (2014); Hensel-Bielowka et al. (2004). This defiance is caused by the difference in thermal expansion of strong and weak intermolecular bridges; their selective impact on density and structural relaxation loosens the relation between the latter two properties which in turn disrupts the scaling. From the interpretation that is connected to the (uni-form) intermolecular potential Floudas et al. (2010); Pedersen et al. (2008), one can infer that the reason is the negligence of different (or inhomogeneous) intermolecular interactions. This corroborates previous views, that glycerol in particular and possibly associating liquids in general do not comply with common theories of glassy densification Niss and Hecksher (2018). Reports of separated rotational and translational dynamics in glycerol attributed to the H-bridge network fortify this Meier et al. (2012); Flämig et al. (2019). Since density scaling also fails in some polymers Paluch and Roland (2003), our results likely reach beyond associating liquids.
In summary, the presented study evidences inhomogeneities of the thermal expansion on both intra- (Fig. 3a & c) and intermolecular (Fig. 3b & d) scale in the course of glassy densification. In turn, two fundamental presumptions which are inherent to most theoretical models of molecular liquids and their glass transition are checked experimentally (for short polyalcohols): firstly, it is confirmed that intramolecular expansion is negligibly small compared to intermolecular expansion. Secondly, the assumption of isotropic intermolecular interactions is an oversimplification in these systems. In contrast to the extreme cases of glass formation where the inhomogeneity of thermal expansion is negligible, i.e. inorganic glasses (like silica) characterized by extremely strong covalent bonds on the one hand and van der Waals glasses dominated by rather uniform weak interactions on the other hand, many molecular glasses contain both strong and weak interactions simultaneously. Particularly, the different impact of strong and weak bridges on structural relaxation and on density loosens the relation between the latter two properties which likely causes the open questions in the description of associating liquids Grzybowski and Paluch (2018). All this should motivate the consideration of distinct atomistic interactions in order to gain a molecular understanding of the dynamic glass transition in organic matter. To what extent these findings apply beyond associating liquids to complex glass forming systems in general, remains a challenge for future experimental and theoretical work.
I Acknowledgement
Financial support by the German Science Foundation (DFG) within the collaborative research center SFB TRR 102, sub-projects B08 and B15, respectively, is highly appreciated.
References
- Wong and Angell (1976) Wong, J.; Angell, C. Glass: Structure by Dynamics; Marcel Dekker, New York, 1976.
- Anderson (1979) Anderson, P. W. In Ill-Condensed Matter; Balian, R., Maynard, R., Toulouse, G., Eds.; North-Holland, Amsterdam, 1979; pp 159–261.
- Donth (1981) Donth, E. J. Glasübergang; Akademie-Verlag, Berlin, 1981.
- Zallen (1983) Zallen, R. The Physics of Amorphous Solids; John Wiley & Sons, Ltd, 1983.
- Elliott (1990) Elliott, S. Physics of amorphous materials; Harlow, Essex, England: Longman Scientific & Technical; New York: J. Wiley, 1990.
- Donth (1992) Donth, E. J. Relaxation and thermodynamics in polymers glass transition; Akademie Verlag GmbH, Berlin, 1992.
- Donth (2001) Donth, E. J. The Glass Transition; Springer-Verlag Berlin Heidelberg, 2001.
- Kremer and Schönhals (2002) Kremer, F.; Schönhals, A. Broadband Dielectric Spectroscopy, 1st ed.; Springer, 2002.
- Lubchenko and Wolynes (2007) Lubchenko, V.; Wolynes, P. G. Theory of Structural Glasses and Supercooled Liquids. Annual Review of Physical Chemistry 2007, 58, 235–266.
- Ngai (2011) Ngai, K. Relaxation and Diffusion in Complex Systems; Springer-Verlag New York, 2011.
- Götze (2012) Götze, W. Complex Dynamics of Glass-Forming Liquids: A Mode-Coupling Theory; Oxford University Press, 2012.
- Kremer and Loidl (2018) Kremer, F.; Loidl, A. The Scaling of Relaxation Processes; Advances in Dielectrics; Springer International Publishing, 2018.
- Fox and Flory (1950) Fox, T.; Flory, P. Second-Order Transition Temperatures and Related Properties of Polystyrene. I. Influence of Molecular Weight. Journal of Applied Physics 1950, 21, 581 – 591.
- Fox and Flory (1951) Fox, T.; Flory, P. Further Studies on the Melt Viscosity of Polyisobutylene. Journal of Physical Chemistry 1951, 55, 221 – 234.
- Fox and Flory (1954) Fox, T.; Flory, P. The glass temperature and related properties of polystyrene. Influence of molecular weight. Journal of Polymer Science 1954, 14, 315 – 319.
- Turnbull and Cohen (1961) Turnbull, D.; Cohen, M. Free-Volume Model of the Amorphous Phase: Glass Transition. Journal of Chemical Physics 1961, 34, 120 – 125.
- Bernal (1937) Bernal, J. An attempt at a molecular theory of liquid structure. Transactions of the Faraday Society 1937, 33, 27 – 40.
- Ediger (1998) Ediger, M. Can density or entropy fluctuations explain enhanced translational diffusion in glass-forming liquids? Journal of Non-Crystalline Solids 1998, 235-237, 10 – 18.
- Donth (2002) Donth, E. Dynamic or configurational approach to the glass transition? Journal of Non-Crystalline Solids 2002, 307-310, 364 – 375.
- Rissanou and Harmandaris (2015) Rissanou, A. N.; Harmandaris, V. Structural and Dynamical Properties of Polystyrene Thin Films Supported by Multiple Graphene Layers. Macromolecules 2015, 48, 2761–2772.
- Ediger (2000) Ediger, M. Spatially Heterogeneous Dynamics in Supercooled Liquids. Ann. Rev. Phys. Chem. 2000, 51, 99.
- Richert (2002) Richert, R. Heterogeneous dynamics in liquids: fluctuations in space and time. J. Phys.: Condens. Matter 2002, 14, R703–R738.
- Xia and Wolynes (2000) Xia, X.; Wolynes, P. G. Fragilities of liquids predicted from the random first order transition theory of glasses. Proceedings of the National Academy of Sciences 2000, 97, 2990–2994.
- Stevenson and Wolynes (2005) Stevenson, J. D.; Wolynes, P. G. Thermodynamic-Kinetic Correlations in Supercooled Liquids: A Critical Survey of Experimental Data and Predictions of the Random First-Order Transition Theory of Glasses. The Journal of Physical Chemistry B 2005, 109, 15093–15097.
- Dyre (2006) Dyre, J. C. Colloquium: The glass transition and elastic models of glass-forming liquids. Rev. Mod. Phys. 2006, 78, 953–972.
- Mirigian and Schweizer (2014) Mirigian, S.; Schweizer, K. S. Elastically cooperative activated barrier hopping theory of relaxation in viscous fluids. II. Thermal liquids. The Journal of Chemical Physics 2014, 140, 194507.
- Mauro et al. (2009) Mauro, J. C.; Allan, D. C.; Potuzak, M. Nonequilibrium viscosity of glass. Phys. Rev. B 2009, 80, 094204.
- Bosse et al. (1978) Bosse, J.; Götze, W.; Lücke, M. Mode-coupling theory of simple classical liquids. Phys. Rev. A 1978, 17, 434–446.
- Adam and Gibbs (1965) Adam, G.; Gibbs, J. H. On the Temperature Dependence of Cooperative Relaxation Properties in Glass-Forming Liquids. The Journal of Chemical Physics 1965, 43, 139–146.
- (30) If several beads describe one molecule, some intramolecular expansion may be formally included but is not distinguished from intermolecular expansion.
- Schneider et al. (1998) Schneider, U.; Lunkenheimer, P.; Brand, R.; Loidl, A. Dielectric and far-infrared spectroscopy of glycerol. Journal of Non-Crystalline Solids 1998, 235-237, 173 – 179.
- Wuttke et al. (1994) Wuttke, J.; Hernandez, J.; Li, G.; Coddens, G.; Cummins, H. Z.; Fujara, F.; Petry, W.; Sillescu, H. Neutron and light scattering study of supercooled glycerol. Phys. Rev. Lett. 1994, 72, 3052–3055.
- Klieber et al. (2013) Klieber, C.; Hecksher, T.; Pezeril, T.; Torchinsky, D. H.; Dyre, J. C.; Nelson, K. A. Mechanical spectra of glass-forming liquids. II. Gigahertz-frequency longitudinal and shear acoustic dynamics in glycerol and DC704 studied by time-domain Brillouin scattering. J. Chem. Phys. 2013, 138, 12A544.
- Jensen et al. (2018) Jensen, M. H.; Gainaru, C.; Alba-Simionesco, C.; Hecksher, T.; Niss, K. Slow rheological mode in glycerol and glycerol–water mixtures. Phys. Chem. Chem. Phys. 2018, 20, 1716–1723.
- Capponi et al. (2010) Capponi, S.; Napolitano, S.; Behrnd, N. R.; Couderc, G.; Hulliger, J.; Wübbenhorst, M. Structural Relaxation in Nanometer Thin Layers of Glycerol. The Journal of Physical Chemistry C 2010, 114, 16696–16699.
- Ryabov et al. (2003) Ryabov, Y. E.; Hayashi, Y.; Gutina, A.; Feldman, Y. Features of supercooled glycerol dynamics. Phys. Rev. B 2003, 67, 132202.
- Beevers et al. (1980) Beevers, M. S.; Elliott, D. A.; Williams, G. Static and dynamic Kerr-effect studies of glycerol in its highly viscous state. J. Chem. Soc., Faraday Trans. 2 1980, 76, 112–121.
- Mehl (1996) Mehl, P. M. Determination of enthalpy relaxation times using traditional differential scanning calorimetry for glycerol and for propylene glycol. Thermochimica Acta 1996, 272, 201 – 209, Advances in International Thermal Sciences: Environment, Polymers, Energy and Techniques.
- Gabriel et al. (2019) Gabriel, J. P.; Zourchang, P.; Pabst, F.; Helblingand, A.; Weigland, P.; Böhmerand, T.; Blochowicz, T. Intermolecular Cross-Correlations in the Dielectric Response of Glycerol. arXiv preprint arXiv:1911.10976 2019,
- Kremer et al. (2018) Kremer, F.; Kossack, W.; Anton, A. M. In The Scaling of Relaxation Processes; Kremer, F., Loidl, A., Eds.; Springer International Publishing, 2018; pp 61–76.
- Chelli et al. (2000) Chelli, R.; Gervasio, F. L.; Gellini, C.; Procacci, P.; Cardini, G.; Schettino, V. Density Functional Calculation of Structural and Vibrational Properties of Glycerol. J. Phys. Chem. A 2000, 104, 5351–5357.
- Bauer et al. (2015) Bauer, S.; Stern, J.; Böhm, F.; Gainaru, C.; Havenith, M.; Loerting, T.; Böhmer, R. Vibrational study of anharmonicity, supramolecular structure, and hydrogen bonding in two octanol isomers. Vibrational Spectroscopy 2015, 79, 59 – 66.
- (43) Generally, a shift in band position of a stretching vibration can have different causes; however, gradual shifts on heating/cooling reflect changes in respective bond length.
- Schrader (1995) Schrader, B. In Infrared and Raman Spectroscopy; Schrader, B., Ed.; VCH, Weinheim, 1995; pp 7–62.
- (45) We note that the following neutron scattering study, which employed fits of atom correlation models, claims that glycerol does not form CHO bridges; however, this conclusion is indirect and incompatible to the red-shift observed in the (CH2) band.
- Towey et al. (2011) Towey, J. J.; Soper, A. K.; Dougan, L. The structure of glycerol in the liquid state: a neutron diffraction study. Phys. Chem. Chem. Phys. 2011, 13, 9397–9406.
- Morse (1929) Morse, P. M. Diatomic Molecules According to the Wave Mechanics. II. Vibrational Levels. Phys. Rev. 1929, 34, 57–64.
- Dahl and Springborg (1988) Dahl, J. P.; Springborg, M. The Morse oscillator in position space, momentum space, and phase space. The Journal of Chemical Physics 1988, 88, 4535–4547.
- de Lima and Hornos (2005) de Lima, E. F.; Hornos, J. E. M. Matrix elements for the Morse potential under an external field. Journal of Physics B Atomic Molecular Physics 2005, 38, 815–825.
- Pacey (1975) Pacey, P. D. The Initial Stages of the Pyrolysis of Dimethyl Ether. Canadian Journal of Chemistry 1975, 53, 2742–2747.
- Benson and O’Neal (1970) Benson, S. W.; O’Neal, H. E. Kinetic data on gas phase unimolecular reactions; NSRDS-NBS21, 1970.
- Neese (2018) Neese, F. Software update: the ORCA program system, version 4.0. Wiley Interdisciplinary Reviews: Computational Molecular Science 2018, 8, e1327.
- Steiner (1995) Steiner, T. Weak hydrogen bonding. Part 1. Neutron diffraction data of amino acid C-H suggest lengthening of the covalent C-H bond in C-HO interactions. J. Chem. Soc., Perkin Trans. 2 1995, 1315–1319.
- Libowitzky (1999) Libowitzky, E. Correlation of O-H stretching frequencies and O-H…O hydrogen bond lengths in minerals. Monatshefte für Chemie / Chemical Monthly 1999, 130, 1047–1059.
- Steiner (2002) Steiner, T. The hydrogen bond in the solid state. Angewandte Chemie International Edition 2002, 41, 48–76.
- Blazhnov et al. (2004) Blazhnov, I. V.; Malomuzh, N. P.; Lishchuk, S. V. Temperature dependence of density, thermal expansion coefficient and shear viscosity of supercooled glycerol as a reflection of its structure. The Journal of chemical physics 2004, 121, 6435–6441.
- Deng and Callender (1999) Deng, H.; Callender, R. Enzyme kinetics and mechanism Part E: Energetics of Enzyme Catalysis; Methods in Enzymology; Academic Press, 1999; Vol. 308; pp 176 – 201.
- Braga et al. (1995) Braga, D.; Grepioni, F.; Biradha, K.; Pedireddi, V. R.; Desiraju, G. R. Hydrogen Bonding in Organometallic Crystals. 2. C-H…O Hydrogen Bonds in Bridged and Terminal First-Row Metal Carbonyls. J. Am. Chem. Soc. 1995, 117, 3156–3166.
- Steiner (1998) Steiner, T. Lengthening of the Covalent X-H Bond in Heteronuclear Hydrogen Bonds Quantified from Organic and Organometallic Neutron Crystal Structures. The Journal of Physical Chemistry A 1998, 102, 7041–7052.
- Sosa et al. (2002) Sosa, G. L.; Peruchena, N. M.; Contreras, R. H.; Castro, E. A. Topological and NBO analysis of hydrogen bonding interactions involving C–HO bonds. Journal of Molecular Structure: THEOCHEM 2002, 577, 219 – 228.
- (61) The density data below for glycerol taken from Naoki et al. (1993) are extrapolated from measurements of in crystalline state; i.e. the evolution below is more accurately captured in sorbitol.
- Naoki et al. (1993) Naoki, M.; Ujita, K.; Kashima, S. Pressure-volume-temperature relations and configurational energy of liquid, crystal, and glasses of D-sorbitol. The Journal of Physical Chemistry 1993, 97, 12356–12362.
- Sato et al. (2006) Sato, H.; Mori, K.; Murakami, R.; Ando, Y.; Takahashi, I.; Zhang, J.; Terauchi, H.; Hirose, F.; Senda, K.; Tashiro, K.; Noda, I.; Ozaki, Y. Crystal and Lamella Structure and C-HOC Hydrogen Bonding of Poly(3-hydroxyalkanoate) Studied by X-ray Diffraction and Infrared Spectroscopy. Macromolecules 2006, 39, 1525–1531.
- (64) Particularly, our findings oppose earlier views that, based on their dielectric response, glycerol and sorbitol might represent two different types of glass formers (type A and type B glasses, respectively).
- Lunkenheimer and Loidl (2002) Lunkenheimer, P.; Loidl, A. Dielectric spectroscopy of glass-forming materials: -relaxation and excess wing. Chem. Phys. 2002, 284, 205 – 219, Strange Kinetics.
- Geirhos et al. (2018) Geirhos, K.; Lunkenheimer, P.; Loidl, A. Johari-Goldstein Relaxation Far Below : Experimental Evidence for the Gardner Transition in Structural Glasses? Phys. Rev. Lett. 2018, 120, 085705.
- Kudlik et al. (1999) Kudlik, A.; Benkhof, S.; Blochowicz, T.; Tschirwitz, C.; Rössler, E. The Dielectric Response of Simple Organic Glass Formers. J. Mol. Struct. 1999, 479, 201–218.
- Lunkenheimer and Loidl (2018) Lunkenheimer, P.; Loidl, A. In The Scaling of Relaxation Processes; Kremer, F., Loidl, A., Eds.; Springer International Publishing, 2018; pp 23–59.
- Döß et al. (2002) Döß, A.; Paluch, M.; Sillescu, H.; Hinze, G. From Strong to Fragile Glass Formers: Secondary Relaxation in Polyalcohols. Phys. Rev. Lett. 2002, 88, 095701.
- Hensel-Bielowka et al. (2004) Hensel-Bielowka, S.; Pawlus, S.; Roland, C. M.; Zioło, J.; Paluch, M. Effect of large hydrostatic pressure on the dielectric loss spectrum of type- glass formers. Phys. Rev. E 2004, 69, 050501.
- Pronin et al. (2010) Pronin, A.; Kondrin, M.; Lyapin, A.; Brazhkin, V.; Volkov, A.; Lunkenheimer, P.; Loidl, A. Glassy dynamics under superhigh pressure. Phys. Rev. E 2010, 81, 041503.
- Gromnitskaya et al. (2019) Gromnitskaya, E. L.; Danilov, I. V.; Lyapin, A. G.; Brazhkin, V. V. Elastic properties of liquid and glassy propane-based alcohols under high pressure: the increasing role of hydrogen bonds in a homologous family. Phys. Chem. Chem. Phys. 2019, 21, 2665–2672.
- Floudas et al. (2010) Floudas, G.; Paluch, M.; Grzybowski, A.; Ngai, K. Molecular dynamics of glass-forming systems: effects of pressure; Springer Science & Business Media, 2010; Vol. 1.
- Grzybowski and Paluch (2018) Grzybowski, A.; Paluch, M. In The Scaling of Relaxation Processes; Kremer, F., Loidl, A., Eds.; Springer, 2018; pp 77–119.
- Ingebrigtsen et al. (2012) Ingebrigtsen, T. S.; Schrøder, T. B.; Dyre, J. C. Isomorphs in Model Molecular Liquids. The Journal of Physical Chemistry B 2012, 116, 1018–1034.
- Paluch et al. (2014) Paluch, M.; Masiewicz, E.; Grzybowski, A.; Pawlus, S.; Pionteck, J.; Wojnarowska, Z. General rules prospected for the liquid fragility in various material groups and different thermodynamic conditions. The Journal of Chemical Physics 2014, 141, 134507.
- Pawlus et al. (2011) Pawlus, S.; Paluch, M.; Grzybowski, A. Communication: Thermodynamic scaling of the Debye process in primary alcohols. The Journal of Chemical Physics 2011, 134, 041103.
- Pedersen et al. (2008) Pedersen, U. R.; Bailey, N. P.; Schrøder, T. B.; Dyre, J. C. Strong Pressure-Energy Correlations in van der Waals Liquids. Phys. Rev. Lett. 2008, 100, 015701.
- Niss and Hecksher (2018) Niss, K.; Hecksher, T. Perspective: Searching for simplicity rather than universality in glass-forming liquids. J. Chem. Phys. 2018, 149, 230901.
- Meier et al. (2012) Meier, R.; Kruk, D.; Gmeiner, J.; Rössler, E. A. Intermolecular relaxation in glycerol as revealed by field cycling 1H NMR relaxometry dilution experiments. J. Chem. Phys. 2012, 136, 034508.
- Flämig et al. (2019) Flämig, M.; Hofmann, M.; Fatkullin, N.; Rössler, E. NMR RELAXOMETRY: THE CANONICAL CASE GLYCEROL. J. Phys. Chem. B 2019, ?, ?
- Paluch and Roland (2003) Paluch, M.; Roland, C. The Avramov model of structural relaxation. Journal of Non-Crystalline Solids 2003, 316, 413 – 417.