On the origin of a rotating metal-poor stellar population in the Milky Way Nuclear Cluster
Abstract
We explore the origin of a population of stars recently detected in the inner parsec of the Milky Way Nuclear Cluster (NC), which exhibit sub-solar metallicity and a higher rotation compared to the dominant population. Using state-of-the-art -body simulations, we model the infall of a massive stellar system into the Galactic center, both of Galactic and extra-galactic origin. We show that the newly discovered population can either be the remnant of a massive star cluster formed a few kpc away from the Galactic center (Galactic scenario) or be accreted from a dwarf galaxy originally located at kpc (extragalactic scenario) and that reached the Galactic center Gyr ago. A comparison between our models and characteristic Galactocentric distance and metallicity distributions of Milky Way satellites and globular clusters favours the Galactic scenario. A comparison with clusters associated with the Enceladus-Sausage, Sequoia, Sagittarius and Canis Major structures suggests that the progenitor of the observed metal-poor substructure formed in-situ rather than being accreted.
1 Introduction
Like the majority of galaxies in the Universe, the center of the Milky Way (MW) harbours a supermassive black hole (SMBH), SgrA*, with a mass (Ghez et al., 2008; Gillessen et al., 2017), surrounded by a dense and massive nuclear star cluster (NC) with a total mass of (Schödel et al., 2014; Feldmeier-Krause et al., 2017b; Neumayer et al., 2020) and effective radius pc (Schödel et al., 2014; Gallego-Cano et al., 2020). The Galactic center is the closest galactic nucleus, thus representing a unique target to study the interplay between an SMBH and its environment. In our companion paper (Do et al., in press), we present observations of a region of the Galactic center centered on SgrA* and with a projected radius of pc pc based on the dataset and metallicity measurements obtained with the KMOS spectrograph on the Very Large Telescope (VLT) (Feldmeier-Krause et al., 2017a). This seeing-limited spectroscopic survey consists of about 700 late-type giant stars with ages of about 3-10 Gyr. Their spectral-type, metallicity and radial velocities were measured via full-spectrum fitting (Kerzendorf & Do, 2015; Feldmeier-Krause et al., 2017a). These observations revealed the presence of a sub-population of stars characterised by lower metallicity and higher rotation than the overall NC population, which may be the relics of a star cluster spiralled in via dynamical friction (Feldmeier et al., 2014), as suggested by numerical models (Tsatsi et al., 2017).
In this letter, we use a high-resolution -body simulation to explore whether these chemical and kinematical features can be explained with a recent infall of either a massive and dense stellar cluster or a dwarf galaxy nucleus into the Galactic center. Such an event would support the so-called “dry-merger” scenario for NCs, according to which NCs are built, at least partially, by the inspiral and merging of star clusters (SCs) via dynamical friction (Tremaine et al., 1975; Capuzzo-Dolcetta, 1993). This scenario accounts for several observational features of both the Galactic (Antonini et al., 2012; Perets & Mastrobuono-Battisti, 2014; Tsatsi et al., 2017) and extragalactic NCs (Antonini, 2013; Arca-Sedda et al., 2015; Arca-Sedda & Capuzzo-Dolcetta, 2017), although it likely operates in concert with in-situ star formation (Neumayer et al., 2011; Antonini, 2013; Guillard et al., 2016), which can explain the complex star-formation histories observed in the majority of NCs (see e.g. Rossa et al., 2006; Seth et al., 2006). Alternatively, the low metallicity population might be the result of an old in-situ star formation episode following inflow of metal poor gas into the Galactic center. However, relaxation processes would likely have erased the peculiarities of the population (e.g. Alexander, 2005).
2 Numerical method
To study the possible origin of the rotating metal-poor stellar population presented in our companion paper, we analyze data from one of the direct summation -body simulations presented in Arca-Sedda & Gualandris (2018). Specifically, we use the model denominated “Ma”, that simulates the orbital decay of a massive SC in a galactic nucleus composed of a nuclear bulge, a NC, and an SMBH. In the simulation, both the SC and the inner 150 pc of the galactic nucleus are modelled with a total of particles, corresponding to a mass resolution of . This represents the current state-of-the-art for simulations of this type. The nuclear bulge is modelled as a truncated Plummer (1911) sphere with a total mass of (Valenti et al., 2016), a length scale kpc, and a truncation radius of pc. This choice leads to a circular velocity profile compatible with observations of the Galactic bulge (Portail et al., 2015). The NC is modelled as a non-rotating Dehnen (1993) sphere with inner slope , scale radius pc, and total mass . The central SMBH is accounted for as a point-like particle with mass . The SC is modelled as a King (1966) sphere with total mass , core radius pc, and adimensional concentration parameter that initially moves on a circular orbit at a distance of pc from the Galactic center. The center of the SC contains an intermediate mass black hole (IMBH) with mass . The presence of an IMBH of such mass does not affect the infalling process nor the mass loss suffered by the SC as it migrates inward (see Figures 3 and 7 in Arca-Sedda & Gualandris, 2018). Moreover, the IMBH is not expected to affect the relaxation process of the SC on the short ( Myr) time-scale of the inspiral, nor the relaxation of the galactic nucleus, given the small IMBH to SMBH mass ratio.
We note that our SC model can also be interpreted as the remaining nucleus of a dwarf galaxy that merged with the MW and lost its stellar envelope, a scenario suggested to explain the properties of several globular clusters observed in the MW halo, including Cen (Hilker & Richtler, 2000) and M54 (Alfaro-Cuello et al., 2019, 2020). We stress that the numerical setup adopted here does not rely on any assumption on the earlier SC evolution. Our working hypothesis is that the SC progenitor formed outside the Galactic center and slowly migrated inward, losing stars on its way due to the Galactic tidal field and eventually merging with the NC. Our only requirement is that the SC reaches the inner 50 pc preserving a clear structure and a mass . This is further discussed in Section 4.1 where we place constraints on the SC history.
3 Results
3.1 Star Cluster infall and merger with the Galactic Nuclear Cluster
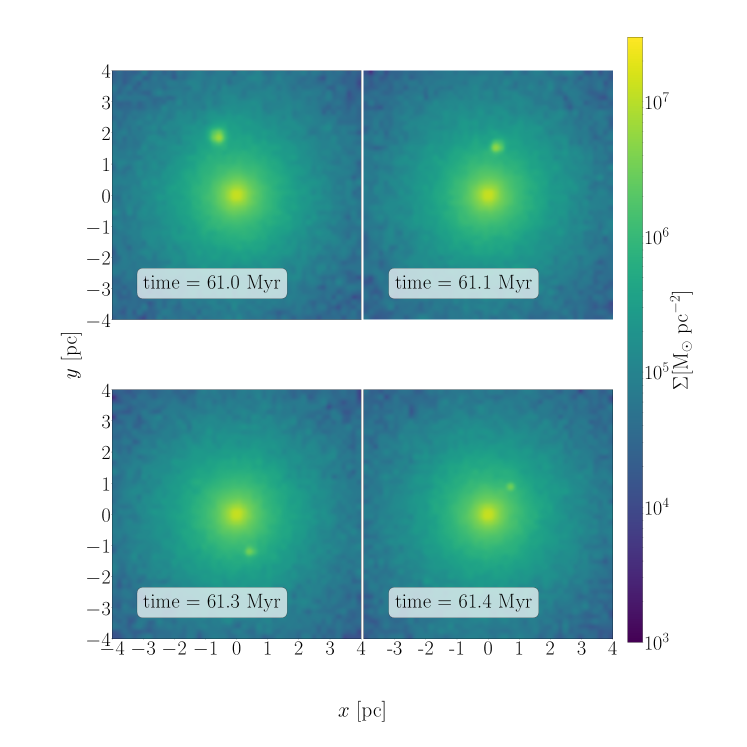
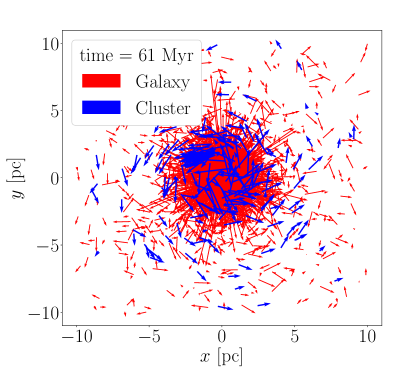
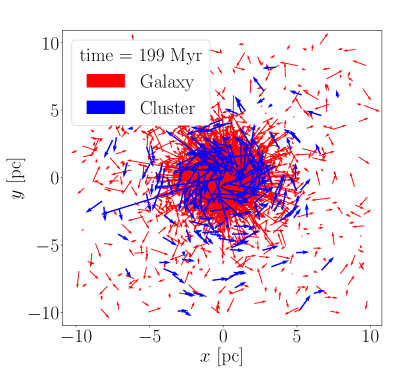
As the SC spirals inward due to dynamical friction, stars are stripped due to the combined tidal forces exerted by the Galactic field and the SMBH. This process, together with the SC compactness, determines the amount of mass brought into the Galactic center. In our simulation, the SC enters the inner 10 pc after Myr (e.g. Figure 24 in Arca-Sedda & Gualandris, 2018). Beyond this point, our aim is to understand whether, and for how long, the SC debris remains clearly distinguishable from NC members. Once inside the NC’s effective radius of pc, the dissolution of the cluster proceeds quickly, and within 1 Myr the cluster cannot be considered a self-gravitating system any longer, as can be seen in the surface density maps shown in Figure 1.
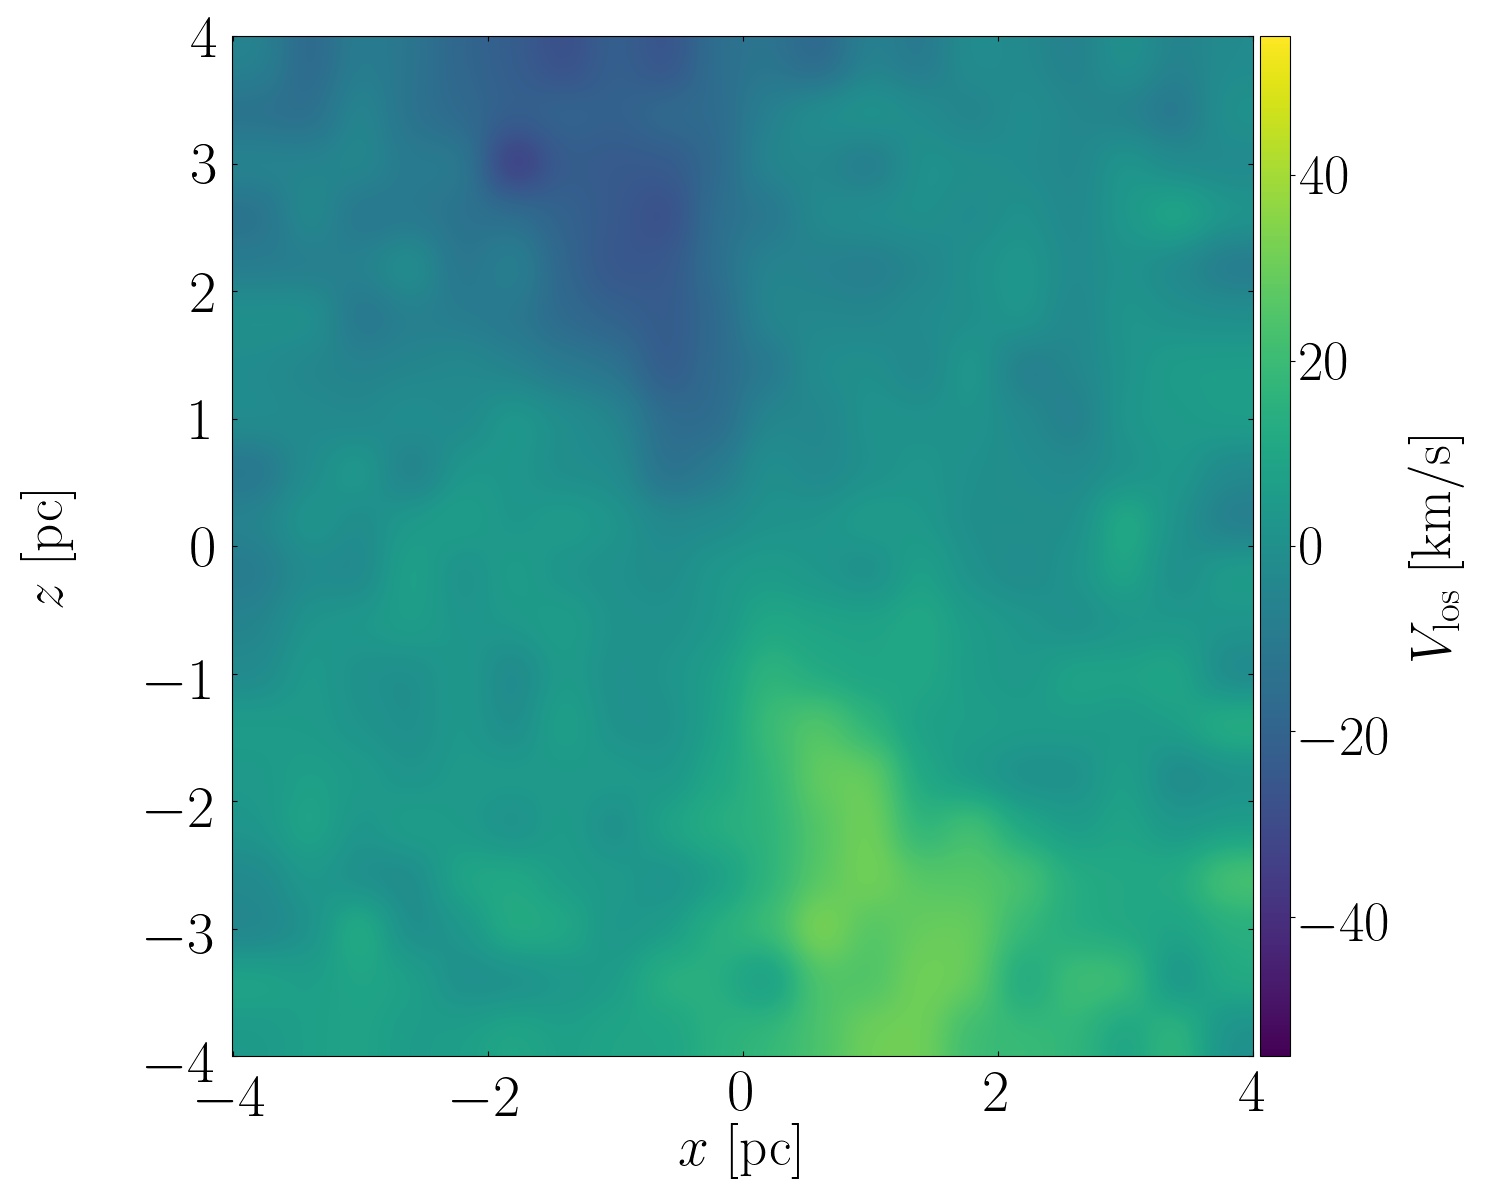
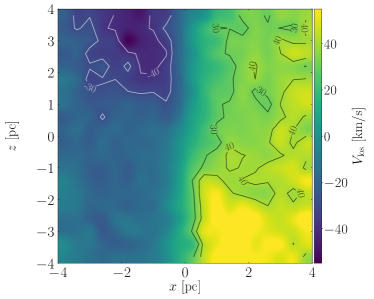
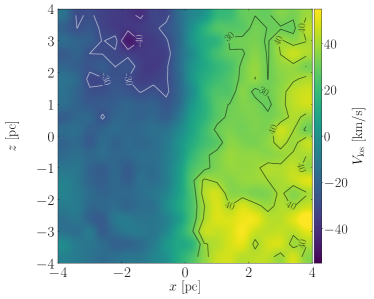
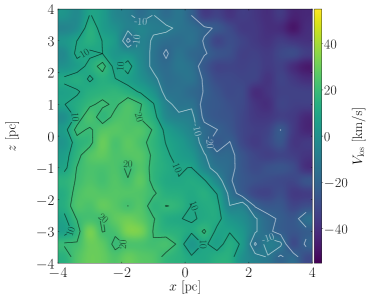
The stars deposited during the cluster inspiral might maintain signatures of their origin, showing for instance different kinematics compared to the underlying Galactic center population. The rotation of the NC (Feldmeier et al., 2014), however, which is not included in our simulation, might erase some of these features. We therefore add a line-of-sight (LOS) velocity component to the data before recovering features at the present time. We consider the following cases: a) no rotation, b) added rotation in the NC only, c) added rotation in both the NC and the SC stars assuming a relative prograde motion, d) added retrograde rotation in both the NC and the SC stars assuming a relative retrograde motion. In the case b the former SC members do not mix kinematically with the NC while cases c and d represent the extreme scenarios in which the SC members experience the full drag of the NC rotation. To reproduce the observational constraints, we assume that the SC is inclined by 108 degrees with respect to the NC’s rotation axis.
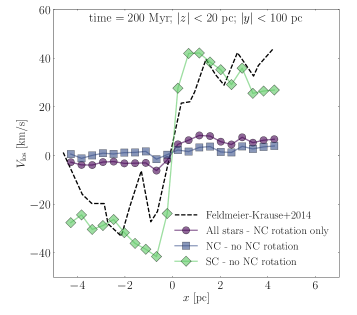
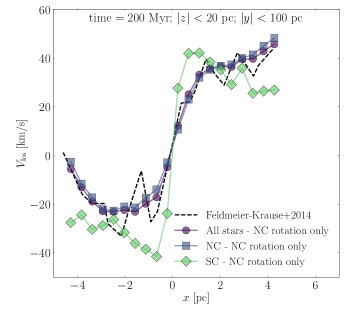
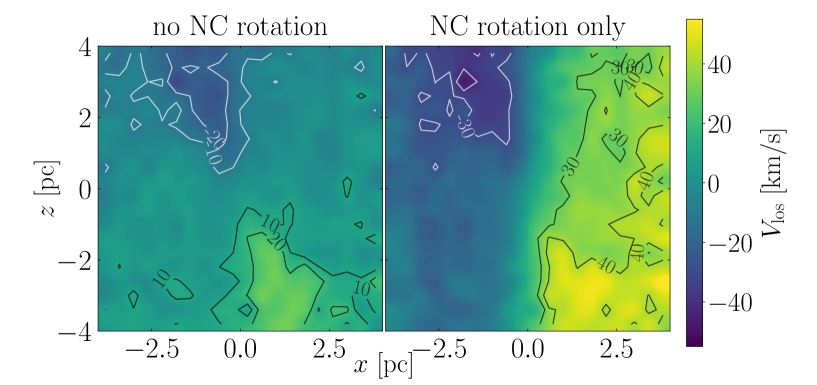
Figure 2 shows the LOS velocity curve for SC members and background stars separately, as well as for the total combined population, assuming that our LOS lies in the SC’s orbital plane, and assuming a field of view of 20 pc in the XZ-plane and of 100 pc along the Y-direction. We compare the non-rotating model (a) and the model in which NC rotates but former SC members orbits remain unaffected by rotation (b). It is evident that the cluster debris contributes to the overall NC rotation at least within the simulated time, i.e. Myr after the SC disruption111Note that the SC dissolution happens over 65 Myr, whereas the total simulated time is 200 Myr., providing a significant contribution to the overall dynamics. The lower panels show the LOS velocity map in both cases. The SC debris appears as a tilted overdensity in the map, even in the case in which a NC rotation component is taken into account. We find that the SC kinematics remains visible even if the SC orbit is retrograde with respect to the NC rotation (see Appendix A). We show in Appendix B that relaxation processes can erase these features over a timescale of at most 3 Gyr.
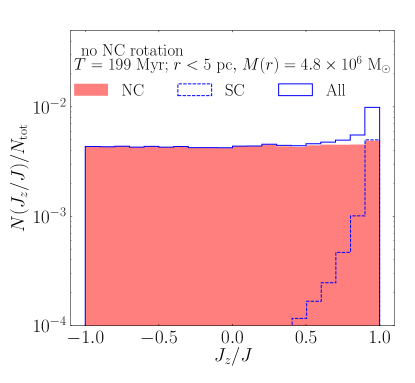
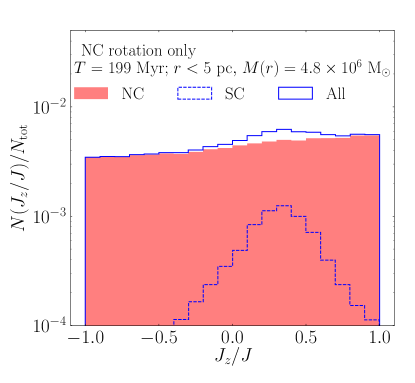
Measuring stellar proper motions for the observed sample would provide further evidence of a recent SC infall. Figure 3 shows the velocity vectors of a sample of 20971 stars ( of the simulated system) selected assuming pc, pc, and pc and no NC rotation. We find that former SC members constitute of the sample. Before dissolution, the SC is clearly visible in the map in the form of a concentration in the top-left region of the NC, and remains recognizable for at least 100 Myr after dissolution. The timescale over which these kinematical features persist depends on the process that regulates the relaxation of the SC debris. As discussed in the Appendix B, two-body relaxation between SC and NC stars erases such features over a timescale of Gyr, suggesting that the SC infall into the Galactic center is unlikely to have happened earlier than 3 Gyr ago. The effects of the SC debris on the overall kinematics can also be seen in the stellar angular momentum. In particular, for both former SC members and NC stars orbiting inside the inner 5 pc, we calculate the circularity parameter, defined as the ratio of the z-component of the angular momentum and the total angular momentum of a star, , and assuming a reference frame coinciding with the directions set by the Galactic center inertia tensor. Values indicate a planar prograde motion, whereas indicates retrograde motion, and intermediate values indicate a kinematically supported distribution of energies. The bottom panels of Figure 3 show the distribution of the circularity parameter calculated in a sphere of radius 5 pc for Galactic and SC stars after time Myr for cases a) and b). In the former case we assume that the orbital plane of the SC lies in the X-Y plane, whereas in the latter we assume that the rotation axis of the NC is parallel to the Z-axis. In both cases, SC members determine the formation of a clear peak in , even when the SC orbit is misaligned with respect to the NC rotation axis. However, constraining requires a level of precision in measuring stellar distances not achievable with current instruments. An alternative, measurable quantity would be the “sky-projected angular momentum” (see Equation B1 in Paumard et al., 2006), which combines stellar position and velocities lying in the plane normal to the LOS. However, we find that if our LOS – which defines the z-direction – lies in the NC rotation plane it is practically impossible distinguishing SC debris from the overall stellar population.
To enable a comparison with future observational data, we provide position, velocity, and angular momentum of all stars in our simulation as detailed in Section E.
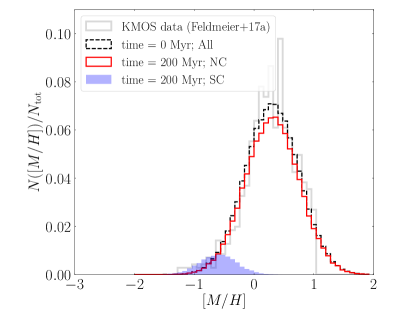
3.2 Evolution of the Metallicity Distribution via Star Cluster Infall
A further peculiarity of the stars discussed in our companion paper (Do et al., in press) is that they are considerably more metal poor than the overall distribution. To test whether this finding is compatible with a SC infall event, we adopt the following “tagging” procedure: i) at the start of the simulation, at time , we tag each star in the galaxy and in the SC with a value assigned according to a given distribution, ii) at time , we reconstruct the metallicity distribution of stars in a given region of phase space. We follow the observational constraints of a metal-rich population with a broad distribution peaked at and a metal-poor population with a weak peak at and model the metallicity distribution with two Gaussian curves. For SC members, we assume that the distribution has a mean value of and a spread of , whereas for NC stars we set and . Figure 4 shows the reconstructed distribution for stars in the central 5.5 pc at times Myr. Under our simplistic assumptions, the overall distribution of resembles the observed one (see Figure 3 in Do et al.), with former SC stars dominating the distribution in the range . We note that the relative amount of metal-poor versus metal-rich stars is completely determined by the competing actions of dynamical friction, which brings SC stars toward the Galactic center, and tidal disruption, which tends to strip stars away from the SC. Inside the innermost 4 pc, we find that former SC members constitute of the total stellar population, compatible with the percentage found in the observed sample (). The accumulation of such a large number of SC members into the innermost NC regions is due to the fact that the cluster core survives the intense tidal forces and is therefore able to deposit stars into the NC.
4 Discussion
4.1 The Origin of the Metal-Poor Stellar Population: Galactic or Extragalactic?
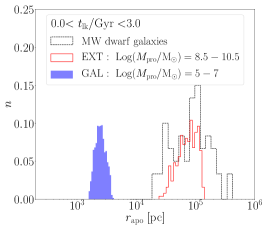
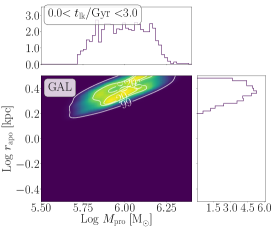
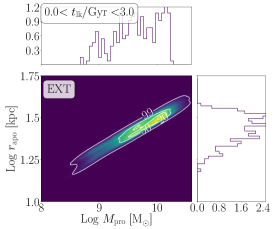
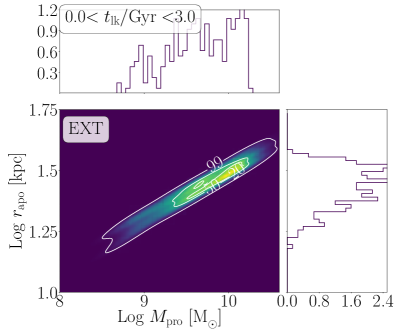
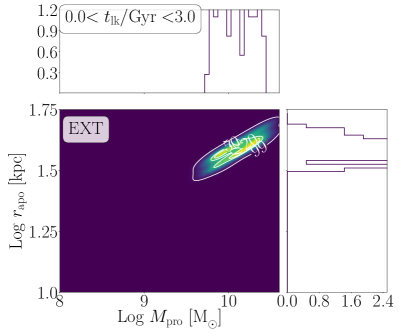
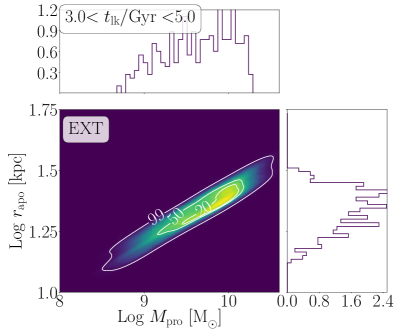
To place constraints on the origin of the SC progenitor we develop a semi-analytic approach, described in Appendix C, to model the evolution of the SC before it reaches the Galactic center under the effects of dynamical friction and tidal disruption processes. We focus on the two special cases where the SC is either the remnant of a Galactic cluster (model ”GAL”) or the nucleus of a dwarf galaxy (model ”EXT”). We create two samples of 50,000 SC progenitor models each, varying the orbital and structural properties of the infaller as detailed in Appendix C.
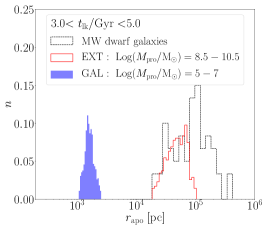
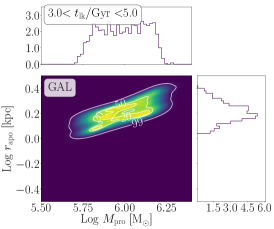
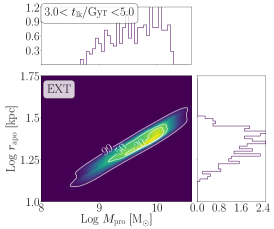
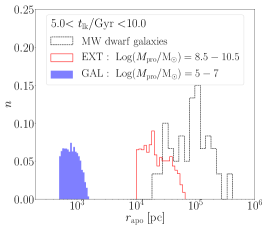
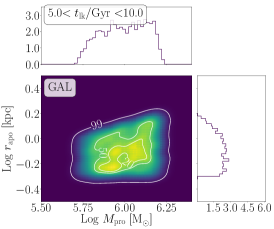
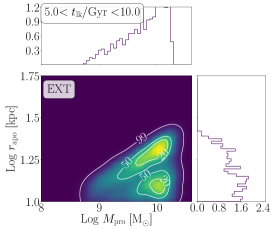
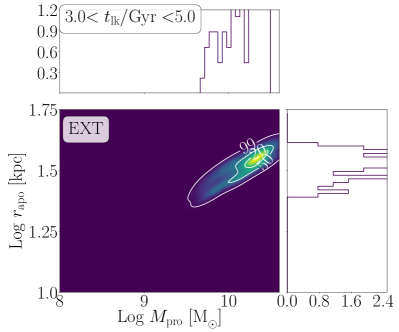
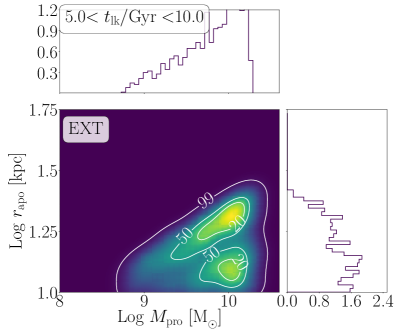
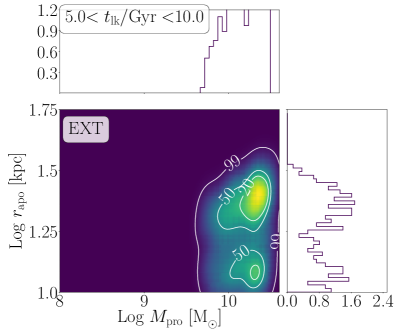
Among all models, we select progenitors delivering in stars in the central pc222Our semi-analytic treatment of the infall process does not account for tidal effects arising from the NC, thus we limit the model to distances larger than 50 pc where the NC’s tidal field is negligible compared to the galactic field., so to be compatible with the simulated SC. We store their initial position, mass, and arrival time , namely the time since the cluster crossed the 50 pc radius. We differentiate between late ( Gyr), recent (), and early infalls (). Since we assume that the progenitor system formed 10 Gyr ago, the arrival time represents a measure of the time that the SC debris spent at the Galactic center: an arrival time of 3 Gyr means that the SC formed 10 Gyr ago and it took 7 Gyr to reach the inner 50 pc. We highlight the fact that while our numerical model focuses on a SC with total mass , having such a mass is not a sine qua non condition. A cluster remnant that is lighter but denser (or heavier but sparser) than the one used in our model could bring, in principle, the same amount of mass into the Galactic center. The left panels of Figure 5 show the distribution of initial Galactocentric distances for both GAL and EXT models under the assumptions above. If the metal-poor population is the remainder of a Galactic cluster, it should have formed at kpc, whereas in the case of a spiralling dwarf galaxy we find kpc. For comparison, we also show the current location of the MW dwarf satellite galaxies333https://web.archive.org/web/20140219170336/http://www.astro.uu.se/~ns/mwsat.html in the figure. We note that the range of initial locations for late and recent infalls ( Gyr) is shifted toward larger values compared to early infall events, since the farther the progenitor the longer the dynamical friction timescale444For simplicity we assume that SC progenitors formed 10 Gyr ago, as typical for Galactic globular clusters.. The right panels of Figure 5 show the combined distribution of and for model GAL and EXT and for different values.
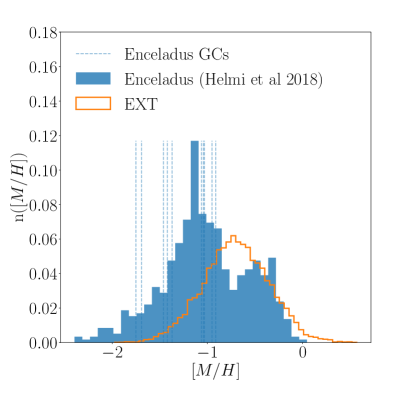
Another intriguing possibility is an hybrid EXT/GAL scenario in which a dwarf galaxy accreted into the MW halo left one of its star clusters sufficiently close to the Galactic center ( kpc) for it to spiral-in within a Hubble time. In fact, a number of structures in the Milky Way have been recently identified as possible relics of accretion events, e.g. the Sausage (Gaia Enceladus, Belokurov et al., 2018; Myeong et al., 2018), likely the remnant of a dwarf galaxy that interacted with the MW Gyr ago (Helmi et al., 2018; Di Matteo et al., 2019), or Sequoia (Myeong et al., 2019). These are likely remnants of satellites as massive as that polluted the Milky Way’s star cluster population with their own clusters. Thus, in the case of an EXT or GAL+EXT origin, the metallicity of the progenitor should be comparable to that of dwarf galaxies orbiting the Milky Way or of accreted clusters. We compare the metallicity distribution of our EXT model with that of Gaia-Enceladus stars (Helmi et al., 2018) in the top panel of Figure 6, which shows that the Galactic center stellar population is more metal rich than Gaia-Enceladus stars. This rules out, or at least disfavors, the scenario in which the nucleus of Enceladus reached the Galactic Centre, unless it was significantly more metal-rich than the overall metallicity of the system. Note that the average metallicities of Enceladus/Sausage globular clusters are lower than the peak metallicity measured for the structure at the Galactic Centre.
The bottom panel shows a comparison of the Galactocentric distance versus metallicity555 To convert the measured into , we fit the - data provided by Helmi et al. (2018) using a linear relation. our EXT and GAL progenitors with the sample of dwarf galaxies compiled by Grebel et al. (2003), as well as Galactic globular clusters and Sequoia and Sausage clusters. Our EXT model is located in an area of the relation scarcely populated by MW satellites, although this dearth of members might be due to the fact that dwarf galaxies were accreted a long time ago. In the case of a Galactic origin and a recent infall, the progenitor location is kpc with . In the same panel, we compare our GAL model with Galactic globular clusters666To convert the provided by Harris (2010) we assume a (Pritzl et al., 2005) (Harris, 1996, 2010). The plot shows a remarkably good agreement between our model and low-orbit globular clusters. All the closest clusters in the distance-metallicity plane shown here (e.g. NGC6569, NGC6256, NGC6171, NGC6401, and NGC6638) have masses , thus smaller than the expected progenitor mass, but these clusters might have undergone mass loss over their 10 Gyr lifetime.
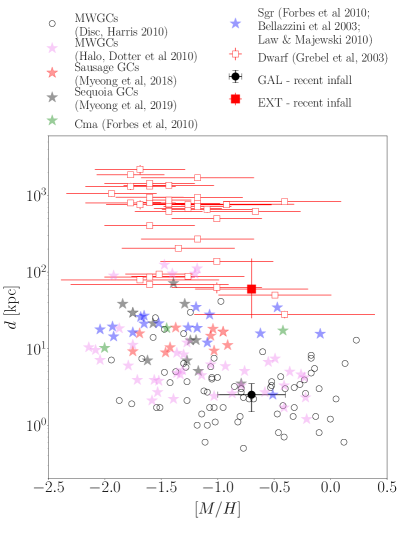
To test the feasibility of the GAL+EXT scenario, we highlight halo GCs (Dotter et al., 2010), GCs associated with the Sequoia and Enceladus streams (see Myeong et al., 2018, 2019, and reference therein), the Sagittarius (Sgr, Bellazzini et al., 2003; Forbes & Bridges, 2010; Dotter et al., 2010; Law & Majewski, 2010) and Canis Major dwarf galaxies (Cma Forbes & Bridges, 2010). We find that only two GCs associated with Sequoia and Sgr are compatible with our model, while the range of distances and metallicities turn out to be compatible with both disc and halo GCs. Since the latter are expected to be accreted during the MW build-up (at least a sub-sample of them) we cannot rule out an extra-galactic origin for the metal-poor population at the Galactic center.
Nonetheless, the Galactic scenario seems to provide a better match to the observational constraints, and is therefore our favored explanation for the origin of the peculiar metal-poor stars at the Galactic center. The progenitor cluster could have formed in-situ, as the comparison with low-orbit globular clusters suggests, although an accretion origin is plausible in light of the possible accretion of low-orbit halo GCs during the MW assembly.
5 Conclusions
We explore an infall scenario as the possible origin of a population of metal-poor, fast rotating stars observed in the innermost 2 pc of the Galactic center. We use state-of-the-art -body simulations to model the orbital decay of a stellar system with mass located at an initial distance of pc from the Galactic center, taking into account the gravitational effects from the infalling cluster, the NC, and the central SMBH. Our results can be summarized as follows:
-
•
the inspiral happens over a timescale of Myr, after which tidal forces lead to cluster disruption in Myr;
-
•
once inside the NC, the cluster debris preserves a clear kinematical signature, namely a higher level of rotation compared to the NC population, which is particularly evident in the line-of-sight velocity profile. This supports an infall origin for the observed metal-poor stars;
-
•
former cluster stars ( of the stars in the inner 4 pc) have velocity vectors that draw a clear pattern in the cluster’s orbital plane and a distinct distribution of the circularity parameter;
-
•
the reconstructed metallicity distribution obtained by tagging stars in the simulation with a metallicity sampled from the observed distribution reveals a clear contribution of cluster members at low and is fully consistent with observations;
-
•
we model the effects of dynamical friction and tidal disruption of possible galactic and extra-galaactic cluster progenitors with a semi-analytic model, distinguishing among early, recent and late inspiral. For a Galactic progenitor, our models suggest an initial location at kpc for late infall and kpc for early infall, whereas for an extragalactic progenitor we find from kpc (late infall) to kpc (early infall);
-
•
a comparison with known accreted structures and their clusters, as well as Galactic globular clusters, shows no connection with Gaia-Enceladus, Sequoia or the Sagittarius dwarf but is compatible with low orbit clusters either in the disk or the halo.
We conclude that the most likely scenario for the observed metal poor population is the remnant of a star cluster formed in the inner regions of the Galaxy, although the possibility that it has been deposited by a disrupting dwarf galaxy 10 Gyr ago cannot be fully ruled out. The identification of footprints from such a disrupted satellite would shed light on the origin of the system.
Acknowledgements
The authors are warmly grateful to the referee for their insightful and detailed report which helped to improve the manuscript. MAS acknowledges financial support from the Alexander von Humboldt Foundation for the research program “The evolution of black holes from stellar to galactic scales” and through the Volkswagen Foundation Trilateral Partnership project No. I/97778 “Dynamical Mechanisms of Accretion in Galactic Nuclei”. MAS and NN gratefully acknowledges support by the Deutsche Forschungsgemeinschaft (DFG, German Research Foundation) – Project-ID 138713538 – SFB 881 (“The Milky Way System”, subproject Z2 and B8). Part of the simulations presented in this work have been performed with the bwForCluster of the Baden-Württemberg’s High Performance Computing (HPC) facilities thanks to the support provided by the state of Baden-Württemberg through bwHPC and the German Research Foundation (DFG) through grant INST 35/1134-1 FUGG.
Appendix A The effects of nuclear cluster rotation
In order to asses the importance of the NC pristine rotation in washing out the kinematic features of the metal-poor population we post-processed our data following four different sets of assumptions, limiting our analysis to particles in a box of 5 pc length and assuming particles with depth pc:
-
i)
the NC is non-rotating;
-
ii)
a los velocity component is added to both NC and SC particles ;
-
iii)
a los velocity component is added to NC particles only;
-
iv)
a los velocity component is added to NC particles only, assuming that the rotation is retrograde compared with the SC orbital motion.
Figure 7 shows the map of the average LOS velocity calculated for the four cases depicted above assuming a total simulation time of 200 Myr. In all the models explored, the SC debris appears as a diagonal overdensity in the maps. Note that this peculiar distribution is fully driven by the SC debris, as the NC rotation axis in this frame is assumed to be parallel to the Z-axis.
Appendix B The lifetime of the kinematical signatures
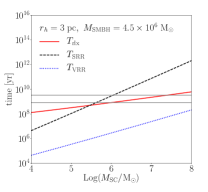
In Section 3.1 we demonstrated that the SC debris remains kinematically distinguishable from the NC for a timescale of at least 100 Myr. Upon dispersal, the SC debris will mix with the NC via two-body relaxation over a timescale (Spitzer & Hart, 1971; Binney & Tremaine, 2008)
| (B1) |
Further mechanisms that can affect the relaxation process are the so-called scalar (SRR) and vector resonant relaxation (VRR) (Alexander, 2017). These mechanisms are driven by torques on stellar orbits around the central SMBH (Rauch & Tremaine, 1996). For disc-like configurations, this process can induce warps (Kocsis & Tremaine, 2011; Perets et al., 2018) and the formation of spiral arm substructures (Perets et al., 2018), without affecting the configuration of the system. The timescales for SRR and VRR are (Alexander, 2017)
for a given mass of the Galactic NC and SMBH. Because the NC’s radius of pc is larger than the radius of influence of the SMBH, we only expect a minor influence of the central black hole on the relaxation process. Figure 8 shows how these timescales vary as a function of the cluster mass. The relaxation time for the Galactic NC is Gyr. SRR is slower than two-body relaxation, whereas VRR operates on timescales Myr. Since VRR preserves the structure of the system and , we can assume that VRR and the relaxation times bracket the lifetime of the kinematical features, suggesting that the SC disruption should have happened not more than Gyr ago.
Nonetheless, we note that rotation can lenghten the half-mass relaxation time by a factor up to 3, at least in the simplistic case of a spherically symmetric rotating system (Longaretti & Lagoute, 1996). However, whether this lengthening of the relaxation time holds for stellar systems harboring an SMBH and a complex substructure (e.g. the SC debris) is unclear.
Appendix C Semi-analytic modelling of stellar system inspiral
We model the inspiral of the cluster with a semi-analytic model where dynamical friction operates on a timescale which can be written as (Arca-Sedda & Capuzzo-Dolcetta, 2014; Arca-Sedda et al., 2015)
| (C1) |
where
is a weak function of the cluster’s orbital eccentricity , , is its orbital period, the SC orbital apocenter, and , , and are the host galaxy total mass, length scale and slope of the density profile (see Arca-Sedda et al., 2015, for further details). Equation C1 can be used to place constraints on the distance at which the SC formed, which we denote with . Assuming that the decay process can be approximated as an infinite sequence of adiabatic decays, the cluster’s infall rate can be written as:
| (C2) |
whose integration leads to
| (C3) |
being the initial orbital apocenter. The equation above does not account for the SC’s mass loss induced by Galactic tidal forces. Mass loss can be included in the model by discretizing the cluster’s orbit in segments, each covered in a time interval , such that the position of the SC at time is given by
| (C4) |
with () the mass and position of the SC at time . Note that assuming constant implies equality between Equations C3 and C4. As the SC migrates inward, its size will be limited by the Jacobi radius, i.e. the radius beyond which stars are no longer bound to the SC
| (C5) | ||||
| (C6) |
being the Galactic mass enclosed within the SC orbit, and the SC mass enclosed within the Jacobi radius. Moreover, we assume that the orbit of the infaller circularizes over time due to dynamical friction. For the sake of simplicity, we assume an exponential decline. We postpone a discussion of the role of eccentricity to Appendix C. Combining Equations C4, C5, and C6, we can follow the SC infall and disruption processes once we set the initial values of its mass, orbital radius, and eccentricity.
As discussed in Section 4.1, we use the equations above to follow the orbital evolution of the SC ”progenitor” to a distance of 50 pc from the Galactic center, distinguishing between a Galactic (GAL) and Extragalactic (EXT) origin. In sample GAL, the SC progenitor is modelled as a Plummer (1911) sphere with half-mass radius of pc and mass assigned in the range . The cluster’s initial apocenter is selected between kpc, whereas the initial eccentricity is assumed to be , following Gaia DR2 observational constraints (Gaia Collaboration et al., 2018). In sample EXT we assume that the SC progenitor was originally a dwarf galaxy, which is modelled as a Dehnen (1993) sphere with an inner slope of the density profile , mass selected in the range and scale radius in the range pc. The initial apocenter is selected in the range kpc and the eccentricity is set to . In both samples, and are drawn from log-flat distributions, and we set the progenitor’s formation time to 10 Gyr ago. In sample GAL, the Galactic bulge is the component that mostly contributes to dynamical friction and tidal forces, while in sample EXT the dark matter halo is the dominant component, modelled as a Dehnen sphere with total mass , scale length kpc, and slope (Dutton & Macciò, 2014). We note that both the Galactic bulge and the halo are accounted for to solve Eq. C4-C6.
Appendix D The role of the infaller’s progenitor orbital eccentricity
In order to evaluate the importance of the orbital eccentricity of the infaller’s progenitor, we considered an additional EXT model assuming , as inferred from cosmological simulations of galactic satellites at high redshift (Wetzel, 2011).
A larger eccentricity implies i) a shorter dynamical friction time and therefore a larger possible original distance for the same age ii) a more effective mass loss at pericenter due to a smaller tidal radius for the infaller, leading to larger progenitor initial masses. This is highlighted in Figure 9, which shows the combined distributions of initial mass and Galactocentric distance for infallers in the EXT model. We find that a larger value of initial eccentricity would imply a progenitor with mass narrowly peaked around and initial position of either kpc (late infall) or kpc (early infall).
Appendix E A mock stellar catalogue of the Galactic center
Despite the limitations of our current approach, our model represents the first test-bed to be compared against upcoming proper motions of stars in the Galactic center. In this context, we make the following simulation data publicly available: stellar positions (, , ), velocities (, , ), X-component of the angular momentum per unit mass (, assuming that this is aligned with the rotation axis of the NC), and the ellipticity parameter for all stars orbiting inside the innermost 5 pc. A flag is used to identify former SC members (flag=1) and NS stars (flag=0). All quantities refer to times Myr and Myr and are taken from the post-processed data in which rotation is added to the NC stars only, as detailed in Sections 3.1 and A. We caution that this process is not fully self-consistent, and a more realistic exploration of the role of NC rotation will be presented in a future work. Nonetheless, this “mock” catalogue of stellar motion inside the central 5 pc of the Galaxy can provide a useful reference when attempting to interpret current and future data. A small excerpt of the catalogue is given in Table 1.
| F | ||||||||
| pc | pc | pc | km/s | km/s | km/s | m2/s | ||
| Myr | ||||||||
| … | ||||||||
| … | ||||||||
| … | ||||||||
| Myr | ||||||||
| … | ||||||||
| … | ||||||||
| … | ||||||||
References
- Alexander (2005) Alexander, T. 2005, Phys. Rep., 419, 65
- Alexander (2017) —. 2017, ARA&A, 55, 17
- Alfaro-Cuello et al. (2019) Alfaro-Cuello, M., Kacharov, N., Neumayer, N., et al. 2019, ApJ, 886, 57
- Alfaro-Cuello et al. (2020) —. 2020, ApJ, 892, 20
- Antonini (2013) Antonini, F. 2013, ApJ, 763, 62
- Antonini et al. (2012) Antonini, F., Capuzzo-Dolcetta, R., Mastrobuono-Battisti, A., & Merritt, D. 2012, ApJ, 750, 111
- Arca-Sedda & Capuzzo-Dolcetta (2014) Arca-Sedda, M., & Capuzzo-Dolcetta, R. 2014, ApJ, 785, 51
- Arca-Sedda & Capuzzo-Dolcetta (2017) —. 2017, MNRAS, 471, 478
- Arca-Sedda et al. (2015) Arca-Sedda, M., Capuzzo-Dolcetta, R., Antonini, F., & Seth, A. 2015, ApJ, 806, 220
- Arca-Sedda & Gualandris (2018) Arca-Sedda, M., & Gualandris, A. 2018, MNRAS, 477, 4423
- Bellazzini et al. (2003) Bellazzini, M., Ferraro, F. R., & Ibata, R. 2003, AJ, 125, 188
- Belokurov et al. (2018) Belokurov, V., Erkal, D., Evans, N. W., Koposov, S. E., & Deason, A. J. 2018, MNRAS, 478, 611
- Binney & Tremaine (2008) Binney, J., & Tremaine, S. 2008, Galactic Dynamics: Second Edition (Princeton University Press)
- Capuzzo-Dolcetta (1993) Capuzzo-Dolcetta, R. 1993, ApJ, 415, 616
- Dehnen (1993) Dehnen, W. 1993, MNRAS, 265, 250
- Di Matteo et al. (2019) Di Matteo, P., Haywood, M., Lehnert, M. D., et al. 2019, A&A, 632, A4
- Dotter et al. (2010) Dotter, A., Sarajedini, A., Anderson, J., et al. 2010, ApJ, 708, 698
- Dutton & Macciò (2014) Dutton, A. A., & Macciò, A. V. 2014, MNRAS, 441, 3359
- Feldmeier et al. (2014) Feldmeier, A., Neumayer, N., Seth, A., et al. 2014, A&A, 570, A2
- Feldmeier-Krause et al. (2017a) Feldmeier-Krause, A., Kerzendorf, W., Neumayer, N., et al. 2017a, MNRAS, 464, 194
- Feldmeier-Krause et al. (2017b) Feldmeier-Krause, A., Zhu, L., Neumayer, N., et al. 2017b, MNRAS, 466, 4040
- Forbes & Bridges (2010) Forbes, D. A., & Bridges, T. 2010, MNRAS, 404, 1203
- Gaia Collaboration et al. (2018) Gaia Collaboration, Helmi, A., van Leeuwen, F., et al. 2018, A&A, 616, A12
- Gallego-Cano et al. (2020) Gallego-Cano, E., Schödel, R., Nogueras-Lara, F., et al. 2020, A&A, 634, A71
- Ghez et al. (2008) Ghez, A. M., Salim, S., Weinberg, N. N., et al. 2008, ApJ, 689, 1044
- Gillessen et al. (2017) Gillessen, S., Plewa, P. M., Eisenhauer, F., et al. 2017, ApJ, 837, 30
- Grebel et al. (2003) Grebel, E. K., Gallagher, John S., I., & Harbeck, D. 2003, AJ, 125, 1926
- Guillard et al. (2016) Guillard, N., Emsellem, E., & Renaud, F. 2016, MNRAS, 461, 3620
- Harris (1996) Harris, W. E. 1996, AJ, 112, 1487
- Harris (2010) —. 2010, arXiv e-prints, arXiv:1012.3224
- Helmi et al. (2018) Helmi, A., Babusiaux, C., Koppelman, H. H., et al. 2018, Nature, 563, 85
- Hilker & Richtler (2000) Hilker, M., & Richtler, T. 2000, A&A, 362, 895
- Kerzendorf & Do (2015) Kerzendorf, W., & Do, T. 2015, in Zenodo Software Release, Vol. 11, 17920
- King (1966) King, I. R. 1966, AJ, 71, 64
- Kocsis & Tremaine (2011) Kocsis, B., & Tremaine, S. 2011, MNRAS, 412, 187
- Law & Majewski (2010) Law, D. R., & Majewski, S. R. 2010, ApJ, 718, 1128
- Longaretti & Lagoute (1996) Longaretti, P. Y., & Lagoute, C. 1996, A&A, 308, 453
- Myeong et al. (2018) Myeong, G. C., Evans, N. W., Belokurov, V., Sand ers, J. L., & Koposov, S. E. 2018, ApJ, 863, L28
- Myeong et al. (2019) Myeong, G. C., Vasiliev, E., Iorio, G., Evans, N. W., & Belokurov, V. 2019, MNRAS, 488, 1235
- Neumayer et al. (2020) Neumayer, N., Seth, A., & Boeker, T. 2020, arXiv e-prints, arXiv:2001.03626
- Neumayer et al. (2011) Neumayer, N., Walcher, C. J., Andersen, D., et al. 2011, MNRAS, 413, 1875
- Paumard et al. (2006) Paumard, T., Genzel, R., Martins, F., et al. 2006, ApJ, 643, 1011
- Perets & Mastrobuono-Battisti (2014) Perets, H. B., & Mastrobuono-Battisti, A. 2014, ApJ, 784, L44
- Perets et al. (2018) Perets, H. B., Mastrobuono-Battisti, A., Meiron, Y., & Gualandris, A. 2018, arXiv e-prints, arXiv:1802.00012
- Plummer (1911) Plummer, H. C. 1911, MNRAS, 71, 460
- Portail et al. (2015) Portail, M., Wegg, C., Gerhard, O., & Martinez-Valpuesta, I. 2015, MNRAS, 448, 713
- Pritzl et al. (2005) Pritzl, B. J., Venn, K. A., & Irwin, M. 2005, AJ, 130, 2140
- Rauch & Tremaine (1996) Rauch, K. P., & Tremaine, S. 1996, New A, 1, 149
- Rossa et al. (2006) Rossa, J., van der Marel, R. P., Böker, T., et al. 2006, AJ, 132, 1074
- Schödel et al. (2014) Schödel, R., Feldmeier, A., Kunneriath, D., et al. 2014, A&A, 566, A47
- Seth et al. (2006) Seth, A. C., Dalcanton, J. J., Hodge, P. W., & Debattista, V. P. 2006, AJ, 132, 2539
- Spitzer & Hart (1971) Spitzer, Lyman, J., & Hart, M. H. 1971, ApJ, 166, 483
- Tremaine et al. (1975) Tremaine, S. D., Ostriker, J. P., & Spitzer, Jr., L. 1975, ApJ, 196, 407
- Tsatsi et al. (2017) Tsatsi, A., Mastrobuono-Battisti, A., van de Ven, G., et al. 2017, MNRAS, 464, 3720
- Valenti et al. (2016) Valenti, E., Zoccali, M., Gonzalez, O. A., et al. 2016, A&A, 587, L6
- Wetzel (2011) Wetzel, A. R. 2011, MNRAS, 412, 49