Measurements of multiplicity fluctuations of identified hadrons in inelastic proton-proton interactions at the CERN Super Proton Synchrotron \PreprintIdNumberCERN-EP-2020-142 \ShineJournal \ShineJournalRef \ShineDOI \ShineAbstract Measurements of multiplicity fluctuations of identified hadrons produced in inelastic p+p interactions at 31, 40, 80, and 158 \GeVcbeam momentum are presented. Three different measures of multiplicity fluctuations are used: the scaled variance and strongly intensive measures and . These fluctuation measures involve second and first moments of joint multiplicity distributions. Data analysis is preformed using the Identity method which corrects for incomplete particle identification. Strongly intensive quantities are calculated in order to allow for a direct comparison to corresponding results on nucleus-nucleus collisions. The results for different hadron types are shown as a function of collision energy. A comparison with predictions of string-resonance Monte-Carlo models: \Epos, \Smashand \Venus, is also presented.
1 Introduction
This paper presents experimental results on event-by-event fluctuations of multiplicities of identified particles produced in inelastic proton-proton (p+p) interactions at 31, 40, 80, and 158 \GeVc = 7.6, 8.7, 12.3, 17.3 GeV). The measurements were performed by the multi-purpose \NASixtyOne [1] experiment at the CERN Super Proton Synchrotron (SPS) in 2009. They are part of the strong interactions programme devoted to the study of the properties of the onset of deconfinement and search for the critical point of strongly interacting matter. Within this program, a two dimensional scan in collision energy and size of colliding nuclei was performed [2].
An interpretation of the experimental results on nucleus-nucleus (A+A) collisions relies to a large extent on a comparison with the corresponding data on p+p and p+A interactions. In addition models of nucleus-nucleus collisions are often tuned based on results on p+p interactions. However, available results on fluctuations of identified hadrons in these reactions are sparse. Moreover, fluctuation measurements cannot be corrected in a model independent manner for partial phase-space acceptance. Thus all measurements of the scan should be performed in the same phase space region. This motivated the \NASixtyOne Collaboration to analyse data on p+p interactions with respect to fluctuations using the same experimental methods, acceptance and measures as used to study nucleus-nucleus collisions.
Fluctuations in A+A collisions are susceptible to two trivial sources: the finite and fluctuating number of produced particles and event-by-event fluctuations of the collision geometry. Suitable statistical tools have to be chosen to extract the fluctuations of interest. In this publication three different event-by-event fluctuation measures are used: the scaled variance , the and measures introduced in Refs. [3, 4]. All of them were already successfully utilized by the NA49 experiment at the CERN SPS, see e.g. Refs. [5, 6, 7, 8, 9, 10, 11] and the \NASixtyOnecollaboration, see e.g. Ref. [12].
Experimental measurements of multiplicity distributions of identified hadrons are challenging because it is very difficult to identify a particle with sufficient precision. In this paper the Identity method [13, 14, 15, 16, 17, 18, 19] is employed to circumvent this problem. The Identity method has already been successfully used in the past by collaborations NA49 [8], \NASixtyOne [20], and ALICE [21, 22, 23].
The paper is organized as follows. In Sec. 2 intensive and strongly intensive measures of fluctuations used in this analysis are introduced and briefly discussed. The Identity method which allows to take into account the incomplete particle identification is presented in Sec. 3 and Appendix A. The \NASixtyOneset-up and the data reconstruction method are presented in Secs. 4 and 5, respectively. The data analysis procedure is introduced in Secs. 6 and 7. Applied corrections and remaining uncertainties are presented in Sec. 8. Results on the collision energy dependence of multiplicity fluctuations of identified hadrons in inelastic p+p collisions at 31, 40, 80, and 158 \GeVcbeam momentum are presented, discussed and compared with model predictions in Sec. 9.
Throughout this paper the rapidity is calculated in the collision center of mass system: = atanh(), where is the longitudinal (z) component of the velocity, and are particle longitudinal momentum and energy given in the collision center of mass system. The transverse component of the momentum is denoted as and the azimuthal angle is the angle between the transverse momentum vector and the horizontal (x) axis. Total momentum in the laboratory system is denoted as and electric charge is denoted as . The collision energy per nucleon pair in the center of mass system is denoted as .
2 Intensive and strongly intensive measures of multiplicity and particle type fluctuations
2.1 Intensive quantities
Measures of multiplicities and fluctuations are called intensive when they are independent of the volume () of systems modelled by the ideal Boltzmann grand canonical ensemble (IB-GCE). In contrast, extensive quantities (for example mean multiplicity or variance of the multiplicity distribution) are proportional to the system volume within IB-GCE. One can also extend the notion of intensive and extensive quantities to the Wounded Nucleon Model (WNM) [24], where the intensive quantities are those which are independent of the number of wounded nucleons (), and extensive those which are proportional to the number of wounded nucleons. Here it is assumed that the number of wounded nucleons is the same for all collisions. The ratio of two extensive quantities is an intensive quantity [3]. Therefore, the ratio of mean multiplicities and , as well as the scaled variance of the multiplicity distribution , are intensive measures. As a matter of fact, due to its intensity property, the scaled variance of the multiplicity distribution is widely used to quantify multiplicity fluctuations in high-energy heavy-ion experiments. The scaled variance takes the value for and for a Poisson distribution of .
2.2 Strongly intensive quantities
In nucleus-nucleus collisions the volume of the produced matter (or number of wounded nucleons) cannot be fixed – it changes from one event to another. The quantities, which within the IB-GCE (or WNM) model are independent of (or ) fluctuations are called strongly intensive quantities [25, 3]. The ratio of mean multiplicities is both an intensive and a strongly intensive quantity, whereas the scaled variance is an intensive but not strongly intensive quantity.
Strongly intensive quantities and used in this paper are defined as [4]:
| (1) |
and
| (2) |
where and stand for multiplicities of particles of type and , respectively. First and second pure moments, , , and , define . In addition, the second mixed moment, , is needed to calculate .
With the normalization of and used here [4], the quantities and are dimensionless and have a common scale required for a quantitative comparison of fluctuations of different, in general dimensional, extensive quantities. The values of and are equal to zero in the absence of event-by-event fluctuations (., .) and equal to one for fluctuations given by the model of independent particle production (Independent Particle Model) [4]. The model assumes that particle types are attributed to particles independent of each other. Positive correlations between particle types, for example and coming in pairs from decays, lead to and values below one. Anti-correlations between particle types, for example due to conservation laws, for example energy conservation leads to anti-correlation of multiplicities of different hadron types, may increase and above one. For detailed discussion see Refs. [26, 27].
3 Identity method
Experimental measurement of a joint multiplicity distribution of identified hadrons is challenging. Typical tracking detectors, like time projection chambers used by \NASixtyOne, allow for a precise measurement of momenta of charged particles and sign of their electric charges. In order to be able to distinguish between different particle types (e.g. a particle type being e+, , or ) a determination of particle mass is necessary. This is done indirectly by measuring for each particle a value of the specific energy loss in the tracking detectors, the distribution of which depends on mass, momentum and charge. The resolution of measurements is not sufficient for particle-by-particle identification without a radical reduction of considered statistics. Probabilities to register particles of different types with the same value of may be comparable. Consequently, it is impossible to identify particles individually with reasonable confidence for fluctuation analysis. The Identity method [13, 14, 15, 16, 17, 18] is a tool to measure moments of multiplicity distribution of identified particles, which circumvents the experimental issue of incomplete particle identification.
The method employs the fitted inclusive distribution functions of particles of type , in momentum bins. Each event has a set of measured values corresponding to each track in the event. For each track in an event the probability wa of being a particle of type is calculated:
| (3) |
where
| (4) |
Next, an event variable (a smeared multiplicity of particle in the event) is defined as:
| (5) |
where is the number of measured particles in the event. The Identity method unfolds moments of the true multiplicity distributions from moments of the smeared multiplicity distribution using a response matrix calculated from the measured distributions [14].
4 Experimental setup
The \NASixtyOneexperimental facility [1] consists of a large acceptance hadron spectrometer located in the H2 beam line of the CERN North Area. The schematic layout of the \NASixtyOnedetector is shown in Fig. 1.
The results presented in this paper were obtained using measurement from the Time Projection Chambers (TPC), the Beam Position Detectors (BPD) and the beam and trigger counters. These detector components as well as the proton beam and the liquid hydrogen target (LHT) are briefly described below. Further information can be found in Refs. [1, 28, 29].
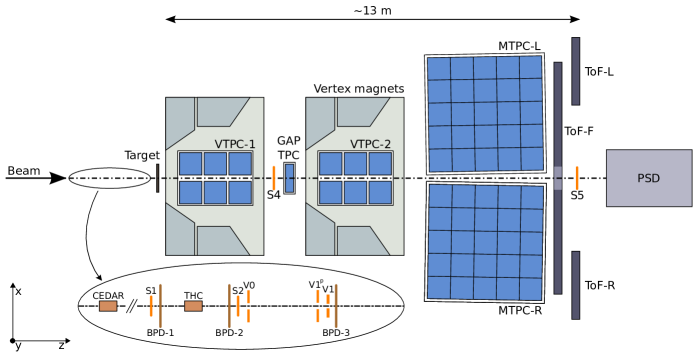
Secondary beams of positively charged hadrons at 31, 40, 80, and 158 \GeVcwere produced from 400 \GeVcprotons extracted from the SPS onto a beryllium target. A selection based on signals from a set of detectors along the H2 beam-line (Cerenkov detectors CEDAR, scintillation counters S, THC and BPDs (see inset in Fig. 1)) allowed to identify beam protons with a purity of about 99%. A coincidence of these signals provided the beam trigger . For data taking on p+p interactions a liquid hydrogen target of 20.29 cm length (2.8% interaction length) and 3 cm diameter was placed 88.4 cm upstream of the first TPC (see Fig. 1). The interaction trigger was provided by the anti-coincidence of the incoming proton beam and a scintillation counter S4 (). The S4 counter with 2 cm diameter, was placed between the magnets along the beam trajectory at about 3.7 m from the target, see Fig. 1.
The main tracking devices of the spectrometer are four large volume TPCs. The vertex TPCs (VTPC-1 and VTPC-2) are located in the magnetic fields of two super-conducting dipole magnets with a maximum combined bending power of 9 Tm which corresponds to about 1.5 T and 1.1 T fields in the upstream and downstream magnets, respectively. In order to optimize the acceptance of the detector, the fields in both magnets were adjusted proportionally to the beam momentum. Two large main TPCs (MTPC-L and MTPC-R) are positioned downstream of the magnets symmetrically to the beam line. The fifth small TPC (GAP TPC) is placed between VTPC-1 and VTPC-2 directly on the beam line. It closes the gap between the beam axis and the sensitive volumes of the other TPCs. Simultaneous measurements of and allow to extract information on particle mass, which is used to identify charged particles. Behind the MTPCs there are three Time-of-Flight (ToF) detectors.
5 Data reconstruction and simulation
The event vertex and the produced particle tracks were reconstructed using the standard \NASixtyOnesoftware [28]. Detector parameters were optimized by a data-based calibration procedure which also took into account their time dependence, for details see Refs. [28, 30].
A simulation of the \NASixtyOnedetector response was used to correct the reconstructed data. Several Monte Carlo models were compared with the \NASixtyOneresults on p+p, p+C and +C interactions [28, 29, 31, 32]. Based on these comparisons and taking into account continuous support the Epos1.99 model [33, 34] was selected for Monte Carlo simulations and calculation of corrections. In order to estimate systematic uncertainties simulations were also performed using Venus4.12, which was previously used by the NA49 Collaboration at the CERN SPS energies [35, 9]. Generated and reconstructed tracks were matched based on the number of common points along their path. Possible differences due to the different identification procedures followed in the MC simulations and the real data are addressed in Ref. [29] and Sec. 8.3.
6 Event and track selection
The final results presented in this paper refer to identified hadrons produced in inelastic p+p interactions by strong interaction processes and in electromagnetic decays of produced hadrons. Such hadrons are referred to as primary hadrons. The event and track selection cuts described below are selected in order to minimize unavoidable biases in measured data with respect to the final results.
6.1 Event selection
An event was recorded if there was no beam particle detected downstream of the target (S4 counter in Fig. 1). Reconstructed events with off-time beam proton detected within a time window of 1.5s around the trigger proton were removed. The trajectory of the trigger proton was required to be measured in at least three planes out of four of BPD-1 and BPD-2 and in BPD-3. Events without the fitted primary interaction vertex were removed. The fitted interaction vertex z-coordinated was requested to be within 20 cm from the LHT target center. Events with a single positively charged track with absolute momentum close to the beam momentum (for details see Ref. [28]) are removed in order to eliminate remaining elastic scattering reactions. This requirement removes less then 2 of all events in data at 31-80 \GeVcbeam momenta. The same cut applied to the \Epossimulated and reconstructed data removes less then 5 of all inelastic events. The cut was not applied to the 158 \GeVcdata-set. The fraction of inelastic events removed by the event selection cuts estimated based on the \Epossimulation ranges between 15 at 31 \GeVcand 22 at 158 \GeVc.
6.2 Track selection
In order to select good quality tracks of primary charged hadrons and to reduce the contamination of tracks from secondary interactions, weak decays and off-time interactions, the following track selection criteria were applied:
-
(i)
Track momentum fit at the interaction vertex should have converged.
-
(ii)
Total number of reconstructed points used to fit the track trajectory should be greater than 30.
-
(iii)
Sum of the number of reconstructed points in VTPC-1 and VTPC-2 should be greater than 15 or the number of reconstructed points in the GAP TPC should be greater than 4.
-
(iv)
Distance between the track extrapolated to the interaction plane and the interaction point (track impact parameter) should be smaller than 4 cm in the horizontal (bending) plane and 2 cm in the vertical. (drift) plane,
-
(v)
Total number of points used to obtain track should be greater than 30.
-
(vi)
A track is measured in the high efficiency region of the detector and it should lie in the region where measurements are available (see Ref. [36]. This defines the analysis acceptance given in Ref. [36] in a form of three dimensional maps in particle momentum space. Examples of the analysis acceptance are shown in Fig. 4.
The event and track statistics after applying the selection criteria are summarized in Table 1.
| Beam momentum | # events | # positively | # negatively |
| [\GeVc] | charged tracks | charged tracks | |
| 31 | 819710 | 530971 | 132187 |
| 40 | 2641412 | 2071490 | 675258 |
| 80 | 1531849 | 2061069 | 1020267 |
| 158 | 1587680 | 3243819 | 1980037 |
7 Identity analysis
In order to calculate moments of multiplicity distributions of identified hadrons corrected for incomplete particle identification the analysis was performed using the Identity method. The analysis consists of three steps:
-
(i)
parametrization of inclusive spectra,
-
(ii)
calculation of smeared multiplicity distributions and their moments,
-
(iii)
correction of smeared moments for incomplete particle identification using the response matrix.
The Identity analysis steps are briefly described below and in App. A.
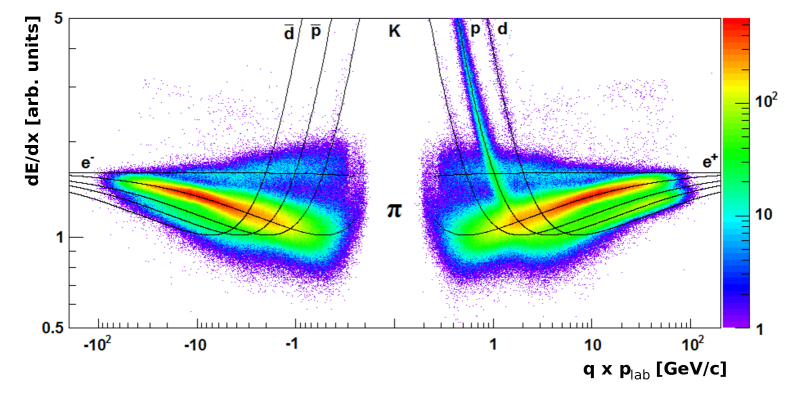
For each particle its specific energy loss is calculated as the truncated mean (smallest 50%) of cluster charges measured along the track trajectory. As an example, measured in p+p interactions at 80 \GeVc, for positively and negatively charged particles, as a function of is presented in Fig. 2. The expected mean values of for different particle types are shown by the Bethe-Bloch curves.
The parametrization of spectra of , e-, , , , , p, and were obtained by fitting the distributions separately for positively and negatively charged particles in bins of and transverse momentum .
The fitted function was defined as a sum of the distributions of , , , and p for positively charged particles. The sum of the contributions of the corresponding antiparticles was used for negatively charged particles.
The details of this fitting procedure can be found in Refs. [29, 37, 38]. In contrast to the spectra analysis [29] separate fits were performed in order to extend acceptance by adding particles with negative , where is x-component of the particle total momentum in the laboratory system. Systematic uncertainties arising from the fitting procedure are estimated in Sec. 8. In order to ensure similar particle numbers in each bin, 20 logarithmic bins were chosen in in the range \GeVc. Furthermore, the data were binned in 20 equal intervals in the range \GeVc.
The spectrum for a given particle type was parametrized by the sum of asymmetric Gaussians with widths depending on the particle type and the number of points measured in the TPCs. The peak position of the distribution for particle type is denoted as . The contribution of a reconstructed particle track to the fit function reads:
| (6) |
where is the of the particle, is the number of tracks with number of points and is the amplitude of the contribution of particles of type . The second sum is the weighted average of the line-shapes from the different numbers of measured points (proportional to track-length) in the sample. The quantity is written as:
| (7) |
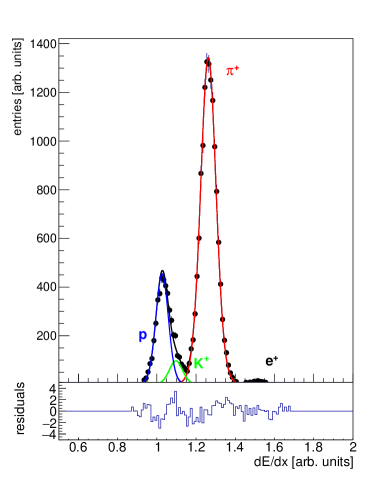
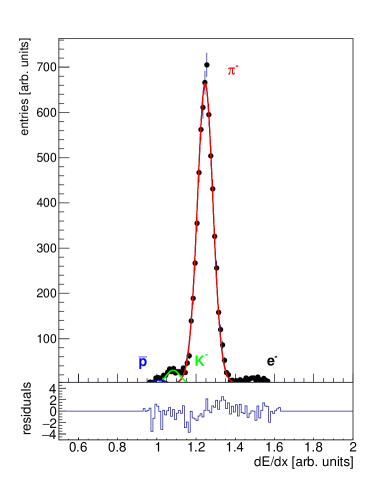
where the width parameter is assumed to be common for all particle types and bins. A dependence on number of points is assumed following Ref. [39]. The asymmetry parameter is introduced in order to take into account a possible small asymmetry of the truncated mean distribution resulting from a strong asymmetry of the Landau energy loss distribution. Examples of fits for p+p interactions at 31 and 158 \GeVcare shown in Fig. 3.
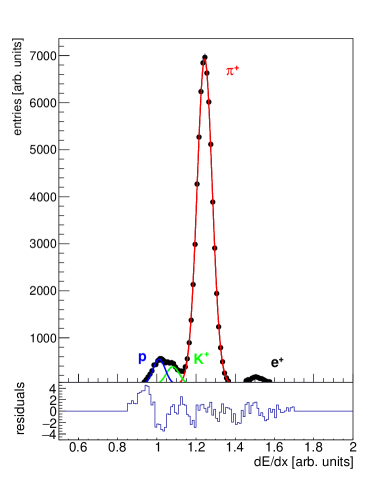
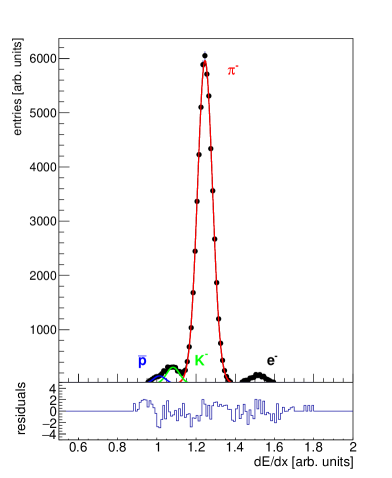
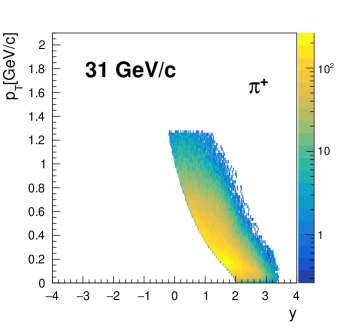
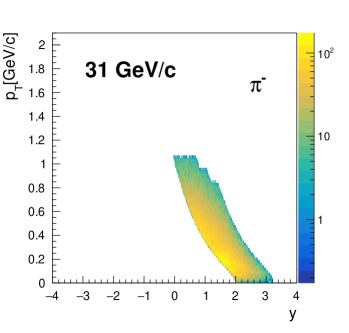
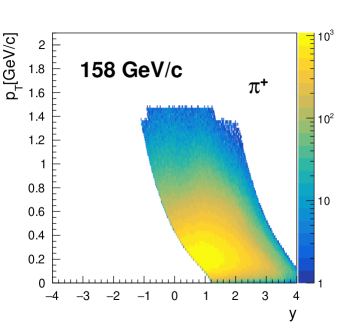
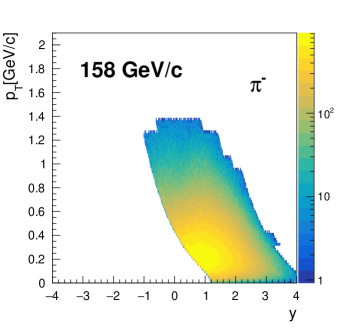
In order to ensure good fit quality, only bins with number of tracks greater than 500 were used for further analysis. The Bethe-Bloch curves for different particle types cross each other at low values of the total momentum. Thus, the proposed technique is not sufficient for particle identification at low and bins with 4.3 \GeVcwere excluded from this analysis based solely on . The requirement of at least 500 tracks with good quality measurement in each , bin reduces the acceptance available for the analysis. Due to different multiplicities the acceptance is different for positively and negatively charged particles. Moreover, it also changes with beam momentum. Thus, the largest acceptance was found for positively charged hadrons at 158 \GeVcand the smallest at 31 \GeVcfor negatively charged hadrons. The acceptance used in this analysis is given separately for negatively and positively charged particles by a set of publicly available acceptance tables [36]. The corresponding rapidity and transverse momentum acceptances at 31 and 158 \GeVcare shown in Fig. 4.
The parametrization of inclusive spectra of identified particles is first used to calculate probabilities wa and, then, Wa. The first moments of the multiplicity distributions for complete particle identification, are equal to the corresponding first moments of the smeared distributions:
| (8) |
Second moments of the multiplicity distributions of identified hadrons are obtained by solving sets of linear equations which relate them to the corresponding smeared moments. The parameters of the equations are calculated using the densities of identified particles obtained from the fits to the experimental data. Details can be found in App. A.
8 Corrections and uncertainties
This section briefly describes the corrections for biases and presents methods to calculate statistical and systematic uncertainties.
8.1 Corrections for event and track losses and contribution of unwanted tracks
The first and second moments of multiplicity distributions corrected for incomplete particle identification were also corrected for:
-
(i)
loss of inelastic events due to the on-line and off-line event selection,
-
(ii)
loss of particles due to the detector inefficiency and track selection,
-
(iii)
contribution of particles from weak decays and secondary interactions (feed-down).
A simulation of the \NASixtyOnedetector response was used to correct the data for the above mentioned biases. Corrections were calculated for moments of identified hadron multiplicity distributions. Events simulated with the \Eposmodel were reconstructed with the standard \NASixtyOnesoftware as described in Sec. 5. The multiplicative correction factors and , where and denote the particle type (; and ), are defined as:
| (9) |
where:
-
(i)
– moment of particle type generated by the model,
-
(ii)
– moment of particle type generated by the model with the detector response simulation, reconstruction and selection,
-
(iii)
– mixed second moment of particle types and generated by the model () and with the detector response simulation, reconstruction and selection ().
This way of implementing the corrections was tested using simulations based on the \Eposand \Venusmodels, for details see Sec. 8.3.2. Multi-dimensional unfolding of distributions which would be the best approach for correcting experimental biases is too complex to be implemented [40]. This is why the Identity method - the unfolding of moments - was used to correct for the main bias – the incomplete particle identification. Then the unfolded moments were corrected for remaining biases.
8.2 Statistical uncertainties
The sub-sample method was used to calculate statistical uncertainties of final results. All selected events were grouped into non-overlapping sub-samples of events. Then a given fluctuation measure (for example ) was calculated for each sub-sample separately, and the variance of its distribution, , was obtained. The statistical uncertainty of for all selected events was estimated as . The parametrization requires a minimum number of tracks in a given momentum bin, thus the acceptance in which the parametrization can be obtained is larger for all selected events than for sub-samples of events. In order to have the maximum acceptance the same parametrization obtained using all events was used in the sub-sample analysis. It was checked using the bootstrap method [41, 42] that the above approximation leads only to a small underestimation of statistical uncertainties.
8.3 Systematic uncertainties
Systematic uncertainties originate from imperfectness of the detector response and systematic uncertainties in the modelling of physics processes implemented in the models. The total systematic uncertainties were calculated by adding detector-related (see Sec. 8.3.1) and model-related (see Sec. 8.3.2) contributions in quadrature.
8.3.1 Detector related effects
These uncertainties were studied by applying standard (see Sec. 6) and loose cuts defined by:
-
(i)
reducing the rejection window for events with off-time beam particle to < 0.5 s,
-
(ii)
relaxing the requirement on the position of the main vertex (to exclude off-target events and inelastic p+p interactions),
-
(iii)
reducing the requirement of the minimum number of measured points in the detector to 20,
-
(iv)
loosening the constraint on the distance of the track extrapolated back to the target plane and the main vertex from 4 to 8 cm and from 2 to 4 cm in the and directions.
For each choice the complete analysis was repeated including the fitting and recalculating the corrections. Observed differences between results for the standard and loose cuts are related to imperfectness of the reconstruction procedure and to the acceptance of events with additional tracks from off-time particles. The corresponding systematic uncertainty was calculated as the difference between the results for the standard and loose cuts.
An additional possible source of uncertainty is imperfectness of the parametrization. Here the largest uncertainty comes from uncertainties of the parameters of the kaon distribution. The kaon distribution significantly overlaps with the proton and pion distributions. In the most difficult low momentum range the fits were cross-checked using the time-of-flight information and found to be in agreement at the level of single particle spectra (see Ref. [29]).
In this analysis, as it considers second order moments, two additional tests were performed. First, fits of distributions with fixed asymmetry parameter and without any constraint on asymmetry were used to estimate the resulting possible biases of fluctuation measures. The change of the results is below 10% for most quantities. Larger relative differences appear only for quantities close to 0. A second test was performed to validate fit stability. The value of for each reconstructed track in the Monte-Carlo simulation was generated using the parametrization of the response function fitted to the data. Next, fits were performed on reconstructed \Epossimulated events. Intensive and strongly intensive quantities were obtained the same way as in the data and compared to the values obtained in the model on the generated level. The change of the results is below 10% for most quantities and, for almost all, it is within or comparable to the systematic uncertainty. The only exceptions are the scaled variance of protons at 158 \GeVc (10 which normally is 5) and pions at 31 \GeVc (15 which normally is 8) as well as of pions and protons at 158 \GeVc ( compared to ).
8.3.2 Model-related effects
Systematic uncertainty originating from imperfectness of the \Eposmodel used to calculate corrections in describing p+p interactions is discussed here. The uncertainty was estimated using simulations performed within the \Eposand \Venusmodels. The simulated \Eposdata were corrected using corrections obtained based on the \Venusmodel and compared to the unbiased \Eposresults. Then the same procedure was repeated swapping \Eposand \Venus. In both cases the correction improves agreement between the obtained results and the true ones. The differences between the unbiased and simulated-corrected results were added to the systematic uncertainty. They are on average about 20% (\Eposdata) and 25% (\Venusdata) of the total systematic uncertainty. Note that the models show similar agreement with results on p+p interactions at the CERN SPS energies.
9 Results, discussion and comparison with models
In this section final experimental results are presented and discussed as well as compared with predictions of selected string-hadronic models.
| Beam momentum [\GeVc] | ||||||
| 31 | 0.397(1) | 3.556(37) | 0.0440(3) | 0.202(11) | 0.280(1) | 0.982(3) |
| 40 | 0.6233(3) | 4.101(36) | 0.0680(3) | 0.254(11) | 0.331(1) | 1.101(3) |
| 80 | 1.416(1) | 4.701(38) | 0.1563(3) | 0.296(11) | 0.369(1) | 1.111(4) |
| 158 | 2.360(2) | 5.514(45) | 0.2597(4) | 0.366(18) | 0.399(1) | 1.194(10) |
9.1 Results
The final results presented in this section refer to identified hadrons produced in inelastic p+p interactions by strong interaction processes and in electromagnetic decays of produced hadrons. They were obtained within the kinematic acceptances given in Ref. [36] and illustrated in Fig. 4. Note, that the kinematic acceptances for positively and negatively charged hadrons are different.
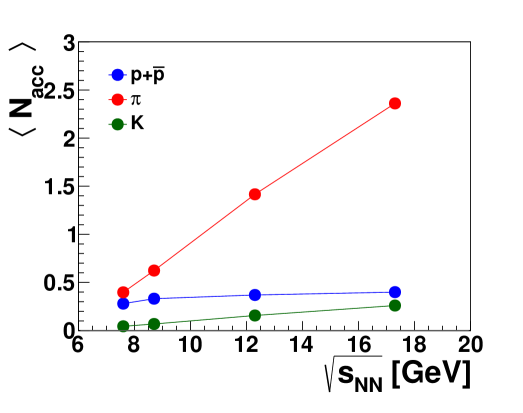
Mean multiplicities of pions, kaons and anti-protons in the acceptance region of the fluctuation analysis are plotted in Fig. 8 and compared to corresponding mean multiplicities measured in the full phase-space in Table 2.
Pions are the most abundantly produced particles and are the majority of accepted charged hadrons in all analyzed reactions. With decreasing beam momentum the contribution of protons increases and the small contributions of kaons and protons decrease. Almost all charged hadrons are pions, except that protons are the majority of positively charged hadrons at the lowest beam momentum, 31 \GeVc. The changes of particle type composition with charge of selected hadrons and beam momentum are related to different thresholds for production of pions, kaons and anti-protons. The mean proton multiplicity in the models in full phase-space is about one (0.3-0.4 in the acceptance) and approximately independent of beam momentum. This is because final state protons are strongly correlated with two initial state protons via baryon number conservation.
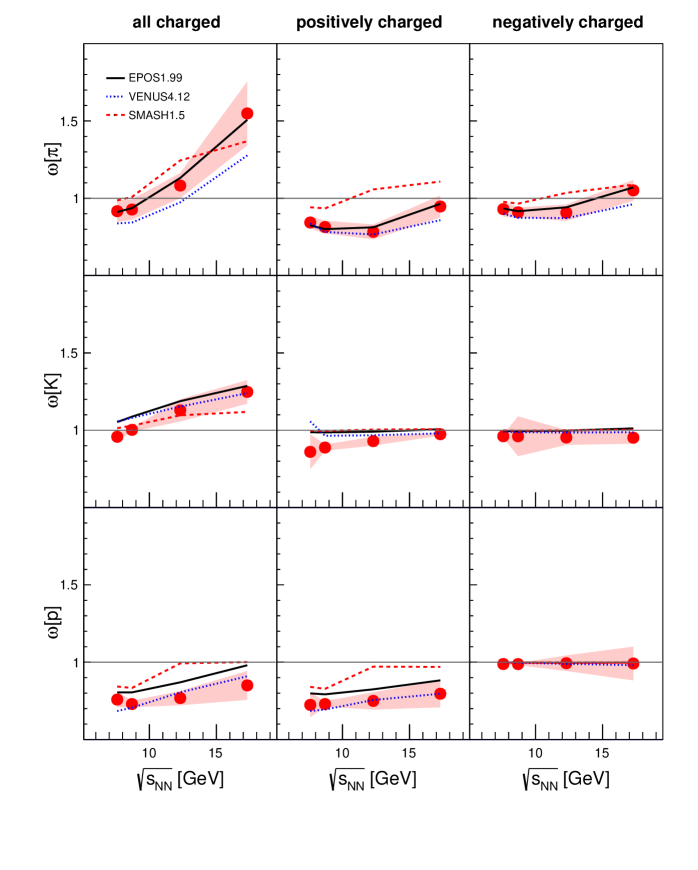
Figure 9 shows the collision energy dependence of the scaled variance of pion, kaon and proton multiplicity distributions. Note, the intensive fluctuation measure is one for a Poisson distribution and zero in the case of a constant multiplicity for all collisions. The scaled variance quantifies the width of the multiplicity distribution relatively to the width of the Poisson distribution with the same mean multiplicity. The results for all charged, positively charged and negatively charged hadrons are presented separately. One observes:
-
(i)
the scaled variance for pions increases with the collision energy. The increase is the strongest for all charged pions. This is probably related to the well established KNO scaling of the charged hadron multiplicity distributions in inelastic p+p interactions with the scaled variance being proportional to mean multiplicity [43, 44, 45]. Global and local (resonance decays) electric charge conservation correlates multiplicities of positively and negatively charged pions and thus the effect is the most pronounced for all charged hadrons.
-
(ii)
The dependence of on beam momentum for kaons is qualitatively similar to the one for pions but weaker. This is probably related to the significantly smaller mean multiplicity of kaons than pions. One notes that the scaled variance of the multiplicity distribution approaches one when the mean multiplicity decreases to zero. The latter effect is likely responsible for and being close to one, as the mean multiplicity of and in the acceptance is below 0.1 and 0.03, respectively.
-
(iii)
The scaled variance of protons is about 0.8 and depends weakly on the beam momentum. The net-baryon (baryon - anti-baryon) multiplicity in full phase-space is exactly two. This is because the initial baryon number is two and baryon number is conserved. Thus the scaled variance of the net-baryon multiplicity distribution is zero. Anti-baryon production at the SPS energies is small and thus the net-baryon multiplicity is close to the baryon multiplicity. The baryons are predominately protons and neutrons. Thus the proton fluctuations are expected to be mostly due to the fluctuation of the proton to neutron ratio and fluctuations caused by the limited phase space acceptance of protons.
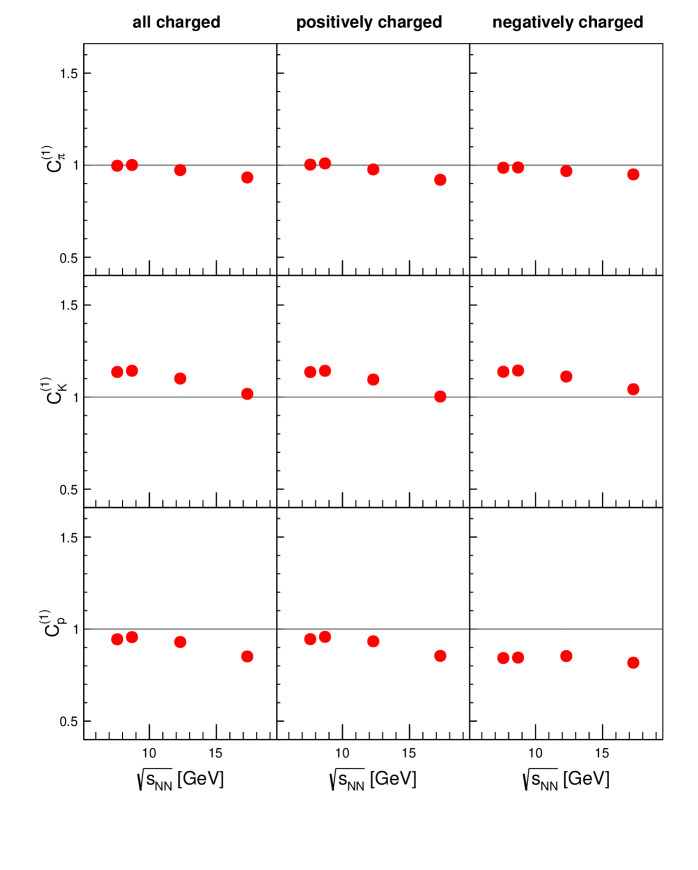
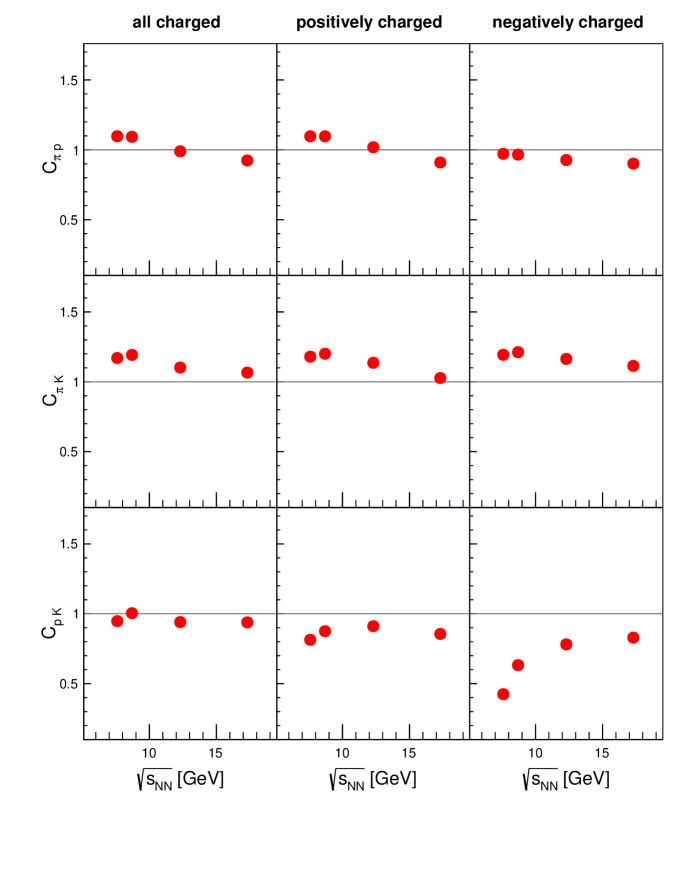
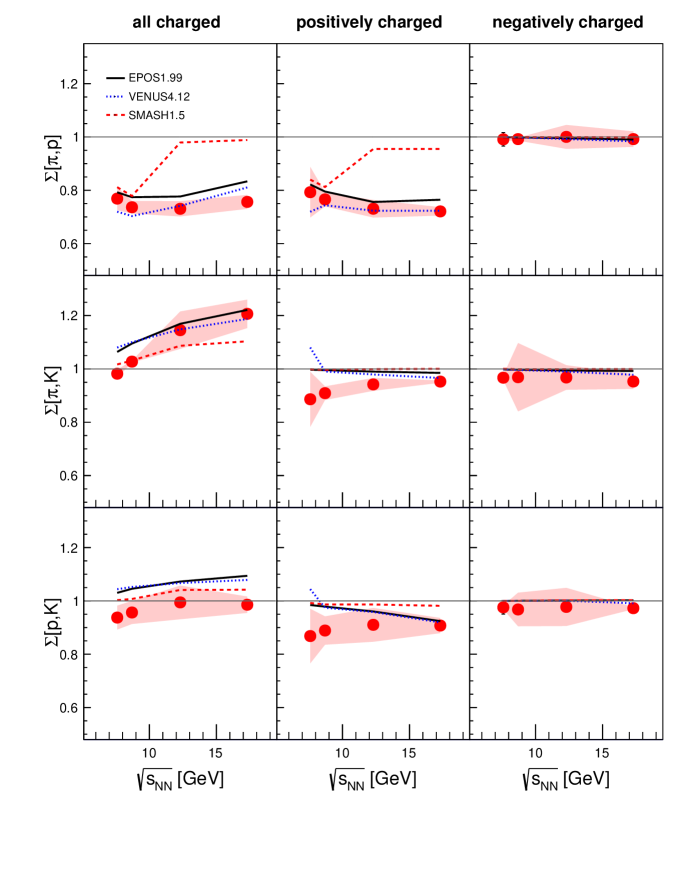
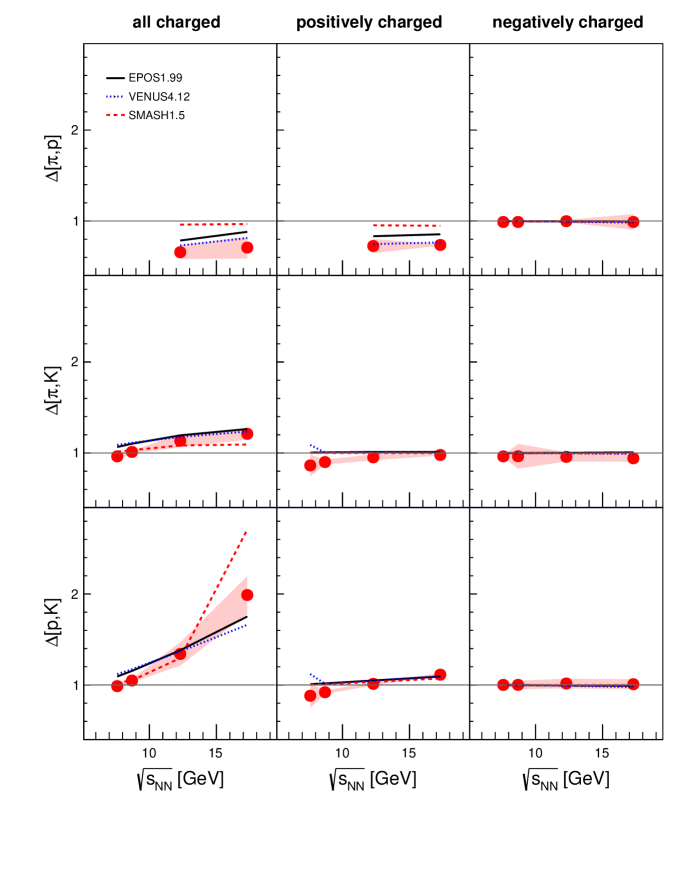
Figures 10 shows the results on for pion-proton, pion-kaon and proton-kaon multiplicities measured separately for all charged, positively charged, and negatively charged hadrons produced in inelastic p+p collisions at 31–158 \GeVcbeam momentum. The measure assumes the value one in the Independent Particle Production Model which postulates that particle types are attributed to particles independently of each other. This implies that unlike is insensitive to the details of the particle multiplicity distribution. One observes:
-
(i)
For all and positively charged pions-proton combinations is significantly below one (approximately 0.8) and depends weakly on the beam momentum. This is likely due to a large fraction of pion-proton pairs coming from decays of baryonic resonances [26, 27]. Corresponding results for Pb+Pb collisions were reported in Refs. [46, 47, 48].
-
(ii)
for all charged pion-kaon combinations increases significantly with the beam momentum and is about 1.2 at 158 \GeVc. The origin of this behaviour is unclear.
-
(iii)
For the remaining cases is somewhat below or close to one suggesting a small contribution of hadrons from resonance decays.
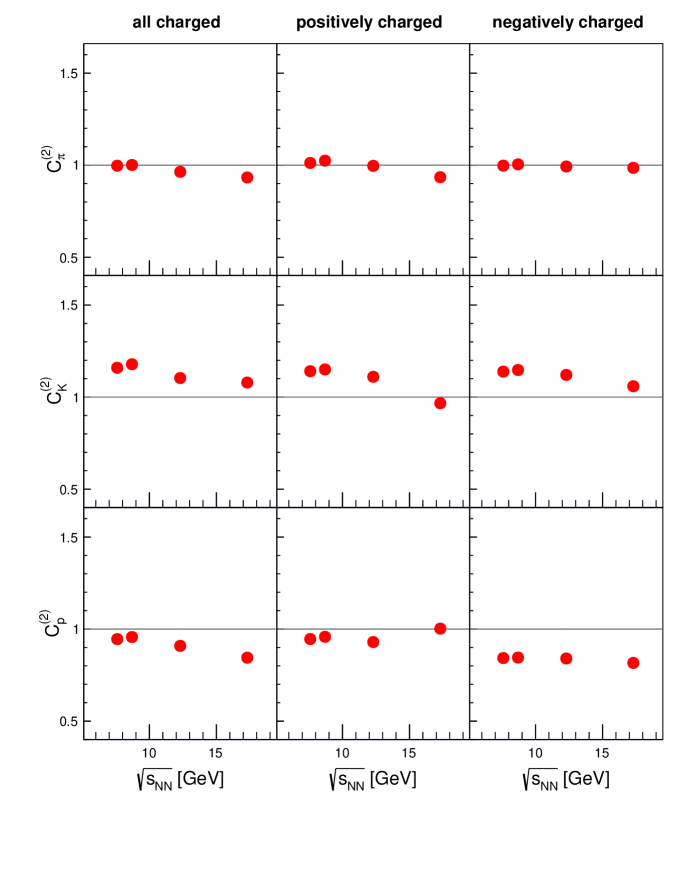
Figure 11 shows the results for of identified hadrons calculated separately for all charged, positively charged, and negatively charged hadrons produced in inelastic p+p collisions at beam momenta from 31 to 158 \GeVc. Results for at 31 and 40 \GeVcare not shown since they have large statistical uncertainties. This is because for these reactions (see Fig. 8) and thus (see Eq. 1.) The general properties of are similar to the properties of discussed above. Unlike , does not include a correlation term between multiplicities of two hadron types, see Eqs. 1 and 2. One observes:
-
(i)
for all and positively charged pions and protons is below one. This is qualitatively similar to and thus likely to be caused by resonance decays.
-
(ii)
increases with the collision energy from about one to two. The origin of this dependence is unclear.
9.2 Comparison with models
The results shown in Figs. 9, 10 and 11 are compared with predictions of three string-resonance models: \Epos [33, 34] (solid lines), Smash1.5 (dashed lines) [49] and \Venus [50, 51] (dotted lines).
These models define the baseline for heavy ion collisions from which any critical phenomena are expected to emerge. However, the models should first be tuned to the experimental data on p+p interactions presented here. In p+p interactions at CERN SPS energies one expects none of the high matter density phenomena usually studied and searched for in nucleus-nucleus collisions. Any deviations from independent particle production are considered to be caused by well established effects discussed in Sec. 9.1. In general, the \Eposand \Venusmodels reproduce the results reasonably well. However, none of the models agrees with all features of the presented results. For a number a number of observables qualitative disagreement is observed for \Smashand \Venus.
10 Summary and outlook
In this paper experimental results on multiplicity fluctuations of identified hadrons produced in inelastic p+p interactions at 31, 40, 80, and 158 \GeVcbeam momentum are presented. Results were corrected for incomplete particle identification using a data-based procedure - the Identity method. Remaining biases were corrected for utilising full physics and detector response simulations. The sub-sample method was used to calculate statistical uncertainties whereas systematic uncertainties were estimated by changing event and track selection cuts as well as models.
Results on the scaled variance of multiplicity fluctuations of pions, kaons and protons for all charged, positively charged and negatively charged hadrons are presented. Moreover results on the strongly intensive measures of multiplicities fluctuations of two hadron types and are shown. These were obtained for pion-proton, pion-kaon and proton-kaon particle type combinations for all charged as well as separately for positively and negatively charged pair combinations. The results are presented as a function of the collision energy and discussed in the context of KNO-scaling, conservation laws and resonance decays.
Finally, the \NASixtyOnemeasurements are compared with string-resonance models \Smash, \Eposand \Venus. In general, the \Eposand \Venusmodels reproduce the results reasonably well. However, none of the models agree with all presented results. For some observables even qualitative disagreement is observed for the \Smashand \Venusmodels. Thus, before the models can provide the baseline for heavy ion collisions in the search for critical phenomena, the models need to be tuned to the experimental data on p+p interactions presented in this paper.
Appendix A Details on the Identity Method
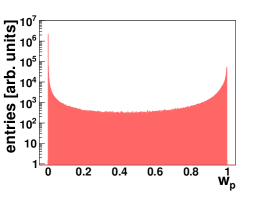
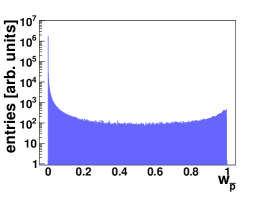
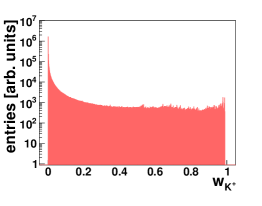
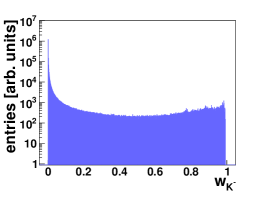
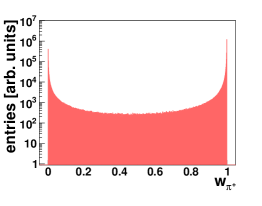
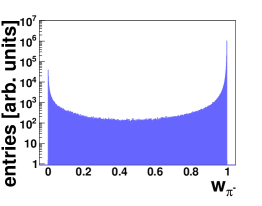
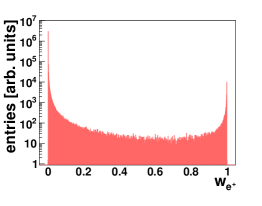
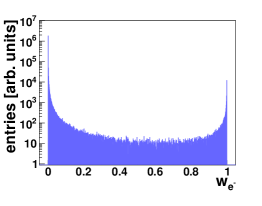
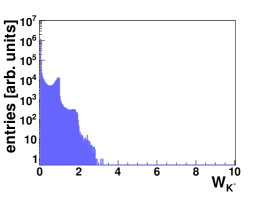
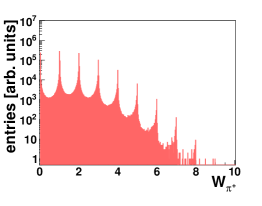
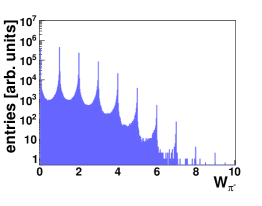
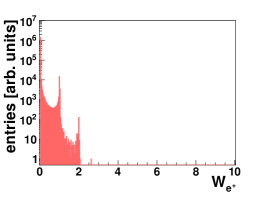
The parametrization of inclusive spectra of identified particles is first used to calculate probabilities wa (see Sec. 3). Distributions of wa for p+p interactions at 158 \GeVcare shown in Fig. 12 for positively and negatively charged particles, separately.
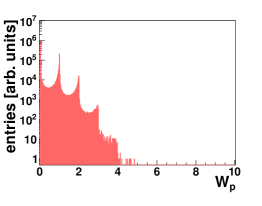
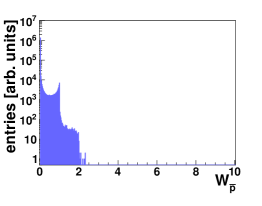
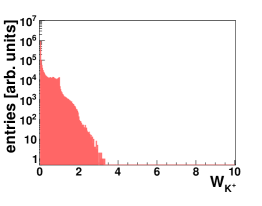
In the second step smeared multiplicities of identified particles Wa (see Sec. 3) are calculated for each selected event and their distributions are obtained. Examples of smeared multiplicity distributions for p+p interactions at 158 \GeVcare shown in Fig. 13 for positively and negatively charged particles, separately.
Finally, first and second moments of smeared multiplicity distributions are calculated for positively and negatively charged particles, separately.
Acknowledgements
We would like to thank the CERN EP, BE, HSE and EN Departments for the strong support of NA61/SHINE.
This work was supported by the Hungarian Scientific Research Fund (grant NKFIH 123842/123959), the Polish Ministry of Science and Higher Education (grants 667/N-CERN/2010/0, DIR/WK/ 2016/2017/ 10-1, NN 202 48 4339 and NN 202 23 1837), the National Science Centre Poland(grants 2014/14/E/ST2/00018, 2014/15/B/ST2 / 02537 and 2015/18/M/ST2/00125, 2015/19/N/ST2 /01689, 2016/23/B/ST2/00692, 2017/ 25/N/ ST2/ 02575, 2018/30/A/ST2/00226, 2018/31/G/ST2/03910), WUT ID-UB, the Russian Science Foundation, grant 16-12-10176 and 17-72-20045, the Russian Academy of Science and the Russian Foundation for Basic Research (grants 08-02-00018, 09-02-00664 and 12-02-91503-CERN), the Russian Foundation for Basic Research (RFBR) funding within the research project no. 18-02-40086, the National Research Nuclear University MEPhI in the framework of the Russian Academic Excellence Project (contract No. 02.a03.21.0005, 27.08.2013), the Ministry of Science and Higher Education of the Russian Federation, Project "Fundamental properties of elementary particles and cosmology" No 0723-2020-0041, the European Union’s Horizon 2020 research and innovation programme under grant agreement No. 871072, the Ministry of Education, Culture, Sports, Science and Technology, Japan, Grant-in-Aid for Scientific Research (grants 18071005, 19034011, 19740162, 20740160 and 20039012), the German Research Foundation (grant GA 1480/8-1), the Bulgarian Nuclear Regulatory Agency and the Joint Institute for Nuclear Research, Dubna (bilateral contract No. 4799-1-18/20), Bulgarian National Science Fund (grant DN08/11), Ministry of Education and Science of the Republic of Serbia (grant OI171002), Swiss Nationalfonds Foundation (grant 200020117913/1), ETH Research Grant TH-01 07-3 and the Fermi National Accelerator Laboratory (Fermilab), a U.S. Department of Energy, Office of Science, HEP User Facility managed by Fermi Research Alliance, LLC (FRA), acting under Contract No. DE-AC02-07CH11359 and the IN2P3-CNRS (France).
References
- [1] N. Abgrall et al., [NA61/SHINE Collab.] JINST 9 (2014) P06005.
- [2] A. Aduszkiewicz, [NA61/SHINE Collab.], “Report from the NA61/SHINE experiment at the CERN SPS,” Tech. Rep. CERN-SPSC-2018-029. SPSC-SR-239, CERN, 2018.
- [3] M. Gorenstein and M. Gazdzicki Phys. Rev. C84 (2011) 014904.
- [4] M. Gazdzicki, M. Gorenstein, and M. Mackowiak-Pawlowska Phys. Rev. C88 (2013) 024907.
- [5] T. Anticic et al., [NA49 Collab.] Phys. Rev. C70 (2004) 034902.
- [6] T. Anticic et al., [NA49 Collab.] Phys. Rev. C79 (2009) 044904.
- [7] C. Alt et al., [NA49 Collab.] Phys. Rev. C70 (2004) 064903.
- [8] T. Anticic et al., [NA49 Collab.] Phys. Rev. C89 (2014) 054902.
- [9] C. Alt et al., [NA49 Collab.] Phys. Rev. C75 (2007) 064904.
- [10] C. Alt et al., [NA49 Collab.] Phys. Rev. C78 (2008) 034914.
- [11] T. Anticic et al., [NA49 Collab.] Phys. Rev. C92 (2015) 044905.
- [12] A. Aduszkiewicz et al., [NA61/SHINE Collab.] Eur. Phys. J. C76 (2016) 635.
- [13] M. Gazdzicki, K. Grebieszkow, M. Mackowiak, and S. Mrowczynski Phys. Rev. C83 (2011) 054907.
- [14] M. Gorenstein Phys. Rev. C84 (2011) 024902.
- [15] A. Rustamov and M. Gorenstein Phys. Rev. C86 (2012) 044906.
- [16] C. A. Pruneau Phys. Rev. C96 (2017) 054902.
- [17] M. Mackowiak-Pawlowska and P. Przybyla Eur. Phys. J. C78 (2018) 391.
- [18] C. A. Pruneau and A. Ohlson Phys. Rev. C98 (2018) 014905.
- [19] M. Arslandok and A. Rustamov Nucl. Instrum. Meth. A 946 (2019) 162622.
- [20] M. Mackowiak-Pawlowska, [NA61 Collab.] PoS CPOD2013 (2013) 048.
- [21] S. Acharya et al., [ALICE Collab.] Eur. Phys. J. C79 no. 3, (2019) 236.
- [22] A. Rustamov, [ALICE Collab.] Nucl. Phys. A967 (2017) 453–456.
- [23] S. Acharya et al., [ALICE Collab.] Phys. Lett. B 807 (2020) 135564.
- [24] A. Bialas, M. Bleszynski, and W. Czyz Nucl. Phys. B111 (1976) 461.
- [25] M. Gazdzicki and S. Mrowczynski Z. Phys. C54 (1992) 127.
- [26] V. V. Begun, M. I. Gorenstein, and K. Grebieszkow J. Phys. G 42 (2015) 075101.
- [27] M. Gorenstein PoS CPOD2014 (2015) 017.
- [28] N. Abgrall et al., [NA61/SHINE Collab.] Eur. Phys. J. C74 (2014) 2794.
- [29] A. Aduszkiewicz et al., [NA61/SHINE Collab.] Eur. Phys. J. C77 no. 10, (2017) 671.
- [30] N. Abgrall et al., [NA61 Collab.], “Calibration and analysis of the 2007 data,” 2008. CERN-SPSC-2008-018, CERN-SPSC-SR-033.
- [31] N. Abgrall et al., [NA61/SHINE Collab.] Phys. Rev. C84 (2011) 034604.
- [32] M. Unger, [NA61/SHINE Collab.] EPJ Web Conf. 52 (2013) 01009.
- [33] K. Werner Nucl. Phys. Proc. Suppl. 175-176 (2008) 81–87.
- [34] T. Pierog, C. Baus, R. Ulrich, Cosmic Ray Monte Carlo package, https://web.ikp.kit.edu/rulrich/crmc.html.
- [35] T. Anticic et al., [NA49 Collab.] Phys. Rev. C 70 (Sep, 2004) 034902.
- [36] NA61/SHINE acceptance for these analysis available at https://edms.cern.ch/document/2228711/1.
- [37] M. van Leeuwen, [NA49 Collab.] arXiv:nucl-ex/0306004 [nucl-ex].
- [38] M. van Leeuwen, ”A practical guide to dE/dx analysis in NA49” (2008) https://edms.cern.ch/document/983015/2.
- [39] M. van Leeuwen, 2003. PhD thesis, NIKHEFF, Amsterdam (2003), CERN EDMS Id 816033; NA49 technical notes G. Veres, CERN EDMS Id 815871 (2000), M. van Leeuwen, CERN EDMS Id 983015.
- [40] T. Adye, “Unfolding algorithms and tests using RooUnfold,” in PHYSTAT 2011, pp. 313–318. CERN, Geneva, 2011. arXiv:1105.1160 [physics.data-an].
- [41] B. Efron The Annals of Statistics 7 (1979) 1–26.
- [42] T. C. Hesterberg, D. S. Moore, S. Monaghan, A. Clipson, and R. Epstein, Bootstrap methods and permutation tests. WHFreeman, 2005.
- [43] Z. Koba, H. B. Nielsen, and P. Olesen Nucl. Phys. B40 (1972) 317–334.
- [44] A. Golokhvastov Phys. Atom. Nucl. 64 (2001) 1841–1855.
- [45] A. Golokhvastov Phys. Atom. Nucl. 64 (2001) 84–97.
- [46] T. Anticic et al., [NA49 Collab.] Phys. Rev. C 83 (2011) 061902.
- [47] C. Alt et al., [NA49 Collab.] Phys.Rev. C79 (2009) 044910.
- [48] T. Anticic et al., [NA49 Collab.] PoS CPOD2009 (2009) 029.
- [49] J. Weil et al. Phys. Rev. C94 (2016) 054905.
- [50] K. Werner Phys. Rept. 232 (1993) 87–299.
- [51] K. Werner Nucl. Phys. A525 (1991) 501–506.
The \NASixtyOneCollaboration
A. Acharya 9, H. Adhikary 9, A. Aduszkiewicz 15, K.K. Allison 25, E.V. Andronov 21, T. Antićić 3, V. Babkin 19, M. Baszczyk 13, S. Bhosale 10, A. Blondel 4, M. Bogomilov 2, A. Brandin 20, A. Bravar 23, W. Bryliński 17, J. Brzychczyk 12, M. Buryakov 19, O. Busygina 18, A. Bzdak 13, H. Cherif 6, M. Ćirković 22, M. Csanad 7, J. Cybowska 17, T. Czopowicz 9,17, A. Damyanova 23, N. Davis 10, M. Deliyergiyev 9, M. Deveaux 6, A. Dmitriev 19, W. Dominik 15, P. Dorosz 13, J. Dumarchez 4, R. Engel 5, G.A. Feofilov 21, L. Fields 24, Z. Fodor 7,16, A. Garibov 1, M. Gaździcki 6,9, O. Golosov 20, V. Golovatyuk 19, M. Golubeva 18, K. Grebieszkow 17, F. Guber 18, A. Haesler 23, S.N. Igolkin 21, S. Ilieva 2, A. Ivashkin 18, S.R. Johnson 25, K. Kadija 3, N. Kargin 20, E. Kashirin 20, M. Kiełbowicz 10, V.A. Kireyeu 19, V. Klochkov 6, V.I. Kolesnikov 19, D. Kolev 2, A. Korzenev 23, V.N. Kovalenko 21, S. Kowalski 14, M. Koziel 6, A. Krasnoperov 19, W. Kucewicz 13, M. Kuich 15, A. Kurepin 18, D. Larsen 12, A. László 7, T.V. Lazareva 21, M. Lewicki 16, K. Łojek 12, V.V. Lyubushkin 19, M. Maćkowiak-Pawłowska 17, Z. Majka 12, B. Maksiak 11, A.I. Malakhov 19, A. Marcinek 10, A.D. Marino 25, K. Marton 7, H.-J. Mathes 5, T. Matulewicz 15, V. Matveev 19, G.L. Melkumov 19, A.O. Merzlaya 12, B. Messerly 26, Ł. Mik 13, S. Morozov 18,20, Y. Nagai 25, M. Naskręt 16, V. Ozvenchuk 10, V. Paolone 26, O. Petukhov 18, I. Pidhurskyi 6, R. Płaneta 12, P. Podlaski 15, B.A. Popov 19,4, B. Porfy 7, M. Posiadała-Zezula 15, D.S. Prokhorova 21, D. Pszczel 11, S. Puławski 14, J. Puzović 22, M. Ravonel 23, R. Renfordt 6, D. Röhrich 8, E. Rondio 11, M. Roth 5, B.T. Rumberger 25, M. Rumyantsev 19, A. Rustamov 1,6, M. Rybczynski 9, A. Rybicki 10, S. Sadhu 9, A. Sadovsky 18, K. Schmidt 14, I. Selyuzhenkov 20, A.Yu. Seryakov 21, P. Seyboth 9, M. Słodkowski 17, P. Staszel 12, G. Stefanek 9, J. Stepaniak 11, M. Strikhanov 20, H. Ströbele 6, T. Šuša 3, A. Taranenko 20, A. Tefelska 17, D. Tefelski 17, V. Tereshchenko 19, A. Toia 6, R. Tsenov 2, L. Turko 16, R. Ulrich 5, M. Unger 5, D. Uzhva 21, F.F. Valiev 21, D. Veberič 5, V.V. Vechernin 21, A. Wickremasinghe 26,24, K. Wojcik 14, O. Wyszyński 9, A. Zaitsev 19, E.D. Zimmerman 25, and R. Zwaska 24
1 National Nuclear Research Center, Baku, Azerbaijan
2 Faculty of Physics, University of Sofia, Sofia, Bulgaria
3 Ruđer Bošković Institute, Zagreb, Croatia
4 LPNHE, University of Paris VI and VII, Paris, France
5 Karlsruhe Institute of Technology, Karlsruhe, Germany
6 University of Frankfurt, Frankfurt, Germany
7 Wigner Research Centre for Physics of the Hungarian Academy of Sciences, Budapest, Hungary
8 University of Bergen, Bergen, Norway
9 Jan Kochanowski University in Kielce, Poland
10 Institute of Nuclear Physics, Polish Academy of Sciences, Cracow, Poland
11 National Centre for Nuclear Research, Warsaw, Poland
12 Jagiellonian University, Cracow, Poland
13 AGH - University of Science and Technology, Cracow, Poland
14 University of Silesia, Katowice, Poland
15 University of Warsaw, Warsaw, Poland
16 University of Wrocław, Wrocław, Poland
17 Warsaw University of Technology, Warsaw, Poland
18 Institute for Nuclear Research, Moscow, Russia
19 Joint Institute for Nuclear Research, Dubna, Russia
20 National Research Nuclear University (Moscow Engineering Physics Institute), Moscow, Russia
21 St. Petersburg State University, St. Petersburg, Russia
22 University of Belgrade, Belgrade, Serbia
23 University of Geneva, Geneva, Switzerland
24 Fermilab, Batavia, USA
25 University of Colorado, Boulder, USA
26 University of Pittsburgh, Pittsburgh, USA