Comparing Fair Ranking Metrics
Abstract.
Ranked lists are frequently used by information retrieval (IR) systems to present results believed to be relevant to the user’s information need. Fairness is a relatively new but important aspect of these rankings to measure, joining a rich set of metrics that go beyond traditional accuracy or utility constructs to provide a more holistic understanding of IR system behavior. In the last few years, several metrics have been proposed to quantify the (un)fairness of rankings, particularly with respect to particular group(s) of content providers, but comparative analyses of these metrics — particularly for IR — is lacking. There is limited guidance, therefore, to decide what fairness metrics are applicable to a specific scenario, or assessment of the extent to which metrics agree or disagree applied to real data. In this paper, we describe several fair ranking metrics from existing literature in a common notation, enabling direct comparison of their assumptions, goals, and design choices; we then empirically compare them on multiple data sets covering both search and recommendation tasks.
1. Introduction
Ranked lists are frequently used in information retrieval (IR) to present items in response to users’ information needs. Through the ranked list, a system exposes items (and their providers) to users, and this visibility affects what users discover, consume, and purchase. Further, exposure is not always evenly or fairly distributed (Diaz et al., 2020). Inequitable exposure can disadvantage content providers individually (when an item receives more or less exposure than other items of comparable relevance) or on a group basis (when a group of items or providers are systematically under- or over-exposed). Fairness in IR is a broad topic encompassing many concerns, including the concerns of multiple stakeholders (Burke, 2017) and variety of fairness objectives that may be pursued (Zehlike et al., 2021). Fairness is also a complex and contested social construct (Selbst et al., 2019), so there is not one fairness goal that can be achieved; rather, fairness objectives and metrics need to be selected for a particular application and set of concerns. For a fuller treatment of fairness, Mitchell et al. (2021) provide an overview of general concepts of fairness in machine learning systems, and Ekstrand et al. (2021) systematize fairness in IR.
In the last few years, several metrics have been proposed to measure the fairness of rankings in this sense, along with various goals for what it means for a ranking to be fair or unfair towards items and their providers. These metrics have typically been tested on a different applications and data sets, some in IR but many in the contexts of college rankings or university admissions. Kuhlman et al. (2021) compare selected fair ranking metrics for measuring the statistical parity of rankings (whether they provide equal exposure to different groups), and Zehlike et al. (2021) provides a thorough conceptual survey of fair ranking constructs, but there has not yet been a systematic comparison of group fairness metrics for ranked IR outputs (where the system provides different rankings in response to for different information needs — both prior comparisons focus on rankings for a single need), or direct comparisons within the same data set and experiment. Applying fair ranking metrics to real IR experiment data reveals challenges with their practical applications, including incomplete data (for both relevance and group membership) and the occurrence of edge cases such as groups with no relevant (or retrieved) items.
In this work we specifically consider ways of assessing if the rankings a system produces are fair or unfair to content providers from particular (often demographic) groups; this is provider-side group fairness (Burke, 2017). We adopt the common frame inspired by United States anti-discrimination law of a “protected group”: a class of people who share a trait upon which a retrieval or classification should not be discriminatory (Xiang and Raji, 2019). Our goal is to provide insight on how to measure the provider-side group fairness of the ranked outputs in actual IR experiments (search and recommendations) using metrics from the existing literature, comparing them and documenting limitations in their practical application. This paper has three contributions:
-
•
We describe rank fairness metrics in a unified notation for IR applications, identifying design points, similarities, and differences.
-
•
We identify gaps between the conceptual form of the metrics and the practicalities of applying them search and recommendation experiments.
-
•
We directly compare metric results with the same data and systems across multiple search and recommendation data sets.
2. Fair Ranking Metrics
| Metric(s) | Weighting | Target | Binomial? | Range | More Fair |
|---|---|---|---|---|---|
| (Yang and Stoyanovich, 2017) | — | from full ranking | Dep. on 111 and both use binomial protected group attributes, but generalizes. | 0 | |
| (Sapiezynski et al., 2019) | Geometric | configured | Dep. on | 0 | |
| FAIR (Zehlike et al., 2017) | — | binomial | Yes | 1 | |
| logDP (Singh and Joachims, 2018) | Logarithmic | equality | Yes | 0 | |
| logEUR (Singh and Joachims, 2018) | Logarithmic | Yes | 0 | ||
| logRUR (Singh and Joachims, 2018) | Logarithmic | Yes | 0 | ||
| IAA (Biega et al., 2018) | Geometric | No | 0 | ||
| EEL, EER (Diaz et al., 2020) | Cascade, RBP. | No | EEL 0, EER | ||
| EED (Diaz et al., 2020) | Cascade222Cascade weighting also incorporates relevance into exposure, even if exposure is not compared to relevance., RBP. | equality | No | 0 | |
| PAIR (Beutel et al., 2019; Narasimhan et al., 2020) | — | equal accuracy | No | 0 |
We begin by describing the fair ranking metrics, summarized in table 1, in a common framework and notation. This enables direct comparison of their designs and theoretical behavior, and facilitates easier implementation in IR experiments. In some cases, we assign new name for metrics based on their functionality, purpose, and comparability within our synthesis.
2.1. Problem Formulation
| document or item | |
| request (query or user) | |
| ranked list of documents from | |
| the document in position of list | |
| rank of document in | |
| prefix of of length | |
| relevance of to | |
| number of groups | |
| group alignment vector | |
| group alignment matrix for documents in | |
| set of documents in protected group in | |
| set of documents non-protected group in | |
| target group distribution | |
| attention vector for documents in | |
| position weight of in | |
| the exposure of groups in () |
We consider an IR system that retrieves a ranked list of documents in response to requests (query in a search system or a user in recommender system) (notation summarized in table 2). Documents may have an associated request-specific relevance score , and the system may estimate this by a predictor . Providers are associated with one (or more) of groups. We represent this by giving each document an alignment vector (s.t. ) indicating its group association; generalizing from a categorical variable to a vector allows soft association (mixed or partial membership) or uncertainty about membership (Sapiezynski et al., 2019). We generalize to a list function, with denoting an alignment matrix whose rows correspond to the documents of and columns are groups. In the case of definitively-known membership in a binomial pair of groups, denotes the set of documents in in the “protected” group and the remaining documents.
Our goal is to measure exposure (sometimes called attention) each document, content provider, or group receives, and assess the fairness of this distribution to ensure demographic or statistical parity (ensures comparable outcomes across groups or equality of opportunities (ensures equal treatment based on merit or utility irrespective of the group membership). Accounting for the decreasing attention users are likely to pay to documents at deeper rank positions (position bias) requires a browsing model; some metrics build this implicitly into their structure, while others explicitly model it as a position weight vector for . Table 3 describes the various weighting schemes used by the metrics we survey. The resulting exposure is then sometimes compared with a target distribution that represents across groups. There are several ways of computing , including strict group equality, an estimate of the distribution of actual or potential content providers, or the distribution among providers of relevant documents.
| Model | Formula | Parameters |
|---|---|---|
| Geometric | Stopping probability | |
| Logarithmic | — | |
| RBP | Continuation probability (patience) | |
| Cascade | Patience , stopping probability function |
| Distance Function | 333Binomial is a scalar probability of the protected group. | Formula |
|---|---|---|
| Binomial | ||
| Binomial | ||
| Multinomial | 444K-L divergence; is the probability distribution of groups in . |
2.2. Statistical Parity in Single Rankings
We begin with metrics that assess the fairness of a single ranking and only measure exposure equity without considering relevance (that is, they target statistical parity). These metrics can be aggregated over the rankings produced by a system, e.g. by taking the mean, to produce an overall system fairness score.
The simplest way to measure the fairness of a single ranking is to measure the proportion of items in each group (Ekstrand and Kluver, 2020), but this does not account for position bias. Yang and Stoyanovich (2017) propose a family of statistical parity measures that incorporate position bias by averaging parity over successive prefixes of the ranking; we therefore call this the prefix fairness family (). These metrics are optimized when the representation in each prefix matches the target as closely as possible, as measured by a distance function ; Yang and Stoyanovich used the full ranking’s composition as , and instantiate with distance functions ND, RD, and KL (from Table 4) to yield different members of the family. The metric is defined as
| (1) |
where normalizing scalar (taken over all with the same length and group composition as , where is the prefix fairness function without the normalizer), scaling to the range where represents maximum unfairness. has the advantage of allowing multinomial protected attributes and soft group association. does not work when , and does not work when is small. The normalizing constant is troublesome to compute with incomplete group membership data.
Zehlike et al. (2017) propose a similarly-motivated group fairness constraint for single list and binomial groups: satisfies the FAIR constraint if for every prefix with , the protected group is not statistically significantly under-represented. Unlike , FAIR does not penalize over-representing the protected group. We convert this constraint into a metric by taking the average of the binomial probabilities:
| (2) | ||||
FAIR limits applicability into binomial distribution and fixed group association.
Sapiezynski et al. (2019) provide a more general metric for single-list fairness by using an explicit (and configurable) position weight model instead of embedding the browsing model in the metric structure. Given an alignment matrix and suitably normalized position weight vector, is a distribution that represents the cumulative exposure of the various groups in . The resulting unfairness metric, which we call Attention-Weighted Rank Fairness (), is the difference between this exposure distribution and the population estimator:
| (3) |
allows soft association and multinomial protected attributes. The distance function in Table 4 depends on application context; for assessing a particular protected class representation, difference in probability is suitable distance.
2.3. Statistical Parity in Multiple Rankings
In many cases, fair exposure cannot be achieved in a single ranking, because the attention paid to rank positions often decreases more steeply than utility (Biega et al., 2018; Diaz et al., 2020). One way to address this is to measure fairness over sequences or distributions of rankings, so providers have comparable opportunity to be exposed in response to at least some requests. This approach can be modeled as a request-dependent distribution (or policy) over rankings (Singh and Joachims, 2018; Diaz et al., 2020). We extend this to also model the arrival of requests as a distribution , so a sequence of rankings (Biega et al., 2018) is a series of draws from the distribution . The group exposure within a single ranking from Eq. 3, , is the fundamental building block of these metrics, along with its expected value:
Singh and Joachims (2018) and Diaz et al. (2020) each propose metrics for measuring statistical parity over ranking policies. Neither metric incorporates a target distribution; they are optimal when all groups are equally exposed. Demographic parity (DP, Singh and Joachims, 2018) measures the difference in exposure between two groups:555The original paper presented a constraint, not a metric, for demographic parity; we have implemented it as a ratio to be consistent with the other metrics.
| (4) |
Expected exposure disparity (EED, Diaz et al., 2020) ensures well-distributed exposure by measuring the inequality in exposure distribution across groups with the norm:
| (5) |
2.4. Equal Opportunity in Multiple Rankings
So far, none of the metrics we have discussed account for the utility of the ranked results — rankings do well by exposing providers regardless of the utility of their items. The intuition behind incorporating utility, articulated independently by Singh and Joachims (2018) and Biega et al. (2018), is that exposure should be proportional to relevance: if an item or a group contributes 10% of the relevance to a request (user and/or query), it should receive approximately 10% of the exposure. This is a ranked analog of the equality of opportunity construct from fair classification (Hardt et al., 2016): outcome is conditionally independent of group given utility.
To measure deviation from this goal, Singh and Joachims (2018) propose two metrics. The exposed utility ratio (EUR)666Singh and Joachims (2018) used the terms “disparate treatment ratio” and “disparate impact ratio” for EUR and RUR, respectively; this terminology is not consistent with the use of these terms in the broader algorithmic fairness literature; as we understand it, exposure the system gives to providers is an impact, not a treatment. We have changed the names to reduce confusion going forward., measures violation from the goal that each group’s exposure is proportional to its contributed utility (measured by ):
| (6) |
The realized utility ratio (RUR) incorporates utility into both numerators and denominators by measuring whether the discounted utility contributed by each group () is proportional to its total utility:
| (7) |
EUR and RUR do not allow multinomial protected groups and soft associations.
Biega et al. (2018) present the amortized attention construct to measure exposure over the sequence of rankings. This compares rank exposure with expected utility (computed with system-predicted utility ) instead of ground truth relevance assessments ), measuring whether the system allocates exposure proportional to the utility it estimates items to have. Deviations from this goal are measured by taking the norm of the group exposure-utility differences, yielding the Inequity of Amortized Attention (IAA) metric:
| (8) |
Diaz et al. (2020) build on this to integrate relevance in a different way. Rather than relate exposure directly to relevance, they use relevance to derive target exposure based on an ideal policy that assigns equal probability to all rankings that place items in non-decreasing order of relevance and probability to all other rankings. The target exposure is the expected exposure under the ideal policy (). They take the squared Euclidean distance between system expected exposure and target exposure, yielding the Expected Exposure Loss:
| (9) | ||||
| (10) |
The decomposition in Eq. 10 yields expected exposure relevance (measuring the alignment of exposure and relevance, with higher values representing better distributions) along with EED.
Neither IAA nor the EE metrics distinguish between group over- or under-exposure; for both, is perfectly fair and larger values are unfair, with no preferential treatment given to a protected group. The common thread between these metrics, articulated by Diaz et al. (2020), is that for a fixed information need, differences in exposure between items with the same relevance grade results in unfair outcomes. The only way to address this inequity in practice is by varying the rankings returned by the system, as with a stochastic policy.
2.5. Pairwise Metrics
Beutel et al. (2019) and Narasimhan et al. (2020) take an entirely different approach by defining fairness objectives over pairwise orderings instead of entire rankings. Pairwise fairness is then defined in terms of the pairwise accuracy for ranking relevant items in different groups:
| (11) |
| ranks above | ||||
| more relevant than |
A ranking satisfies pairwise equal opportunity(Narasimhan et al., 2020) if pairs of documents are equally likely to be ranked consistently with their relevance regardless of the group membership of the items in the pair. This can be measured by the group’s pairwise accuracy with respect to all items (, its inter-group accuracy (), or its intra-group accuracy (). Given protected and unprotected groups, we can define a fairness metric as the difference in pairwise accuracy:
2.6. Assessing Metric Design
Rendering metrics in a common notation elicits that the metrics are quite similar in their basic concepts. The fundamental construct — weighted exposure — is the same across most metrics (pairwise fairness being an exception), and they differ primarily in how they relate exposure to relevance and how they aggregate and compare exposure distributions. The following questions help identify more precisely what their salient differences are and how those may relate to particular IR applications and experimental settings.
Does the metric incorporate relevance? EEL, EER, EUR, RUR, IAA, and PAIR directly incorporate relevance into the metric; others strictly measure statistical parity. It is desired depending on the precise task and evaluation goal. Statistical parity metrics are useful for measuring relative fairness of rankings already optimized for utility, particularly when there is no relevance information available or large relevant sets available. They can also be used to detect discrepancies that may indicate unfairness in relevance data. However, using such metrics in isolation for evaluation or optimization may reduce ranking quality.
How does it handle missing data? Real-world data sets are often incomplete, missing relevance and/or group labels for many documents. Metrics that are less vulnerable towards that problem will be easier to apply in such cases. Missing relevance data affects EUR, RUR, EER, and EEL like it does classical IR evaluation metrics such as nDCG; the straightforward but biased approach is to treat items with unknown relevance as irrelevant (). IAA’s use of system-estimated relevance allows it to sidestep missing relevance problem.
Missing group labels require different handling. For many metrics we can include unlabeled items when computing attention weights but exclude them from further analysis, or treat “unknown” as an additional group identity. Unknown data is a more significant problem for the family because it treats a list with fewer than 10 known-group items as maximally fair, and the straightforward way of computing — make the ranking maximally unfair by putting all protected items last — does not work in the face of missing data.
How does it respond to edge cases? Realistic IR experiments bring a number of important edge cases, such as groups with no items relevant to or retrieved for a request. Ratio-based metrics and distance functions are particularly vulnerable to these problems; EUR metric and distance function, for example, approach infinity as the number of dominant-group protected items retrieved goes to zero. RUR is even more brittle, as it requires nonzero relevance from retrieved dominant-group items to avoid infinity, and both it and EUR can be infinite or undefined if the set of relevant items from either group is zero.
What is the target? , FAIR, , EEL, and EER provide flexibility in determining how the (un)fairness of exposure is ultimately assessed through selection of the target distribution, while targets are implicitly baked in to the structure of others. This configurability is useful because it allows the metric to be adapted to the fairness requirements of a particular task, although it can impair comparability between experiments.
How does the metric compare the system with target? Some metrics ( and ) use an explicit distance function to compare distributions, while others use ratios of specific proportions or norms of differences in distributions. Norms and selected distance functions (such as ) can accommodate soft association, while ratios and distance functions based on binomial probabilities require definitive membership in binomial groups. They can be adapted to some multi-group situations if only one group’s exposure needs to be considered.
What user model does it use? Most metrics allow different position weighting strategies to be selected, both in its structure and its parameters. This configurability allows the metric to be adapted to a specific application but introduces potential sensitivity to choices of weight functions and parameter values. , FAIR, and PAIR are not configurable, as position weighting is built-in (as in and FAIR) or unavailable (in PAIR).
3. Empirical Comparison
To complement our comparison, we implement the metrics to measure the fairness of systems from prior experiments in search and recommendation.
3.1. Data and Tasks
| Fair TREC | ||||
|---|---|---|---|---|
| GoodReads | 2019 Rerank | 2020 Rerank | 2020 Ad-hoc | |
| Systems | 4 | 14 | 23 | 5 |
| Requests | 5000 | 500 | 195 | 189 |
| Items | 23,60,655 | 2052 | 2112 | 2112 |
| 1,90,711 | 312 | 294 | 294 | |
| 21,17,451 | 1906 | 1632 | 1632 | |
Table 5 summarizes our experimental data. For search experiments, we used submitted runs and evaluations from the TREC Fair Ranking Track 2019 (Biega et al., 2019) and 2020 (Biega et al., 2020). These runs covered three tasks across two years, all on scholarly search: re-ranking tasks from 2019 and 2020 and an ad-hoc retrieval task from 2020. Each document has a soft association with the economic development level of its author(s), and we consider each submitted run as an individual system and used the given sequences of rankings for each system.
For the recommendation task, we re-used the experiment and code from Ekstrand and Kluver (2020) to measure 4 algorithms from the LensKit software (Ekstrand, 2020) on data from GoodReads (Wan and McAuley, 2018), modifying the experiment to use 5 interactions per user as test data instead of the original 1. Group membership is binary, with female authors as the protected group777Binary gender membership is a limitation of the original study; see Ekstrand and Kluver (2020) for details.; membership is unknown for some items. We sampled 5000 users, each of which had at least 10 book interactions, for our experiment, holding out 5 interactions per user as test data for assessing relevance in the resulting recommendations. We measured the fairness of the recommendations produced for these users by four collaborative filtering (CF) algorithms: user-based CF (UU, (Herlocker et al., 1999)), item based CF (I-I, (Deshpande and Karypis, 2004)), matrix factorization (WRLS, (Takács et al., 2011)), and Bayesian Personalized Ranking (BPR, (Rendle et al., 2012)), using algorithms and hyper-parameter tunings from Ekstrand and Kluver (2020).
3.2. Metric Implementations
We implemented metrics from Section 2 in Python to measure the fairness of the runs from the experiments we consider.
While implementing metric, we had difficulties because this metric suffers from missing data and numerous edge case breakdown. We exclude for further analysis.
We did need to make some further decisions and adjustments to the remaining metrics in our experiment:
-
•
For , we follow the original implementation and use to compare the representation of the protected group with the target distribution. We applied with two target distributions: computes from the distribution of providers in the full data set, while AWRF_equal targets equal representation of protected and unprotected groups.
-
•
For IAA and the EE* metrics on the recommendation experiment, we treat unknown gender as a third author group.
-
•
PAIR do not depend only on the top- list — they are functions of the system’s overall ranking between items. Therefore, instead of computing them from ranked output we directly measured the recommendation model’s scores for a sample of items. For each test item, we sampled 10,000 items not rated by the target user as negative examples, and used these to estimate the probability of correct orderings. This proved relatively efficient for our experiment size. We could not test these metrics on FairTREC because we do not have access to full rankings or the systems’ relevance scores.
3.3. Empirical Results
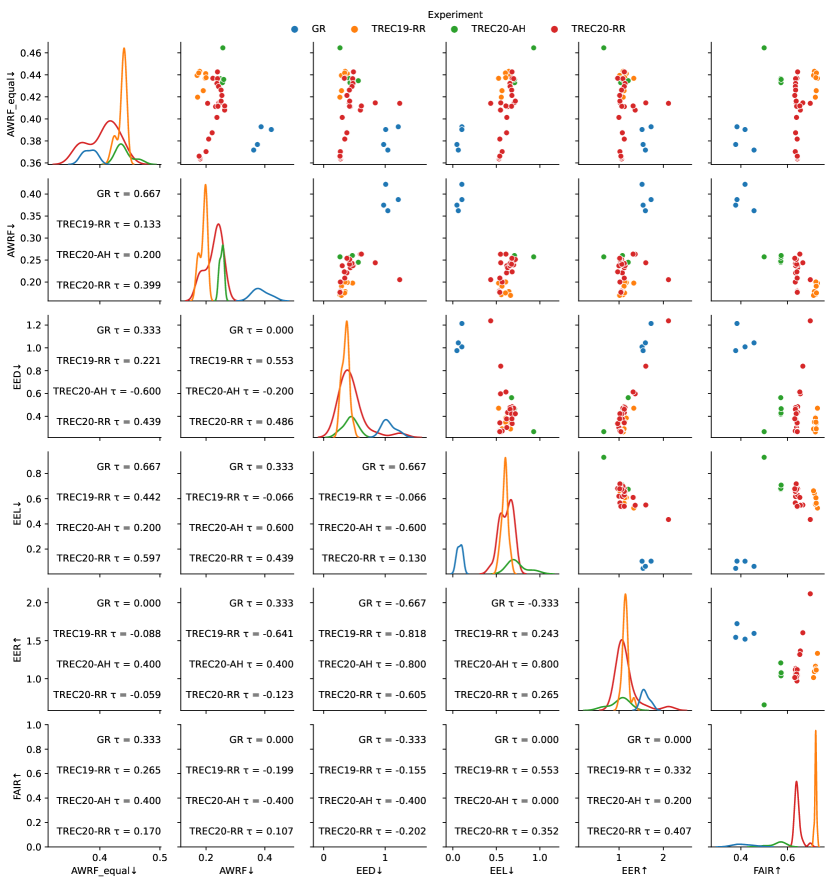
Our goal is to observe whether the metrics agree or disagree, and if this agreement is consistent across experiments. Figure 1 shows the metric results from our experiments along with their Kendall correlations. We do not show results from metrics that only worked on one experiment, but the metrics do not show clear consensus across datasets; there are substantial differences in their system orderings, and metrics that agree in one experiment don’t often don’t agree on others. The most consistently agreeing pair is EEL and with an equal-exposure target (positive correlation in all experiments, and comparatively high correlation in three of them).
4. Conclusion, Recommendations, and Future Directions
Many metrics have been proposed for measuring the fairness of ranked outputs. Through analytically and empirically comparing fair ranking metrics, we have identified several of their key commonalities and differences, assumptions and crucial design decisions, and have presented them in a form amenable to implementation in IR experiments. Our empirical results highlight the need for further research to identify the implications of these metrics’ disagreements, as well as the impact of specific design decisions and configurations, but our analytical comparison (Section 2) and implementation experience allow us to make some preliminary recommendations for selecting a metric:
Single Rankings seems the most generally useful, as it supports multinomial protected attributes with soft association, and is adaptable to multiple attention models, target distributions, and difference functions depending on the application. We are not yet able to make concrete recommendations for the choice of difference function.
Demographic Parity in Sequences Again, due to support for multinomial groups and soft association, along with edge-case problems in ratio-based metrics, EED looks like the best current choice for this case.
Equal Opportunity in Sequences We currently recommend using EEL and EER because they allow multinomial groups with soft association, and selectable target distribution. If sparse relevance judgments are a problem, IAA is a good choice and can be applied with multinomial groups and soft associations.
There is significant further work needed to advance the robust measurement of ranking fairness. Data sparsity and ambiguity are a significant problem; there has been work on allowing missing (Kırnap et al., 2021), ambiguous, or multiple group associations (Ghosh et al., 2021) that needs to be incorporated into flexible metrics. We also need further study on the implications of specific design and parameter choices; our empirical results have shown notable disagreement between metrics, but we do not yet know which of the various design decisions is responsible for these differences, or how metric values change in response to particular aspects of the data set or system rankings.
We believe our synthesis and comparison will lay a valuable foundation for this vital and ongoing work.
Acknowledgements.
This material is based upon work supported by the National Science Foundation under Grant No. IIS 17-51278.References
- Beutel et al. (2019) Beutel, A., Chen, J., Doshi, T., Qian, H., Wei, L., Wu, Y., Heldt, L., Zhao, Z., Hong, L., Chi, E.H., et al.: Fairness in recommendation ranking through pairwise comparisons. In: Proceedings of the 25th ACM SIGKDD International Conference on Knowledge Discovery & Data Mining. pp. 2212–2220 (2019)
- Biega et al. (2019) Biega, A.J., Diaz, F., Ekstrand, M.D., Kohlmeier, S.: Overview of the trec 2019 fair ranking track. In: The Twenty-Eighth Text REtrieval Conference (TREC 2019) Proceedings (2019)
- Biega et al. (2020) Biega, A.J., Diaz, F., Ekstrand, M.D., Kohlmeier, S.: Overview of the trec 2019 fair ranking track. arXiv preprint arXiv:2003.11650 (2020)
- Biega et al. (2018) Biega, A.J., Gummadi, K.P., Weikum, G.: Equity of attention: Amortizing individual fairness in rankings. In: Proceedings of the 41st International ACM SIGIR Conference on Research and Development in Information Retrieval. pp. 405–414 (2018)
- Burke (2017) Burke, R.: Multisided fairness for recommendation (Jul 2017), http://arxiv.org/abs/1707.00093
- Deshpande and Karypis (2004) Deshpande, M., Karypis, G.: Item-based top-n recommendation algorithms. ACM Transactions on Information Systems (TOIS) 22(1), 143–177 (2004)
- Diaz et al. (2020) Diaz, F., Mitra, B., Ekstrand, M.D., Biega, A.J., Carterette, B.: Evaluating stochastic rankings with expected exposure. arXiv preprint arXiv:2004.13157 (2020)
- Ekstrand (2020) Ekstrand, M.D.: Lenskit for python: Next-generation software for recommender systems experiments. In: Proceedings of the 29th ACM International Conference on Information & Knowledge Management. pp. 2999–3006 (2020)
- Ekstrand et al. (2021) Ekstrand, M.D., Das, A., Burke, R., Diaz, F.: Fairness and discrimination in information access systems. arXiv preprint arXiv:2105.05779 (2021)
- Ekstrand and Kluver (2020) Ekstrand, M.D., Kluver, D.: Exploring author gender in book rating and recommendation. User Modeling and User-Adapted Interaction (feb 2020), https://md.ekstrandom.net/pubs/bag-extended
- Ghosh et al. (2021) Ghosh, A., Dutt, R., Wilson, C.: When fair ranking meets uncertain inference. arXiv preprint arXiv:2105.02091 (2021)
- Hardt et al. (2016) Hardt, M., Price, E., Srebro, N.: Equality of opportunity in supervised learning. arXiv preprint arXiv:1610.02413 (2016)
- Herlocker et al. (1999) Herlocker, J.L., Konstan, J.A., Borchers, A., Riedl, J.: An algorithmic framework for performing collaborative filtering. In: Proceedings of the 22nd Annual International ACM SIGIR Conference on Research and Development in Information Retrieval. p. 230–237. Association for Computing Machinery, New York, NY, USA (1999)
- Kırnap et al. (2021) Kırnap, Ö., Diaz, F., Biega, A., Ekstrand, M., Carterette, B., Yılmaz, E.: Estimation of fair ranking metrics with incomplete judgments (2021)
- Kuhlman et al. (2021) Kuhlman, C., Gerych, W., Rundensteiner, E.: Measuring group advantage: A comparative study of fair ranking metrics. In: Proceedings of the 2021 AAAI/ACM Conference on AI, Ethics, and Society (AIES’21) (2021)
- Mitchell et al. (2021) Mitchell, S., Potash, E., Barocas, S., D’Amour, A., Lum, K.: Algorithmic fairness: Choices, assumptions, and definitions. Annual Review of Statistics and Its Application 8 (2021)
- Narasimhan et al. (2020) Narasimhan, H., Cotter, A., Gupta, M.R., Wang, S.: Pairwise fairness for ranking and regression. In: AAAI. pp. 5248–5255 (2020)
- Rendle et al. (2012) Rendle, S., Freudenthaler, C., Gantner, Z., Schmidt-Thieme, L.: Bpr: Bayesian personalized ranking from implicit feedback. arXiv preprint arXiv:1205.2618 (2012)
- Sapiezynski et al. (2019) Sapiezynski, P., Zeng, W., E Robertson, R., Mislove, A., Wilson, C.: Quantifying the impact of user attentionon fair group representation in ranked lists. In: Companion Proceedings of The 2019 World Wide Web Conference. pp. 553–562 (2019)
- Selbst et al. (2019) Selbst, A.D., Boyd, D., Friedler, S.A., Venkatasubramanian, S., Vertesi, J.: Fairness and abstraction in sociotechnical systems. In: Proceedings of the Conference on Fairness, Accountability, and Transparency - FAT* ’19. pp. 59–68. ACM Press, New York, New York, USA (2019), http://dl.acm.org/citation.cfm?doid=3287560.3287598
- Singh and Joachims (2018) Singh, A., Joachims, T.: Fairness of exposure in rankings. In: Proceedings of the 24th ACM SIGKDD International Conference on Knowledge Discovery & Data Mining. pp. 2219–2228 (2018)
- Takács et al. (2011) Takács, G., Pilászy, I., Tikk, D.: Applications of the conjugate gradient method for implicit feedback collaborative filtering. In: Proceedings of the Fifth ACM Conference on Recommender Systems. pp. 297–300. RecSys ’11, Association for Computing Machinery, New York, NY, USA (Oct 2011)
- Wan and McAuley (2018) Wan, M., McAuley, J.: Item recommendation on monotonic behavior chains. In: Proceedings of the 12th ACM Conference on Recommender Systems. pp. 86–94 (2018)
- Xiang and Raji (2019) Xiang, A., Raji, I.: On the legal compatibility of fairness definitions. NeurIPS (2019)
- Yang and Stoyanovich (2017) Yang, K., Stoyanovich, J.: Measuring fairness in ranked outputs. In: Proceedings of the 29th International Conference on Scientific and Statistical Database Management. pp. 1–6 (2017)
- Zehlike et al. (2017) Zehlike, M., Bonchi, F., Castillo, C., Hajian, S., Megahed, M., Baeza-Yates, R.: Fa* ir: A fair top-k ranking algorithm. In: Proceedings of the 2017 ACM on Conference on Information and Knowledge Management. pp. 1569–1578 (2017)
- Zehlike et al. (2021) Zehlike, M., Yang, K., Stoyanovich, J.: Fairness in ranking: A survey. arXiv preprint arXiv:2103.14000 (2021)