Pulsation-driven mass loss from massive stars behind stellar mergers in metal-poor dense clusters
Abstract
The recent discovery of high-redshift () supermassive black holes (SMBH) favors the formation of massive seed BHs in protogalaxies. One possible scenario is formation of massive stars via runaway stellar collisions in a dense cluster, leaving behind massive BHs without significant mass loss. We study the pulsational instability of massive stars with the zero-age main-sequence (ZAMS) mass and metallicity , and discuss whether or not pulsation-driven mass loss prevents massive BH formation. In the MS phase, the pulsational instability excited by the -mechanism grows in . As the stellar mass and metallicity increase, the mass-loss rate increases to . In the red super-giant (RSG) phase, the instability is excited by the -mechanism operating in the hydrogen ionization zone and grows more rapidly in . The RSG mass-loss rate is almost independent of metallicity and distributes in the range of . Conducting the stellar structure calculations including feedback due to pulsation-driven winds, we find that the stellar models of can leave behind remnant BHs more massive than . We conclude that massive merger products can seed monster SMBHs observed at .
1 Introduction
Supermassive black holes (SMBH) of have been discovered in almost all massive galaxies. The past and ongoing surveys of distant quasars have also revealed more than two hundreds of SMBHs beyond , i.e., within 1 Gyr after the Big Bang (e.g., Fan, 2006; Mortlock et al., 2011; Venemans et al., 2013; Wu et al., 2015; Bañados et al., 2018; Matsuoka et al., 2018; Onoue et al., 2019). The formation of such massive objects within a short timescale is a challenging problem in astrophysics, and requires rapid assembly of massive seed BHs in high-redshift protogalaxies (e.g., Volonteri, 2012; Inayoshi et al., 2019).
A natural formation pathway is to consider the remnant BHs left behind by metal-free Population III (hereafter Pop III) stars. Unlike the present-day star-formation where metals and dust grains provide efficient cooling, primordial star-formation proceeds via inefficient H2 cooling, making star-forming clouds significantly warmer than molecular clouds in the present-day universe. As a result, Pop III stars can be as massive as , as recent numerical simulations have found (Hosokawa et al., 2011, 2016; Stacy et al., 2012, 2016; Hirano et al., 2014; Susa et al., 2014). If Pop III remnant BHs of can grow in mass via the Eddington-limited accretion at 100 per cent duty cycle, then their mass can reach within . In reality, however, radiative feedback prohibits such a high duty-cycle over 6-8 orders of magnitude in mass, so that the growth timescale can be much longer than 1 Gyr (e.g., Alvarez et al., 2009; Milosavljević et al., 2009).
An alternative scenario is the formation of massive seeds through gravitational collapse of supermassive stars (SMSs) of . In protogalaxies exposed to strong ultra-violet radiation and experiencing high-density shock-compression, H2 formation is suppressed via photo- and collisional-dissociation, respectively, and star-forming clouds contract almost isothermally with 8000 K via Ly- emission (e.g., Omukai, 2001; Oh & Haiman, 2002; Bromm & Loeb, 2003; Shang et al., 2010; Schleicher et al., 2010; Wolcott-Green & Haiman, 2011; Inayoshi & Omukai, 2012; Agarwal et al., 2012; Regan et al., 2014; Sugimura et al., 2014). This H2-free cloud with a mass of can collapse monolithically to the central single object without vigorous fragmentation at a high mass-accretion rate of , enabling the embryo protostar to grow to a SMS with within its lifetime of Myr (Inayoshi et al., 2014; Becerra et al., 2015). Even if fragmentation is induced by efficient metal/dust cooling, SMS formation would be assisted by rapid migration of fragments via dynamical friction and disk interaction (Inayoshi & Haiman, 2014). Recent hydrodynamical simulations by Chon & Omukai (2020) confirm this in metal-enriched clouds with . Since an SMS grows at such a high accretion rate as , the stellar envelope is bloated with a surface temperature of . Therefore, radiative feedback due to stellar ionizing photons does not prevent mass accretion from the collapsing parent cloud (Hosokawa et al., 2013; Schleicher et al., 2013; Haemmerlé et al., 2018). Eventually, when the mass reaches (e.g., Satō, 1966; Shapiro & Teukolsky, 1983; Umeda et al., 2016), the SMS directly collapses into a remnant BH with a similar mass by the general-relativistic instability, nearly regardless of stellar rotation and nuclear fusion activated during the collapse phase (Shibata & Shapiro, 2002; Uchida et al., 2017)111 For an SMS with high metallicities, runaway nuclear fusion might cause a very energetic explosion (Montero et al., 2012).. The formation of massive seeds gives them a head start to be , shortening the required growth timescale.
The third possible channel is through very massive stars with via runaway stellar collisions in dense clusters. When the stellar density is sufficiently high (), direct collisions between stars can take place quickly within a timescale shorter than their lifetime (Katz et al., 2015; Yajima & Khochfar, 2016; Sakurai et al., 2017), leaving a single massive star. In slightly metal-enriched clouds () of protogalaxies, dense clusters with stellar masses of and half-mass radii of 1 pc would be formed by fragmentation via metal and dust cooling (e.g., Omukai et al., 2008; Devecchi & Volonteri, 2009). Using -body simulations, Katz et al. (2015), Sakurai et al. (2017), and Reinoso et al. (2018) show that more massive stars segregate to the center within their lifetime (a few Myr) and start collisions with ambient lower-mass stars in a runaway fashion, forming a very massive star of . We note that in the presence of mass accretion onto the central stars, the bloated stellar radii (i.e., larger cross-sections) increase the stellar-collision rate by up to an order of magnitude, enabling the formation of more massive stars of (Boekholt et al., 2018; Alister Seguel et al., 2020; Tagawa et al., 2020).
Even if very massive stars successfully form, it is not ensured that they can form massive remnant BHs of the same masses before losing significant mass by pulsation- and radiation-driven winds. In the case of SMS formation with rapid mass accretion (), the mass loss associated with both pulsation- and radiation-driven winds is too weak to prevent the stellar growth (Inayoshi et al., 2013; Nakauchi et al., 2017). On the other hand, in the runaway collision scenario without gas accretion, stars gain mass more episodically via stellar collisions alone. The post-merger product contracts its radius in the Kelvin-Helmholtz timescale and evolves into the main-sequence (MS) structure during two successive mergers. If the mass-loss rate exceeds the mass-supplying rate by stellar collisions, the stellar growth is prohibited and the remnant BH mass could be much lower than originally thought. Therefore, it is crucial in the runaway collision scenario to investigate the stability of very massive stars and estimate the mass-loss rate for various situations.
Previous authors (Baraffe et al., 2001; Sonoi & Umeda, 2012; Shiode et al., 2012; Inayoshi et al., 2013) conducted the linear stability analyses for zero-metallicity massive stars with and found that while these stars are pulsationally unstable in the MS phase, the pulsation-driven mass-loss rate () is too small to affect the stellar evolution. Baraffe et al. (2001) and Shiode et al. (2012) also studied the instability of stars for various metallicities of , and , and found the mass-loss rate to be higher with metallicity. However, all the previous works have not investigated the stability in the post-MS stages extensively (note that Heger et al. (1997) and Moriya & Langer (2015) studied the stability of red-supergiants (RSG) both at solar and zero metallicities and found they tend to be more unstable with increasing mass). Extending the parameter space for the stellar mass and metallicity, in this paper, we study the pulsational instability of massive stars in both the MS and post-MS stages. We also calculate the stellar evolution by accounting for feedback due to pulsation-driven mass loss, and discuss the validity of the runaway-stellar-merger scenario as a massive-BH-seeding mechanism.
The rest of the paper is organized as follows. In Section 2, we describe the method for the stellar evolution calculation and the linear stability analysis. Pulsationally unstable models are shown in Section 3.1, with the discussion of the growth rate, excitation mechanism, and mass loss due to instability. In Section 3.2, to estimate the final mass of stars, the stellar structure evolution is calculated by including the backreaction of pulsation-driven mass loss. In Section 4, after the brief summary, we discuss the implications and uncertainties of our results.
2 Method
2.1 Mechanical and thermal equilibrium stellar model
The stellar models at various evolutionary stages are computed by the Modules for Experiments in Stellar Astrophysics (MESA release 12115; Paxton et al., 2011, 2013, 2015, 2018, 2019). We neglect rotation and mass loss by radiation-driven winds. Note that pulsation-driven mass loss is taken into account later (see Section 2.3). The onset of convection is determined by the Ledoux criterion, and the convective energy flux is calculated by the mixing length theory with a mixing length of local pressure scale-height. At the boundaries of convective regions, the convective overshoot is assumed to occur in the extent of pressure scale-height. In addition, the semi-convective mixing is considered with the formalism of Langer et al. (1983), where the dimensionless efficiency parameter is set to .
We consider 24 stellar models with different masses in the zero-age main-sequence (ZAMS) stage of , and , and metallicities of , and , except the case with and . The evolutionary track in each model is calculated from the ZAMS stage to a post-MS stage between the hydrogen depleting and helium depleted times (the corresponding stellar age is Myr). After helium depletion, the residual lifetime is so short ( 100 yrs; Woosley et al., 2002) that the subsequent core evolution does not affect the total mass loaded into pulsation-driven winds. Among the models, the evolution until helium depletion is successfully followed for all the four models with . Due to difficulties in numerical convergence, for the four models of , and (, the simulations are terminated before hydrogen depletion. In the remaining 16 models, the computations are stopped before helium depletion.
2.2 Stability analysis
The instability of radial pulsation modes is considered for the stellar models computed in the previous subsection. Each physical quantity is perturbed in the Lagrangian form as , where is the equilibrium value and the radial displacement from the equilibrium position. Hereafter, the subscript ‘0’ is omitted. By separating the temporal dependence from the spatial one as , where is the eigen-frequency ( is the frequency of the pulsation and is the growing or damping rate of the pulsation depending on its sign), the linearized perturbation equations for continuity, motion, energy and radiative energy transport are written, respectively, as follows:
| (1) |
| (2) |
| (3) |
| (4) |
where , and indicate the Lagrangian perturbation of density, pressure, radiative and convective luminosity, nuclear energy generation rate, entropy, temperature, and opacity, respectively, and the enclosed mass. Owing to the lack of understanding of the interaction between convective motion and pulsation, the perturbation of convective luminosity is often neglected (the so-called frozen-in approximation, e.g., Unno et al., 1989). Hereafter, we adopt this prescription for simplicity and set in Eq. (3).
We impose four boundary conditions, i.e., two at the center and the other two at the surface, to solve Eqs. (1)-(4). At the center (), since the radial displacement is zero, and the central region is sufficiently adiabatic,
| (5) |
At the surface (), we impose the regularity condition of Eq. (2),
| (6) |
and the photospheric condition
| (7) |
Eqs. (1)-(4) with the above four boundary conditions become a two-point boundary value problem with an eigenvalue . We use the numerical code developed by Inayoshi et al. (2013), where the relaxation method described in Section 18.2 of Unno et al. (1989) is adopted. Following Inayoshi et al. (2013), we focus on the fundamental mode (i.e., no nodes in the eigenfunction). The pulsation period and growth rate are calculated by and , respectively. The radial pulsation mode is unstable (or stable) when (, respectively).
The excitation and damping of a pulsation mode can be understood by calculating the work integral , defined as the change of the pulsation energy within the enclosed mass over a pulsation cycle (Unno et al., 1989):
| (8) |
The first term in the integration presents the heat obtained from the nuclear energy generation in one cycle and is rewritten as
| (9) |
where and . This term is always positive and shows the destabilization by the so-called -mechanism. On the other hand, the second term characterizes the pulsation dumping due to radiative diffusion and excitation due to absorption of the radiative flux in the surface layer where the opacity changes remarkably. By maintaining only the dominant terms, the second term is written as
| (10) |
where and . Therefore, only when the opacity satisfies
| (11) |
stars are destabilized (the so-called -mechanism).
When the perturbation grows slowly in an oscillation period (i.e., , ), the work integral is related to the growth (or damping) rate of the pulsation per single period as
| (12) |
where is the pulsation energy defined by
| (13) |
Therefore, when (or ), () and stars are pulsationally unstable (stable, respectively).
In unstable models, the pulsation amplitude grows up to the non-linear regime in . Then, the pulsation energy becomes large enough for the surface materials to escape from the star (Appenzeller, 1970a, b; Yadav et al., 2018). Following Baraffe et al. (2001), the mass-loss rate is estimated by assuming that all the pulsation energy is used to lift the surface materials against gravity as:
| (14) |
where is the escape velocity. When we calculate the pulsation energy in Eq. (13), the radial displacement is obtained by extrapolating the solution of the perturbation equations into the non-linear regime. When the mass loss sets in, the oscillation speed at the surface is equal to the sound velocity there (), so that the displacement at the surface is determined from .
From Eqs. (13) and (14), we can discuss how the pulsation energy and mass-loss rate depend on the stellar parameters. First, from Eq. (13), the pulsation energy can be represented as
| (15) |
where we used , , and the non-dimensional form of the radial displacement defined by . While the integral part changes with the stellar structure (e.g., if a star has an extended envelope or not), the integral part hardly depends on the stellar mass. Therefore, the pulsation energy is found to be proportional to the stellar mass. Next, from Eqs. (14) and (15), the mass-loss rate can be represented as
| (16) |
where we used , as the luminosity is close to the Eddington limit. Since is found to vary with the stellar mass, effective temperature, and metallicity (see Figures 3 and 4 below), the mass-loss rate can be described as a function of , , and .
2.3 Evolution calculation with pulsation-driven mass loss
To examine how the pulsational instability affects the evolutionary tracks as well as the final stellar mass, stellar evolution is calculated by considering feedback due to pulsation-driven mass loss. For each metallicity, we adopt the mass-loss rate obtained from the stability analysis (see more details in Section 3.1). Pulsation-driven mass loss is implemented by turning on the use_other_wind control option and by adding customized subroutines to the MESA code. Other than the mass loss prescription, we set the same model parameters as described in Section 2.1. The input files (inlists) and source files to reproduce our results are provided at http://cococubed.asu.edu/mesa_market/inlists.html.
With mass loss, the stellar evolution calculations are conducted until helium depletion for 11 models; namely, all the five models with and the models of and with , and . Due to the issues of numerical convergence, for the four models of , and , the simulations are terminated just before hydrogen depletion. For the remaining 8 cases, the evolutionary tracks are calculated until the beginning of helium depletion. In summary, the simulation results are shown for the above 23 stellar models in Section 3.2 (note that the model does not reach the hydrogen exhaustion stage due to numerical issues).
3 Results
We here show the results of the stellar evolution calculations and linear stability analysis for massive star models. In Section 3.1, we first construct stellar models without taking into account mass loss and estimate the mass-loss rate driven by stellar pulsation. As shown below, the mass-loss rate depends on the stellar mass and surface temperature. In Section 3.2, we show the results of stellar evolution models taking into account pulsation-driven mass loss.
3.1 Stellar models and instability
|
|
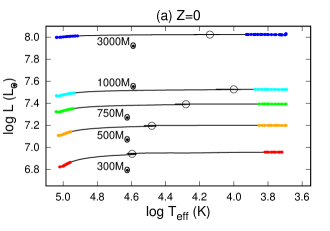
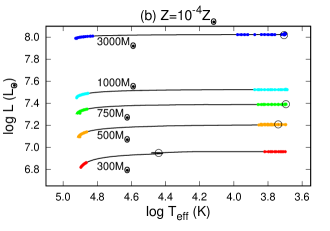
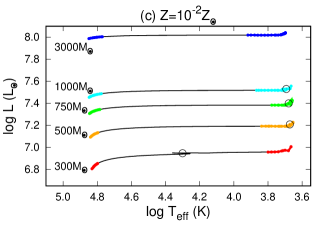
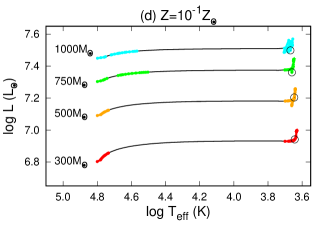
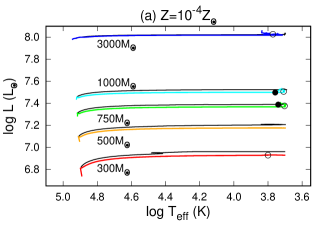
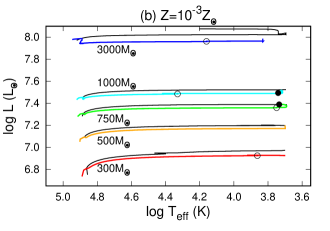
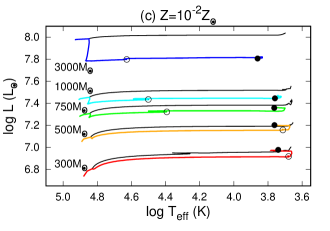
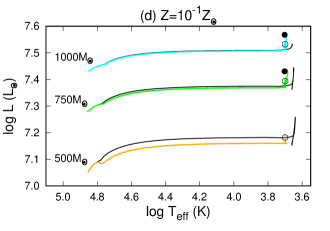
In Figure 1, we show the evolutionary tracks of stellar models with different metallicities, (a) , (b) , (c) , and (d) , in the Herzsprung-Russell (HR) diagram. Each panel presents the cases with different stellar masses at , the values of which are denoted by the numbers in the figure. Open circles represent the epochs of hydrogen depletion in the stellar core. For each case, colored points show the stellar models that are unstable against the radial linear perturbation and the consecutive unstable models are connected with the bold lines.
All the stellar models begin to evolve from the leftmost side of the HR diagram in their ZAMS stages. For each metallicity case, we find the mass-luminosity and mass-radius relations to be and , respectively. Therefore, the surface temperature is almost independent of the stellar mass, , and distributes in the range of (see Figure 1). On the other hand, for a fixed stellar mass, lower-metallicity models are found to show higher surface temperatures and are more compact. This is because, with smaller amount of carbon, metal-poor stars should keep the core temperature higher to gain sufficient nuclear energy via CN cycle and support the entire stellar structure. In the ZAMS phase, all the models are pulsationally unstable owing to the nuclear energy generation in the cores (the so-called mechanism).
As hydrogen is consumed in the core, the stellar envelope expands with the surface temperature decreasing monotonically (see Figure 1). All the models are stabilized before hydrogen core depletion. However, when those stars evolve into RSG (), they become unstable again. The instability in the RSG phase is due to the blocking of radiative flux at the ionization layers of atoms (the so-called mechanism; see more details below).
|
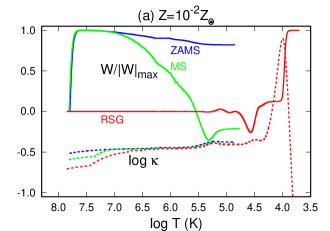
In Figure 2, we present the radial distribution of the work integral normalized by the maximum value (solid), and opacity (dashed) as a function of temperature for the models with (panel a) and (panel b). Different curves correspond to the cases of the ZAMS (blue), MS (green), and RSG (red) phase, respectively. Note that the results with are quantitatively similar to those with , and thus are not shown. A positive (negative) value of at the surface indicates that the stellar model is unstable (stable) against linear perturbations.
In both the ZAMS and MS models (blue and green curves), the work integral increases in the core region where the instability is excited by nuclear burning. In the MS models, the work integral drops to a negative value at the outermost layers of , because the pulsation energy excited in the core damps via radiative diffusion in the envelope where the opacity varies smoothly (e.g., Schwarzschild & Härm, 1959; Baraffe et al., 2001). In the higher-metallicity case (; panel b), the -mechanism caused by the opacity bump at due to the bound-bound transitions of iron elements contributes to the excitation of stellar pulsation. However, it turns out that the two MS models become stable because of pulsation damping by radiative diffusion at the outer-most layers.
The RSG models (red curves) with have bloated envelopes, where the opacity changes remarkably in the ionization layers of hydrogen at , and thus pulsation is excited owing to the absorption of radiative flux by hydrogen bound-free transition. We note that in the pulsation-driving zone, the radial profiles of opacity and work integral are almost identical among all the cases with different metallicities. This implies that the strength of pulsations in the RSG hardly depends on the stellar metallicity (see the discussion below).
 |
 |
 |
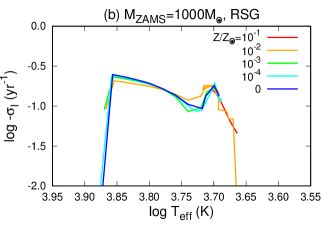 |
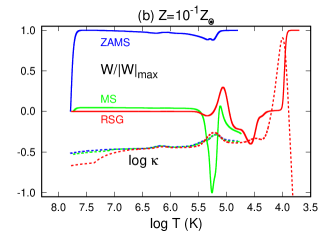
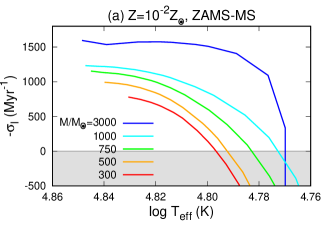
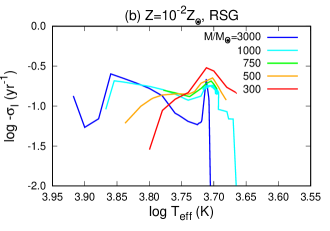
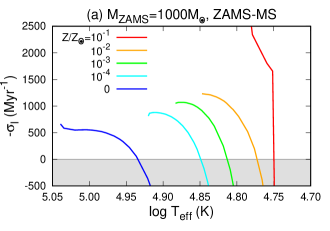
Figure 3 shows the growth rate of instability () as a function of the surface temperature, in the MS (panel a) and RSG (panel b) phase for different stellar masses of with . Note that stars are pulsationally stable in the grey-shaded regions (). All the models are unstable in the early MS phase, and are finally stabilized as they evolve off the ZAMS phase. This is because stellar pulsation excited by the -mechanism in the core is damped by radiative diffusion in the envelope, as discussed in Figure 2. In the early MS phase (panel a), the growth time of instability is as short as yr, so that stellar pulsation grows into a non-linear regime within the stellar lifetime of Myr. The growth rate increases for more massive stars because from Eq. (12). In the RSG phase (panel b), stars are destabilized by the -mechanism operating in the ionization zones of hydrogen, as seen in Figure 2. The characteristic growth rate in the RSG phase is as high as , which is two orders of magnitude higher than those in the MS phase. This fact indicates that the instability grows rapidly in the RSG phase and leads to vigorous mass ejection even in such a short stage.
Figure 4 presents the metallicity dependence of the growth rate for the models. In all the metallicity cases, the overall evolutionary behavior of the growth rate is qualitatively similar to those seen in Figure 3. In the MS phase (panel a), the growth rate decreases with lower metallicities. The primary reason is that metal-poor stars have smaller radii (for a fixed mass) and the growth rate follows . In addition, the growth rate in the MS stage is proportional to , which is smaller at higher temperature cores of metal-poor stars (see Fig. 18.8 in Kippenhahn et al., 2012). In contrast, the growth rate in the RSG phase (panel b) is almost independent of metallicity, reflecting the fact that the radial structures of work integral and opacity are quite similar among stellar models with different metallicities.
 |
 |
| 0 | 1.6 | 4.03 | 5.04 | 4 | 4.92 | |
| 1.4 | 3.65 | 150 | 4.93 | 2 | 4.85 | |
| 1.4 | 3.55 | 200 | 4.89 | 2 | 4.82 | |
| 1.65 | 3.4 | 200 | 4.85 | 2 | 4.78 | |
| 0.0 | 3.5 | 300 | 4.82 | 2 | 4.72 |
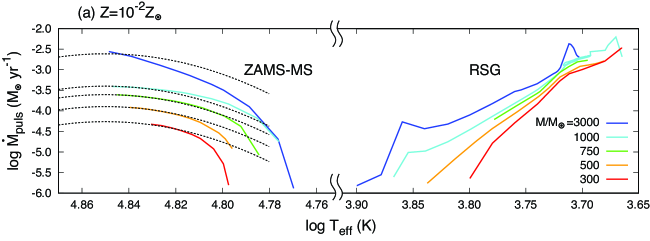
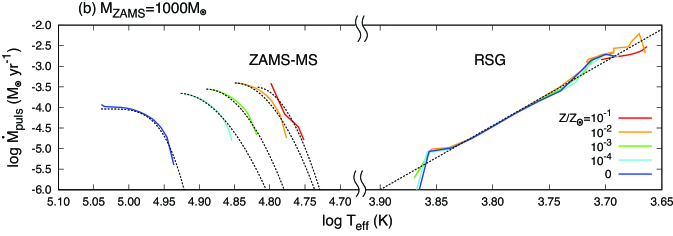
In Figure 5, we show the pulsation-driven mass-loss rate as a function of the surface temperature for the same models with Figures 3 (panel a) and 4 (panel b). In the MS stage, the mass-loss rate becomes the highest and decreases monotonically as the star evolves decreasing its surface temperature. This reflects the behavior of in Figures 3 and 4 (see also Eq. 16). The mass-loss rate becomes higher with increasing metallicity and stellar mass, as expected from the dependence of and on these parameters. For each metallicity case, the mass-loss rate can be fitted as a function of the stellar mass and effective temperature:
| (17) |
for . The coefficients, , , , , and , and are presented in Table 1. Note that the metallicity dependence of and can also be fitted as: and in the metallicity range of .
In the RSG phase, the mass-loss rate increases monotonically as the envelope expands and the surface temperature decreases, and reaches in the later phase. While the mass-loss rate becomes higher for more massive models (panel a), it is almost independent of the metallicity (panel b). Namely, the mass-loss rate can be approximated as
| (18) |
Note that the fitting formula is valid at (and ) for (and , respectively).
From the mass-loss formulae derived above, we can estimate how much fraction of the initial mass is lost during the evolution. For example, in the case of , by assuming that the mass loss in the MS stage at continues over the entire MS life of Myr and that the mass loss in the RSG stage at lasts over the remaining life of 0.1 Myr, the fraction of mass lost can be estimated as , which is in the order of 30-100% for . Therefore, to reveal the final mass of massive stars, the feedback from pulsation-driven mass loss should be considered in the evolution calculations.
3.2 Pulsation-driven mass loss throughout the evolution
|
|
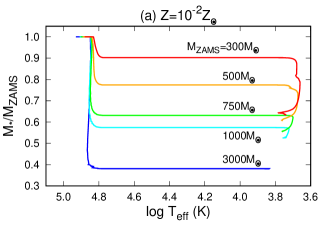
Next, we calculate the stellar evolution models including pulsation-driven mass loss. The mass-loss rate is given by the fitting formulae shown in Eqs. (17) and (18). In Figure 6, we show the evolutionary tracks of stellar models with pulsation-driven mass loss for different metallicities, (a) , (b) , (c) , and (d) . For comparison, the cases without mass loss are overlaid in the HR diagram (black curves). Open and filled circles indicate the epochs of hydrogen and helium depletion in the core, respectively.
In the early MS phase, all the stellar models reduce their masses by pulsation-driven winds, lowering their luminosities. Due to the mass-loss process, stars keep their surface temperature higher and remain unstable for a longer time, compared to the models without mass loss. During the expansion phase (i.e., in the Hertzsprung gap), the stabilized stars evolve as less massive stars with lower luminosities. In the RSG phase, the pulsation-driven wind sets in by the -mechanism and the mass-loss rate increases as the surface temperature decreases. Once the surface temperature reaches , the mass loss becomes so strong that stars show blueward evolution to and the mass-loss rate is self-regulated at .
|
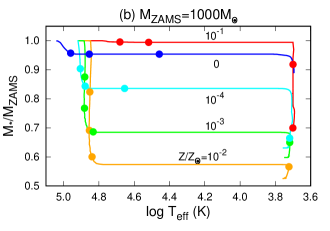
In Figure 7, we show the evolution of the stellar mass normalized by the ZAMS mass as a function of the surface temperature for the models of with various stellar masses (panel a) and those of with various metallicities (panel b). In panel (b), evolutionary epochs in every 0.5 Myr starting from the ZAMS stage are shown on each track with filled circles. We note that in Figure 7, the evolution is followed until helium core depletion for all the models except the case, where the simulation is terminated at 1.8 Myr.
In the models (panel a), during the MS, since the mass-loss rate increases with the stellar mass (Figure 5), more massive stars maintain a smaller fraction of the initial mass at the end of the MS. On the other hand, their RSG stages last longer for lower masses and thus a larger fraction of the stellar mass is lost. In total, of the initial mass is lost by helium exhaustion in the models. Even for the most massive case, a remnant BH as massive as can be left.
In the models (panel b), the low metallicity stars with lose a larger fraction of the mass with increasing metallicity (% for ) and reside in the instability region for Myr, which is extended due to the mass loss from Myr in the cases without mass loss. Their residual lifetime is not so long that the fraction of the mass lost in the RSG stage is subdominant or at most comparable to that in the MS stage. On the other hand, the highest metallicity star () begins its evolution with the lowest surface temperature in the ZAMS stage and leaves the instability region of the MS stage significantly earlier ( Myr) with negligible mass loss. In the RSG stage, the star becomes unstable and loses % of the mass in the last Myr of the lifetime. In summary, for all the metallicities, % of the ZAMS mass is left by the time of helium exhaustion, and thus the remnant BH is expected to be as massive as .
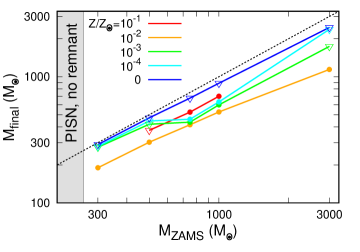
In Figure 8, we summarize the relation between the final and ZAMS mass for all the models where pulsation-driven mass-loss rate is taken into account self-consistently. For the models where their simulations are followed until (or terminated before) helium core depletion, the results are shown by the filled circles (or open triangles, respectively). When the ZAMS mass is less massive than (grey-shaded region), no remnants are left because of pair-instability supernovae (PISN) (Woosley et al., 2002; Woosley, 2017). We find that pulsation-driven mass loss becomes the strongest in the cases of (orange). In all the metallicity cases, the final stellar mass can be more massive than for the stars with the ZAMS mass .
|
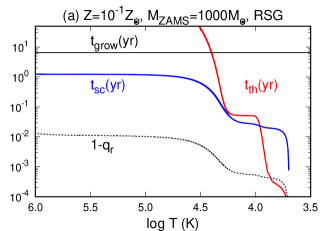
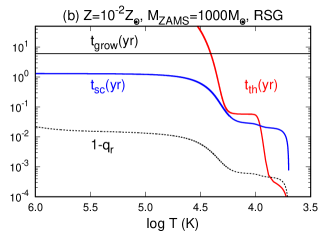
It is worth studying how quickly the structure of a pulsating star settles down to a dynamically and thermally relaxed configuration. In Figure 9, we show the radial profiles of the thermal timescale (), sound crossing time (), and the fraction of the stellar mass contained outside a radius , , as a function of temperature. Here, those two timescales are defined as
| (19) |
and
| (20) |
For the RSG models, the mass injected into pulsation-driven winds in each eruption event ( yrs) is as high as , which is contained in the outer-most layer () but above the instability-driving layer (; see also Figure 2). Since both the thermal (red) and sound-crossing (blue) timescales in the layer are much shorter than the instability growth timescale (black solid; yr), a new equilibrium state can be established before the subsequent mass eruption occurs.
4 Summary and Discussion
Very massive stars with formed via runaway collisions in dense star clusters have attracted attention as possible progenitors of massive seeds for high- SMBHs. However, whether or not the massive merger products can keep their masses within their stellar lifetime without significant mass loss is poorly understood. Here, we study the pulsational stability of very massive stars with a wide range of the ZAMS mass at and stellar metallicity , which are relevant to the stellar runway merger scenario. Conducting the stability analysis to stellar structure models obtained with the MESA code, we estimate the masses of merger remnants left at the centers of dense clusters. Our findings are summarized below:
-
•
All the stellar ZAMS models are pulsationally unstable, owing to the -mechanism driven by nuclear burning in the cores (Figures 1 and 2). As the stars evolve off the ZAMS, they are stabilized because of radiative damping in the envelope. The pulsational instability grows in , which is significantly shorter than the lifetime of massive stars (Figures 3 and 4). The mass-loss rate is estimated in the range of (Figure 5, Eq. 17, and Table 1). Both the growth rate and mass-loss rate increase with stellar mass and metallicity.
-
•
In the RSG stages, all the stellar models are destabilized again, owing to the -mechanism driven in the ionization zones of hydrogen (Figures 1 and 2). The instability grows in a much shorter timescale of compared to that in the MS phase (Figures 3 and 4). The mass-loss rate in the RSG phase rises to as the surface temperature is lowered (Figure 5). For a fixed stellar mass, both the growth rate and mass-loss rate are almost independent of the metallicity. The mass-loss rate is well approximated by Eq. (18).
-
•
Adopting the mass-loss rate obtained from the linear stability analysis, we recalculate the stellar structure evolution (Figure 6). For the models with and various metallicities, the total amount of mass loss becomes the largest in the case of (Figures 7 and 8). Even in this case, the final mass is more than 50% of the initial ZAMS mass, and thus the remnant BH is expected to be as massive as . For the models with and different initial masses, the total amount of mass loss increases with the stellar mass. While the most massive case of loses 60% of the ZAMS mass, the remnant BH can still be as massive as .
Here, we discuss how pulsation-driven mass loss affects the evolution of massive stars via runaway stellar mergers in dense star clusters. Although star cluster formation in the early universe is still very uncertain, previous authors presumed very metal-poor environments of as the cluster formation sites (Omukai et al., 2008; Devecchi & Volonteri, 2009; Katz et al., 2015; Sakurai et al., 2017). A series of -body simulations by Sakurai et al. (2017) show that in a cluster of formed in a young protogalaxy, frequent stellar collisions with an interval of lead to growth of the most massive object at the center at a rate of
| (21) |
where is the cluster mass, and is the time from the cluster formation (see also Portegies Zwart & McMillan, 2002). While the stellar envelope of the merger product would be bloated like the structure of a RSG, the star contracts quickly to a thermally-relaxed MS structure in a Kelvin-Helmholtz time of yrs and turns pulsationally unstable in yrs. Therefore, our stability analyses against thermally-relaxed stellar structures are justified, even in the runaway stellar-merger scenario.
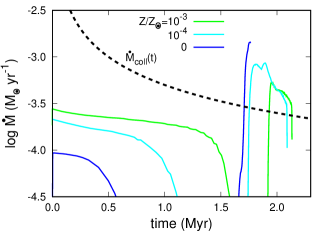
In Figure 10, we show the mass-loss rates due to stellar pulsation (solid lines) for the models with (blue), (light blue), and (green), respectively. As a reference, the mass-gain rate (Eq. 21; dashed line) is also overlaid. In the MS phase ( Myr), the mass-gain rate exceeds the mass-loss rate for all the metallicity cases. During this period, the central star grows up to (Sakurai et al., 2017), according to Eq. (21). In the late RSG phase ( Myr), however, the star begins to lose mass via stellar pulsation significantly, overcoming the accretion rate via stellar mergers. Our stability analysis suggests that a RSG star with becomes unstable and lose of its mass in the cases of (Figure 7a). Therefore, we conclude that the star can leave behind a remnant BH as massive as , which would grow to an SMBH with via the Eddington-limited accretion within a Hubble timescale at . Note that to estimate the final remnant mass more quantitatively, the evolution of merging stars should be calculated self-consistently by taking account of the mass loss associated with stellar mergers (Glebbeek et al., 2009).
The mass-loss rate estimated from Eq. (14) is based on the linear stability analysis, while mass loss occurs after the perturbation grows to a non-linear regime, where strong shock waves would make the stellar surface structure deviate from the unperturbed structure significantly. Non-linear hydrodynamical simulations of stellar pulsation are required to derive a reliable mass-loss prescription (e.g., Yadav et al., 2018). Moreover, the estimate of mass-loss rates with Eq. (14) was proposed by Appenzeller (1970a, b) for massive stars with and . To explore the mass-loss prescription for lower-metallicity stars is left for future investigations.
Our stability analysis has been carried out by adopting the frozen-in approximation where the interaction between pulsation and convective motions is neglected. This approximation becomes invalid in the MS cores where nuclear burning is activated and in the deep convective envelopes of RSGs with . Shiode et al. (2012) found that pulsation damping in convective zones overcomes the excitation by the -mechanism, while it is not so strong as to suppress unstable pulsation. However, those results depend on uncertain model parameters to treat time-dependent convective energy transport (e.g., Houdek & Dupret, 2015). Since convective motions are intrinsically multi-dimensional, its effect should be studied in more detail by multidimensional radiation hydrodynamical calculations, such as performed in the asymptotic giant branch stars (e.g., Freytag et al., 2017).
So far, we have focused on the effect of pulsation-driven mass loss on the stellar evolution. For metal-enriched massive stars, the acceleration of winds by the line force due to bound-bound absorption may not be neglected (e.g., Castor et al., 1975; Bowen, 1988). For a MS star with , the line-driven mass-loss rate is theoretically derived by Vink et al. (2001). The mass-loss rate has the maximum value of at . Even if the star suffers from the wind over the entire MS lifetime, the fraction of the ejected mass is less than of the original ZAMS mass. For a RSG star with , while the driving mechanism is still highly uncertain, the mass-loss formula is empirically obtained by Nieuwenhuijzen & de Jager (1990). The rate increases to as the surface temperature drops to . If the stellar mass is continuously lost over the entire RSG stage with a shorter duration of Myr, the fraction of the ejected mass is . Therefore, for lower metallicity cases , pulsation-driven mass loss would be a dominant process to determine the final mass of a massive merger product.
acknowledgments
The authors wish to express their cordial thanks to Profs. Hideyuki Saio, Zoltan Haiman, and Takashi Yoshida for their constructive suggestions and comments. We also thank Ryosuke Hirai and Hiroto Mitani for the instruction of the MESA code. Numerical calculations are carried out with the computer cluster, Draco, supported by the Frontier Research Institute for Interdisciplinary Sciences in Tohoku University, and with High-performance Computing Platform of Peking University. This work is supported in part by MEXT/JSPS KAKENHI grants (17H01102, 17H02869, 17H06360: KO), the National Science Foundation of China (11721303, 11991052, 11950410493; KI), and the National Key R&D Program of China (2016YFA0400702; KI).
References
- Agarwal et al. (2012) Agarwal, B., Khochfar, S., Johnson, J. L., et al. 2012, MNRAS, 425, 2854, doi: 10.1111/j.1365-2966.2012.21651.x
- Alister Seguel et al. (2020) Alister Seguel, P. J., Schleicher, D. R. G., Boekholt, T. C. N., Fellhauer, M., & Klessen, R. S. 2020, MNRAS, 493, 2352, doi: 10.1093/mnras/staa456
- Alvarez et al. (2009) Alvarez, M. A., Wise, J. H., & Abel, T. 2009, ApJ, 701, L133, doi: 10.1088/0004-637X/701/2/L133
- Appenzeller (1970a) Appenzeller, I. 1970a, A&A, 5, 355
- Appenzeller (1970b) —. 1970b, A&A, 9, 216
- Bañados et al. (2018) Bañados, E., Venemans, B. P., Mazzucchelli, C., et al. 2018, Nature, 553, 473, doi: 10.1038/nature25180
- Baraffe et al. (2001) Baraffe, I., Heger, A., & Woosley, S. E. 2001, ApJ, 550, 890, doi: 10.1086/319808
- Becerra et al. (2015) Becerra, F., Greif, T. H., Springel, V., & Hernquist, L. E. 2015, MNRAS, 446, 2380, doi: 10.1093/mnras/stu2284
- Boekholt et al. (2018) Boekholt, T. C. N., Schleicher, D. R. G., Fellhauer, M., et al. 2018, MNRAS, 476, 366, doi: 10.1093/mnras/sty208
- Bowen (1988) Bowen, G. H. 1988, ApJ, 329, 299, doi: 10.1086/166378
- Bromm & Loeb (2003) Bromm, V., & Loeb, A. 2003, ApJ, 596, 34, doi: 10.1086/377529
- Castor et al. (1975) Castor, J. I., Abbott, D. C., & Klein, R. I. 1975, ApJ, 195, 157, doi: 10.1086/153315
- Chon & Omukai (2020) Chon, S., & Omukai, K. 2020, MNRAS, 494, 2851, doi: 10.1093/mnras/staa863
- Devecchi & Volonteri (2009) Devecchi, B., & Volonteri, M. 2009, ApJ, 694, 302, doi: 10.1088/0004-637X/694/1/302
- Fan (2006) Fan, X. 2006, NewAR, 50, 665, doi: 10.1016/j.newar.2006.06.077
- Freytag et al. (2017) Freytag, B., Liljegren, S., & Höfner, S. 2017, A&A, 600, A137, doi: 10.1051/0004-6361/201629594
- Glebbeek et al. (2009) Glebbeek, E., Gaburov, E., de Mink, S. E., Pols, O. R., & Portegies Zwart, S. F. 2009, A&A, 497, 255, doi: 10.1051/0004-6361/200810425
- Haemmerlé et al. (2018) Haemmerlé, L., Woods, T. E., Klessen, R. S., Heger, A., & Whalen, D. J. 2018, MNRAS, 474, 2757, doi: 10.1093/mnras/stx2919
- Heger et al. (1997) Heger, A., Jeannin, L., Langer, N., & Baraffe, I. 1997, A&A, 327, 224. https://arxiv.org/abs/astro-ph/9705097
- Hirano et al. (2014) Hirano, S., Hosokawa, T., Yoshida, N., et al. 2014, ApJ, 781, 60, doi: 10.1088/0004-637X/781/2/60
- Hosokawa et al. (2016) Hosokawa, T., Hirano, S., Kuiper, R., et al. 2016, ApJ, 824, 119, doi: 10.3847/0004-637X/824/2/119
- Hosokawa et al. (2011) Hosokawa, T., Omukai, K., Yoshida, N., & Yorke, H. W. 2011, Science, 334, 1250, doi: 10.1126/science.1207433
- Hosokawa et al. (2013) Hosokawa, T., Yorke, H. W., Inayoshi, K., Omukai, K., & Yoshida, N. 2013, ApJ, 778, 178, doi: 10.1088/0004-637X/778/2/178
- Houdek & Dupret (2015) Houdek, G., & Dupret, M.-A. 2015, Living Reviews in Solar Physics, 12, 8, doi: 10.1007/lrsp-2015-8
- Inayoshi & Haiman (2014) Inayoshi, K., & Haiman, Z. 2014, MNRAS, 445, 1549, doi: 10.1093/mnras/stu1870
- Inayoshi et al. (2013) Inayoshi, K., Hosokawa, T., & Omukai, K. 2013, MNRAS, 431, 3036, doi: 10.1093/mnras/stt362
- Inayoshi & Omukai (2012) Inayoshi, K., & Omukai, K. 2012, MNRAS, 422, 2539, doi: 10.1111/j.1365-2966.2012.20812.x
- Inayoshi et al. (2014) Inayoshi, K., Omukai, K., & Tasker, E. 2014, MNRAS, 445, L109, doi: 10.1093/mnrasl/slu151
- Inayoshi et al. (2019) Inayoshi, K., Visbal, E., & Haiman, Z. 2019, arXiv e-prints, arXiv:1911.05791. https://arxiv.org/abs/1911.05791
- Katz et al. (2015) Katz, H., Sijacki, D., & Haehnelt, M. G. 2015, MNRAS, 451, 2352, doi: 10.1093/mnras/stv1048
- Kippenhahn et al. (2012) Kippenhahn, R., Weigert, A., & Weiss, A. 2012, Stellar Structure and Evolution, doi: 10.1007/978-3-642-30304-3
- Langer et al. (1983) Langer, N., Fricke, K. J., & Sugimoto, D. 1983, A&A, 126, 207
- Matsuoka et al. (2018) Matsuoka, Y., Onoue, M., Kashikawa, N., et al. 2018, PASJ, 70, S35, doi: 10.1093/pasj/psx046
- Milosavljević et al. (2009) Milosavljević, M., Bromm, V., Couch, S. M., & Oh, S. P. 2009, ApJ, 698, 766, doi: 10.1088/0004-637X/698/1/766
- Montero et al. (2012) Montero, P. J., Janka, H.-T., & Müller, E. 2012, ApJ, 749, 37, doi: 10.1088/0004-637X/749/1/37
- Moriya & Langer (2015) Moriya, T. J., & Langer, N. 2015, A&A, 573, A18, doi: 10.1051/0004-6361/201424957
- Mortlock et al. (2011) Mortlock, D. J., Warren, S. J., Venemans, B. P., et al. 2011, Nature, 474, 616, doi: 10.1038/nature10159
- Nakauchi et al. (2017) Nakauchi, D., Hosokawa, T., Omukai, K., Saio, H., & Nomoto, K. 2017, MNRAS, 465, 5016, doi: 10.1093/mnras/stw3114
- Nieuwenhuijzen & de Jager (1990) Nieuwenhuijzen, H., & de Jager, C. 1990, A&A, 231, 134
- Oh & Haiman (2002) Oh, S. P., & Haiman, Z. 2002, ApJ, 569, 558, doi: 10.1086/339393
- Omukai (2001) Omukai, K. 2001, ApJ, 546, 635, doi: 10.1086/318296
- Omukai et al. (2008) Omukai, K., Schneider, R., & Haiman, Z. 2008, ApJ, 686, 801, doi: 10.1086/591636
- Onoue et al. (2019) Onoue, M., Kashikawa, N., Matsuoka, Y., et al. 2019, ApJ, 880, 77, doi: 10.3847/1538-4357/ab29e9
- Paxton et al. (2011) Paxton, B., Bildsten, L., Dotter, A., et al. 2011, ApJS, 192, 3, doi: 10.1088/0067-0049/192/1/3
- Paxton et al. (2013) Paxton, B., Cantiello, M., Arras, P., et al. 2013, ApJS, 208, 4, doi: 10.1088/0067-0049/208/1/4
- Paxton et al. (2015) Paxton, B., Marchant, P., Schwab, J., et al. 2015, ApJS, 220, 15, doi: 10.1088/0067-0049/220/1/15
- Paxton et al. (2018) Paxton, B., Schwab, J., Bauer, E. B., et al. 2018, ApJS, 234, 34, doi: 10.3847/1538-4365/aaa5a8
- Paxton et al. (2019) Paxton, B., Smolec, R., Schwab, J., et al. 2019, ApJS, 243, 10, doi: 10.3847/1538-4365/ab2241
- Portegies Zwart & McMillan (2002) Portegies Zwart, S. F., & McMillan, S. L. W. 2002, ApJ, 576, 899, doi: 10.1086/341798
- Regan et al. (2014) Regan, J. A., Johansson, P. H., & Wise, J. H. 2014, ApJ, 795, 137, doi: 10.1088/0004-637X/795/2/137
- Reinoso et al. (2018) Reinoso, B., Schleicher, D. R. G., Fellhauer, M., Klessen, R. S., & Boekholt, T. C. N. 2018, A&A, 614, A14, doi: 10.1051/0004-6361/201732224
- Sakurai et al. (2017) Sakurai, Y., Yoshida, N., Fujii, M. S., & Hirano, S. 2017, MNRAS, 472, 1677, doi: 10.1093/mnras/stx2044
- Satō (1966) Satō, H. 1966, Progress of Theoretical Physics, 35, 241, doi: 10.1143/PTP.35.241
- Schleicher et al. (2013) Schleicher, D. R. G., Palla, F., Ferrara, A., Galli, D., & Latif, M. 2013, A&A, 558, A59, doi: 10.1051/0004-6361/201321949
- Schleicher et al. (2010) Schleicher, D. R. G., Spaans, M., & Glover, S. C. O. 2010, ApJ, 712, L69, doi: 10.1088/2041-8205/712/1/L69
- Schwarzschild & Härm (1959) Schwarzschild, M., & Härm, R. 1959, ApJ, 129, 637, doi: 10.1086/146662
- Shang et al. (2010) Shang, C., Bryan, G. L., & Haiman, Z. 2010, MNRAS, 402, 1249, doi: 10.1111/j.1365-2966.2009.15960.x
- Shapiro & Teukolsky (1983) Shapiro, S. L., & Teukolsky, S. A. 1983, Black holes, white dwarfs, and neutron stars : the physics of compact objects
- Shibata & Shapiro (2002) Shibata, M., & Shapiro, S. L. 2002, ApJ, 572, L39, doi: 10.1086/341516
- Shiode et al. (2012) Shiode, J. H., Quataert, E., & Arras, P. 2012, MNRAS, 423, 3397, doi: 10.1111/j.1365-2966.2012.21130.x
- Sonoi & Umeda (2012) Sonoi, T., & Umeda, H. 2012, MNRAS, 421, L34, doi: 10.1111/j.1745-3933.2011.01201.x
- Stacy et al. (2016) Stacy, A., Bromm, V., & Lee, A. T. 2016, MNRAS, 462, 1307, doi: 10.1093/mnras/stw1728
- Stacy et al. (2012) Stacy, A., Greif, T. H., & Bromm, V. 2012, MNRAS, 422, 290, doi: 10.1111/j.1365-2966.2012.20605.x
- Sugimura et al. (2014) Sugimura, K., Omukai, K., & Inoue, A. K. 2014, MNRAS, 445, 544, doi: 10.1093/mnras/stu1778
- Susa et al. (2014) Susa, H., Hasegawa, K., & Tominaga, N. 2014, ApJ, 792, 32, doi: 10.1088/0004-637X/792/1/32
- Tagawa et al. (2020) Tagawa, H., Haiman, Z., & Kocsis, B. 2020, ApJ, 892, 36, doi: 10.3847/1538-4357/ab7922
- Uchida et al. (2017) Uchida, H., Shibata, M., Yoshida, T., Sekiguchi, Y., & Umeda, H. 2017, PhRvD, 96, 083016, doi: 10.1103/PhysRevD.96.083016
- Umeda et al. (2016) Umeda, H., Hosokawa, T., Omukai, K., & Yoshida, N. 2016, ApJ, 830, L34, doi: 10.3847/2041-8205/830/2/L34
- Unno et al. (1989) Unno, W., Osaki, Y., Ando, H., Saio, H., & Shibahashi, H. 1989, Nonradial oscillations of stars
- Venemans et al. (2013) Venemans, B. P., Findlay, J. R., Sutherland, W. J., et al. 2013, ApJ, 779, 24, doi: 10.1088/0004-637X/779/1/24
- Vink et al. (2001) Vink, J. S., de Koter, A., & Lamers, H. J. G. L. M. 2001, A&A, 369, 574, doi: 10.1051/0004-6361:20010127
- Volonteri (2012) Volonteri, M. 2012, Science, 337, 544, doi: 10.1126/science.1220843
- Wolcott-Green & Haiman (2011) Wolcott-Green, J., & Haiman, Z. 2011, MNRAS, 412, 2603, doi: 10.1111/j.1365-2966.2010.18080.x
- Woosley (2017) Woosley, S. E. 2017, ApJ, 836, 244, doi: 10.3847/1538-4357/836/2/244
- Woosley et al. (2002) Woosley, S. E., Heger, A., & Weaver, T. A. 2002, Reviews of Modern Physics, 74, 1015, doi: 10.1103/RevModPhys.74.1015
- Wu et al. (2015) Wu, X.-B., Wang, F., Fan, X., et al. 2015, Nature, 518, 512, doi: 10.1038/nature14241
- Yadav et al. (2018) Yadav, A. P., Kühnrich Biavatti, S. H., & Glatzel, W. 2018, MNRAS, 475, 4881, doi: 10.1093/mnras/sty092
- Yajima & Khochfar (2016) Yajima, H., & Khochfar, S. 2016, MNRAS, 457, 2423, doi: 10.1093/mnras/stw058