Power and Performance Analysis of Persistent Key-Value Stores
Abstract
With the current rate of data growth, processing needs are becoming difficult to fulfill due to CPU power and energy limitations. Data serving systems and especially persistent key-value stores have become a substantial part of data processing stacks in the data center, providing access to massive amounts of data for applications and services. Key-value stores exhibit high CPU and I/O overheads because of their constant need to reorganize data on the devices.
In this paper, we examine the efficiency of two key-value stores on four servers of different generations and with different CPU architectures. We use RocksDB, a key-value that is deployed widely, e.g. in Facebook, and Kreon, a research key-value store that has been designed to reduce CPU overhead. We evaluate their behavior and overheads on an ARM-based microserver and three different generations of x86 servers. Our findings show that microservers have better power efficiency in the range of 0.68-3.6x with a comparable tail latency.
Index Terms:
data center, energy efficiency, microservers, key-value storesI Introduction
Projections for data growth show that data doubles roughly every two years [24] leading to high demand for more processing capacity to serve and process the data. Given current technology limitations for power and energy [13, 15], the increasing demand for CPU cycles can only be satisfied by increasing the processing density within existing power and energy budgets. A potential approach is to execute certain classes of applications on microservers rather than high-end servers. Microservers include CPUs with different, lower-power designs, such as ARM processors, compared to typical data center servers that use higher-end Intel or AMD processors.
Previous research [19, 5, 6, 22, 16] has examined the benefits of running applications on microservers and in certain cases microservers have been deployed in production setups [14, 25]. These previous works use mobile, desktop, web server, database, and other workloads to examine performance and energy tradeoffs.
Persistent key-value (KV) stores are a main component of data analytics stacks and data access frameworks in general [9, 7, 3, 4, 14, 12, 10]. Typically, persistent KV stores are complex systems because they constantly re-organize data on storage devices to achieve high data rates for write, scan, and read operations. As such, each user-initiated operation in KV stores requires several thousands of CPU cycles in the common path [21]. Recently, new designs for KV stores have emerged that trade storage device efficiency for CPU efficiency, in an effort to increase data serving density [20, 14].
In this paper, we provide an extensive power/performance evaluation for persistent KV stores. This evaluation is important to calculate the energy budget required for specific performance needs. We use two KV stores: RocksDB [10], a persistent KV store from Facebook that is widely deployed in production setups. Furthermore, we use Kreon [21], a research key-value store that reduces CPU overhead and therefore CPU cycles for each KV operation. In order to provide a thorough analysis, we use four different, server-grade systems that span a broad range of processor architectures, memory hierarchy characteristics, and fabrication process technologies. We run the default workloads of YCSB [8] covering a wide range of cloud use-cases.
We evaluate power efficiency, absolute performance, and architectural characteristics that affect performance and tail latency. We use one ARM microserver and three different generations of data center x86 servers. These servers cover a wide range of fabrication processes technology, micro-architectural features, and amount of processing and memory resources. For performance experiments we carefully select KV store configuration setups to make our evaluation realistic. For power measurements we use a power monitor connected right after the power supply unit (PSU). For both performance and power measurements we perform a large number of experiments and we present the most relevant data. Finally, we also provide an analysis for how different server types contribute to the total cost of ownership in data centers when used for data serving. Our results show that microservers:
-
1.
Are 0.68-3.6x times more power efficient.
-
2.
Result in a 1.27-5.3x lower absolute performance where a major factor to performance is DRAM throughput.
-
3.
Do not have a big impact to tail latency.
-
4.
Have on average 1.1-2.7x lower energy cost.
-
5.
Are more cost-effective if they have a purchase price around 3x lower than high-end servers.
II Related Work
| CPU (all 64-bit) | # chips | Fabrication | ISA | # cores | # Threads | Clock | L1 | L2 KB | L3 | DRAM x DIMM | |
|---|---|---|---|---|---|---|---|---|---|---|---|
| technology | GHz | KB/core | KB/2core | MB/chip | GB | ||||||
| S1 | X-Gene 1 ARMv8 | 1 | 40 nm | ARM | 8 | 8 | 2.40 | 32 | 256 | 8 | 16x1=16 DDR3 |
| S2 | Xeon(R) E5520 | 2 | 44 nm | x86 | 8 | 16 | 2.27 | 32 | 256 | 8 | 2x6=12 DDR3 |
| S3 | Xeon(R) E5620 | 2 | 32 nm | x86 | 8 | 16 | 2.40 | 32 | 256 | 12 | 2x12=24 DDR3 |
| S4 | Xeon(R) E5-2630 v3 | 2 | 22 nm | x86 | 16 | 32 | 2.40 | 32 | 256 | 20 | 32x8=256 DDR4 |
Previous work has compared microservers and high-end servers in terms of performance and energy consumption. The authors in [11] show that current high-end Out-Of-Order processor micro-architectures are inefficient for running scale-out (cloud) workloads. They use performance counters to identify key micro-architectural needs for these workloads and sources of inefficiency. Also, authors in [6] revisit the RISC vs. CISC architecture using mobile, desktop, and server workloads. They find that RISC and CISC ISAs are irrelevant to power and performance characteristics of modern cores, whereas micro-architectural features have an important impact on them. In our work we use performance monitor counters with the difference that we want to identify micro-architectural features that affect the performance and power of KV stores. Moreover, we examine how micro-architectural features affect tail latency of KV stores.
Also, authors in [5] and [19] compare x86 and ARM architectures in terms of power efficiency for web server, database, and other workloads. They conclude that x86-based servers are more efficient for compute-intensive workloads and ARM-based servers are advantageous in computationally lightweight applications in terms of power efficiency. One major difference from our work is that we use KV stores and evaluate them on an ARM server (not mobile) and on x86 deployed servers. Another difference is that we show how micro-architectural features affect performance.
In [2], the authors show that low-power embedded nodes with flash storage can deliver over an order of magnitude more queries per joule for random read-intensive workloads using a custom KV store on a custom cluster. Also in [14] they use a custom KV store that runs to a customized compact server design based on ARM processors and they show that is reliable, highly scalable and cost-effective. In contrast, in our work we evaluate two persistent key-value stores, one from research (Kreon [21]) and one widely deployed in production (RocksDB [10]), on a range of commodity servers.
Authors in [16] show that x86 servers are more energy efficient in I/O-intensive workloads and ARM servers are more energy efficient for database query processing with slightly lower performance. They present a total cost of ownership (TCO) analysis and they find out that an ARM-based cluster has lower TCO except for I/O intensive workloads, where it incurs 50% higher TCO compared to an x86-based cluster. Furthermore, authors in [19] use a monthly cost model to analyze cost-efficiency of ARM and x86-based data centers. They conclude that from the perspective of cost-efficiency ARM-based data centers are advantageous for computationally lightweight applications. Our power- and performance-focused analysis can in principle be complemented with a similar TCO-focused analysis, to determine the most cost-efficient server selection for KV stores.
III Experimental Methodology
In this section we describe our experimental setups and how we perform our measurements.
III-A Server characteristics
In our work we use four different types of servers that span a broad range of processor architectures, memory hierarchy characteristics, and fabrication process technologies. Table I summarizes the characteristics of each server. Server S1 is an ARM-based server, whereas servers S2, S3, and S4 are x86 servers of different generations. All servers have similar clocks (2.27-2.4 GHz), similar size of L1 cache per core (32KB), and similar L2 cache size (256KB), shared in all cases by a pair of cores. L3 cache is shared by the whole chip and the normalized per-core size is similar. Servers S2, S3, and S4 have two NUMA nodes while S1 has a single NUMA node. The number of DIMMs and the total DRAM size differ in all cases, as shown in Table I. Finally, servers S1 and S2 use similar fabrication process technology (40-44 nm), S3 uses a 32 nm process, and S4 uses a 22 nm process.
We perform various point-to-point comparisons among these servers to identify characteristics that have an impact on system performance and power efficiency. To minimize the impact of the software stack, all servers run the same Linux kernel (version 4.4) with the same version of the GCC compiler (version 4.8) toolchain. Finally, all servers are equipped with the same type of NVMe storage device, a Samsung 950 PRO 256GB.
For calibration purposes we measure the memory throughput in each server using the STREAM [17] memory benchmark with an increasing thread count. Table II shows these results for the Triad scenario.
| #threads=1 | #threads=#cores | #threads=64 | |
|---|---|---|---|
| GB/s | GB/s | GB/s | |
| S1 | 7.7 | 8.6 | 8.5 |
| S2 | 9.0 | 21.5 | 21.2 |
| S3 | 9.4 | 23.9 | 23.5 |
| S4 | 14.2 | 68.9 | 60.6 |
III-B KV stores
RocksDB [10] is an LSM-based persistent key-value store that is widely used in production at Facebook. Is is optimized for fast storage but it can be also used for hard disk drives. It contains multiple levels of increasing size where keys are sorted within each level. Each level is divided in multiple units of fixed size named SSTable (SST) and each of them is stored in a separate file.
In RocksDB, the first level is stored in memory (named memtable) and when it becomes full it is flushed in first levels SSTs. In order to provide write amortization, in keep the ratio between 2 successive levels to be less that 10x. In the case where the ratio exceeds this value, a compaction is triggered. A compactions merges SSTs of level with SSTs if the next level (). RocksDB interacts with storage when it writes a memtable to the device, creating a new SST and during compactions. In both cases it uses read-write API to access files.
Kreon [21] is a persistent write-optimized key-value store designed for flash storage. The main design tradeoff is that it increases I/O randomness in order to reduce CPU overhead and I/O amplification. To achieve this, Kreon uses a write-optimized data structure and memory-mapped I/O.
Kreon uses a multi-level indexing data structure similar to the LSM-Tree [18], with levels of increasing size. This enables batched data transfers to lower levels to amortize insert costs. Kreon uses a per-level full index (B-tree) to enable partial data reorganization which reduces I/O amplification and CPU overhead. Furthermore, Kreon stores key-value pairs in an append-only log to avoid data movement during spill (merge) operations. The use of memory-mapped I/O further reduces CPU overheads related to the I/O cache in three ways: (a) It eliminates cache lookups for hits by using valid virtual memory mappings. Accesses to data that are not in memory result in page faults that are then handled by Linux kernel. (b) Read/write system calls require a data copy between user and kernel space for protection purposes. Memory-mapped I/O removes the need for data copies when performing I/O. (c) Memory-mapped I/O uses a single address space for both memory and storage, which eliminates the need for pointer translation between them. Therefore, this approach removes the need for serialization and deserialization when transferring data between memory and storage.
III-C Workloads
We run a C++ version of YCSB [23, 8] using the proposed workloads in the recommended sequence: Load the database, run workloads in order A, B, C, F, and D, clear the database, load the database again and run workload E. In all cases the key is about 30 bytes and the value is 1000 bytes. We use datasets that fit in main memory for all servers, since we are mainly interested in CPU efficiency.
For our analysis, we run two different experiments for both key-value stores. For Kreon the first experiment uses a single YCSB thread and a single Kreon table with a dataset of 3M records that fits in memory and does not cause I/O traffic (no snapshots) for all servers. We run this experiment to identify the performance and energy characteristics of the core’s architecture. In the second experiment for Kreon we run YCSB with multiple threads to identify server performance and power consumption under high utilization. In this case, the duration of each run for 3M records is short, which does not allow us to observe server performance under steady state. For this reason, and since servers have different main memory sizes, we use for each server a dataset proportional to its memory. We use 350K records per 1GB of DRAM i.e., 2.4M for S1, 4.2M for S2, 8.4M for S3, and 89.6M for S4. Finally, we use 64 YCSB threads and 32 Kreon tables in all cases to keep all servers at high CPU utilization.
For RocksDB the first experiment uses a single YCSB thread and one database with dataset of 6M records. We enable direct I/O with 2GB block cache. In this experiment we identify the performance and energy characteristics of the core’s architecture with I/O traffic. In the second experiment for RocksDB we run YCSB with multiple threads again with direct I/O. To avoid thread contention and keep utilization high we choose to keep the number of YCSB threads equal to the number of hardware threads for all servers (S1 does not support hardware threads and therefore, this is the number of cores). We use a number of databases equal to half the number of YCSB threads.
Since our interest is CPU behavior, in our experiments we try to maintain similar I/O behavior across servers. For this purpose, we configure the datasets in a manner where the LSM multi-level structure exhibits the same I/O behavior across servers: We use 4 databases and 5M records for S1, 8 databases and 10M records for S2/S3, and 16 databases and 20M records for S4. With these parameters, the number of flushes and compactions for each workload are the same for each server. Finally, we adjust the size of block cache, to fit the same amount of dataset for each server i.e, 2GB for S1, 4GB for S2/S3 and 8GB for S4.
| Workload | |
|---|---|
| A | 50% reads, 50% updates |
| B | 95% reads, 5% updates |
| C | 100% reads |
| D | 95% reads, 5% inserts |
| E | 95% scans, 5% inserts |
| F | 50% reads, 50% read-modify-write |
III-D Power measurements
We measure power for all platforms with a Microchip MCP39F511A Power Monitor Demonstration Board [1]. The Power Monitor is connected right after the power supply unit (PSU), which converts the AC wall socket supply to DC. It reports mean power readings every second. This measures the total power of the board, including CPU, memory, and storage devices. We use the Linux kernel’s perf tool to collect and analyze performance monitor counters (PMC) that are available in all servers. We calculate branch miss ratio, instructions per cycle (IPC), and Last-Level-Cache (LLC) (i.e. L3) miss ratio. We perform our calculation based on reading from the following PMCs: branches, branch misses, instructions, cycles, L3 cache references and L3 cache misses. The ARM-based server S1 has limited set of performance counters and it is does not provide counters for the LLC (L3).
IV Experimental Analysis
In this section we focus our analysis around four main questions:
-
•
Which server architecture is more power efficient?
-
•
Which server architecture achieves the highest absolute throughput?
-
•
Which micro-architectural features (do not) matter?
-
•
Does server performance translate to tail latency benefits?
Next, we discuss each of these in detail.
IV-A Which server architecture is more power efficient?
We measure power efficiency as ops/joule in all servers for both KV stores (Figure 1). Figures 1(a) and 1(c) show the efficiency of each server for Kreon and RocksDB under high utilization, above 80% in all runs shown. First, for both KV stores, we can categorize servers in two groups: S2, S3 and S1, S4. We see that S1 and S4 are more power efficient than S2 and S3 for both KV stores. Compared to servers S2 and S3, S1 executes 1.6-3.6x more ops/joule for Kreon and 1.8-3x more ops/joule for RocksDB. Similarly, compared to S2 and S3, S4 achieves 2.1-2.7x more ops/joule for Kreon and 1.4-2.5x more ops/joule for RocksDB. We note that servers S2, S3 have the same architecture as S4, but differ significantly in fabrication process technology (Table I).
Between S1 and S4 there is greater variance. S4 has both a more aggressive architecture and more recent fabrication process (22nm for S4 vs. 40nm for S1). However, S1 achieves between 0.68-1.47x more ops/joule for Kreon and between 0.96-1.87x for RocksDB. We notice that S1 is better at writes (Load A, Load E) for both KV stores except Load E at Kreon that is slightly worse. Finally, S4 achieves always slightly more operations per joule in scans (Run E).
Figures 1(b) and 1(d) depict ops/joule for the single-threaded experiment (one YCSB thread and one database) for both KV stores. This experiment shows the behavior of a single thread with abundant resources, including shared micro-architectural resources, memory throughput, caches, I/O. We notice that a single thread in server S1 is more power efficient compared to a single thread in server S4 by 1.46-1.86x for Kreon and by 1.03-1.74x for RocksDB.
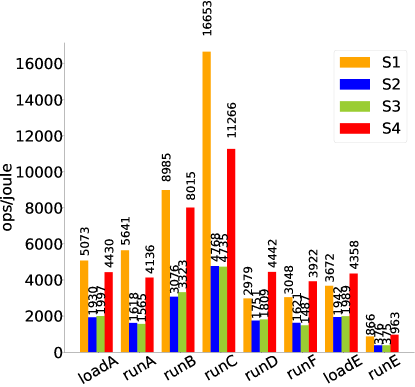


Compared to S2 and S3, S1 exhibits single-thread efficiency (ops/joule) between 1.89-2.55x for Kreon and 1.79-2.81x for RocksDB. Compared to S2 and S3, S4 achieves a single-thread efficiency (ops/joule) between 1.06-1.45x for Kreon and 1.49-2.06x for RocksDB. Therefore, despite its older fabrication process, S1 is more power efficient compared to S2 and S3, than S4.
Finally, between servers S2 and S3 we do not observe any significant differences in ops/joule in both the high-utilization and single-thread experiments. Their CPU architectures are similar, they both have 2 NUMA nodes and they have about the same fabrication process.
Overall, server S1 is better by 0.68-3.6x in terms of ops/joule in all our experiments for both KV stores, despite the fewer resources and older fabrication technology.
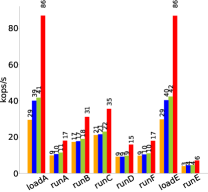
IV-B Which server architecture achieves the highest absolute throughput?
Figures 2(a) and 2(c) show absolute performance expressed in kops/s. We see that servers of different generations exhibit significant differences in performance for KV stores up to 5.3x. In Kreon, S1 exhibits up to 5.3x worse performance (kops/s) compared to S4 and between 1.34-2.0x worse performance compared to S2 and S3. Servers S2 and S3 have approximately the same absolute performance and 2.0-2.7x worse compared to S4. In RocksDB, S1 exhibits 1.75-3.23x fewer kops/s compared to S4 and 1.27-2.2x lower performance compared to S2 and S3. S4 achieves 1.24-2.2x higher performance compared to S2 and S3.
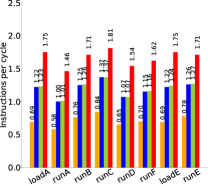
Next, we examine the achieved IPC per core (not per hardware thread). Figure 2(b) shows that IPC follows the same trend as absolute performance across all servers. S4 achieves the highest IPC among all servers in the range of 1.46-2.38, whereas S1 achieves the lowest IPC in the range of 0.64-1.03. If we multiply IPC with the number of cores in each server, we approximately get the same trend as absolute performance.

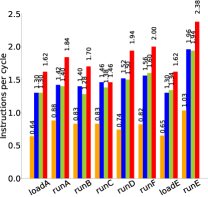

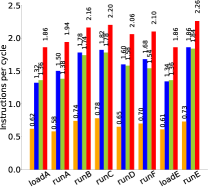
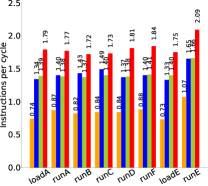
Figure 3(a) captures single thread performance for each server type. It measures absolute performance (ops/s) with a single YCSB thread assigned to one core. We see that a single thread in S1 performs 1.34-1.76x worse than S2, S3. Compared to S4, S1 has 1.9-2.1x lower throughput. Finally, S4 compared to S2, S3, achieves 1.3-1.4x higher throughput. This experiment, with all resources available to one thread, shows (Figure 3(b)) that S1 achieves again the lowest IPC, between 0.73-1.07. Server S4 achieves the highest IPC between 1.72-2.09. We get the same trend across servers, as single thread performance. In comparison in multi-threaded experiments, the differences in absolute performance and IPC between servers decreases, compared to single-thread experiment.

IV-C Which micro-architectural features (do not) matter?
Next, we examine CPU performance counters for several events to identify sources of performance differences. We study branch and L3 cache miss ratios, and the impact of hardware multi-threading, as shown in Figure 4. We perform these measurements for both multi-threaded and single-threaded experiments for each server. Results are averages across all cores.
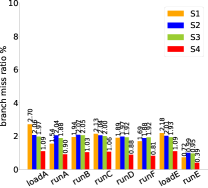
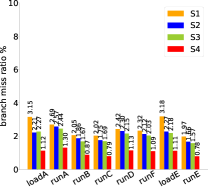
Branch misses
Figures 4(a) and 4(c) show that the branch miss ratio does not exceed 3.18% for all servers and workloads for both KV stores. We observe that S4 has significantly lower branch miss ratio compared to the other servers and in most cases it incurs less than 50% of the misses. However, given the overall low branch miss ratio, this does not contribute significantly to the observed performance differences.
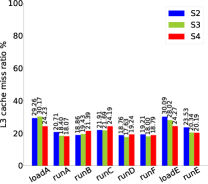
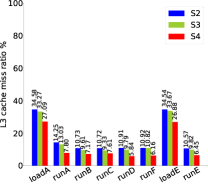
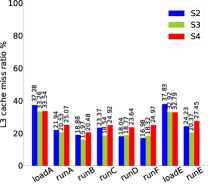
L3 misses
As a note, L3 miss ratio is not available for S1 because of counter limitations on the specific platform. Figures 4(b) and 4(d) show that the L3 miss ratio differs between 1-6% of L3 references across servers, for both Kreon and RocksDB. Although total L3 cache sizes differ across servers, the amount of L3 cache per core is about the same: S1 and S2 have 1 MB/core, whereas S3 and S4 have 1.5 and 1.25 MB/core, respectively, resulting in similar L3 miss ratios.
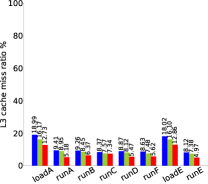
To examine how larger L3 caches and other components contribute to performance, we run the single-threaded experiment, with a single YCSB thread assigned to one core. Figure 5(a) shows that the L3 cache miss ratio differs up to 6% of all L3 cache references among all servers for both KV stores. This difference is similar to multi-threaded runs (Figures 4(b) and 4(d)), although in this case the per core L3 size differs significantly across servers. Therefore, L3 cache size does not contribute significantly to performance.
Hardware multi-threading
S1 supports a single hardware thread per-core while S2, S3, and S4 have hyper-threading and thus they provide two hardware threads per-core. We perform the experiment of Figure 2(a) with hyper-threading disabled. We find that servers S2 and S3 perform 1.22-1.31x fewer kops/s, compared to the same experiment with hyper-threading enabled, whereas S4 performs 1.15-1.22x fewer kops/s. Similarly, IPC with hyper-threading disabled, has a drop of 1.22-1.34x and 1.16-1.29x for servers S2/S3 and S4 respectively. This shows that using twice the number of hardware threads (hyper-threading) only increases performance between 1.15-1.34x across all cases.
Memory throughput
DRAM throughput affects IPC. Tbale II shows that S1 has 2.5x lower maximum memory throughput than S2, S3 and 7x lower maximum memory throughput than S4. The differences are smaller for the maximum memory throughput observed by a single thread.
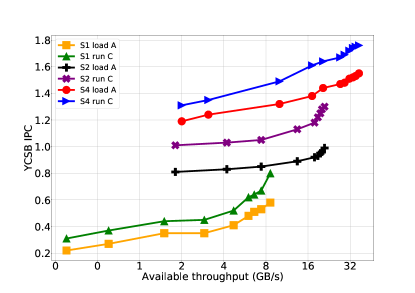
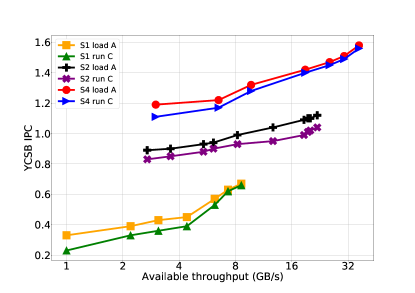
To examine how memory throughput affects KV store performance, we create one microbencmark which can consume a specific amount of memory throughput. We run, for both KV stores, four YCSB threads concurrently with four threads of our microbenchmark, each of them pinned to one physical core. We choose four threads because this is the minimum number of threads that can consume the total memory throughput. In every run we decrease the throughput consumed by our microbenchmark to increase the available throughput for Kreon and RocksDB. Figure 6 shows the resulting IPC for four YCSB threads running Load A and Run C. In all cases we achieve better IPC when available memory throughput increases. Overall, all systems can benefit from higher memory throughput than the currently provisioned 2.1, 5.4, 9.1 GB/s/core for S1, S2, and S4 respectively.
IV-D Does server performance translate to tail latency benefits?
To capture how tail latency deteriorates as load increases, we increase the number of application threads per hardware threads on each server from 1-to-1 up to 8-to-1. We also examine lower and higher loads, but we find this range to be representative. Figure 7 shows the average and tail latency for S1 and S4 and two workloads, Load A and Run C, for both Kreon and RocksDB. We use only S1 and S4 because these two server types exhibit the largest difference in performance. For Kreon we focus on in-memory KV store performance, where the server and CPU type has the highest impact. For this reason, we use 3M keys in Load A for both S1 and S4, where they fit in memory in both servers. Then, for Run C we run a larger number of get operations to extend the execution time to 5 minutes on each server and obtain reliable 99.9% tail latency measurements.
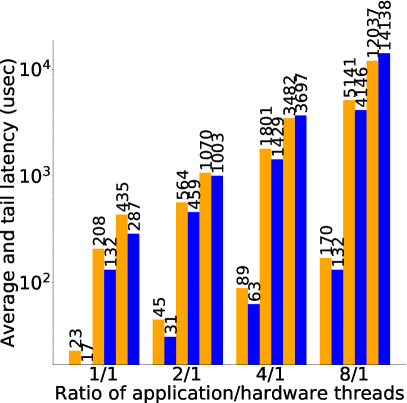
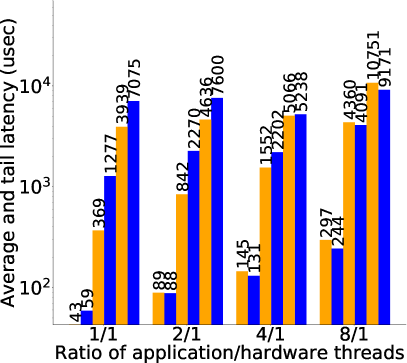
In Figures 7(a) and 7(b), we see that average response time differs as follows: S4 has slightly lower average latency compared to S1 for Load A. More specifically, S4 average response time is 17 s, compared to 23 s. In Run C however, S1 and S4 have almost the same average latency 8s for S1 vs. 9s for S4. We notice that as load increases, tail latency deteriorates significantly for both workloads and both servers, to hundreds of times compared to average latency at high load. In Load A, tail latency becomes up to 107x worse (S4, 8-to-1 99.9%), whereas in Run C, tail latency becomes up to 626x worse (S1, 4-to-1, 99.9%) compared to average latency in the same run. We also observe that generally, tail latency deteriorates in a similar manner on both servers, without one of the two servers exhibiting worse behavior compared to the other.
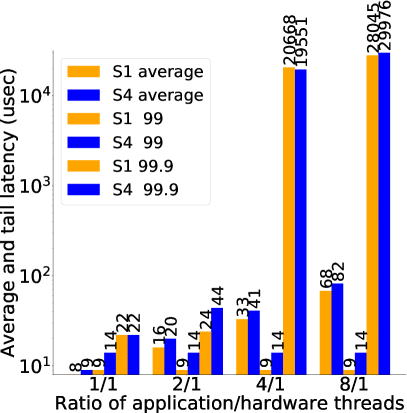
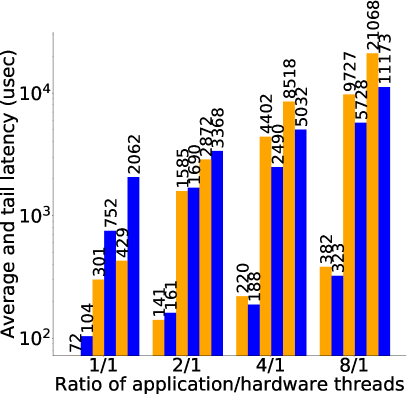
For RocksDB we run two different experiments. In the first experiment, we examine the performance of RocksDB with I/O traffic. For both Load A and Run C, we use the same dataset size as in the multi-threaded experiment (5M keys for S1 and 20M keys for S4). As we use a 4x larger dataset in S4 we also use a 4x larger user-space block cache (2GB for S1 and 8GB for S4) in combination with direct I/O to bypass the Linux kernel buffer cache. For Run C, we use a number of operations (gets) required for 5 minute run for all cases. Figure 7(c) shows for Load A that in all cases (except 1-to-1) S4 has slightly better average latency compared to S1. In the case of 1-to-1, S4 has an average latency of 59 s compared to 43 s for S1. Figure 7(d) shows for Run C that when we have low load (1-to-1 and 2-to-1) S1 has better latency time compared to S4. In case of high load (4-to-1 and 8-to-1) S4 becomes better compared to S1. We observe that as the load is increased further, tail latency also increases for both S1 and S4, for both workloads (Load A and Run C). Specifically, in Load A, tail latency becomes up to 120x worse (S4, 1-to-1, 99.9%), whereas in Run C, tail latency increases up to 55x (S1, 8-to-1, 99.9%) compared to average latency.
Next we examine how the size of the block cache affects the average and tail latency. We provide results only for Run C, as for loads RocksDB bypasses the block cache. We use the same setup as in the first experiment, and only show the case with high load (8-to-1). We keep the ratio of dataset to block cache size the same for both S1 and S4. We start with the block cache disabled and then increase its size as follows: 512MB/2GB, 1GB/4GB and 2GB/8GB, for S1/S4 respectively.
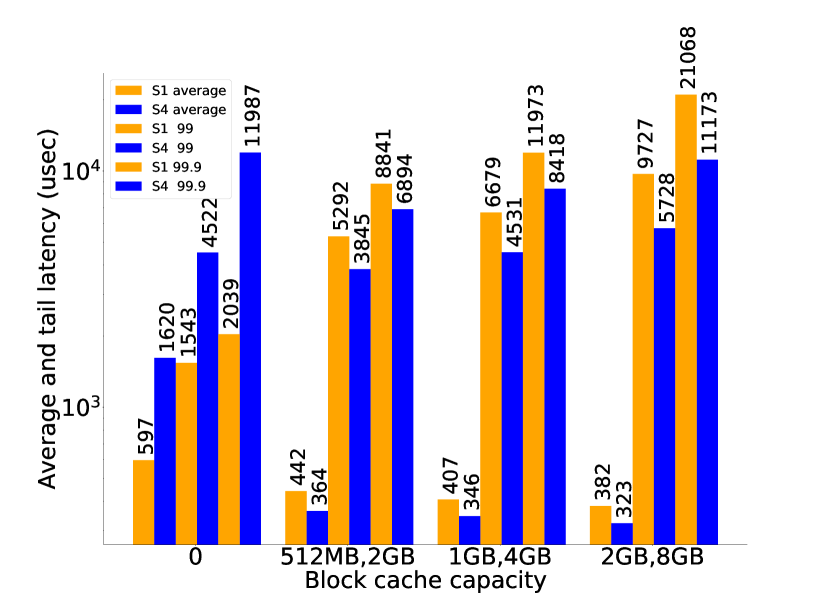
Figure 8 shows the results of this experiment. When there is no block cache, S1 is much better and up to 5.9x compared to S4 for both average and tail latencies. In this case we observe that the average disk queue depth is 254 for S4 and 10 for S1. As S4 has faster CPU compared to S1, it also processes requests and sends them to the device at a higher rate. This results in more pressure to the device and higher average and tail latencies.
Finally, as we increase the size of the block cache, both S1 and S4 achieve better average and worse tail latencies. Increasing the size of the block cache means that a larger part of the dataset fits in the cache, resulting in lower average latency (higher hit ratio). However, a larger cache also results in slower hits, misses and evictions, which increase the tail latency. The average latencies of S1 are slightly worse compared to S4, with the a difference of 1.21x when the block cache ratio is 512MB/2GB (S1/S4). In this case, the average latency of S1 is 442 s vs. 364 s for S4. By increasing the block cache size, S1 always has higher tail latency compared to S4, up to 1.88x for a block cache ratio of 2GB/8GB for 99.9%.
V Conclusions
Persistent KV stores are an important component for modern software stacks in the data center. In this work we provide an extensive power/performance evaluation for persistent KV stores. We examine how the processor micro-architecture and memory hierarchy affect data serving systems. We use four server types and two different KV stores (Kreon [21] and RocksDB) to measure power efficiency and absolute performance.
A microserver (S1) results in 1.6-3.6x better power efficiency compared to an x86 server with the same fabrication technology (S2). S1 is up to 1.87x more power efficient compared to S4, a more powerful server of newer process technology (22nm vs. 40nm). Although all processors have similar CPU clocks, servers with more cores result in higher performance. S4, with 2x more physical cores from S1 and hyper-threading enabled, achieves up to 5.3x more operations per second than S1. All of these come with small impact in tail latency. Our analysis shows that architectural features such as aggressive branch predictors, large caches, and hyper-threading do not provide significant benefits in performance. The most significant performance benefit comes from better memory throughput.
Acknowledgements
We thankfully acknowledge the support of the European Commission through the H2020 project EVOLVE (GA825061). We would like also to thank Michalis Flouris for his help with access to the ARM server. Anastasios Papagiannis is also supported by the Facebook Graduate Fellowship.
References
- [1] Mcp39f511a power monitor demonstration board. https://www.microchip.com/DevelopmentTools/ProductDetails/adm00667.
- [2] David G. Andersen, Jason Franklin, Michael Kaminsky, Amar Phanishayee, Lawrence Tan, and Vijay Vasudevan. Fawn: A fast array of wimpy nodes. In Proceedings of the ACM SIGOPS 22Nd Symposium on Operating Systems Principles, SOSP ’09, pages 1–14, New York, NY, USA, 2009. ACM.
- [3] Apache. Cassandra. http://cassandra.apache.org/. Accessed: .
- [4] Apache. Hbase. https://hbase.apache.org/. Accessed: .
- [5] Rafael Vidal Aroca and Luiz Marcos Garcia Gonçalves. Towards green data centers: A comparison of x86 and arm architectures power efficiency. Journal of Parallel and Distributed Computing, 72(12):1770–1780, 2012.
- [6] Emily Blem, Jaikrishnan Menon, and Karthikeyan Sankaralingam. Power struggles: Revisiting the risc vs. cisc debate on contemporary arm and x86 architectures. In High Performance Computer Architecture (HPCA2013), 2013 IEEE 19th International Symposium on, pages 1–12. IEEE, 2013.
- [7] Fay Chang, Jeffrey Dean, Sanjay Ghemawat, Wilson C Hsieh, Deborah A Wallach, Mike Burrows, Tushar Chandra, Andrew Fikes, and Robert E Gruber. Bigtable: A distributed storage system for structured data. ACM Transactions on Computer Systems (TOCS), 26(2):4, 2008.
- [8] B. F. Cooper. Core workloads. https://github.com/brianfrankcooper/YCSB/wiki/Core-Workloads. 2018.
- [9] Giuseppe DeCandia, Deniz Hastorun, Madan Jampani, Gunavardhan Kakulapati, Avinash Lakshman, Alex Pilchin, Swaminathan Sivasubramanian, Peter Vosshall, and Werner Vogels. Dynamo: amazon’s highly available key-value store. In ACM SIGOPS operating systems review, volume 41, pages 205–220. ACM, 2007.
- [10] Facebook. Rocksdb. http://rocksdb.org/, 2018.
- [11] Michael Ferdman, Almutaz Adileh, Onur Kocberber, Stavros Volos, Mohammad Alisafaee, Djordje Jevdjic, Cansu Kaynak, Adrian Daniel Popescu, Anastasia Ailamaki, and Babak Falsafi. Clearing the clouds: A study of emerging scale-out workloads on modern hardware. In Proceedings of the Seventeenth International Conference on Architectural Support for Programming Languages and Operating Systems, ASPLOS XVII, pages 37–48, New York, NY, USA, 2012. ACM.
- [12] Google. Leveldb. http://leveldb.org/, 2018.
- [13] Vasileios Kontorinis, Liuyi Eric Zhang, Baris Aksanli, Jack Sampson, Houman Homayoun, Eddie Pettis, Dean M Tullsen, and Tajana Simunic Rosing. Managing distributed ups energy for effective power capping in data centers. In 2012 39th Annual International Symposium on Computer Architecture (ISCA), pages 488–499. IEEE, 2012.
- [14] Chunbo Lai, Song Jiang, Liqiong Yang, Shiding Lin, Guangyu Sun, Zhenyu Hou, Can Cui, and Jason Cong. Atlas: Baidu’s key-value storage system for cloud data. In Mass Storage Systems and Technologies (MSST), 2015 31st Symposium on, pages 1–14. IEEE, 2015.
- [15] Harold Lim, Aman Kansal, and Jie Liu. Power budgeting for virtualized data centers. In 2011 USENIX Annual Technical Conference (USENIX ATC’11), volume 59, 2011.
- [16] Dumitrel Loghin, Bogdan Marius Tudor, Hao Zhang, Beng Chin Ooi, and Yong Meng Teo. A performance study of big data on small nodes. Proc. VLDB Endow., 8(7):762–773, February 2015.
- [17] John D. McCalpin. Memory bandwidth and machine balance in current high performance computers. IEEE Computer Society Technical Committee on Computer Architecture (TCCA) Newsletter, pages 19–25, December 1995.
- [18] Patrick O’ Neil, Edward Cheng, Dieter Gawlick, and Elizabeth O’ Neil. The log-structured merge-tree (lsm-tree). Acta Informatica, 33(4):351–385, 1996.
- [19] Zhonghong Ou, Bo Pang, Yang Deng, Jukka K Nurminen, Antti Yla-Jaaski, and Pan Hui. Energy-and cost-efficiency analysis of arm-based clusters. In Proceedings of the 2012 12th IEEE/ACM International Symposium on Cluster, Cloud and Grid Computing (ccgrid 2012), pages 115–123. IEEE Computer Society, 2012.
- [20] Anastasios Papagiannis, Giorgos Saloustros, Pilar González-Férez, and Angelos Bilas. Tucana: Design and implementation of a fast and efficient scale-up key-value store. In USENIX Annual Technical Conference, pages 537–550, 2016.
- [21] Anastasios Papagiannis, Giorgos Saloustros, Pilar González-Férez, and Angelos Bilas. An efficient memory-mapped key-value store for flash storage. In Proceedings of the ACM Symposium on Cloud Computing, SoCC ’18, pages 490–502, New York, NY, USA, 2018. ACM.
- [22] Nikola Rajovic, Lluis Vilanova, Carlos Villavieja, Nikola Puzovic, and Alex Ramirez. The low power architecture approach towards exascale computing. Journal of Computational Science, 4(6):439–443, 2013.
- [23] Jinglei Ren. Ycsb-c. https://github.com/basicthinker/YCSB-C, 2016.
- [24] Seagate. Data age 2025. https://www.seagate.com/www-content/our-story/trends/files/Seagate-WP-DataAge2025-March-2017.pdf. Accessed: .
- [25] Yevgenly Sverdlik. Paypal deploys arm servers in data centers. https://www.datacenterknowledge.com/archives/2015/04/29/paypal-deploys-arm-servers-in-data-centers. April 29, 2015.